

Abstract
The neural correlates of specific brain functions such as visual orientation tuning and individual finger movements can be revealed using multivoxel pattern analysis (MVPA) of fMRI data. Neurofeedback based on these distributed patterns of brain activity presents a unique ability for precise neuromodulation. Recent applications of this technique, known as decoded neurofeedback, have manipulated fear conditioning, visual perception, confidence judgements and facial preference. However, there has yet to be an empirical justification of the timing and data processing parameters of these experiments. Suboptimal parameter settings could impact the efficacy of neurofeedback learning and contribute to the ‘non-responder’ effect. The goal of this study was to investigate how design parameters of decoded neurofeedback experiments affect decoding accuracy and neurofeedback performance. Subjects participated in three fMRI sessions: two ‘finger localizer’ sessions to identify the fMRI patterns associated with each of the four fingers of the right hand, and one ‘finger finding’ neurofeedback session to assess neurofeedback performance. Using only the localizer data, we show that real-time decoding can be degraded by poor experiment timing or ROI selection. To set key parameters for the neurofeedback session, we used offline simulations of decoded neurofeedback using data from the localizer sessions to predict neurofeedback performance. We show that these predictions align with real neurofeedback performance at the group level and can also explain individual differences in neurofeedback success. Overall, this work demonstrates the usefulness of offline simulation to improve the success of real-time decoded neurofeedback experiments.
Keywords: fMRI, Neurofeedback, Multi-voxel pattern analysis, Simulation, Sensorimotor cortex
1. Introduction
Multi-voxel pattern analysis (MVPA) extracts information about a person’s cognitive state by analyzing spatially distributed patterns of functional MRI activity (Lewis-Peacock and Norman, 2014; Haxby et al., 2014). This approach has become ubiquitous in cognitive neuroscience since the seminal work of Haxby et al. (2001) identified distributed and overlapping representations of visual object categories in temporal cortex. MVPA is especially useful for isolating fine-grained relationships between brain activity and behavior, such as orientation tuning (Kamitani and Tong, 2005; Haynes and Rees, 2005) and complex motor programs (Wiestler and Diedrichsen, 2013; Kornysheva and Diedrichsen, 2014) which are inaccessible to other human neuroimaging analysis methods. However, despite the increased signal-detection sensitivity of MVPA, conventional neuroimaging research is limited in its ability to draw causal inferences about brain-behavior relationships.
Investigation into causal mechanisms of MVPA representations of neural activity requires this activity to be modulated. However, techniques such as TMS (Walsh and Cowey, 2000) and tDCS (Brunoni et al., 2012) are incapable of modulating fine-grained patterns of neural activity. Operant conditioning of neural activity, known as neurofeedback, uniquely enables self-modulation of a target neural circuit through feedback, most often presented visually (Sulzer et al., 2013; Sitaram et al., 2017). Early work in fMRI neurofeedback mirrored contemporary univariate techniques in offline fMRI analysis (Ruiz et al., 2014). In recent years, MVPA-based neurofeedback techniques have taken hold (LaConte et al., 2007). For instance, a seminal work by Shibata et al. (2011) used neurofeedback based on decoded activity from early visual cortex, a process dubbed ‘decoded neurofeedback’ or ‘DecNef’. The researchers were able to show that individuals could learn to self-modulate a targeted pattern of brain activity related to a given orientation of a visual grating without stimulus presentation. Intriguingly this was associated with heightened perceptual acuity specific to the underlying stimulus. Thus, used in this manner, decoded neurofeedback is a powerful and unique tool in neuroscience that can manipulate neural activity patterns to reveal causal relationships with behavior. In addition to further studies investigating low-level visual perception (Amano et al., 2016), this technique has been used in more translational applications including fear conditioning (Koizumi et al., 2017), fear reduction (Taschereau-Dumouchel et al., 2018), confidence judgements (Cortese et al., 2016), and facial preference (Shibata et al., 2016).
It is well-known that a large proportion (up to 30%) of willing participants are unable to self-regulate their brain activity through neurofeedback training (Allison and Neuper, 2010; Hammer et al., 2012). The causes of this are not well understood, and the ‘non-responder’ problem remains a key challenge for neurofeedback research and clinical translation. While the non-responder effect is described as a participant’s inability to control a reliable feedback signal, we suggest that the reliability of the feedback signal itself is a larger problem. Indeed, our previous work showed how properties of the feedback signal can significantly affect decoded neurofeedback performance using a novel simulation paradigm (Oblak et al., 2017). Using feedback based on simulated brain activity in visual cortex, participants performed simple ‘cognitive strategies’ by choosing how to rotate an oriented grating clockwise or counterclockwise until a hidden target orientation was found. This simulation paradigm enabled the manipulation of ‘neurofeedback’ provided to the participant to reflect the signal quality and timing of realistic neural activity, and of unrealistic neural activity that would be impossible to present in the scanner by altering or removing the hemodynamic delay. Therefore we could link explicit strategy choices, and thus neurofeedback performance, with the characteristics of the feedback signal received. The approach produced insights into how fMRI neurofeedback presentation can enhance or inhibit learning; for example, intermittent feedback is better than continuously presented feedback when participants have a poor understanding of the hemodynamic properties of the brain signal. However, these simulations did not account for a key element in neurofeedback performance as it relates to decoded neurofeedback: the accuracy of decoding the desired fMRI activity patterns in real-time.
Decoding accuracy can vary widely between experiments and conditions. Standard processing techniques, such as normalization, detrending and averaging over time will all affect decoding accuracy (Hanke et al., 2009). However, to date there has been no systematic approach to investigating the effects of these parameters on neurofeedback performance. Numerous decoded neurofeedback studies lack an empirical justification for parameter selection (Watanabe et al., 2017), leaving the possibility of suboptimal neurofeedback training, which may contribute to the non-responder problem. The goal of the present study was to examine how real-time fMRI decoding accuracy is affected by these parameters, and likewise, how decoder accuracy contributes to neurofeedback performance.
Being able to address this question in a systematic manner requires explicit knowledge of neurofeedback strategies being used by participants. However, cognitive strategies used for neurofeedback, which commonly take the form of mental imagery (deCharms et al., 2005), can be difficult to identify and quantify. Here, we simplified this challenge by focusing on a restricted set of explicit strategies: individual finger movements, which are supported by neural correlates in primary sensorimotor cortex (M1/S1). There is ample literature on fMRI neurofeedback of mean regional activity in M1/S1 (Yoo and Jolesz, 2002; Weiskopf et al., 2004; Chiew et al., 2012; Friesen et al., 2017), and evidence that univariate M1/S1 self-modulation is associated with improvements in fine-motor control. For instance, Bray et al. (2007) found improved reaction time following M1/S1 neurofeedback training, and Blefari et al. (2015) observed a positive correlation between precision grip motor skill and neurofeedback performance. There are, however, no published attempts at decoded neurofeedback for M1/S1. Thus, by using a well-defined neural circuit (M1/S1) and measurable strategies (finger pressing), we sought to gain insight more generally into how people learn to use decoded neurofeedback, and under what conditions such learning is best facilitated.
Here, we designed a ‘finger localizer’ experiment based on previous finger individuation decoding experiments (e.g. [Diedrichsen et al. (2012), Ejaz et al. (2015)) that could be used to train fMRI pattern classifiers for a neurofeedback experiment (Fig. 1). We had participants (N = 6) complete two of these localizer sessions, on separate days, which allowed us to investigate multiple parameters that impact real-time decoding performance in M1/S1. We first simulated participant neurofeedback performance using feedback yoked to individual localizer trials. This fully automated simulation helped us examine estimated neurofeedback performance in different conditions such as changes in region-of-interest (ROI) and different feedback success thresholds. Then, we recruited a new set of human participants (N = 10) to perform this target-finding experiment with the same yoked neurofeedback and compared performance to participants in a real neurofeedback session. The combined simulation and experimentation provide a unique method for investigating fundamental questions about neurofeedback. The results may help to mitigate the non-responder problem, making decoded neurofeedback a more robust procedure.
Fig. 1. Experimental design.
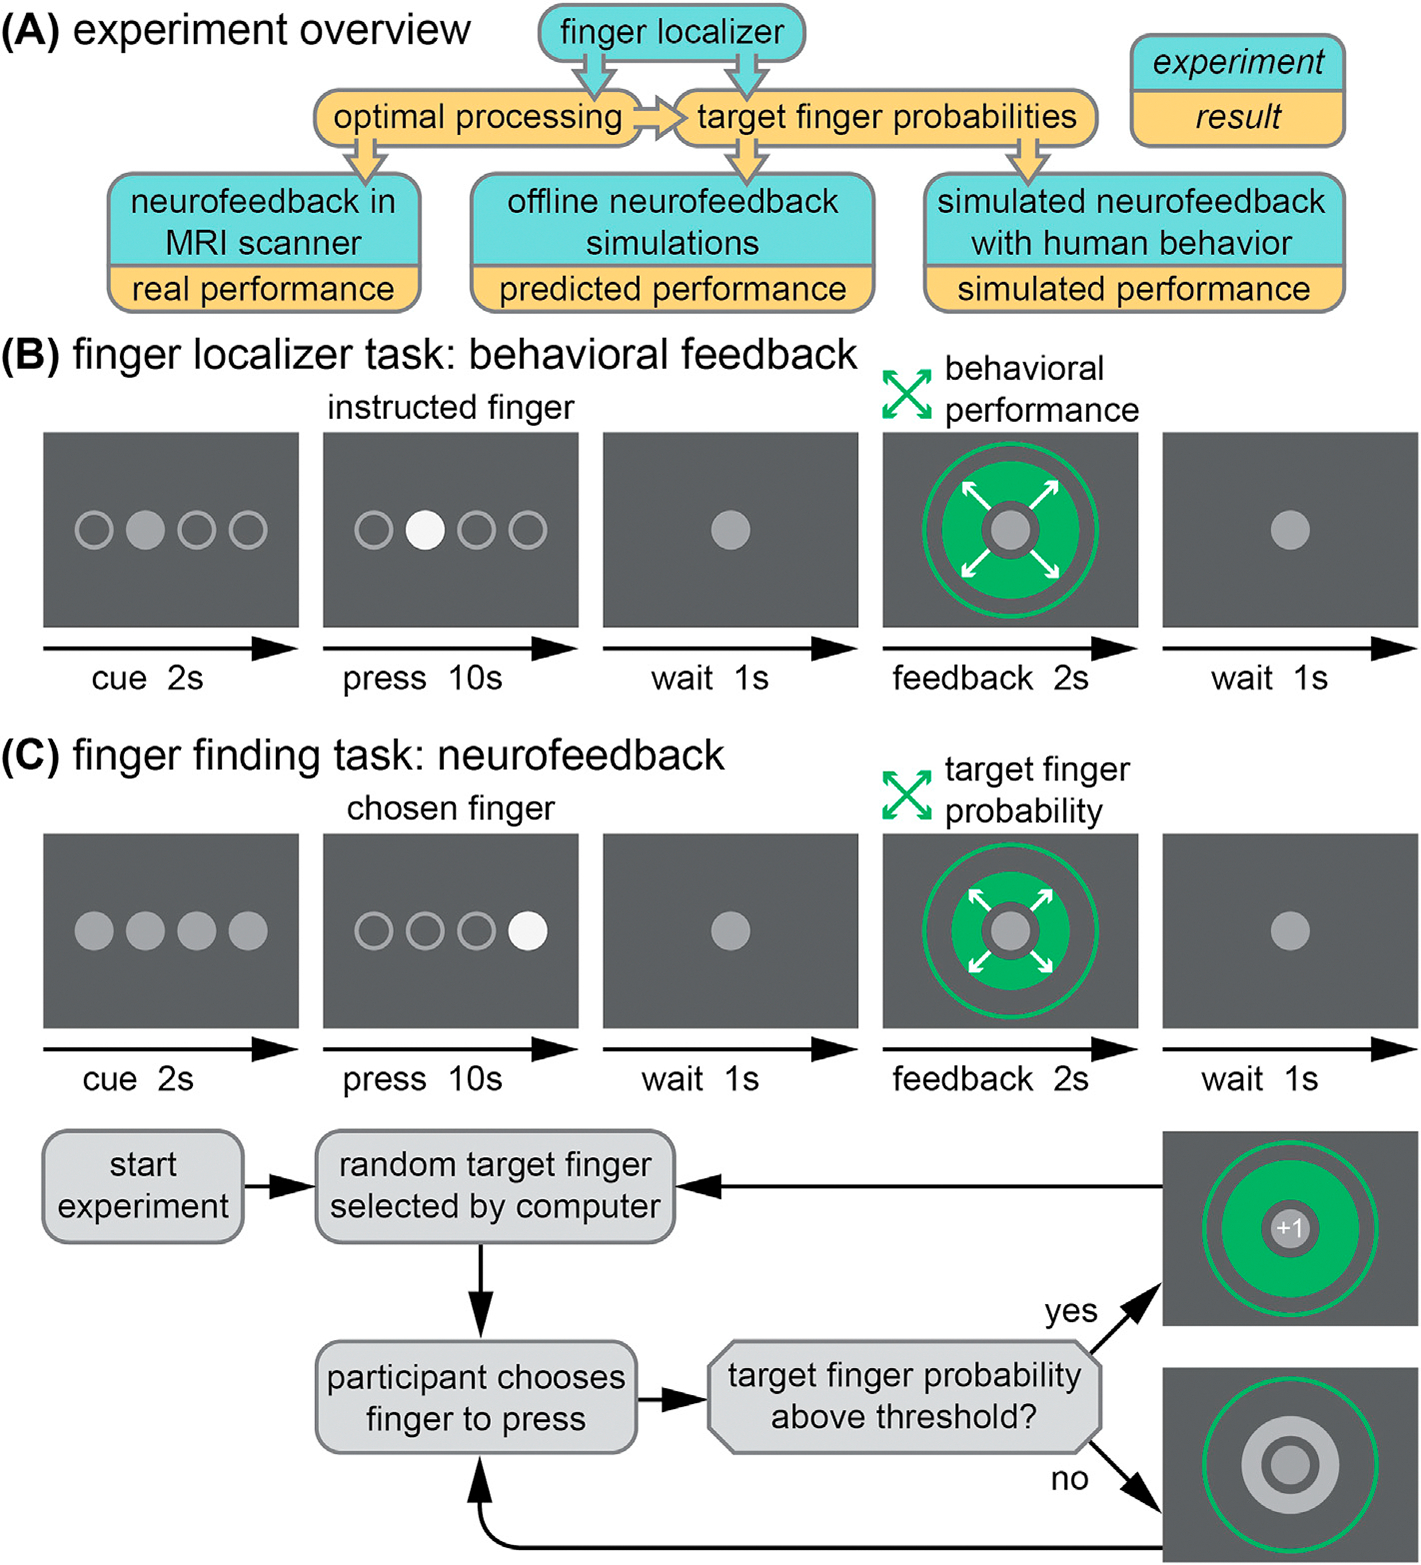
(A) A finger localizer experiment was used to identify optimal processing parameters for real neurofeedback and to generate finger probabilities for use in simulated neurofeedback experiments. In both localizer (B) and neurofeedback (C) trials, a cue precedes a 10 s period of finger pressing at 1 Hz, followed by feedback. The localizer feedback reflects behavioral performance for repeated presses of a finger chosen by the experimenter. The neurofeedback reflects the real-time fMRI decoder output for the target finger based on presses of a finger chosen by the participant. Below, the decision process for advancing trials in the neurofeedback session is presented. The target finger remains the same from trial to trial until a predetermined success threshold is reached, at which point a new random target finger is selected.
2. Materials and methods
2.1. Participants
Six healthy participants (2 female, average age 26.4 years, SD = 2.4) were recruited from the University of Texas at Austin community in accordance with the University of Texas Institutional Review Board. This sample size is in accordance with other individual finger mapping tasks (Ejaz et al., 2015). All subjects completed two localizer sessions, but one subject was unable to participate in the neurofeedback session due to a hand injury that occurred after the second localizer session. An additional ten healthy participants (3 female, average age 24.3, SD = 3.6) were recruited for a simulated neurofeedback experiment using the brain data from the localizer sessions of the original group of participants. Written informed consent was obtained from all participants.
2.2. General procedure
The experiment consisted of three fMRI sessions separated by at least 24 h: two localizer sessions followed by one neurofeedback session. The localizer and neurofeedback sessions were similar in structure, as shown in Fig. 1. The primary purpose of two localizer sessions was to identify the fMRI activity patterns in sensorimotor cortex corresponding to pressing each of the four fingers of the right hand (index, middle, ring, little). However, the secondary purpose of the localizer was to imitate the timing and processing limitations of a real-time fMRI neurofeedback session. Therefore, the duration of trials and runs were identical in both types of sessions, with both consisting of 8 fMRI runs. These finger-specific activity patterns identified in the localizer were used as targets in the neurofeedback session.
Each run began with a 40 s baseline period, in which only a grey fixation circle was visible (diameter: 1.5° of visual angle). During the final 3 s of the baseline period, the fixation circle flashed white at 1 Hz to indicate the beginning of trials. Each run consisted of 20 trials of 16 s each: 2 s to cue the target finger, 10 s of finger presses, 1 s of rest, 2 s of feedback, and 1 s of rest before the next trial. On each trial, four circles appeared in the center of the screen (corresponding to the four fingers; 1.5° each, spanning 10° horizontally total) and were used to coordinate finger presses. In the cue period of the localizer task, only one circle turned grey indicating that this was the finger to be pressed on the trial. In the neurofeedback task, all circles turned grey indicating that the participant should choose one finger to press for the duration of that trial. Then, finger presses were cued at a rate of 1 Hz for 10 s with a filled white circle corresponding to the cued (localizer) or selected (neurofeedback) finger.
To ensure consistent behavior from participants, we encouraged rhythmic presses. Participants received positive visual feedback if presses occurred within a specific response window (200–500 ms) of each 1-sec epoch during the 10-sec pressing period. This response window was dynamically adjusted during the localizer sessions (see Section 2.3 for details), but remained constant for the neurofeedback session. The cued (or chosen) finger was filled in with a color corresponding to a participant’s performance on that press, beginning when the finger was pressed and ending at 800 ms into the 1-sec press epoch. Presses that occurred inside the response window filled the pressed finger’s circle green, and presses that were either too fast or too slow filled the circle yellow. If the incorrect (or unchosen) finger was pressed, the correct finger’s circle filled red. After a brief 1-sec wait period, trial-ending visual feedback appeared as a centrally presented green circle (2–10°) that expanded or contracted based on performance during the preceding 10-sec pressing period. In the localizer session, feedback was based on the rhythmicity of presses on that trial (i.e., the proportion of presses made within the desired response window). In the neurofeedback session, feedback was based on the correspondence between the pattern of fMRI activity for the target finger learned by the classifier during the localizer sessions, and the actual real-time pattern of fMRI activity evoked by the chosen finger on that trial. On the first trial, the feedback circle expanded smoothly from the origin to a diameter corresponding to the feedback value. At each subsequent trial, the feedback circle expanded or contracted over 500 ms from the previous diameter to the updated diameter to ensure a smooth visual display. When the feedback on a neurofeedback trial exceeded the target found’ success threshold, the starting point for feedback on the next trial was reset to zero and a new target was selected (see Section 2.4 and Fig. 1C).
2.3. Localizer sessions (Days 1 and 2)
As stated earlier, the purpose of localizer sessions was to identify the fMRI activity patterns in sensorimotor cortex corresponding to pressing each of the four fingers of the right hand (index, middle, ring, little). The general task procedures for the localizer task are described above. All participants completed two localizer sessions separated by no more than 7 days (5 ± 2 days, mean ± s.d.). In each session, the 8 fMRI runs consisted of 20 total trials, with 5 trials for each of the 4 fingers. The order of trials was pseudorandomized to ensure an approximately equal number of each finger transitions (including pressing the same finger two trials in a row). Both localizer sessions were identical other than the order of button presses. As described above, we encouraged rhythmic presses by providing visual feedback (color-filled circles) for each finger press based on whether it was made within a desired response window (200–500 ms). In the localizer task, one ‘point’ was awarded for each correct response made within this window. Points were tallied at the end of each trial and mapped onto the green feedback circle, with 0 points corresponding to the minimum circle diameter and 10 points corresponding to the maximum diameter. The total score was also tallied and presented to participants at the end of each run. To control for task difficulty, an adaptive staircase procedure was used to incrementally adjust the rewarded response-time window based on performance after each trial. A threshold of 70% correct responses (7 points) was selected for staircasing. If this threshold was exceeded (8 or more points), then the upper limit of the time window decreased by 20 ms (i.e., to 480 ms), making the task slightly harder. If performance was below this threshold (6 or fewer points), then the upper limit of the window increased by 20 ms (i.e., to 520 ms), making the task slightly easier. If performance matched this threshold, no changes were made to the response window.
Participants were instructed to gain as many points as possible by pressing the cued finger during the correct response window, and that the size of the circle at the end of each trial would represent the proportion of presses within that response window. Participants were allowed to perform a small number of trials (10) to understand the approximate response window before performing the task inside the scanner.
2.4. . Neurofeedback session (Day 3)
The purpose of the neurofeedback session was to investigate whether human participants could efficiently and accurately interpret fMRI decoder outputs related to pressing the four fingers of the right hand on a trial-by-trial basis. As such, the participant’s goal was to respond to the decoded neurofeedback by finding and then pressing with the finger associated with the targeted brain pattern (i.e. ‘target finger’). Participants had 160 trials (20 trials per run, 8 runs total) to find as many target fingers as possible. A series of target fingers was pseudo-randomly generated for the experiment. A full set of 160 targets was generated in the unlikely case that a target was found each trial. The order of targets was determined by a concatenation of 20 lists that each contained a randomly shuffled arrangement of 8 finger targets (2 for each finger). This allowed for the target finger to occasionally repeat and to prevent prediction of the target finger (e.g. by process of elimination over a series of targets). Participants chose one finger to press each trial. After 10 presses of the same finger, the feedback circle appeared, as in the localizer sessions, except that here the size of the circle corresponded to the fMRI decoder output for the target finger in sensorimotor cortex (M1+S1, see Section 2.7). The decoder outputs (from 0 to 1, for each finger) indicated the likelihood estimates from the fMRI pattern classifier that the fingers were pressed. The minimum diameter of the feedback circle corresponded to 0% probability of the target finger, and the maximum diameter corresponded to 100% probability (Fig. 1C). If the participant had been pressing the target finger during the trial, its output value should be relatively high. Note that the target output could also be spuriously high when a different finger is pressed if the data on that trial is particularly noisy or the decoder performs poorly in general. If the output exceeded a chosen threshold (50% probability), the feedback circle turned green and a ‘+1’ text appeared in the fixation circle, indicating that a target had been reached and a new random target would be selected. If the decoder output for the target finger was below the chosen threshold, the feedback circle appeared grey and the target remained for the next trial. The total score (number of targets reached) was tallied and presented to participants at the end of each run. If the current target was not reached by the end of a run, that target was continued at the beginning of the next run.
Participants were informed of the experimental paradigm: that a random target finger would be selected, and that they had to choose a finger to press rather than being cued to a specific one. If the computer calculated that their selection was correct, the circle would be large and green with a ‘+1’ and a new random target finger would be selected. If the computer calculated that their selection was incorrect, the circle would be smaller and grey and the same target finger would remain. Participants were instructed to find as many targets as possible to maximize their score. They were also told that the computer was making decisions based on their real-time brain activity, which may not always be accurate, and thus they may need to guess the same finger again even if the circle was grey when they previously selected it. They were informed that the relative size of the circle represented the confidence of the computer. Participants were allowed to perform a small number of trials (10) of the task outside of the scanner using simulated neurofeedback (see Section 2.11 for details) to confirm that they understood the task.
2.5. Apparatus
Finger presses were recorded from the index, middle, ring, and little fingers of the right hand using a four-button box (Current Designs, Philadelphia, PA). The button box was affixed to a wooden board, which lay on the participant’s lap. Sandbags were placed under the right arm according to participant comfort in the first localizer session, and placed in the same position during the second and third sessions. Participants received visual instructions and visual feedback through a back-projection screen, driven by Python and PsychoPy (Peirce, 2007) running on a MacBook Pro.
2.6. fMRI acquisition
Participants were scanned in a Siemens Skyra 3T scanner with a 32-channel head coil. For all fMRI sessions, the same EPI sequence was used (TR = 2 s; 36 slices; in-plane resolution 2.3 × 2.3 mm; 100 × 100 matrix size; 2.15 mm slice thickness; 0.15 mm slice gap; 2x multiband factor). Each fMRI run consisted of 180 vol (TRs), with 3 dummy TRs acquired before each run to allow for steady-state magnetization. After auto-alignment to the AC-PC plane, a manual adjustment was performed to ensure full coverage of the motor cortex. The same manual adjustment parameters were applied to the subsequent localizer and neurofeedback sessions. A high-resolution T1-weighted anatomical image (MEMPRAGE; FoV 256 mm (256 × 256 matrix), 176 sagittal slices; in-plane resolution 1 × 1mm; 256 × 256 matrix size; 1 mm slice thickness; TR = 2530 ms; TE = 1.64/3.5/5.36/7.22) was also acquired during the first localizer session. To collect real-time fMRI data, a high-performance GPU was installed in the Measurement And Reconstruction System (MARS) that handles image reconstruction; this dedicated hardware speeds reconstruction times by more than a factor of ten. From there, the raw images are immediately sent via a 10 Gb/s fiber link that runs directly from the MARS to the analysis workstation (a Dell Precision T7600n, with dual eight-core E5–2665 2.4 GHz processors, 64 GB 1600 MHz registered ECC memory). Data is then transformed into a standard NIFTI imaging file format for preprocessing, registration, and MVPA analysis using custom Python software (Instabrain; https://github.com/LewisPeacockLab/instabrain).
2.7. Regions-of-Interest
Regions-of-Interest (ROIs) within sensorimotor cortex were identified using a Freesurfer (Dale et al., 1999) segmentation of the high-resolution MEMPRAGE image. Four regions were used as the basis for ROI analysis: Brodmann areas 4a, 4p, 3a, and 3b. All masks were generated simultaneously in each participant’s functional space using Freesurfer’s mri_label2vol to ensure that each functional voxel was assigned to only one of the regions. These masks were then combined into the left primary motor cortex (M1: combined BA4a and BA4p) and left primary somatosensory area (S1: combined BA3a and BA3b). Five additional ROIs were then generated from combinations of these two primary ROIs: a combined ROI (M1+S1), and reduced-overlap versions (− and −−) of M1 and S1. To create these versions, the adjacent ROI (for M1: S1; for S1: M1) was expanded by one or two voxel widths (−: 2.3 mm, −−: 4.6 mm, using fslmaths options: e.g. -kernel sphere 2.3 -dilM) and subtracted from the standard ROI.
2.8. fMRI processing
2.8.1. Rigid body motion correction
The mean of the first fMRI run of the first localizer session was used as a reference functional image (RFI). All functional volumes from both localizer sessions underwent rigid body motion correction to the RFI template using FSL’s MCFLIRT. Each functional voxel then underwent some combination of detrending and normalization (z-scoring) on a run-by-run basis.
2.8.2. Detrending (high pass filtering)
Three levels of first-order (linear) detrending were investigated: none, real-time (using all prior data from the current run to linearly detrend up to the current time point), and offline (using data from the entire run to linearly detrend). Higher order (polynomial) detrending or other forms of high-pass filtering were not considered in this analysis. For all analyses in which other factors were varied (decoding timing, z-scoring, ROIs), real-time detrending was used.
2.8.3. Z-scoring (normalization)
Four types of z-scoring were investigated: none, baseline rest (using the baseline rest period at the beginning of each run), real-time (using all prior data from the current run), and offline (using data from the entire run). The baseline rest detrending condition was further subdivided to evaluate the impact of the amount of baseline data used, from 2 TRs (4 s) up to 20 TRs (40 s). This baseline period began with the first ‘real’ TR of each run, following the 3 dummy TRs collected at the beginning of each run, ensuring that transient magnetization artifacts did not affect the baseline estimate. For all analyses in which other factors were varied (decoding timing, detrending, ROIs), baseline z-scoring from the entire 40 s baseline period was used.
2.8.4. Feature extraction and decoding
In each localizer run there were 40 trials per finger, thus 80 total trials of data were collected per finger. Mean voxel activities were extracted for each trial using a 3-TR (6-sec) sliding window across the trial. Resulting fMRI activity patterns were then masked by ROIs and submitted to a sparse multinomial logistic regression classifier (SMLR; Krishnapuram et al. (2005)). For within-session analyses, a leave-one-run-out cross--validation was performed to determine decoder accuracy. For across-session analysis, the decoder was trained on one localizer session and applied to the other localizer session (and vice versa).
2.8.5. Classifier importance maps
Classifier importance maps (McDuff et al., 2009) were calculated to identify voxels that contributed significantly to the identification of each finger. For each finger, ‘importance’ values at each voxel were calculated by multiplying the voxel’s decoder weight for that finger by its mean activity level during that finger’s press. Positive importance values resulting from positive decoder weights were considered positive, whereas positive importance values resulting from negative decoder weights were considered negative; negative importance values were ignored, as performed by McDuff et al. (2009). An overall ‘winner-takes-all’ representation was further created by taking the maximum absolute value of importance at each voxel across all 4 fingers. Representations were then projected onto the cortical surface using Freesurfer (Dale et al., 1999) and visualized using PyCortex (Gao et al., 2015).
2.8.6. Chosen parameters for neurofeedback session
For the neurofeedback session, real-time detrending was selected, and z-scoring was based on the full 40-sec baseline rest period. FSL’s MCFLIRT was used to realign real-time functional volumes to the RFI template for each participant. Based on offline analyses of the localizer data, we sought to maximize the quality of decoded neurofeedback by focusing on fMRI data from the combined M1+S1 ROI during the final 6-sec time window prior to feedback (TRs 4–6) on each trial.
2.9. Overview of neurofeedback simulations
Our method to develop neurofeedback simulations is outlined in Fig. 1A. Once the optimal parameters for decoding were chosen (Section 2.8.6), we used these parameters to calculate across-session fMRI decoder outputs from every trial in every localizer session (160 trials × 2 sessions × 6 participants = 1920 trials, with 480 trials per finger). These decoder outputs were used to calculate target finger probabilities in either a fully offline simulation (Section 2.10 or a simulated neurofeedback experiment with human participants (Section 2.11).
2.10. Predicted performance with offline simulations of neurofeedback
To help calibrate design parameters and predict human performance in the neurofeedback session, we performed an offline simulation using fMRI data from the localizer sessions as described in Section 2.9. As in the real neurofeedback session, a pseudo-random target finger was chosen for every trial. A simple search strategy was chosen for the behavioral simulation: choosing each of the fingers sequentially, starting with the index, until the target was found (i.e., index, middle, ring, little, index- …). For each simulated pressing trial, a sample trial corresponding to the selected finger was randomly chosen (with replacement) from the full set of localizer trials to simulate the brain activity on the trial. If the decoder output for the target finger exceeded a success threshold (which could occur due to noise, leading to a false positive) then the target was considered found and a new target was chosen for the next simulated trial. Several conditions were tested: two different ROIs (M1+S1, and M1 alone), and a range of success thresholds (from 25% to 90% in 5% increments). For each combination of conditions, a total of N = 1000 participants were simulated, each performing 160 trials of simulated neurofeedback, as in the real experiment.
2.11. Simulated neurofeedback with human behavior
We also conducted a behavioral experiment to compare neurofeedback performance using human strategies compared to the simulated (sequential) behavioral strategy. Using the same across-session decoder outputs as in the offline simulations of neurofeedback, a set of human participants (N = 10) attempted to find targets as in the real neurofeedback experiment. The structure of the experiment was similar to the neurofeedback session except accelerated in time: participants only had to make a single press (rather than 10-sec of presses) to choose their finger, and feedback appeared immediately after the press. This accelerated timing allowed us to investigate two ROIs (using decoded neurofeedback from M1+S1 and also from M1 only) in a short period of time. We previously found no difference in trials-to-target for accelerated simulated feedback compared to the significantly slower feedback pace of real-time fMRI (Oblak et al., 2017). Furthermore, participants had no knowledge of the true target: only a one-dimensional feedback signal was provided for the target, which meant that false positives were possible, mimicking a true neurofeedback experiment in which incorrect strategies may spuriously cause positive feedback signals. We conducted 8 consecutive runs of trials for each ROI (20 trials per run, ROI order randomized across participants), similar to the real neurofeedback experiment. This experiment lasted approximately 10 min per participant.
2.12. Statistics
A separate linear mixed-effects model (nlme in R (Pinheiro et al., 2018)) was created to predict decoder accuracy for each of real-time decoding, baseline sensitivity, normalization, and detrending analyses. Each model included ROI (S1 or M1) and decoding type (within or between session) as fixed effects and subject as a random effect. Tukey’s post-hoc test (α<0.05) was used to determine the differences between each condition. To compare decoding accuracy across ROIs (M1+S1, M1, S1, M1−, S1−, M1−−, and S1−−), paired t-tests (df = 5) were used. To compare the correlation of decoder outputs across ROIs, the mean correlation (averaged across both localizer sessions) for each subject was Fisher Z-transformed and submitted to a paired t-test. Performance of real neurofeedback and simulated neurofeedback participants were compared using an independent groups t-test (df = 13).
3. Results
3.1. Real-time decoding limitations
Using fMRI data from the two localizer sessions, we characterized the limitations of decoding individual finger presses in real-time from fMRI activity in M1 and S1 by manipulating key analysis parameters: timing, baseline duration, normalization type, and detrending type (Fig. 2).
Fig. 2. Real-time decoding limitations.

(A) Real-time finger decoding over time (chance: 25%). The feedback cutoff (1-sec before the feedback period) is the last time at which fMRI data can be used for neurofeedback. Each displayed time point includes time-averaged fMRI data from the current time repetition (TR) and the two previous TRs; real-time detrending and baseline (20 TRs) z-scoring were used. (B) Sensitivity of decoding to the baseline time period used for normalization (z-scoring); real-time detrending was used. (C) Decodability for four different types of normalization: none, z-scoring based on 20 TRs of baseline data, realtime z-scoring, and z-scoring based on a full run of data, which is equivalent to offline analysis; real-time detrending was used. (D) Decodability for three different types of detrending: none, real-time detrending, and offline detrending based on a full run of data; baseline (20 TRs) z-scoring was used. Error bars indicate a 95% confidence interval. M1 shown in blue and S1 shown in orange. Within session decoding shown with solid lines and closed circles and between-session decoding shown with dashed lines and open circles. Selected statistical comparisons shown. Stars indicate significant differences at p < 0.01 (**) and p < 0.001 (***). Error bars omitted in (A) and (B) for clarity; see (C) and (D) for typical error bars.
3.1.1. Real-time decoding over time
The timing limitations of real-time decoding were related to the intermittent feedback timing. In order to deliver feedback at the scheduled time (11 s after the beginning of each pressing period), we could only use data gathered up to 1 s before the feedback period. However, the timing of this feedback period could be adjusted to save time or optimize decodability. To assess the optimality of feedback timing, we analyzed decoding accuracies at TRs 5, 6, and 7, corresponding to our hypothesized optimal feedback TR (6) and the TRs immediately before and after (5 and 7). We found decoding at TR 6 to be significantly better than TR 5 (+5.6% decoding, Tukey’s HSD, p < 0.001), whereas TR 7 was not significantly different than TR 6 (−0.1% decoding, p = 0.996). Fig. 2A illustrates these differences. This analysis also revealed a large main effect of ROI (S1 > M1: +20.1% decoding, p < 0.001) and a small but reliable main effect of session (between session < within session: −2.8% decoding, p = 0.004).
3.1.2. Baseline sensitivity
We next investigated how sensitive the decoder was to different amounts of baseline data used for normalization (z-scoring). We analyzed four amounts of baseline data: the first 2 TRs, 5 TRs, 10 TRs, and 20 TRs of the run (Fig. 2B). Increasing from using 2 to 5 TRs for baseline normalization significantly increased decodability (+31.6% decoding, p < 0.001). Increasing from 5 to 10 TRs also significantly increased decodability, but with diminishing returns (+4.8% decoding, p < 0.001). There was no significant difference in decodability between 10 and 20 TRs (+1.9% decoding, p = 0.58).
3.1.3. Normalization
Next, we analyzed how different types of normalization (z-scoring) affected decoding. We first compared baseline z-scoring (using the full 20-TR baseline period), real-time z-scoring (using all previous data from the run), and offline z-scoring (using all the data in the run, Fig. 2C). Each of these was significantly better than performing no z-scoring at all (p < 0.001), yielding mean decoding increases of 9.2%, 10.5%, and 12.4% decoding for baseline, real-time, and offline conditions, respectively. Within these three types of normalization, there was only a significant difference when comparing baseline to offline z-scoring (−3.3% decoding, p = 0.022).
3.1.4. Detrending
Finally, we investigated the effect of different types of detrending on decoding. Both real-time and offline detrending were significantly better than no detrending (p < 0.001), with a mean decoding increase of 8.9% for real-time detrending and 7.2% for offline detrending (Fig. 2D). There was no significant difference between real-time and offline detrending (p = 0.45).
3.2. Decoding and information shared across ROIs
We next investigated decoding and decoder outputs in different ROIs (Fig. 3A) based on the same localizer data, to investigate if motor and sensory representations could be separated without significantly affecting decodability.
Fig. 3. Decoding and information transfer across ROIs.

(A) ROIs used for analysis. (B) Between session decoding for ROIs. (C) Correlations between decoder outputs at the same time point but in different ROIs. All correlations are made with the combined M1+S1 decoder outputs, indicating the correspondence of information between the combined M1+S1 decoder and the reduced ROIs. (D) Classifier importance maps for the combined M1+S1 decoder of a sample participant, in arbitrary units. C.S. indicates the central sulcus dividing M1 and S1. Cortical visualizations generated with PyCortex (Gao et al., 2015). Error bars indicate a 95% confidence interval. Selected statistical comparisons shown. Stars indicate significant differences at p < 0.05 (*), p < 0.01 (**), and p < 0.001 (***). ‘NS’ indicates no significant differences.
3.2.1. Decoding accuracy
Across-session decoding accuracy was highest in the combined M1+S1 region (83.4%) and in the isolated S1 region (83.3%), with no significant difference between the two (p = 0.85). M1+S1 had significantly better decoding than M1 (+18.2% decoding; p = 0.002). Moving to the reduced M1− from M1 was significantly worse (−13.8%, p = 0.019), and also to M1−− from M1− (−8.2%, p = 0.027). S1− was not significantly worse than S1 (−5.94%, p = 0.073), but S1−− was significantly worse than S1− (−26.7%, p < 0.001). Fig. 3B illustrates differences in decoding accuracy. By attempting to isolate primary somatosensory and motor cortices, decoding accuracy was significantly impaired.
3.2.2. Decoder correlations
The decoder outputs from S1 were more strongly correlated with the combined M1+S1 region than were the decoder outputs from M1 correlated to this region (p = 0.005). Moving anteriorly, the M1− decoder was more weakly correlated than M1 (p = 0.003), and M1−− was more weakly correlated than M1− (p = 0.016). Similarly, moving posteriorly, the S1− decoder was more weakly correlated than S1 (p = 0.003), and S1−− more weakly correlated than S1− (p < 0.001). See Fig. 3C for correlation results. Despite nearly identical decoding accuracy between the combined M1+S1 and S1 alone, the information contained by each decoder is not identical; indeed, the combined M1+S1 shares information with both M1 and S1 decoders, albeit weighted more heavily toward S1.
3.2.3. Importance maps
Classifier importance maps (McDuff et al., 2009) were generated both for individual fingers (Fig. 3D, bottom) and as a ‘winner-takes-all’ map across all fingers (Fig 3D, top). The overall map shows that important voxels for finger decoding lie on both sides of the central sulcus, with more on the posterior (S1) side. Furthermore, they tend to be near to the central sulcus, aligning with the observation that motor and somatosensory representations cannot easily be separated. Individual finger maps confirm that the classifier is picking up on localized changes in activity throughout the hand area of sensorimotor cortex rather than overall mean activity changes across the entire region.
3.3. Finger finding experiment
3.3.1. Predicted performance
We first predicted performance based on a variable success threshold for finding targets in both the combined M1+S1 region and in the M1 region alone (Fig. 4A). We chose M1 because of its significantly lower decoding accuracy compared to M1+S1, allowing us to investigate how reduced decoding accuracy affects predicted performance.
Fig. 4. Finger finding neurofeedback experiment performance.

(A) Predicted performance based on between-session decoder outputs from the localizer sessions. The success threshold for finding targets was varied between 25% and 90%. Target accuracy indicates the proportion of targets in which the finger pressed when the decoder output exceeded the success threshold matched the target finger. (B) Observed performance for both real neurofeedback and simulated neurofeedback participants using a success threshold of 50%. Trial-by-trial sample pressing strategies are shown for each condition: predicted, simulated, and real neurofeedback. Each tick represents a single finger of the right hand as illustrated. Each line represents one example target search, with the line ending when the decoder output exceeded the target threshold. Due to noise, occasionally the same finger is repeated. Error bars indicate standard deviation. M1 shown in blue and M1+S1 shown in purple. NS’ indicates no significant differences.
Across both selected ROIs, increasing the success threshold caused an exponential increase in the number of trials required to find a target, with diminishing returns on predicted target accuracy. Based on these predictions, a threshold of 50% was selected for subsequent experiments with human participants to maximize accuracy while minimizing the number of trials to target.
3.3.2. Simulated neurofeedback results
We next investigated whether human participants’ performance matched our model predictions for the selected success threshold (Fig. 4B). In M1+S1, we expected 3.23 ± 0.29 trials to target (mean ± s.d.) and 91.7 ± 3.7% target accuracy. In our simulated neurofeedback experiment, we recorded 3.12 ± 0.12 trials to target with 91.9 ± 3.4% accuracy using data from this region. In the M1 region, our predictions were similarly accurate: the prediction was 4.04 ± 0.49 trials with 73.1 ± 7.1% accuracy, and the simulated neurofeedback result recorded was 3.97 ± 0.67 trials with 70.1 ± 6.8% accuracy.
3.3.3. Real neurofeedback results
We then compared real neurofeedback results to the simulated results in the M1+S1 region that was selected for the neurofeedback experiment (Fig. 4B). In the scanner, participants required 2.97 ± 0.43 trials to find each target, with 87.7 ± 11.7% accuracy. There was no significant difference between this performance and the simulated neurofeedback participants’ performance (trials-to-target: t(13) = −0.97, p = 0.35; accuracy: t(13) = −0.78, p = 0.45).
Finally, we investigated how decoding accuracy influenced performance on our task (Fig. 5). We selected the 50% success threshold and M1+S1 region in order to qualitatively compare performances between the three conditions (predicted, simulated neurofeedback, and real neurofeedback). In the predicted dataset, trials-to-target was negatively correlated with decoding accuracy (slope of best-fit line = −4.36, r = −0.41, p < 0.001 Fig. 5A) and target accuracy was positively correlated with decoding accuracy (slope = 0.66, r = 0.48, p < 0.001, Fig. 5B), as expected. The slope for the trials-to-target was negative for simulated neurofeedback (slope = −0.86) and real neurofeedback (slope = −3.19); the slope for decoding accuracy was positive for simulated neurofeedback (slope = 0.70) and real neurofeedback (slope = 0.93). While decoder accuracy was significantly correlated with our performance metrics in the predicted results, only part of the variance was captured by decoder accuracy (trials-to-target: r2 = 16.8%; target accuracy: r2 = 23.0%). Because strategies were kept fixed within the predicted results, we suggest that there may always be significant variability in neurofeedback performance that cannot be accounted for by the quality of the decoder or the participant’s strategy. Although the effect of decoding accuracy on trials-to-target in the simulated neurofeedback group (−0.86) appears different from the predicted slope (−4.36), the result falls well within the 95% confidence interval (−11.8, 2.89) of repeated samples of N = 10 predicted results (1000 bootstrapped samples with replacement).
Fig. 5. Influence of decoding accuracy on finger finding performance.

(A) Correspondence between observed decoding accuracy during the finger finding session and the mean number of trials required to find each target. (B) Correspondence between observed decoding accuracy during the finger finding session and target accuracy (proportion of trials in which the decoder output exceeded the success threshold and the pressed finger was also the target finger). Solid lines indicated the best-fit line for each condition.
4. Discussion
This study presents a systematic investigation of optimal parameter selection for the design of real-time neurofeedback experiments that rely on multi-voxel pattern analysis of neuroimaging data. We collected fMRI data of participants performing individual finger presses and trained classifiers to discriminate brain activity patterns for each finger in sensorimotor cortex. These classifiers were intended to perform real-time decoding of finger presses in a subsequent neurofeedback session. Offline analyses with real-time processing constraints revealed optimal choices for the analysis of these data and the timing of the neurofeedback experiment. Simulated results of neurofeedback performance were confirmed by participants receiving real neurofeedback inside the scanner. This study demonstrates how the offline simulation of neurofeedback performance using real fMRI data can be used to optimize human performance on real-time neurofeedback experiments.
The simulation of neurofeedback performance is a novel approach to the field. While reliance on simulations has long been common in other neuroscience subdomains such as visual neuroscience (Tong, 2003), our previous work mentioned earlier (Oblak et al., 2017) was the first instance of simulation in fMRI neurofeedback. Whereas in the aforementioned study, we simulated brain activity based on known parameters of visual cortex activity, here we present recorded brain activity in sensorimotor cortex to both to human participants and to simulated participants with predetermined neurofeedback strategies. A key element to this simulation of neurofeedback is an explicit strategy, i.e. finger pressing, because it can be directly measured and validated both inside and outside of the scanner. Our simulation was validated for explicit strategies through similar outcomes in real and simulated neurofeedback (Fig. 4B). However, it remains to be answered to what degree the explicit strategies used in this paradigm can represent mental strategies typically used in neurofeedback. Typical decoded neurofeedback experiments rely on implicit learning and do not indicate to participants when they have discovered the ‘correct’ strategy (as is done in this work using the concept of a ‘success threshold’), because the correct strategy is not known by the experimenter. Future work should incorporate more advanced learning models, including implicit strategies, into this simulation paradigm, to determine the extent to which decoding accuracy can predict decoded neurofeedback performance when no explicit strategy is known. We anticipate such simulation of neurofeedback performance to be a valuable tool to improve the efficiency and robustness of experiments, which more recent work in fMRI neurofeedback has begun to explore (deBettencourt et al., 2018; Shibata et al., 2019).
Our work shows the benefit of using localizer data to predict neurofeedback performance in two ways. First, we were able to design a parameter of our experiment, namely the feedback success threshold of 50%, to optimize predicted neurofeedback performance as a tradeoff between finding successful strategies and finding accurate strategies (Fig. 4A). These predictions translated to both real neurofeedback participants and human participants interacting with a simulated neurofeedback signal outside of the fMRI scanner (Fig. 4B). Although our task and model of learning was simple, and the parameter of ‘success threshold’ was non-standard, this same simulation strategy could be used with a more complex learning model (Oblak et al., 2017; Watanabe et al., 2017) to determine the required duration of an experiment, or to design tuning curves in an adaptive neurofeedback experiment (deBettencourt et al., 2015). Second, given our fully designed experiment, we were able to generate a distribution of predicted neurofeedback performance results based on localizer data alone (Fig. 5). These predicted results show a large variance (especially given that each simulated participant used exactly the same strategy), placing a lower bound on the expected variability across participants given their localizer decoder accuracy. This type of predicted performance distribution could be used as an exclusionary criterion for patients in neurofeedback treatment or to predict the minimum required duration of treatment; it could also be used to alter neurofeedback parameters for individuals based on their own localizer data.
A major goal of this study was to tease apart the non-responder effect by focusing on decoder quality using a task that every participant would be able to figure out. In this way, we ensured that every participant would be a ‘responder’ within a short period of time (a few trials). This let us explore how decoder accuracy affects performance without worrying about the participants’ strategies. Indeed, the ‘finger finding’ experiment is not an accurate model when considering the time scale of decoded neurofeedback learning, but we believe that general principles can transfer. For example, a decoder that allows participants to find targets in 3 trials versus 5 trials could equate to a decoder requiring 3 decoded neurofeedback sessions versus 5 decoded neurofeedback sessions to show clear learning.
Our neurofeedback predictions show how a given decoder accuracy translates to neurofeedback performance. In all cases, neurofeedback performance increased with increasing decoder accuracy. Therefore, our secondary goal was to explore which typical parameters of decoded neurofeedback experiments had the largest effect on decoding accuracy. Two standard fMRI preprocessing steps, normalization and detrending, were found to have a large effect on real-time decoding. Real-time z-scoring increased decoding accuracy by 10.5% (Fig. 2C) and real-time detrending increased decoding accuracy by 8.9% (Fig. 2D) compared to no preprocessing at all. Critically, these results did not suffer relative to offline decoding, indicating that the real-time preprocessing constraints were not a performance bottleneck.
We next found that we could decode from an earlier timing window than standard decoded neurofeedback experiments without a significant reduction in decoder accuracy. The standard timing window for decoded fMRI neurofeedback is a 6-sec stimulus period followed by a 6 s decoding period (Shibata et al., 2011), accounting for the hemodynamic delay. We increased the length of the stimulus period (in this case, finger pressing) to 10 s, yet decoded 2 s earlier than Shibata et al. (2011) (Fig. 2A). For behaviors and ROIs other than those detailed in this work, we recommend designing a localizer with varying stimulus periods and rest periods to determine the best tradeoff between decodability and feedback timing for that experiment.
The standard normalization method for decoded neurofeedback is z-scoring using a baseline resting period of 20 s at the beginning of each fMRI run (Shibata et al., 2011). Our results support this choice, as there was no significant increase in subsequent decodability when we doubled the length of the baseline period to 40 s. We also show that real-time z-scoring can be used to achieve similar decoding performance (Fig. 2B), although this would still necessitate a baseline period at the beginning of each run to ensure reasonable decoding accuracy on the first trial of each run. There may be further confounds associated with real-time z-scoring (e.g. large changes in strategy could skew z-score estimates mid-run), but the data here cannot address these possible confounds.
We observed differences in decoder performance dependent on the specificity and location of the ROI. For instance, we found that by reducing the size of our ROIs by only one voxel width, decoding accuracy was reduced by 14% in M1 and by 6% in S1 (Fig. 3B). These results are not surprising given the limited spatial resolution of fMRI and high intersubject variability. This evidence suggests that predetermined segregation of ROIs should be handled carefully. If a neurofeedback experiment targets a specific behavior without a well-defined anatomical hypothesis, then we should err on the side of inclusion and allow the decoder to automatically select relevant voxels in the brain (Shibata et al., 2016). However, if there is a strict hypothesis based on a neural mechanism in a specific ROI, then it is reasonable to restrict the voxels at the expense of decodability (Shibata et al., 2011). In our case, we chose a broad M1+S1 ROI because we were not attempting to segregate a specific neural mechanism, such as separating motor output from tactile sensation. If we had a strict motor or sensory hypothesis, isolating the M1 or S1 ROI may be necessary. However, if such segregation was necessary, and subsequently reduced decoder performance, the procedures illustrated here could be used to predict neurofeedback performance, such as the number of trials required to induce neurofeedback learning. Fig. 5 shows how decoder accuracy is predictive of neurofeedback performance. Thus, one of the contributions of this work is the suggestion that a targeted decoder accuracy should be predetermined together with the goals of the study prior to commencing neurofeedback training.
While here we show the power of simulation of decoded neurofeedback parameters, there are limitations to what we can conclude. By focusing only on M1 and S1, the generalizability of our model to other brain regions is limited. Furthermore, the number of neurofeedback participants was low (N = 5), especially compared to the simulated neurofeedback participants (N = 10). As expected, we did not find a significant difference in performance between the two groups, tentatively validating our basic model. Running more non-fMRI behavioral participants could show more fine-grained differences between real and simulated participants, but would require more detailed analysis of participants’ strategies, which was not within the scope of this study. Indeed, our previous work (Oblak et al., 2017) had much larger groups (2 groups of N = 24 each), but this was due to there being more experimental conditions within each experimental session and a continuous rather than discrete strategy space allowing for more variable strategies between participants. It is also likely that small differences would be found with a larger sample of neurofeedback participants in our simple ‘finger finding’ task, because participants during this task are receiving feedback from real neural activity and thus have the ability to modulate the feedback signal beyond the simple choice of which finger to press. While participants were not explicitly instructed to self-modulate their brain activity, they were informed that feedback was coming from their own brain. Thus, they may learn to maximize the decoder output for the pressed finger, for example by pressing harder or more individually with each finger, which would increase performance at the ‘finger finding’ task. Alternatively, they may learn to press less individually, which may have a larger chance of randomly triggering the target finger decoder output even if they are pressing the non-target finger; this neurofeedback strategy would lead to a decrease in performance at the ‘finger finding’ task. Critically, the experimental setup for this work used a simple button box and did not record forces exerted by each finger, and thus we could not include these factors in our model. Future work will aim to measure these factors: if differences are found, the model could be improved to address these more subtle facets of the experiment. This would help us determine the composition of variability in decoder output: in the current work, we cannot conclude whether the variability in decoder output is due to measurement noise, spontaneous neural activity, or variability in motor behavior (such as changes in force or coordination of pressing). Assessing the sources of variability in decoder output is a key component of modeling decoded neurofeedback that future work must address.
4.1. Conclusions
In this work we show that decoded neurofeedback performance is significantly correlated to decoder accuracy, and we systematically determine the parameter settings needed to optimize that decoder accuracy. We modeled neurofeedback performance using simulations based on real brain data, compared this with human performance with the same brain data, and finally compared it with real neurofeedback performance. We observed similar performance in all cases, validating the accuracy of the simulations. We found a quantitative representation of the high level of dependence of neurofeedback performance on success threshold and decoder accuracy. These results will help improve the robustness of decoded neurofeedback experiments, both by identifying proper preprocessing parameters and by identifying likely ‘non-responder’ participants prior to training. The simulation paradigm validated here can be used in future research to pre-emptively and efficiently sweep the parameter space to optimize the design of decoded neurofeedback experiments.
Funding
This work was financially supported by pilot funding from the National Institutes of Health National Center of Neuromodulation for Rehabilitation (NIH/NICHD Grant Number P2CHD0886844) which was awarded to the Medical University of South Carolina, and a Robert J. Kleberg, Jr. and Helen C. Kleberg Foundation Medical Research Grant. The contents are solely the responsibility of the authors and do not necessarily represent the official views of the NIH or NICHD.
References
- Allison BZ, Neuper C, 2010. Could anyone use a BCI?. In: Brain-computer Interfaces. Springer, pp. 35–54. [Google Scholar]
- Amano K, Shibata K, Kawato M, Sasaki Y, Watanabe T, 2016. Learning to associate orientation with color in early visual areas by associative decoded fMRI neurofeedback. Curr. Biol. 26, 1861–1866. [DOI] [PMC free article] [PubMed] [Google Scholar]
- Blefari ML, Sulzer J, Hepp-Reymond M-C, Kollias S, Gassert R, 2015. Improvement in precision grip force control with self-modulation of primary motor cortex during motor imagery. Front. Behav. Neurosci. 9, 18. [DOI] [PMC free article] [PubMed] [Google Scholar]
- Bray S, Shimojo S, O’Doherty JP, 2007. Direct instrumental conditioning of neural activity using functional magnetic resonance imaging-derived reward feedback. J. Neurosci. 27, 7498–7507. [DOI] [PMC free article] [PubMed] [Google Scholar]
- Brunoni AR, Nitsche MA, Bolognini N, Bikson M, Wagner T, Merabet L, Edwards DJ, Valero-Cabre A, Rotenberg A, Pascual-Leone A, et al. , 2012. Clinical research with transcranial direct current stimulation (tDCS): challenges and future directions. Brain Stimulation 5, 175–195. [DOI] [PMC free article] [PubMed] [Google Scholar]
- Chiew M, LaConte SM, Graham SJ, 2012. Investigation of fMRI neurofeedback of differential primary motor cortex activity using kinesthetic motor imagery. Neuroimage 61, 21–31. [DOI] [PubMed] [Google Scholar]
- Cortese A, Amano K, Koizumi A, Kawato M, Lau H, 2016. Multivoxel neurofeedback selectively modulates confidence without changing perceptual performance. Nat. Commun. 7, 13669. [DOI] [PMC free article] [PubMed] [Google Scholar]
- Dale A, Fischl B, Sereno MI, 1999. Cortical surface-based analysis: I. segmentation and surface reconstruction. Neuroimage 9, 179–194. [DOI] [PubMed] [Google Scholar]
- deBettencourt MT, Cohen JD, Lee RF, Norman KA, Turk-Browne NB, et al. , 2015. Closed-loop training of attention with real-time brain imaging. Nat. Neurosci. 18, 470. [DOI] [PMC free article] [PubMed] [Google Scholar]
- deBettencourt MT, Turk-Browne NB, Norman KA, 2018. Neurofeedback helps to reveal a relationship between context reinstatement and memory retrieval. bioRxiv 355727. [DOI] [PMC free article] [PubMed] [Google Scholar]
- deCharms CR, Maeda F, Glover GH, Ludlow D, Pauly JM, Soneji D, Gabrieli JD, Mackey SC, 2005. Control over brain activation and pain learned by using real-time functional MRI. Proc. Natl. Acad. Sci. U. S. A 102, 18626–18631. [DOI] [PMC free article] [PubMed] [Google Scholar]
- Diedrichsen J, Wiestler T, Krakauer JW, 2012. Two distinct ipsilateral cortical representations for individuated finger movements. Cerebr. Cortex 23, 1362–1377. [DOI] [PMC free article] [PubMed] [Google Scholar]
- Ejaz N, Hamada M, Diedrichsen J, 2015. Hand use predicts the structure of representations in sensorimotor cortex. Nat. Neurosci. 18, 1034. [DOI] [PubMed] [Google Scholar]
- Friesen CL, Bardouille T, Neyedli HF, Boe SG, 2017. Combined action observation and motor imagery neurofeedback for modulation of brain activity. Front. Hum. Neurosci. 10, 692. [DOI] [PMC free article] [PubMed] [Google Scholar]
- Gao JS, Huth AG, Lescroart MD, Gallant JL, 2015. Pycortex: an interactive surface visualizer for fMRI. Front. Neuroinf. 9, 23. [DOI] [PMC free article] [PubMed] [Google Scholar]
- Hammer EM, Halder S, Blankertz B, Sannelli C, Dickhaus T, Kleih S, Müller K-R, Kübler A, 2012. Psychological predictors of SMR-BCI performance. Biol. Psychol. 89, 80–86. [DOI] [PubMed] [Google Scholar]
- Hanke M, Halchenko YO, Sederberg PB, Hanson SJ, Haxby JV, Pollmann S, 2009. PyMVPA: a python toolbox for multivariate pattern analysis of fMRI data. Neuroinformatics 7, 37–53. [DOI] [PMC free article] [PubMed] [Google Scholar]
- Haxby JV, Gobbini MI, Furey ML, Ishai A, Schouten JL, Pietrini P, 2001. Distributed and overlapping representations of faces and objects in ventral temporal cortex. Science 293, 2425–2430. [DOI] [PubMed] [Google Scholar]
- Haxby JV, Connolly AC, Guntupalli JS, 2014. Decoding neural representational spaces using multivariate pattern analysis. Annu. Rev. Neurosci. 37, 435–456. [DOI] [PubMed] [Google Scholar]
- Haynes J-D, Rees G, 2005. Predicting the orientation of invisible stimuli from activity in human primary visual cortex. Nat. Neurosci. 8, 686–691. [DOI] [PubMed] [Google Scholar]
- Kamitani Y, Tong F, 2005. Decoding the visual and subjective contents of the human brain. Nat. Neurosci. 8, 679–685. [DOI] [PMC free article] [PubMed] [Google Scholar]
- Koizumi A, Amano K, Cortese A, Shibata K, Yoshida W, Seymour B, Kawato M, Lau H, 2017. Fear reduction without fear through reinforcement of neural activity that bypasses conscious exposure. Nature Human Behaviour 1, 0006. [DOI] [PMC free article] [PubMed] [Google Scholar]
- Kornysheva K, Diedrichsen J, 2014. Human premotor areas parse sequences into their spatial and temporal features. Elife 3, e03043. [DOI] [PMC free article] [PubMed] [Google Scholar]
- Krishnapuram B, Carin L, Figueiredo MA, Hartemink AJ, 2005. Sparse multinomial logistic regression: fast algorithms and generalization bounds. IEEE Trans. Pattern Anal. Mach. Intell. 27, 957–968. [DOI] [PubMed] [Google Scholar]
- LaConte SM, Peltier SJ, Hu XP, 2007. Real-time fMRI using brain-state classification. Hum. Brain Mapp. 28, 1033–1044. [DOI] [PMC free article] [PubMed] [Google Scholar]
- Lewis-Peacock JA, Norman KA, 2014. Multi-voxel pattern analysis of fMRI data. The Cognitive Neurosciences 911–920. [Google Scholar]
- McDuff SG, Frankel HC, Norman KA, 2009. Multivoxel pattern analysis reveals increased memory targeting and reduced use of retrieved details during single-agenda source monitoring. J. Neurosci. 29, 508–516. [DOI] [PMC free article] [PubMed] [Google Scholar]
- Oblak EF, Lewis-Peacock JA, Sulzer JS, 2017. Self-regulation strategy, feedback timing and hemodynamic properties modulate learning in a simulated fMRI neurofeedback environment. PLoS Comput. Biol. 13, e1005681. [DOI] [PMC free article] [PubMed] [Google Scholar]
- Peirce JW, 2007. PsychoPy–psychophysics software in Python. J. Neurosci. Methods 162, 8–13. [DOI] [PMC free article] [PubMed] [Google Scholar]
- Pinheiro J, Bates D, DebRoy S, Sarkar D, 2018. R Core Team, Nlme: Linear and Nonlinear Mixed Effects Models. https://CRAN.R-project.org/package=nlme. r package version 3.1-137.
- Ruiz S, Buyukturkoglu K, Rana M, Birbaumer N, Sitaram R, 2014. Real-time fMRI brain computer interfaces: self-regulation of single brain regions to networks. Biol. Psychol. 95, 4–20. [DOI] [PubMed] [Google Scholar]
- Shibata K, Watanabe T, Sasaki Y, Kawato M, 2011. Perceptual learning incepted by decoded fMRI neurofeedback without stimulus presentation. Science 334, 1413–1415. [DOI] [PMC free article] [PubMed] [Google Scholar]
- Shibata K, Watanabe T, Kawato M, Sasaki Y, 2016. Differential activation patterns in the same brain region led to opposite emotional states. PLoS Biol. 14, e1002546. [DOI] [PMC free article] [PubMed] [Google Scholar]
- Shibata K, Lisi G, Cortese A, Watanabe T, Sasaki Y, Kawato M, 2019. Toward a comprehensive understanding of the neural mechanisms of decoded neurofeedback. Neuroimage 188, 539–556. [DOI] [PMC free article] [PubMed] [Google Scholar]
- Sitaram R, Ros T, Stoeckel L, Haller S, Scharnowski F, Lewis-Peacock J, Weiskopf N, Blefari ML, Rana M, Oblak E, et al. , 2017. Closed-loop brain training: the science of neurofeedback. Nat. Rev. Neurosci. 18, 86. [DOI] [PubMed] [Google Scholar]
- Sulzer J, Haller S, Scharnowski F, Weiskopf N, Birbaumer N, Blefari ML, Bruehl AB, Cohen LG, Gassert R, Goebel R, et al. , 2013. Real-time fMRI neurofeedback: progress and challenges. Neuroimage 76, 386–399. [DOI] [PMC free article] [PubMed] [Google Scholar]
- Taschereau-Dumouchel V, Cortese A, Chiba T, Knotts J, Kawato M, Lau H, 2018. Towards an unconscious neural reinforcement intervention for common fears. Proc. Natl. Acad. Sci. Unit. States Am. 115, 3470–3475. [DOI] [PMC free article] [PubMed] [Google Scholar]
- Tong F, 2003. Primary visual cortex and visual awareness. Nat. Rev. Neurosci. 4, 219–229. [DOI] [PubMed] [Google Scholar]
- Walsh V, Cowey A, 2000. Transcranial magnetic stimulation and cognitive neuroscience. Nat. Rev. Neurosci. 1, 73–80. [DOI] [PubMed] [Google Scholar]
- Watanabe T, Sasaki Y, Shibata K, Kawato M, 2017. Advances in fMRI real-time neurofeedback. Trends in cognitive sciences 21 (12), 997–1010. [DOI] [PMC free article] [PubMed] [Google Scholar]
- Weiskopf N, Mathiak K, Bock SW, Scharnowski F, Veit R, Grodd W, Goebel R, Birbaumer N, 2004. Principles of a brain-computer interface (BCI) based on real-time functional magnetic resonance imaging (fMRI). IEEE Trans. Biomed. Eng. 51, 966–970. [DOI] [PubMed] [Google Scholar]
- Wiestler T, Diedrichsen J, 2013. Skill learning strengthens cortical representations of motor sequences. Elife 2. [DOI] [PMC free article] [PubMed] [Google Scholar]
- Yoo S-S, Jolesz FA, 2002. Functional MRI for neurofeedback: feasibility study on a hand motor task. Neuroreport 13, 1377–1381. [DOI] [PubMed] [Google Scholar]