

Abstract
BACKGROUND:
Cardiac allograft vasculopathy (CAV) is the leading cause of late graft failure and mortality after heart transplantation (HT). Current strategies for early diagnosis and effective treatment of CAV are lacking. Using single-cell RNA-sequencing in peripheral blood mononuclear cells (PBMCs), we sought to investigate cell-specific gene expression profiles and T cell receptor repertoires in CAV that may inform novel biomarkers and pathways to interrupt CAV pathogenesis.
METHODS:
Whole blood was collected from 22 HT recipients with angiographically-confirmed CAV and 18 HT recipients without CAV. PBMCs were isolated and subjected to single-cell RNA-sequencing using a 10X Genomics microfluidic platform. Downstream analyses focused on differential expression of genes, cell compositional changes, and T cell receptor repertoire analyses.
RESULTS:
Across 40 PBMC samples, we isolated 134,984 cells spanning 31 cell types. Compositional analyses showed subtle, but significant increases in CD4+ T central memory cells, and CD14+ and CD16+ monocytes in high-grade CAV (CAV-2 and CAV-3). 745 genes were differentially expressed in a cell-specific manner in high-grade CAV, enriched for putative pathways involved in inflammation and angiogenesis. Intersection with the druggable genome prioritized 68 targets, including targets with approved drugs in cardiovascular disease (e.g., canakinumab). There were no significant differences in T cell clonality or diversity with increasing CAV severity.
CONCLUSIONS:
Unbiased whole transcriptomic analyses at single-cell resolution identify unique, cell-specific gene expression patterns in CAV, suggesting the potential utility of peripheral gene expression biomarkers in diagnosing CAV. Furthermore, precision targeting of these pathways may offer opportunities to mitigate CAV pathogenesis.
Keywords: Heart transplant, Cardiac allograft vasculopathy, Biomarkers, Gene Expression, Single-cell RNA-sequencing
Introduction
Heart transplantation (HT) is the definitive treatment for end-stage heart failure. However, despite substantial improvements in early post-HT survival in recent decades, graft failure due to cardiac allograft vasculopathy (CAV) remains a leading cause of death beyond the first-year post-HT.1 Coronary angiography, performed with adjunctive intravascular ultrasound at some transplant centers, remains the gold standard for CAV diagnosis.2 However, this procedure is invasive (carrying risk of complications, including life-threatening ones3), requires use of nephrotoxic contrast agents, and is costly. Moreover, coronary angiography often fails to detect CAV until late in its course. Novel non-invasive biomarkers for earlier CAV diagnosis may overcome these barriers and have the potential to substantially impact patient care.
Peripheral biomarkers have been developed for acute rejection but have yet to show significant clinical utility in CAV.4–10 Gene expression profiling (e.g., Allomap) of peripheral blood mononuclear cells (PBMCs) using targeted gene panels has been developed for non-invasive detection of acute cellular rejection and is currently commercially available.4,11–13 More recently, donor-derived cell-free DNA (dd-cfDNA) has shown promise in early detection of acute rejection.14 However, targeted peripheral gene panels have not shown consistent association with CAV and there are limited data regarding dd-cfDNA in CAV.15,16 Small studies assessing targeted proteomics,9,17 serum cytokine levels,7 and serum levels of microRNAs (miRNAs)5,6 in CAV have been proposed but show limited sensitivity and specificity.
Similarly, therapies focused on interrupting CAV pathogenesis following diagnosis are primarily limited to mTOR inhibitors.18 However, initiation of mTOR inhibitors is limited by side-effects19 and their ability to modify CAV progression is heterogenous.20 Percutaneous coronary intervention is sometimes deployed for focal lesions, but rates of in-stent restenosis and CAV progression remain high while coronary artery bypass grafting is rarely utilized due to poor distal targets that are often noted.21 Ultimately, the definitive therapy for severe CAV is re-do HT,22 the success of which is often limited by recipient allosensitization as well a shortage of available donors. Therapies that meaningfully modify CAV progression or prevent its development altogether are urgently needed to prolong allograft survival.
Single-cell RNA-sequencing (scRNA-seq) has emerged as a powerful tool to characterize the whole transcriptome, rather than targeting specific genes, at the level of individual cells. This approach can identify rare cell types/states that are perturbed in diseased conditions and characterize dynamic cell-specific transcriptomic profiles. Importantly, scRNA-seq can be leveraged to identify both novel biomarkers of disease as well disease-relevant pathways that can be targeted for therapeutic modulation.23–25 We have previously defined cell-specific heterogeneity and donor-recipient chimerism in human cardiac biopsies in severe CAV.26 In this study, we leverage scRNA-seq capabilities to explore cell-specific gene expression profiles and T cells receptor (TCR) repertoires in PBMCs of patients with angiographically-confirmed CAV with the goals of identifying novel gene expression markers of disease and characterizing potentially druggable targets.
Methods
Human samples
The overall study design is depicted in Figure 1A. Adult HT recipients were enrolled during routine transplant clinic visits at Vanderbilt University Medical Center. Eligible participants were screened for presence or absence of CAV as determined by their most recent coronary angiography and approached for study participation in May 2022. All participants provided written informed consent. This study was approved by the Vanderbilt University Institutional Review Board (#200551). Peripheral blood (~20 mL) was collected in vacutainers containing K2 EDTA, sodium heparin, or acid citric dextrose solution A.
Figure 1.
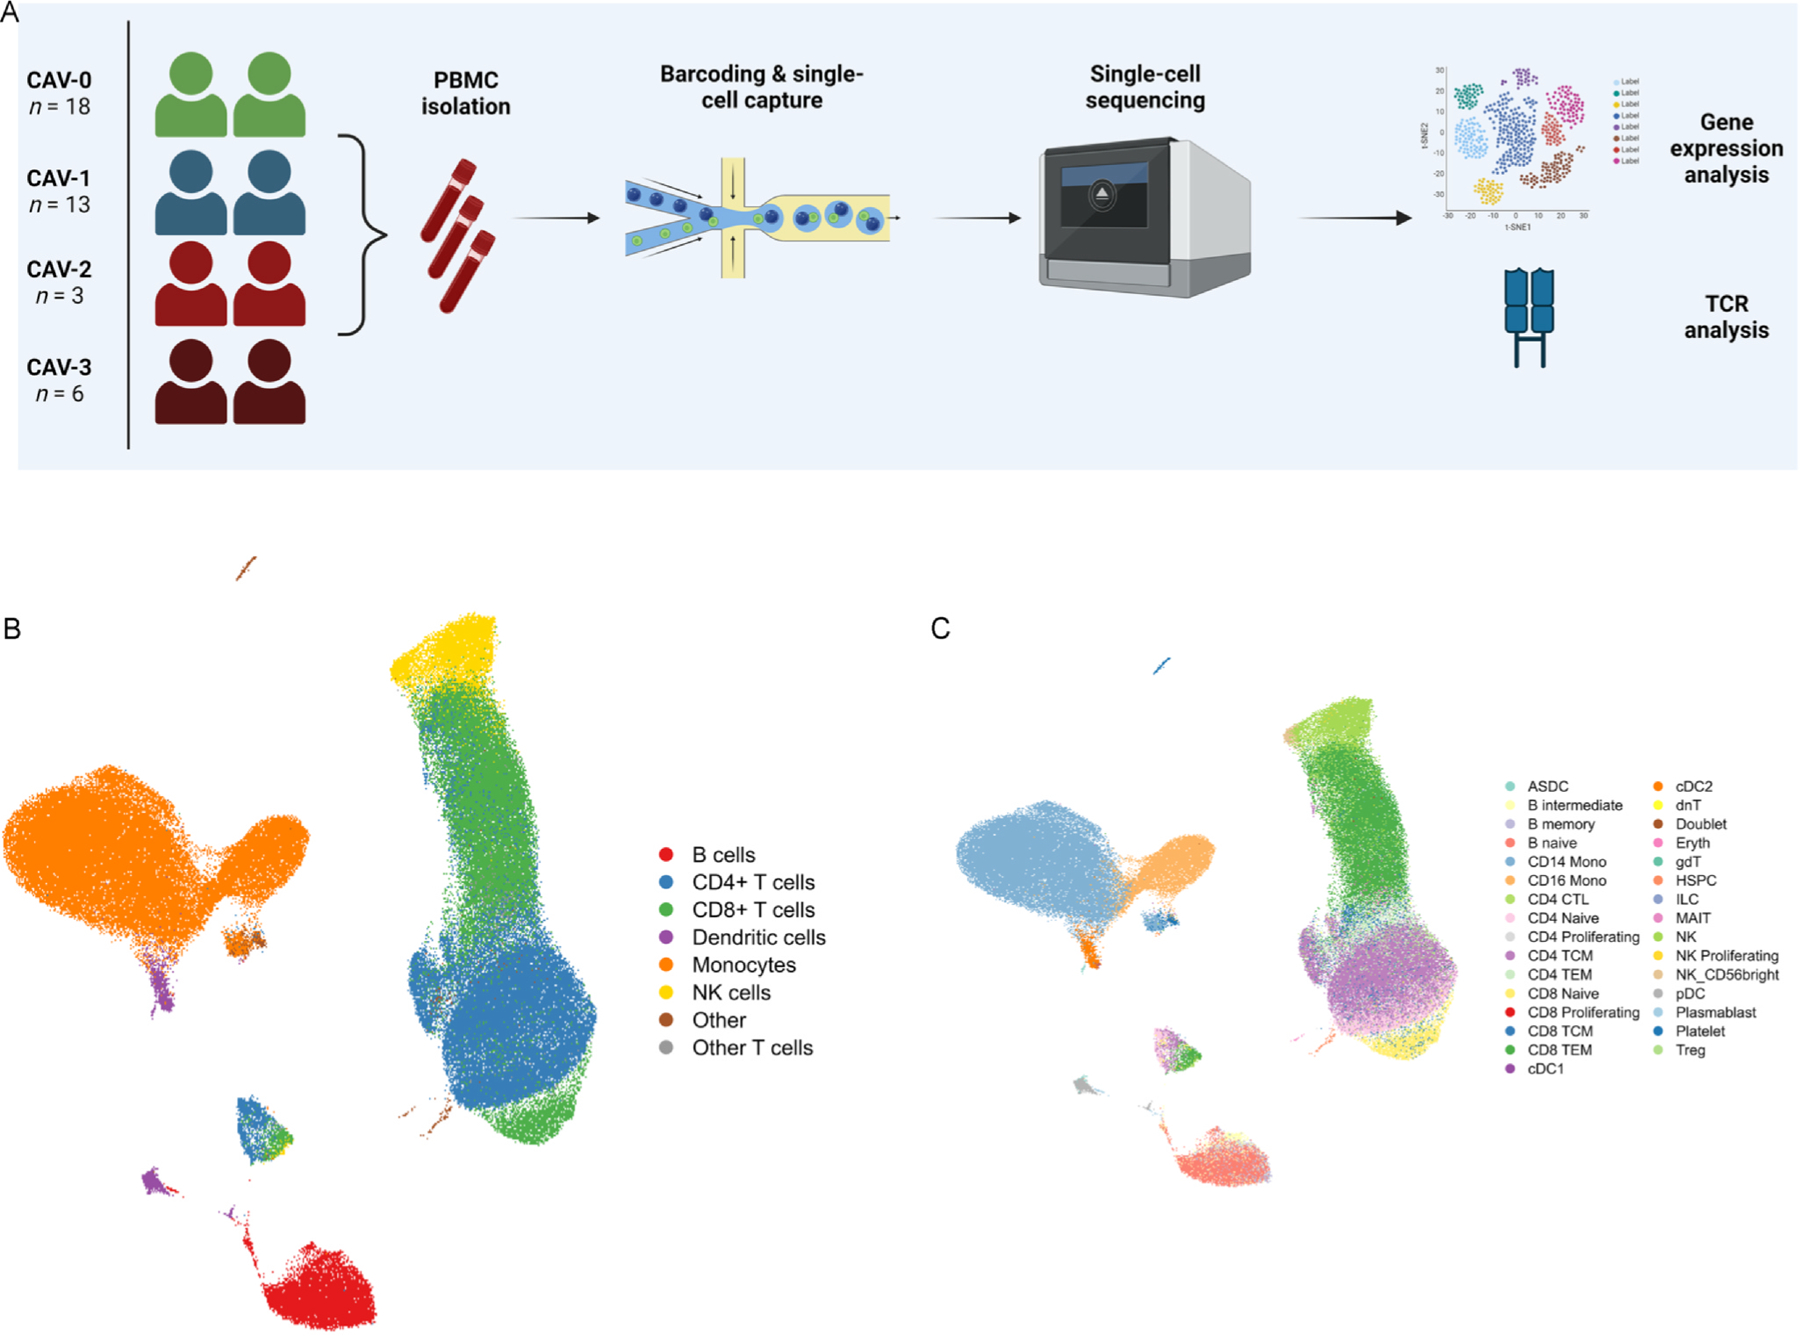
(A) Overview of the study design and samples collected. This figure was created using Biorender.com. (B) UMAP visualization of 134,984 cells passing quality control, as described. Using canonical markers and reference-mapping, 8 major clusters were defined. (C) 31 subclusters were further characterized. ASDC = AXL+ SIGLEC6+ dendritic cells; Mono = monocyte; CTL = cytotoxic T lymphocytes; TCM = T central memory cells; TEM = T effector memory cells; cDC = conventional dendritic cells; dnT = double negative T cells; gdT = γδ T cells; HSPC = hematopoietic stem and progenitor cells; ILC = circulating innate lymphoid cells; MAIT = mucosal-associated invariant T cells; NK = natural killer cells; pDC = plasmacytoid dendritic cells; Treg = T regulatory cells.
PBMC isolation
Briefly, whole blood was diluted with PBS (Mediatech 21–031-CM). The blood/PBS mixture was layered onto Ficoll-Paque (GE life science Cat# 17–1440-03) and centrifuged at 400 g for 30 min at room temperature. Following centrifugation, the supernatant was removed by aspiration, the PBMC layer was collected, and cells were washed twice with PBS. Red blood cells were removed through incubation for 5 min at room temperature in ACK Lysis Solution (Gibco Cat# A 10492–01). Cells were counted and underwent a final wash, followed by gentle addition of freezing medium (10% DMSO/90% FBS; Sigma D2650 and Atlas Biologicals Cat# F-0500-A) and aliquoting into vials. Vials were placed in −80C overnight and transferred to a liquid nitrogen freezer the following day.
Single-cell RNA-sequencing
Prior to scRNA-seq assays, cryopreserved vials were thawed rapidly (~30 s) in a 37 C water bath. RPMI (LifeTechnologies, MT15040CV) was added and vials were centrifuged at 400 g for 7 min. Supernatant was removed and the cell pellet was resuspended. Following another round of centrifugation at 400 g for 7 min, cells were counted and resuspended. Next, 5 µL of Human TruStain FcX Fc Blocking Reagent was added to the cells, followed by incubation for 10 min on ice, addition of 1 µL of TotalSeq C hashtag antibodies, and re-incubation for 30 min on ice. Cells were resuspended in 5 mL PBS and 1% BSA, centrifuged at 400 g for 10 min, and a final suspension was brought to ~3000 cells/µL.
Samples labeled with TotalSeq C hashtag antibodies were pooled together to generate mixtures of 5 samples per batch (total 8 batches). Pooled samples were loaded into a 10X Genomics microfluidic platform (Single Cell 5′ v2 Reagent Kit), targeting 12,000 – 16,000 cells per batch. Sequencing was performed on the NovaSeq6000 S4 flow cell targeting 50,000 reads per cell for the gene expression libraries and 5000 reads per cell for the feature barcode libraries. Libraries were processed according to manufacturer’s instructions.
The raw FASTQ files were aligned to the human genome (GRCh38) and an RNA count matrix was generated using CellRanger (v6.1.2). Count matrices were imported into R (v4.2.2) and postprocessing was performed using Seurat (v4.3).27 Ambient RNA was corrected for using DecontX (v1.0.0) at the batch level. Cells with nFeature_RNA and nCount_RNA greater than the 75th percentile + 1.5x the interquartile range (IQR) were removed from downstream analyses. Doublets were filtered using scDblFinder (v1.12.0) and cells with more than 10% of genes mapped to mitochondrial genes were removed. Batches were demultiplexed using the HTODemux function (Seurat v4.3).
TCR and immunoglobulin genes, which are highly variable, were removed to minimize their influence on downstream clustering. Each batch underwent normalization using scTransform v2 (v0.3.5). Principal components (PCs) were calculated using 3000 highly variable genes and corrected for batch effects using Harmony (v1.1).28 Using batch-corrected PCs, the nearest neighbors were calculated to generate a uniform manifold approximation and projection (UMAP). Clustering was performed using the Louvain algorithm at a resolution of 0.4. Cell type identification was performed using a combination of marker gene identification and reference mapping to a published cellular indexing of transcriptomes and epitopes by sequencing (CITE-seq) data set of PBMCs.29
We focused our comparisons on high-grade CAV (CAV-2 or CAV-3) versus absent or low-grade CAV (CAV-0 and CAV-1) due to recent data suggesting that patients with CAV-0 and CAV-1 have similar long-term risks of graft failure distinct from those with higher grades of CAV.30 Differences in cell composition were performed using Milo (v1.6.0).31 Milo tests for differential abundance within neighborhoods on the k-nearest neighbor (kNN) graph using a negative binomial generalized linear model. This approach does not rely on discrete clustering of cell types, allowing for the identification of subtle changes in neighborhoods within globally-annotated clusters along the continuous spectrum of PBMC differentiation. We constructed the kNN graph using k = 90, to target ~200–250 cells per neighborhood, and used 30 PCs (d = 30). This approach defined 9371 neighborhoods spread across all clusters. Differences in numbers of cells across samples within each neighborhood was normalized by trimmed mean of M-values. Differential abundance was tested in each neighborhood using the quasi-likelihood method in edgeR. Multiple testing correction is performed on nominal P-values through a weighted Benjamini-Hochberg method, as previously described.32 Neighborhoods were considered differentially abundant if they met a spatial false discovery rate (FDR)-adjusted P-value < 0.1.
As immune cells exist on a continuous spectrum of differentiation, we used miloDE (v0.0.0.9)33 – a cluster-free differential expression (DE) analysis framework – to increase sensitivity for DE gene detection. MiloDE assigns cells with homogenous transcriptomic profiles into neighborhoods using a 2nd order kNN graph on the batch-corrected Harmony embedding. We targeted a median of ~1000 cells per neighborhood and DE analyses were conducted within each neighborhood. After initial neighborhood assignment, we excluded neighborhoods that were unlikely to show any DE genes through utilization of a random forest classifier (excluding neighborhoods with area under the curve [AUC] ≤ 0.5), leaving 424 neighborhoods for DE testing and minimizing the penalty of multiple testing correction. Conditions were defined as 1) high-grade CAV (grouping CAV-2 and CAV-3 together; as compared with CAV-0 and CAV-1) and 2) CAV (grouping CAV-1, CAV-2, and CAV-3 together; as compared with CAV-0). DE analyses included age, gender, and prednisone use as covariates. Multiple testing correction was performed using the Benjamini-Hochberg method for all tested genes within each neighborhood and across neighborhoods. Genes were considered significantly DE if they met an FDR-adjusted P-value < 0.05. To identify co-regulated transcriptional programs, significantly DE genes in at least 2–4 neighborhoods were input into scWGCNA (v1.0) at an exploratory P-value threshold of 0.1 to detect gene modules. Pathway enrichment analyses, at both the pseudobulk (all DE genes within neighborhoods) and module levels, were performed using clusterProfiler (v4.6.2) with all tested genes as the background universe. The org.Hs.eg.db (v3.16.0) package was used for genome annotation and DOSE (v3.24.2) was used for ontology terms, with Biological Process (BP) terms prioritized. Multiple testing correction was performed using the Benjamini-Hochberg method. We intersected the DE genes with Tier 1 targets (i.e., targets of approved therapies and those in the clinical phase of study) supported by human genetic evidence25 to characterize cell-specific genes that may be potential targets for drug discovery or repurposing. For each DE gene and within each subcluster, we calculated the average log2foldchange and prioritized drug targets were considered significant if the corresponding genes were significantly DE (at an FDR < 0.05) in at least 2 neighborhoods within that cell type.
Single-cell T cell receptor analyses
BAM files generated after alignment with the human genome (GRCh38) were used to infer CDR3 sequences of TCRs using TRUST4 (v1.0.13).34 Annotation and quantification of TCR clonotypes was performed using scRepertoire (v2.0.3).35 The barcodes for each clone were intersected with barcodes from scRNA-seq at a batch level to filter down to high-quality T cells that passed scRNA-seq quality metrics, as described above. Nonproductive chains were removed. Proportional cut points for clonal frequencies were 1) rare (0 < X ≤ 0.0001), 2) small (0.0001 < X ≤ 0.001), 3) medium (0.001 < X ≤ 0.01), 4) large (0.01 < X ≤ 0.1), and 5) hyperexpanded (0.1 < X ≤ 1.0). Clonal diversity metrics included the Shannon, inverse Simpson, normalized entropy, Gini-Simpson, Chao1, and abundance-based coverage estimator (ACE) indices. The Kruskal-Wallis test was used to compare repertoire statistics across the four CAV groups, with a P-value < 0.05 considered statistically significant.
Data and code availability
To ensure scientific rigor and reproducibility, complete code used for analyses is available online at https://github.com/learning-MD/PBMC_CAV. Raw FASTQ files and the processed Seurat object are deposited at the National Institutes of Health/National Center for Biotechnology Gene Expression Omnibus data repository (GSE271408).
Results
A total of 40 HT recipients were prospectively enrolled in this study, with PBMC samples obtained a median of 61 months post-HT. Of these, 22 patients had angiographically-confirmed CAV: 13 with CAV-1, 3 with CAV-2, and 6 with CAV-3. There was no significant difference in median time from transplant between the CAV and non-CAV groups (71 ± 125 months in the CAV group vs 48.5 ± 55.2 months in the non-CAV group; P-value = 0.10). Additionally, there were no significant differences in major clinical characteristics between the two groups (Table 1). Detailed clinical characteristics are provided in Supplemental Table 1. Following single-cell isolation and sequencing, 134,984 cells passed quality control. We defined 8 major clusters and 31 subclusters (Figure 1B), using a combination of canonical marker genes and reference-mapping with a published CITE-seq study29 that quantified cell surface proteins for deep immune phenotyping (Figure 1C).
Table 1.
Clinical Characteristics of Heart Transplant Recipients
| Demographics by CAV status | No CAV (N = 18)a | Has CAV (N = 22)a | P-valueb |
|---|---|---|---|
| Age (years) | 53 (49, 66) | 53 (46, 63) | 0.7 |
| Gender(% female) | 8 (44%) | 10 (45%) | > 0.9 |
| Diabetes mellitus | 6 (33%) | 6 (27%) | 0.7 |
| Time since transplant (months) | 49 (23, 78) | 71 (29, 154) | 0.10 |
| CAV grade | < 0.001 | ||
| 0 | 18 (100%) | 0 (0%) | |
| 1 | 0 (0%) | 13 (59%) | |
| 2 | 0 (0%) | 3 (14%) | |
| 3 | 0 (0%) | 6 (27%) | |
| Class II DSAs | 3 (17%) | 7 (32%) | 0.5 |
| History of ACR | 3 (17%) | 9 (41%) | 0.10 |
| History of AMR | 3 (17%) | 5 (23%) | 0.7 |
| Prednisone use | 5 (28%) | 6 (27%) | > 0.9 |
| Calcineurin inhibitor use | 16 (89%) | 19 (86%) | > 0.9 |
| Antimetabolite use | 14 (78%) | 16 (73%) | > 0.9 |
| mTOR inhibitor use | 5 (28%) | 11 (50%) | 0.2 |
Median (IQR); n (%)
Wilcoxon rank sum test; Pearson’s Chi-squared test; Fisher’s exact test
We identified 79 differentially abundant neighborhoods at an FDR < 0.1. These subtle changes in cell composition included statistically significant increases in CD4+ T central memory cells (CD4+ TCM) and CD14+ and CD16+ monocytes in individuals with high-grade as compared to low grade CAV (Figure 2A). Detailed characteristics of all tested neighborhoods are provided in Supplemental Table 2. Comparing high-grade CAV with low-grade CAV, we identified 745 unique genes that were differentially expressed at an FDR < 0.05 (Figure 2B). These included genes critical for cytotoxic degranulation (NKG7, GNLY),36,37 interferon-responsiveness (IFI27, IFI44L, IFITM3, IFIT1, IFIT2, IFIT3, STAT1, CXCL10),38 and angiogenesis (VEGFA, VEGFC, FLT1, CXCL2),39 among others. In comparing all CAV (CAV-1, CAV-2, and CAV-3) against CAV-0, fewer genes were differentially expressed (250 genes, FDR < 0.05) between groups. The full list of genes, their log2FC, and P-values are in Supplemental Tables 3 and 4.
Figure 2.
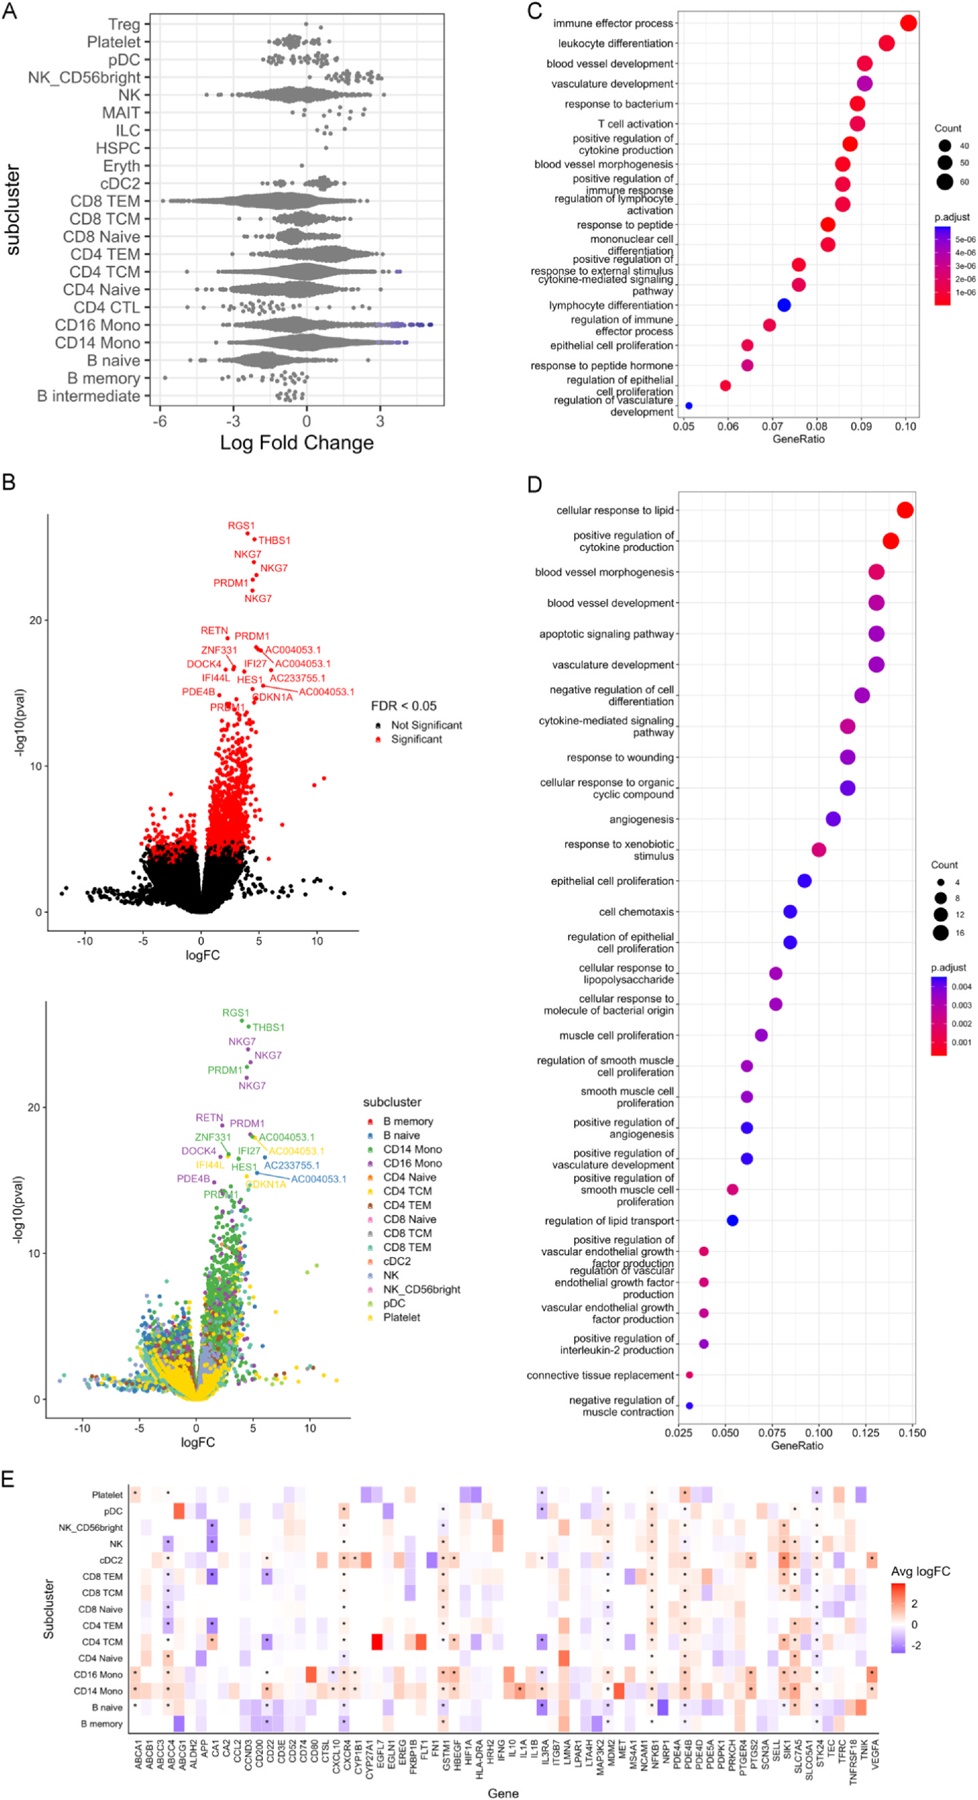
(A) Beeswarm plot of the distribution of log fold change between high-grade CAV (CAV-2 and CAV-3) and low-grade CAV (CAV-0 and CAV-1) according to neighborhoods within annotated subclusters. Neighborhoods are considered differentially abundant between conditions at an FDR < 0.1 and are colored blue if enriched in high-grade CAV and red if enriched in low-grade CAV. (B) Left: Volcano plot of differentially expressed genes between high-grade CAV and low-grade CAV. Positive logFC indicates higher expression in high-grade CAV while negative logFC indicates higher expression in low-grade CAV. Red color indicates genes that meet FDR < 0.05 after correction both within tested neighborhoods and across tested neighborhoods. Right: Volcano plot of differentially expressed genes between high-grade CAV and low-grade CAV. Positive logFC indicates higher expression in high-grade CAV while negative logFC indicates higher expression in low-grade CAV. Color of dots indicates the subcluster of the neighborhood within which each gene is differentially expressed. (C) Using all 745 differentially expressed genes in high-grade CAV, pathway enrichment analysis was performed for Biological Process terms using clusterProfiler (v4.6.2) with all tested genes as the background universe. (D) Module 7 in high-grade CAV, consists of 156 genes identified via single-cell WGCNA. These 156 genes were tested for pathway enrichment for Biological Process terms using all tested genes as the background universe. (E) Intersection of the 745 DE genes in high-grade CAV with the druggable genome prioritized 68 Tier 1 drugs (targets of approved drugs or those in clinical phase studies). This heatmap characterizes the cell-specific expression of these genes. * = genes that are DE in at least 2 neighborhoods within that subcluster.
Neighborhoods enriched for CD14+ and CD16+ monocytes highly expressed genes associated with cytotoxic degranulation (NKG7,37 GNLY36), chemokines and cytokines (e.g., CCL3L1,40 CCL4L2, IL1A,41 CXCL1, CXCL2,39 CXCR4, CXCL1042, and IL32, among others), and interferon-responsiveness (as described above). Both CD4 + and CD8 + T cells similarly expressed interferon-responsive genes and positive regulators of interferon-gamma (e.g., IFNG-AS1 in CD8 + T effector memory [TEM] cells). Furthermore, CD4+ TCMs exhibited markers of cytotoxicity (GZMH24) while CD8 + TEMs cells expressed markers of activation, expansion, and cytotoxicity (HLA-DRA, TNFRSF18, CFH, STAT1, etc.).24 Neighborhoods enriched for NK cells and dendritic cells highly expressed genes associated with inflammation (e.g., PRDM1), interferons and interferon-responsiveness (IFNG, IFNG-AS1, among others outlined above), and cell migration (e.g., RUFY3, SELL, etc.).24
Pathway enrichment analysis using all 745 unique DE genes in high-grade CAV showed enrichment for putative pathways in leukocyte differentiation, angiogenesis and the inflammatory response (Figure 2C). Subsequent single-cell WGCNA identified 8 modules of co-expressed genes in high-grade CAV of which 5 showed pathway enrichment in a cell-specific manner for biologically-plausible pathways (Supplemental Figure 1). Notably, module 4 (differentially-enriched across cell types) showed significant enrichment for pathways involved in immune responses to viral infection (Supplemental Figure 2A) and module 7 (consisting of 156 genes; most enriched in CD14+ and CD16+ monocytes) showed significant enrichment for pathways involved in inflammation, angiogenesis, vascular smooth muscle cell proliferation and wound healing (Figure 2D). Detailed lists of gene modules for the high-grade vs low-grade CAV and for CAV vs non-CAV comparisons are provided in Supplemental Table 5 and 6. Figures of module-specific pathway enrichment for high-grade versus low-grade CAV are provided in Supplemental Figure 2.
Intersection of the 745 significant DE genes in high-grade CAV with potentially druggable genes supported by human genetic evidence identified 68 targets (Figure 2E).25 These include interferons and interferon-responsive genes (NK cell expression of IFNG, CD14+ and CD16+ monocyte expression of IFIT1, naïve B cell expression of ISG15, etc.), CD16+ monocyte expression of IL1B, IL1RAP, and CD80, CD14+ monocyte expression of IL1A, IL1RAP, and ITGB7. Other targets include PDE4B and PTGS2, SCN3A (which encodes a voltage-gated sodium channel), NFKB1/NFKB1A, and VEGFA expressed by multiple cell types.
We then turned our attention toward understanding T cell clonal dynamics in CAV. Using TRUST434 to explore T cell clonal dynamics in CAV, we found no significant differences in the number of unique TCRs or TCR clonality across the spectrum of CAV grades (P-value > 0.05 for all comparisons by Kruskal-Wallis test; Figures 3A and 3B). Similarly, there were no significant differences across a wide array of diversity indices between the CAV groups, though several metrics had P-values < 0.1 by Kruskal-Wallis test (Shannon index P-value = 0.06, inverse Simpson P-value = 0.06, entropy P-value = 0.06, Gini-Simpson index P-value = 0.08, and ACE P-value = 0.08; Figure 3C).
Figure 3.
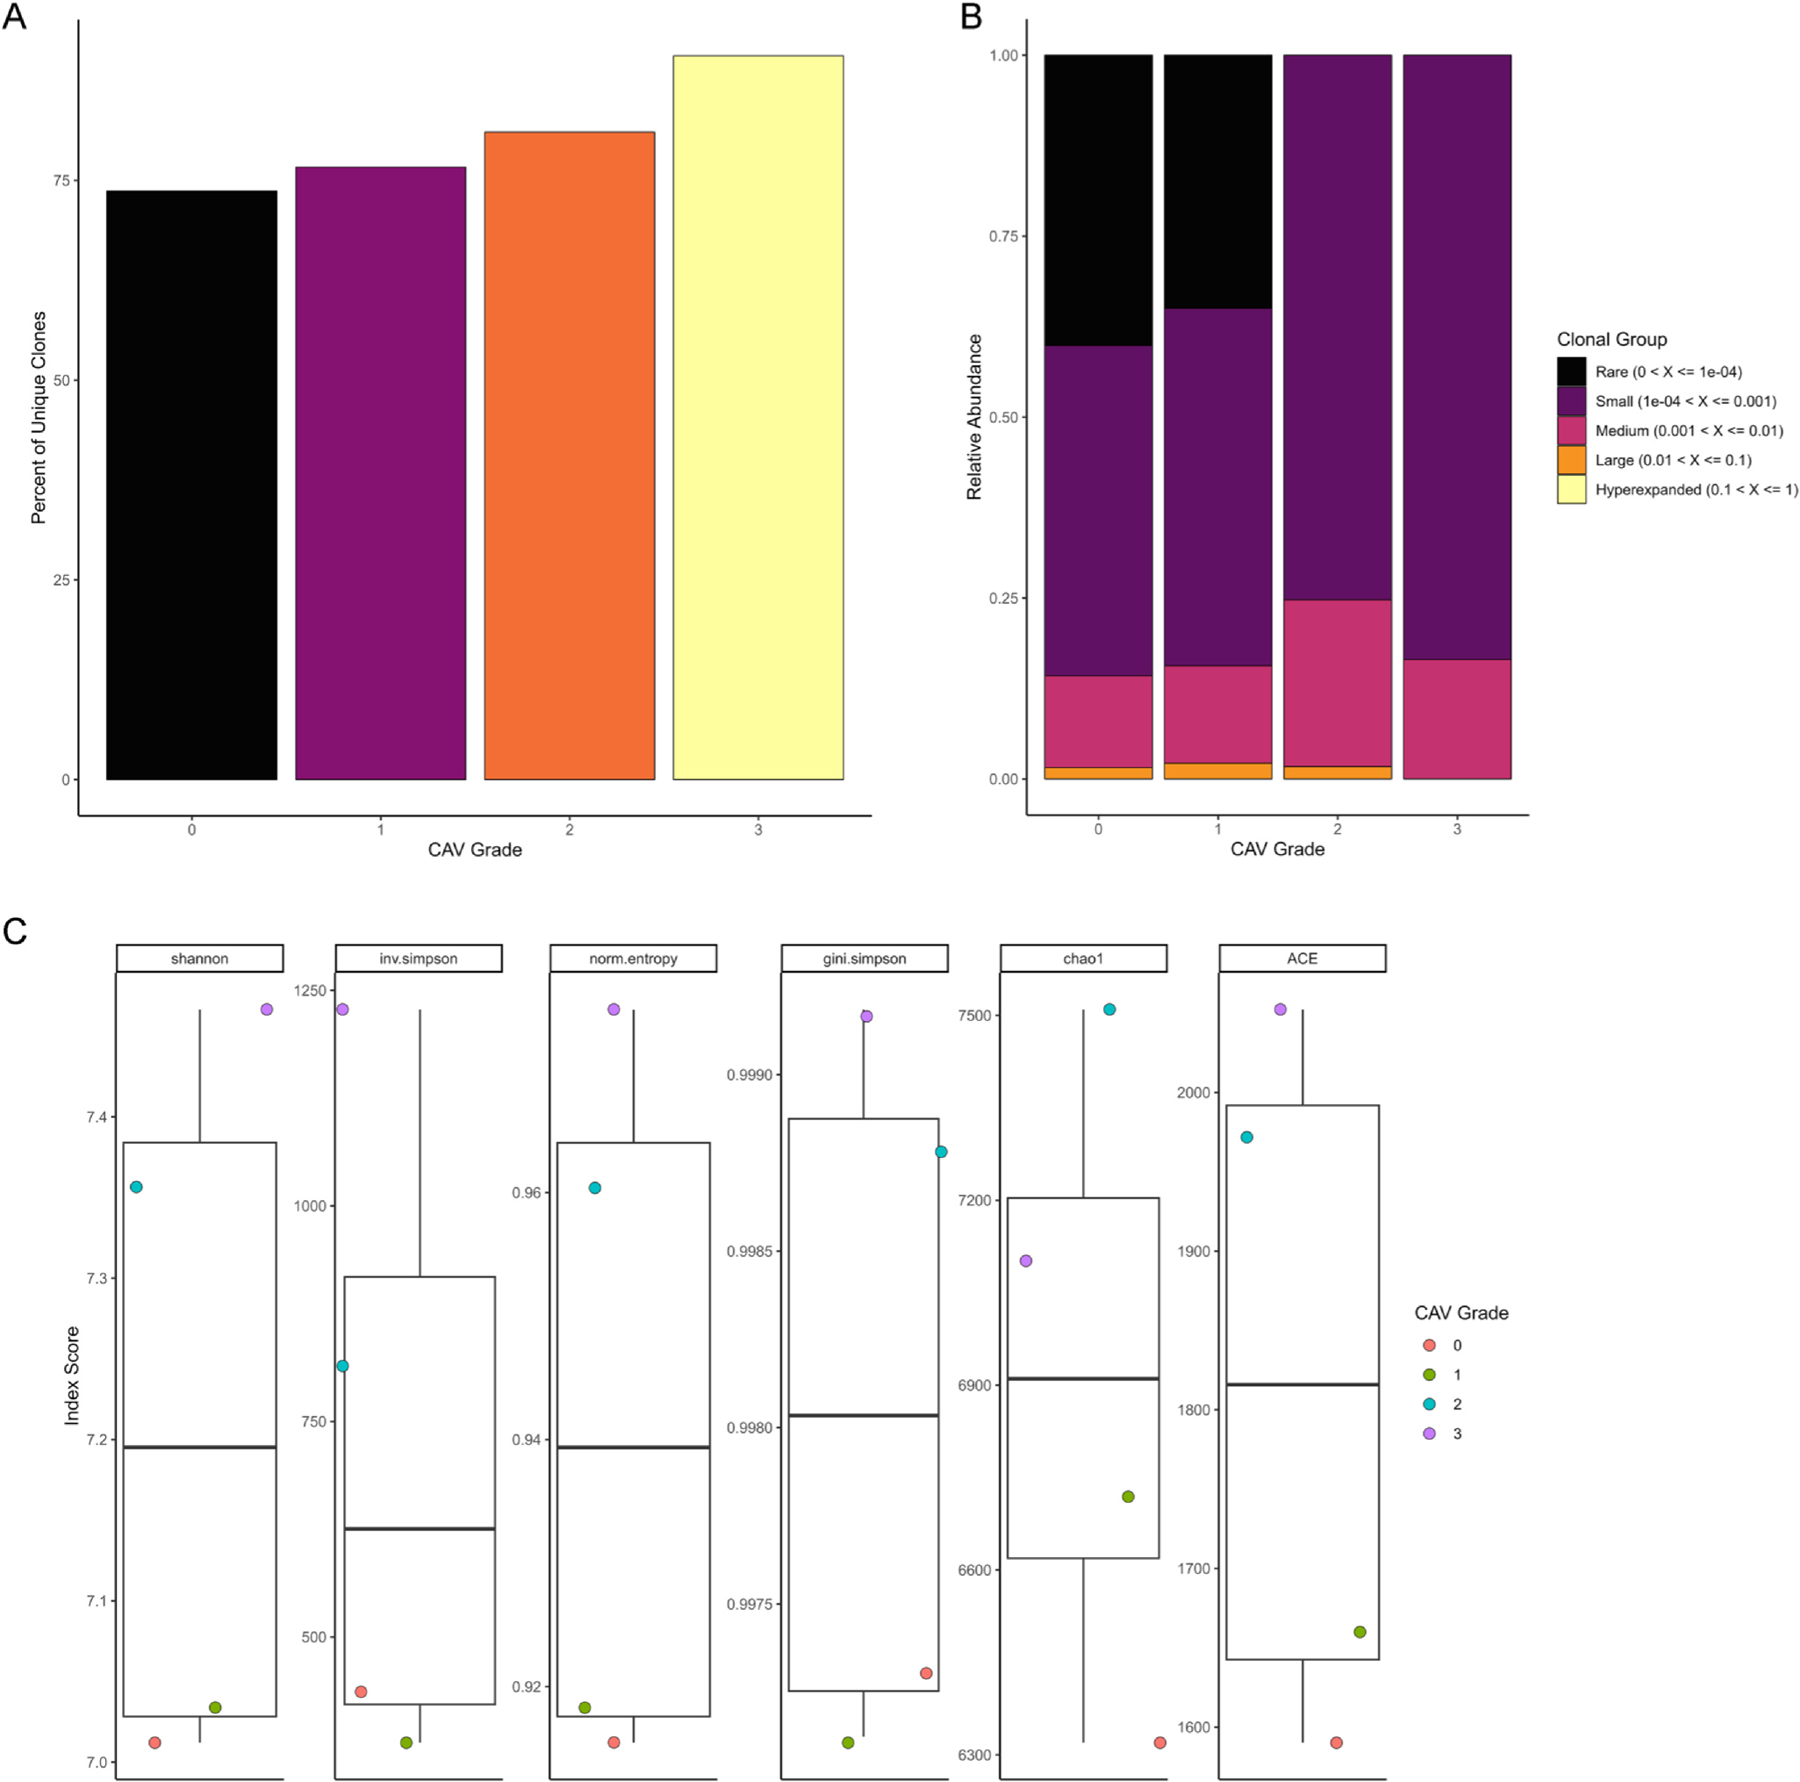
TCRs were reconstructed using TRUST4 and analyzed using scRepertoire. Using barcode matching with scRNA-seq, as described in the Methods section, ensured that TCR analyses only included T cells that passed rigorous quality control. (A) Total number of unique TCR clones according to CAV grading did not show any significant differences between groups (Kruskal-Wallis P-value > 0.05). (B) TCR clonality across the spectrum of CAV grading showed no significant differences across groups (Kruskal-Wallis P-value > 0.05). (C) TCR diversity was measured by the following indices: Shannon, inverse Simpson, normalized entropy, Gini-Simpson, Chao1, and ACE. No significant differences in TCR diversity were observed amongst the groups (Kruskal-Wallis P-value > 0.05 for all indices).
Discussion
To our knowledge, this is the first study to leverage single-cell multi-omics to comprehensively characterize cell-specific transcriptomic differences in HT recipients with and without high-grade CAV. We find that there are subtle, statistically significant increases in circulating CD4+ T central memory cells and CD14+ and CD16+ monocytes in high-grade as compared to absent or low-grade CAV. Further, we demonstrate 745 unique genes that are differentially expressed in high-grade CAV and are enriched for putative pathways involving inflammation, angiogenesis and vascular smooth muscle cell proliferation, consistent with our current biological understanding of CAV pathogenesis. Of these, 68 DE genes were prioritized for therapeutic targeting based on human genetics support. Importantly, these genes are differentially expressed despite adjustment for age, gender and prednisone use. Our findings suggest that the use of peripheral gene expression profiles may facilitate diagnosis of high- versus low-grade CAV, potentially obviating the need for invasive coronary angiography in the latter group. Furthermore, this unique dataset informs opportunities for drug discovery and repurposing to mitigate CAV and prolong allograft survival.
Prior studies have shown mixed results in the use of mRNAs and miRNAs for detection of CAV.5,6,11,16 For example, the success of a targeted 11-gene panel (i.e., Allomap) for surveillance for acute cellular rejection has not translated consistently to CAV diagnosis.16 The genes in this panel include those involved in glucocorticoid responses (IL1R2, FLT3, ITGAM), lymphocyte homing (ITGA4), immune checkpoints (PDCD1), and other non-specific pathways (MARCH8, WDR40A, PF4, C6orf25, RHOU, and SEMA7A).4 As CAV development is thought to be a more indolent process as compared to the acutely heightened inflammatory response that occurs in acute rejection, identification of changes in expression of only a small number of transcripts may be insufficient to characterize CAV. On the other hand, whole transcriptomic analysis at cellular resolution allows for unbiased identification of a large myriad of genes that may be associated with high-grade CAV. In our study, following adjustment for age, gender and steroid use, we were able to identify 745 genes spanning across multiple cell types that are uniquely DE in high-grade versus low-grade CAV. That these DE genes show enrichment in putative pathways involved in CAV pathogenesis indicates biologic plausibility of our results. In contrast, miRNAs showed early promise in a number of diseases as potential biomarkers but have not been consistently reproducible even in the same disease.5,6 In part, this may be due to challenges with sample storage, miRNA isolation and quantification, and bioinformatics methods for analyzing miRNA data.43 With mRNA, as in our study, there are robust pipelines for sample acquisition and storage, transcript quantification, and analyses.
Others have attempted to measure serum cytokine levels or proteomics from different body fluids to non-invasively diagnose CAV.7,9,10,17 However, serum cytokines are susceptible to significant fluctuations based on physiological changes, including diurnal variations, thus limiting their reproducibility even within the same individual over time.44,45 Proteomics approaches are primarily hampered by the need for targeted assays, which bias the results.46 With scRNA-seq, we measure mRNA transcripts across the whole transcriptome, which minimizes the bias associated with targeted platforms, whether using genomic, transcriptomic, or proteomic assays.
Beyond diagnosis, our findings may have implications for novel drug development or repurposing for the prevention and treatment of CAV, where a paucity of treatment options presently exist. Specifically, identification of single-cell transcriptomic signatures may prioritize druggable pathways, thereby increasing the probability of a drug successfully reaching phase III trials or being repurposed for a new disease indication.23,25,47 Through the intersection of the 745 DE genes we identified in high-grade CAV with published data on druggable targets with supporting human genetic, we were able to prioritize 68 targets, with several having already shown evidence in human cardiovascular disease. An example of targets prioritized through our approach are IL1A and IL1B, which encode IL1α and IL1β, respectively. These are critical mediators of inflammation and targeting IL1β signaling with canakinumab in patients with prior coronary artery disease and evidence of systemic inflammation, measured by elevated high-sensitivity C-reactive protein levels, has been shown to significantly reduce cardiovascular events.48 Directly relevant to HT and supporting our approach, as IL1β induces expression of IL-6,49 there is an ongoing multicenter phase II clinical trial studying the use of tocilizumab, a humanized monoclonal antibody targeting the IL-6 receptor, in HT (ALL-IN; NCT03644667). Targets prioritized through our approach may inform potential therapeutic approaches for testing in in vitro and in vivo studies, including repurposing of VEGF inhibitors, cyclooxygenase inhibitors, interferon gamma inhibitors, and others.
While the strength of our study is in the interrogation of the whole transcriptome at single-cell resolution, this work does have important limitations. First, our sample size includes only 40 HT recipients, which precludes us from splitting the cohort into derivation and validation cohorts. Larger studies will be needed to validate our results. Second, we used novel statistical approaches for DE analyses,33 which may be unfamiliar to some and require the use of scRNA-seq in order to identify small groups of cells that are perturbed in disease. These strategies (e.g., neighborhoods, metacells, etc.)33,50 increase sensitivity for detection of DE genes between conditions and are increasingly being used in the field of scRNA-seq. Finally, it remains unclear whether the cell-specific gene expression changes we identify precede development of angiographic CAV or are a manifestation of response to CAV. If the former is true, our findings offer the possibility of predicting future CAV development and progression, thereby identifying patients who may benefit from mTOR inhibitor therapy. If the latter is true, targets prioritized for druggability may offer novel avenues for interruption of CAV pathogenesis.
Our results suggest that unbiased whole transcriptomic analyses at the single-cell resolution may identify transcriptomic-based biomarkers of CAV, offering the possibility of earlier and less invasive CAV detection in heart transplantation. Ongoing work is needed to explore longitudinal scRNA-sequencing of PBMCs during the course of CAV development to identify the timing of divergent cell-specific gene expression patterns between patients who go on to develop high grade CAV and those who do not.
Supplementary Material
Funding
This study was funded by the Vanderbilt Trans-Institutional Programs. Dr. Amancherla is supported by the National Institutes of Health (NIH; K23HL166960), an International Society for Heart and Lung Transplantation Enduring Hearts Transplant Longevity Award, the Red Gates Foundation, and an AHA Career Development Award (#929347). Dr. Schlendorf and Mr. Chow are supported by the Red Gates Foundation. Dr. Freedman is supported in part by grants from the National Heart, Lung and Blood Institute (NHLBI). Dr. Rathmell is supported by the NIH (R01CA217987, R01DK105550, R01AI153167, and R01HL136664).
Footnotes
Conflict of interest statement
Dr. Rathmell is a founder and member of the scientific advisory board for Sitryx Therapeutics.
Appendix A. Supporting information
Supplemental data associated with this article can be found in the online version at doi:10.1016/j.healun.2024.11.017.
References
- 1.Khush KK, Cherikh WS, Chambers DC, et al. The International Thoracic Organ Transplant Registry of the International Society for Heart and Lung Transplantation: thirty-sixth adult heart transplantation report - 2019; focus theme: donor and recipient size match. J Heart Lung Transpl 2019;38:1056–66. 10.1016/j.healun.2019.08.004. [DOI] [PMC free article] [PubMed] [Google Scholar]
- 2.Mehra MR, Crespo-Leiro MG, Dipchand A, et al. International Society for Heart and Lung Transplantation working formulation of a standardized nomenclature for cardiac allograft vasculopathy-2010. J Heart Lung Transpl 2010;29:717–27. 10.1016/j.healun.2010.05.017. [DOI] [PubMed] [Google Scholar]
- 3.Al-Hijji MA, Lennon RJ, Gulati R, et al. Safety and risk of major complications with diagnostic cardiac catheterization. Circ Cardiovasc Inter 2019;12:e007791. 10.1161/CIRCINTERVENTIONS.119.007791. [DOI] [PubMed] [Google Scholar]
- 4.Pham MX, Teuteberg JJ, Kfoury AG, et al. Gene-expression profiling for rejection surveillance after cardiac transplantation. N Engl J Med 2010;362:1890–900. 10.1056/NEJMoa0912965. [DOI] [PubMed] [Google Scholar]
- 5.Singh N, Heggermont W, Fieuws S, Vanhaecke J, Van Cleemput J, De Geest B. Endothelium-enriched microRNAs as diagnostic biomarkers for cardiac allograft vasculopathy. J Heart Lung Transpl 2015;34:1376–84. 10.1016/j.healun.2015.06.008. [DOI] [PubMed] [Google Scholar]
- 6.Neumann A, Napp LC, Kleeberger JA, et al. MicroRNA 628–5p as a novel biomarker for cardiac allograft vasculopathy. Transplantation 2017;101:e26–33. 10.1097/TP.0000000000001477. [DOI] [PubMed] [Google Scholar]
- 7.Przybylek B, Boethig D, Neumann A, et al. Novel cytokine score and cardiac allograft vasculopathy. Am J Cardiol 2019;123:1114–9. 10.1016/j.amjcard.2018.12.034. [DOI] [PubMed] [Google Scholar]
- 8.Stehlik J, Armstrong B, Baran DA, et al. Early immune biomarkers and intermediate-term outcomes after heart transplantation: results of clinical trials in organ transplantation-18. Am J Transpl 2019;19:1518–28. 10.1111/ajt.15218. [DOI] [PMC free article] [PubMed] [Google Scholar]
- 9.Wei D, Trenson S, Van Keer JM, et al. The novel proteomic signature for cardiac allograft vasculopathy. ESC Heart Fail 2022;9:1216–27. 10.1002/ehf2.13796. [DOI] [PMC free article] [PubMed] [Google Scholar]
- 10.Dalsgaard RG, Clemmensen TS, Eiskjær H, Poulsen SH, Bjerre KP. Proteomics early after heart transplantation and relation to coronary intimal changes and prognosis. JHLT Open 2024;5. 10.1016/j.jhlto.2024.100110. [DOI] [PMC free article] [PubMed] [Google Scholar]
- 11.Deng MC, Eisen HJ, Mehra MR, et al. Noninvasive discrimination of rejection in cardiac allograft recipients using gene expression profiling. Am J Transpl 2006;6:150–60. 10.1111/j.1600-6143.2005.01175.x. [DOI] [PubMed] [Google Scholar]
- 12.Horwitz PA, Tsai EJ, Putt ME, et al. Detection of cardiac allograft rejection and response to immunosuppressive therapy with peripheral blood gene expression. Circulation 2004;110:3815–21. 10.1161/01.CIR.0000150539.72783.BF. [DOI] [PubMed] [Google Scholar]
- 13.Kobashigawa J, Patel J, Azarbal B, et al. Randomized pilot trial of gene expression profiling versus heart biopsy in the first year after heart transplant: early invasive monitoring attenuation through gene expression trial. Circ Heart Fail 2015;8:557–64. 10.1161/CIRCHEARTFAILURE.114.001658. [DOI] [PubMed] [Google Scholar]
- 14.Agbor-Enoh S, Shah P, Tunc I, et al. Cell-free DNA to detect heart allograft acute rejection. Circulation 2021;143:1184–97. 10.1161/CIRCULATIONAHA.120.049098. [DOI] [PMC free article] [PubMed] [Google Scholar]
- 15.Holzhauser L, Clerkin KJ, Fujino T, et al. Donor-derived cell-free DNA is associated with cardiac allograft vasculopathy. Clin Transpl 2021;35:e14206. 10.1111/ctr.14206. [DOI] [PMC free article] [PubMed] [Google Scholar]
- 16.Yamani MH, Taylor DO, Rodriguez ER, et al. Transplant vasculopathy is associated with increased AlloMap gene expression score. J Heart Lung Transpl 2007;26:403–6. 10.1016/j.healun.2006.12.011. [DOI] [PubMed] [Google Scholar]
- 17.Lin D, Cohen Freue G, Hollander Z, et al. Plasma protein biosignatures for detection of cardiac allograft vasculopathy. J Heart Lung Transpl 2013;32:723–33. 10.1016/j.healun.2013.04.011. [DOI] [PubMed] [Google Scholar]
- 18.Eisen HJ, Tuzcu EM, Dorent R, et al. Everolimus for the prevention of allograft rejection and vasculopathy in cardiac-transplant recipients. N Engl J Med 2003;349:847–58. 10.1056/NEJMoa022171. [DOI] [PubMed] [Google Scholar]
- 19.Lindenfeld J, Miller GG, Shakar SF, et al. Drug therapy in the heart transplant recipient: part II: immunosuppressive drugs. Circulation 2004;110:3858–65. 10.1161/01.CIR.0000150332.42276.69. [DOI] [PubMed] [Google Scholar]
- 20.Masetti M, Potena L, Nardozza M, et al. Differential effect of everolimus on progression of early and late cardiac allograft vasculopathy in current clinical practice. Am J Transpl 2013;13:1217–26. 10.1111/ajt.12208. [DOI] [PubMed] [Google Scholar]
- 21.Luc JGY, Choi JH, Rizvi SA, et al. Percutaneous coronary intervention versus coronary artery bypass grafting in heart transplant recipients with coronary allograft vasculopathy: a systematic review and meta-analysis of 1,520 patients. Ann Cardiothorac Surg 2018;7:19–30. 10.21037/acs.2018.01.10. [DOI] [PMC free article] [PubMed] [Google Scholar]
- 22.Goldraich LA, Stehlik J, Kucheryavaya AY, Edwards LB, Ross HJ. Retransplant and medical therapy for cardiac allograft vasculopathy: International Society for Heart and Lung Transplantation Registry Analysis. Am J Transpl 2016;16:301–9. 10.1111/ajt.13418. [DOI] [PubMed] [Google Scholar]
- 23.Dann E, Teeple E, Elmentaite R, et al. Single-cell RNA sequencing of human tissue supports successful drug targets. medRxiv 2024. [Google Scholar]
- 24.Szabo PA, Levitin HM, Miron M, et al. Single-cell transcriptomics of human T cells reveals tissue and activation signatures in health and disease. Nat Commun 2019;10:4706. 10.1038/s41467-019-12464-3. [DOI] [PMC free article] [PubMed] [Google Scholar]
- 25.Finan C, Gaulton A, Kruger FA, et al. The druggable genome and support for target identification and validation in drug development. Sci Transl Med 2017;9. 10.1126/scitranslmed.aag1166. [DOI] [PMC free article] [PubMed] [Google Scholar]
- 26.Amancherla K, Qin J, Hulke ML, et al. Single-nuclear RNA sequencing of endomyocardial biopsies identifies persistence of donor-recipient chimerism with distinct signatures in severe cardiac allograft vasculopathy. Circ Heart Fail 2023;16:e010119. 10.1161/CIRCHEARTFAILURE.122.010119. [DOI] [PMC free article] [PubMed] [Google Scholar]
- 27.Butler A, Hoffman P, Smibert P, Papalexi E, Satija R. Integrating single-cell transcriptomic data across different conditions, technologies, and species. Nat Biotechnol 2018;36:411–20. 10.1038/nbt.4096. [DOI] [PMC free article] [PubMed] [Google Scholar]
- 28.Korsunsky I, Millard N, Fan J, et al. Fast, sensitive and accurate integration of single-cell data with harmony. Nat Methods 2019;16:1289–96. 10.1038/s41592-019-0619-0. [DOI] [PMC free article] [PubMed] [Google Scholar]
- 29.Hao Y, Hao S, Andersen-Nissen E, et al. Integrated analysis of multimodal single-cell data. Cell 2021;184:3573–3587 e3529. 10.1016/j.cell.2021.04.048. [DOI] [PMC free article] [PubMed] [Google Scholar]
- 30.Van Keer JM, Van Aelst LNL, Rega F, et al. Long-term outcome of cardiac allograft vasculopathy: importance of the International Society for Heart and Lung Transplantation angiographic grading scale. J Heart Lung Transpl 2019;38:1189–96. 10.1016/j.healun.2019.08.005. [DOI] [PubMed] [Google Scholar]
- 31.Dann E, Henderson NC, Teichmann SA, Morgan MD, Marioni JC. Differential abundance testing on single-cell data using k-nearest neighbor graphs. Nat Biotechnol 2022;40:245–53. 10.1038/s41587-021-01033-z. [DOI] [PMC free article] [PubMed] [Google Scholar]
- 32.Lun ATL, Richard AC, Marioni JC. Testing for differential abundance in mass cytometry data. Nat Methods 2017;14:707–9. 10.1038/nmeth.4295. [DOI] [PMC free article] [PubMed] [Google Scholar]
- 33.Missarova A, Dann E, Rosen L, Satija R, Marioni J. Sensitive cluster-free differential expression testing. bioRxiv 2023. 10.1101/2023.03.08.531744. [DOI] [Google Scholar]
- 34.Song L, Cohen D, Ouyang Z, Cao Y, Hu X, Liu XS. TRUST4: immune repertoire reconstruction from bulk and single-cell RNA-seq data. Nat Methods 2021;18:627–30. 10.1038/s41592-021-01142-2. [DOI] [PMC free article] [PubMed] [Google Scholar]
- 35.Borcherding N, Bormann NL, Kraus G. scRepertoire: an R-based toolkit for single-cell immune receptor analysis. F1000Res 2020;9:47. 10.12688/f1000research.22139.2. [DOI] [PMC free article] [PubMed] [Google Scholar]
- 36.Ashokkumar C, Ningappa M, Ranganathan S, et al. Increased expression of peripheral blood leukocyte genes implicate CD14+ tissue macrophages in cellular intestine allograft rejection. Am J Pathol 2011;179:1929–38. 10.1016/j.ajpath.2011.06.040. [DOI] [PMC free article] [PubMed] [Google Scholar]
- 37.Ng SS, De Labastida Rivera F, Yan J, et al. The NK cell granule protein NKG7 regulates cytotoxic granule exocytosis and inflammation. Nat Immunol 2020;21:1205–18. 10.1038/s41590-020-0758-6. [DOI] [PMC free article] [PubMed] [Google Scholar]
- 38.Schneider WM, Chevillotte MD, Rice CM. Interferon-stimulated genes: a complex web of host defenses. Annu Rev Immunol 2014;32:513–45. 10.1146/annurev-immunol-032713-120231. [DOI] [PMC free article] [PubMed] [Google Scholar]
- 39.Schweighofer B, Testori J, Sturtzel C, et al. The VEGF-induced transcriptional response comprises gene clusters at the crossroad of angiogenesis and inflammation. Thromb Haemost 2009;102:544–54. 10.1160/TH08-12-0830. [DOI] [PMC free article] [PubMed] [Google Scholar]
- 40.Li H, Xie HY, Zhou L, et al. Copy number variation in CCL3L1 gene is associated with susceptibility to acute rejection in patients after liver transplantation. Clin Transpl 2012;26:314–21. 10.1111/j.1399-0012.2011.01486.x. [DOI] [PubMed] [Google Scholar]
- 41.Weigt SS, Palchevskiy V, Belperio JA. Inflammasomes and IL-1 biology in the pathogenesis of allograft dysfunction. J Clin Invest 2017;127:2022–9. 10.1172/JCI93537. [DOI] [PMC free article] [PubMed] [Google Scholar]
- 42.Agostini C, Calabrese F, Rea F, et al. Cxcr3 and its ligand CXCL10 are expressed by inflammatory cells infiltrating lung allografts and mediate chemotaxis of T cells at sites of rejection. Am J Pathol 2001;158:1703–11. 10.1016/S0002-9440(10)64126-0. [DOI] [PMC free article] [PubMed] [Google Scholar]
- 43.Saliminejad K, Khorram Khorshid HR, Ghaffari SH. Why have microRNA biomarkers not been translated from bench to clinic? Future Oncol 2019;15:801–3. 10.2217/fon-2018-0812. [DOI] [PubMed] [Google Scholar]
- 44.Nakao A Temporal regulation of cytokines by the circadian clock. J Immunol Res 2014;2014:614529. 10.1155/2014/614529. [DOI] [PMC free article] [PubMed] [Google Scholar]
- 45.Cuesta M, Boudreau P, Dubeau-Laramee G, Cermakian N, Boivin DB. Simulated night shift disrupts circadian rhythms of immune functions in humans. J Immunol 2016;196:2466–75. 10.4049/jimmunol.1502422. [DOI] [PubMed] [Google Scholar]
- 46.Almufleh A, Zhang L, Mielniczuk LM, et al. Biomarker discovery in cardiac allograft vasculopathy using targeted aptamer proteomics. Clin Transpl 2020;34:e13765. 10.1111/ctr.13765. [DOI] [PubMed] [Google Scholar]
- 47.Minikel EV, Painter JL, Dong CC, Nelson MR. Refining the impact of genetic evidence on clinical success. Nature 2024;629:624–9. 10.1038/s41586-024-07316-0. [DOI] [PMC free article] [PubMed] [Google Scholar]
- 48.Ridker PM, Everett BM, Thuren T, et al. Antiinflammatory therapy with canakinumab for atherosclerotic disease. N Engl J Med 2017;377:1119–31. 10.1056/NEJMoa1707914. [DOI] [PubMed] [Google Scholar]
- 49.Ridker PM, Rane M. Interleukin-6 signaling and anti-interleukin-6 therapeutics in cardiovascular disease. Circ Res 2021;128:1728–46. 10.1161/CIRCRESAHA.121.319077. [DOI] [PubMed] [Google Scholar]
- 50.Persad S, Choo ZN, Dien C, et al. SEACells infers transcriptional and epigenomic cellular states from single-cell genomics data. Nat Biotechnol 2023;41:1746–57. 10.1038/s41587-023-01716-9. [DOI] [PMC free article] [PubMed] [Google Scholar]
Associated Data
This section collects any data citations, data availability statements, or supplementary materials included in this article.
Supplementary Materials
Data Availability Statement
To ensure scientific rigor and reproducibility, complete code used for analyses is available online at https://github.com/learning-MD/PBMC_CAV. Raw FASTQ files and the processed Seurat object are deposited at the National Institutes of Health/National Center for Biotechnology Gene Expression Omnibus data repository (GSE271408).