

ABSTRACT
Ficolin 3 (FCN3) is a pattern recognition molecule that activates the complement system via the lectin pathway. While its immunological roles are known, the specific mechanisms by which FCN3 affects cholangiocarcinoma (CCA) pathogenesis remain unclear. In this study, we investigated FCN3 expression in CCA and benign cells, as well as tumor versus non‐tumor tissues, using RT‐qPCR and Western blotting analyses. The effects of FCN3 on CCA cell proliferation, migration, and invasion were analyzed through CCK‐8, EdU, transwell, and wound‐healing assays, with in vivo studies supporting these findings. The complement‐mediated cytotoxicity of CCA cells was assessed using human serum with or without heat inactivation and an anti‐C6 blocking antibody. Immunocytochemical staining was used to examine membrane attack complex (MAC) deposition, and an immunoprecipitation assay was adopted to evaluate the interaction between FCN3 and MASP family members. The role of FCN3 in inducing necroptosis was explored through transmission electron microscopy (TEM) and Western blotting analysis, focusing on the RIPK1/RIPK3/MLKL pathway. The results of the study demonstrate that FCN3 expression was significantly lower in CCA cells and tissues. Overexpressing FCN3 suppressed cell proliferation and migration, enhanced complement‐mediated cytotoxicity via MASP2 binding, and increased MAC deposition. FCN3 also induced necroptosis through activating the RIPK1/RIPK3/MLKL pathway. These results highlight FCN3 as a tumor suppressor in CCA and suggest its potential as a therapeutic target for this malignancy.
Keywords: cholangiocarcinoma, complement activation, ficolin‐3, membrane attack complex, necroptosis
FCN3‐mediated activation of the lectin complement pathway via MASP2 binding induces necroptosis in cholangiocarcinoma cells through the RIPK1/RIPK3/MLKL axis.

1. Introduction
Cholangiocarcinoma (CCA) is a highly heterogeneous and deadly malignancy of the biliary system, characterized by a high mortality rate and poor prognosis [1]. The global incidence and mortality rates of CCA have been rising steadily each year, with the 5‐year survival rate ranging from a mere 7%–20% [2]. This underscores an urgent need to explore new molecular mechanisms to enhance current therapeutic approaches for CCA.
Ficolin 3 (FCN3) is recognized as one of the most potent activators in the lectin pathway of complement activation. It specifically binds to polysaccharides on pathogen surfaces, thereby activating the mannose‐binding lectin (MBL) pathway, which leads to the formation of the membrane attack complex (MAC, C5b‐9). This complex disrupts the pathogen membrane by forming pores, resulting in cell lysis and death [3, 4]. Moreover, FCN3 is closely associated with immune cell infiltration, immune evasion, and enhanced phagocytosis by binding to apoptotic or necrotic cells [5, 6]. However, the involvement of FCN3 in the pathogenesis of CCA remains inadequately understood, necessitating further exploration.
In this study, we confirmed that the expression of FCN3 was significantly downregulated in CCA cells and tissues at both the mRNA and protein levels. Notably, overexpression of FCN3 markedly suppressed the proliferation, migration, and colony‐forming abilities of CCA cells, both in vitro and in vivo. Furthermore, FCN3 was found to bind to mannose‐binding lectin‐associated serine protease 2 (MASP2), thereby activating the MBL complement pathway, which enhanced the cytotoxic effect of human serum on CCA cells. Additionally, FCN3 was shown to induce necroptosis in CCA cells via the receptor‐interacting protein kinase 1 (RIPK1)/RIPK3/mixed lineage kinase domain‐like protein (MLKL) signaling pathway, suggesting its potential role as a tumor suppressor gene in CCA.
2. Materials and Methods
2.1. Sample Acquisition
Ten pairs of CCA tumor tissues and their corresponding adjacent non‐tumor tissues were collected from patients undergoing surgical procedures in the Department of Hepatobiliary Surgery at Qilu Hospital of Shandong University. All samples followed strict screening criteria: (a) only those pathologically confirmed as CCA based on histopathological diagnosis were included, (b) CCA samples without prior chemotherapy or radiotherapy were selected. All participants provided written informed consent. The study was conducted in accordance with the ethical standards outlined in the Declaration of Helsinki and received approval from the Ethics Committee of Qilu Hospital, Shandong University.
2.2. Cell Culture and Transfection
Human intrahepatic biliary epithelial cells (HIBEpiCs) and CCA cell lines (TFK1 and QBC939) were obtained from the Cell Bank of the Chinese Academy of Sciences. Cells were maintained in RPMI‐1640 (Gibco, Austria) medium supplemented with 10% fetal bovine serum (FBS) (Gibco, Austria) and 1% penicillin–streptomycin (Solarbio, China) at 37°C in a humidified atmosphere containing 5% CO2. Lentiviral vectors for the overexpression of FCN3 and shRNA constructs for FCN3 knockdown were procured from GeneChem. Stable cell lines overexpressing FCN3 (FCN3‐OE) and those with FCN3 knockdown (FCN3‐shRNA) were established through selective culture in a puromycin‐containing medium, along with their respective controls (FCN3‐CT and FCN3‐shRNA‐Control).
2.3. RNA Extraction and RT‐qPCR
Total RNA was extracted from both tissues and cultured cells using TRIzol or TRIzol LS reagent (Invitrogen, China). The purity and concentration of the extracted RNA were measured using a NanoDrop spectrophotometer. Reverse transcription followed by RT‐qPCR was performed subsequently, with β‐actin serving as an internal control. PCR primers utilized in this study were synthesized by BioSune Biotechnology. Relative gene expression levels were calculated using the 2−ΔΔCt method.
2.4. Western Blotting Analysis
Total protein was extracted from cell and tissue samples using RIPA buffer supplemented with PMSF, a protease inhibitor, and a phosphatase inhibitor (Beyotime, China). Protein concentrations were quantified using the BCA assay. Proteins were then separated by sodium dodecyl‐sulfate polyacrylamide gel electrophoresis (SDS‐PAGE), transferred onto PVDF membranes, and blocked to prevent non‐specific binding. Membranes were sequentially incubated with primary and secondary antibodies, with unbound antibodies being washed off between steps. Immunoreactive bands were visualized and analyzed using a chemiluminescence detection system.
2.5. Cell Proliferation, Migration, and Colony Formation Assays
The Cell Counting Kit‐8 (CCK‐8) (Elabscience, China) assay was employed to assess the proliferation capability of CCA cells (FCN3‐CT, FCN3‐OE, FCN3‐shRNA‐Control, and FCN3‐shRNA). Cells were seeded into 96‐well plates, followed by the addition of CCK‐8 reagent and incubation for 2 h. Absorbance was measured at 450 nm using a microplate reader. Cell proliferation was monitored at 24, 48, 72, 96, and 120 h.
EdU assays were conducted using the Yefluor 488 EdU Imaging Kit (Yeasen, China). Actively proliferating cells were stained with EdU (red fluorescence), while Hoechst stain (blue fluorescence) was used to visualize nuclei. The proliferation rate was determined based on the ratio of red fluorescence to blue fluorescence.
For migration assays, 1 × 10⁵ CCA cells were suspended in 200 μL of serum‐free RPMI‐1640 medium and added to the upper chamber of a transwell insert (8‐μm pore size, Costar; Corning). The lower chamber was filled with RPMI‐1640 medium containing 20% FBS. After 36 h of incubation at 37°C, cells that migrated through the membrane were fixed, stained, and counted under an inverted light microscope (Olympus, Japan) in five randomly selected fields.
The scratch wound‐healing assay was performed by seeding CCA cells into a 6‐well plate until confluence. A straight‐line scratch was made on the cell monolayer using a sterile 200‐μL pipette tip. The scratch closure was observed and photographed at 0 and 24 h using a microscope to evaluate cell migration.
For the colony formation assay, 1000 CCA cells were seeded in a 6‐well plate and cultured at 37°C in a 5% CO2 incubator for 10–14 days. After the incubation period, the cells were fixed, stained, and air‐dried. The number of colonies formed was then observed and counted under a microscope.
2.6. Cytotoxicity Mediated by Human Serum Complement
CCA cells (TFK1, QBC939; 1 × 10⁵ cells) were seeded in 1.5‐mL microcentrifuge tubes to evaluate cytotoxicity mediated by human serum complement. Four experimental groups were established: human pooled AB serum (HPS), heat‐inactivated HPS (Hi‐HPS) (complement inactivated by heating the serum at 56°C for 30 min), anti‐mouse IgG (abcam, UK) combined with HPS, and anti‐C6 blocking antibody (Hycult Biotech, USA) combined with HPS. Each group was incubated at 37°C for 1 h, followed by staining with trypan blue or propidium iodide to assess cell lysis. Cell lysis levels in each group were then compared under a microscope.
To further investigate the role of FCN3 in complement‐mediated cytotoxicity against CCA cells, 1 × 10⁵ FCN3‐CT and FCN3‐OE CCA cells were inoculated in 1.5‐mL microcentrifuge tubes, and the same experimental groups and procedures were applied as described above.
2.7. Co‐Immunoprecipitation (Co‐IP)
For Co‐IP, FCN3‐OE cells were lysed in pre‐cooled RIPA buffer, and the lysate was centrifuged to obtain the supernatant. Protein A agarose beads were used to pre‐clear the supernatant to eliminate non‐specific binding. The supernatant was then divided into two parts, followed by the addition of either anti‐FCN3 antibody (HUABIO, China) or rabbit anti‐IgG antibody (abcam, UK) to form antibody–antigen complexes. After overnight incubation, protein A agarose beads were added to capture the antibody–antigen complexes. The protein‐antibody complexes were then eluted with elution buffer, boiled, and analyzed using SDS‐PAGE.
2.8. Immunofluorescence (IF)
For IF analysis, 1 × 10⁶ CCA cells (FCN3‐CT, FCN3‐OE) were seeded onto coverslips and cultured until they reached an appropriate density. The cells were then fixed and blocked. Next, anti‐C3b (Proteintech, USA) or anti‐C5b‐9 primary antibodies (abcam, UK) were added and incubated at 4°C overnight. The following day, fluorescence‐labeled goat anti‐rabbit secondary antibodies (abcam, UK) were applied and incubated at room temperature for 1 h, protected from light, followed by DAPI staining. Images were captured using fluorescence microscopy, and the expression and localization of C3b or C5b‐9 in each group were analyzed based on fluorescence signals.
2.9. Tumor Formation in Nude Mice
A cell suspension containing 1 × 10⁶ CCA cells per 100 μL (FCN3‐CT, FCN3‐OE, FCN3‐shRNA‐Control, FCN3‐shRNA) was subcutaneously injected into the right dorsal region of 4‐week‐old nude mice. Tumor growth was monitored every 3 days by measuring the longest and shortest diameters, and tumor volume was calculated using the formula: V = 0.5 × long diameter × short diameter2. When the tumors reached the predetermined size (V < 2000 mm3) after 5 weeks of growth, the mice were humanely euthanized by cervical dislocation. The tumors were then excised, and their weight and volume were documented. The collected tumor tissues were subsequently subjected to immunohistochemical (IHC) analysis, Western blotting analysis, and RT‐qPCR. All experimental procedures were approved by the Ethics Committee of Qilu Hospital, Shandong University.
2.10. IHC
Tumor tissues harvested from nude mice were fixed, embedded in paraffin, sectioned, baked, deparaffinized, rehydrated, and subjected to microwave heating for antigen retrieval. Endogenous peroxidase activity was blocked using 3% hydrogen peroxide, followed by overnight incubation at 4°C with an anti‐Ki‐67 primary antibody (abcam, UK). The following day, the sections were incubated with an HRP‐conjugated goat anti‐rabbit secondary antibody (abcam, UK) for 30 min. The DAB kit was used for chromogenic detection, and the slides were counterstained with hematoxylin.
2.11. Statistical Analysis
Data were analyzed using SPSS 2.0 and GraphPad Prism 8.0 software. Statistical comparisons were performed using Student's t‐test and one‐way analysis of variance (ANOVA). All experiments were conducted in triplicate or more, and a p‐value of less than 0.05 was considered statistically significant.
3. Results
3.1. Expression of FCN3 in CCA Cells and Tissues
The mRNA and protein expression levels of FCN3 were found to be significantly reduced in CCA cell lines, TFK1 and QBC939, compared to HIBEpiCs. Similarly, in CCA tissues, the expression of FCN3 at the mRNA and protein levels was markedly downregulated when compared to adjacent non‐tumor tissues (Figure 1A–D). To further validate these findings, RNA sequencing data from 147 CCA tumor tissues and 98 adjacent non‐tumor tissues, obtained from the GEO database (GSE26566, GSE144521), were analyzed, confirming that FCN3 expression was substantially downregulated in CCA tumor tissues (Figure 1E).
FIGURE 1.
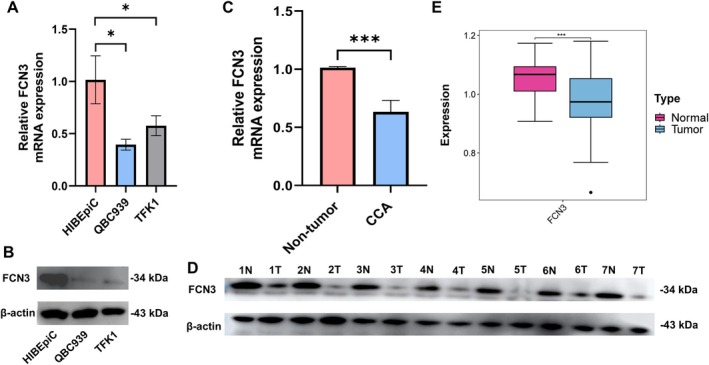
The expression of FCN3 in CCA cells and tissues. The differential expression of FCN3 at the mRNA and protein levels between benign and tumor cells (A, B), between adjacent non‐tumor and CCA tissues (C, D) by RT‐qPCR (10 paired) and Western blotting analysis (7 paired). (E) The differential expression of FCN3 at the mRNA level between 147 adjacent non‐tumor and 98 CCA tissues in the GEO dataset. *p < 0.05; ***p < 0.001.
3.2. FCN3 Significantly Inhibits Proliferation, Migration, and Clonal Formation of CCA Cells In Vitro
CCA cell lines with either overexpression or knockdown of FCN3, along with their respective controls (FCN3‐CT, FCN3‐OE, FCN3‐shRNA‐Control, FCN3‐shRNA), were successfully constructed. The efficiency of these transfections was confirmed using Western blotting analysis and RT‐qPCR (Figure S1A–D). Both CCK‐8 and EDU assays demonstrated that FCN3 overexpression significantly inhibited the proliferation of CCA cells, whereas FCN3 knockdown produced the opposite effect (Figure 2A,B). Additionally, Transwell, scratch, and colony formation experiments confirmed that FCN3 overexpression suppressed the migratory and clonal formation abilities of CCA cells (Figure 2C–E).
FIGURE 2.

FCN3 significantly inhibits proliferation, migration, and clonal formation of CCA cells in vitro. Overexpression of FCN3 inhibited the proliferation, migration, and clonal formation of TFK1 and QBC939 shown by CCK‐8 (A), EDU (B), Transwell (C), scratch wound‐healing (D), and clone formation assays (E). ***p < 0.001.
3.3. FCN3 Significantly Inhibits CCA Cell Growth In Vivo
To assess the effect of FCN3 on tumor growth in vivo, FCN3‐overexpressing cells, FCN3‐depleted cells, and their respective control cells were subcutaneously injected into nude mice. The results showed that both tumor weight and volume were significantly lower in the FCN3 overexpression (FCN3‐OE) group compared to the control group (Figure 3A,B). Conversely, the FCN3 knockdown group exhibited a significant increase in tumor weight and volume compared to the control group (Figure 3C,D). Furthermore, the expression of FCN3 at the mRNA and protein levels in the tumor tissues of nude mice was confirmed by RT‐qPCR and Western blotting analysis (Figure 3E,F). IHC analysis also demonstrated that the level of Ki‐67, a marker of cell proliferation, was significantly lower in the FCN3‐OE group than in the control group, whereas the opposite trend was observed in the FCN3 knockdown group. These findings suggested that FCN3 inhibited the proliferation of CCA cells in vivo (Figure 3G).
FIGURE 3.

FCN3 significantly inhibits the tumor formation of CCA cells in vivo. Real‐time comparison images of tumors formed by TFK1 and QBC939 groups FCN3 overexpression (A), knockdown (C), and matched control cells in nude mice. Statistical maps of tumor volume and weight in nude mice (B, D). The expression differences of FCN3 at the mRNA and protein levels between the overexpression group, knockdown group, and their respective control groups in tumor tissues of nude mice were detected by RT‐qPCR (E) and Western blotting analysis (F). The impact of FCN3 overexpression and knockdown on the proliferation levels of tumor tissues in nude mice was analyzed by IHC (G). **p < 0.01; ***p < 0.001.
3.4. CCA Cell Transcriptome Sequencing
To further elucidate the molecular mechanisms by which FCN3 affected CCA, transcriptome sequencing was performed on TFK1 cells with FCN3 overexpression (FCN3‐OE) and their control counterparts. A total of 208 differentially expressed genes were identified between the two groups. KEGG pathway enrichment analysis revealed that complement activation was the most significantly enriched pathway, consistent with the enrichment results from both the GO and KEGG databases for FCN3 (Figure 4A–C). These findings suggested that FCN3 might function as a tumor suppressor gene in CCA by activating the complement pathway.
FIGURE 4.

Enrichment pathway analyses. KEGG pathway analysis were performed using R code based on 208 differential genes obtained by transcriptome sequencing (A), GO (B) and KEGG databases (C).
3.5. Sensitivity of CCA Cells to Human Serum Complement‐Mediated Cytolysis
To determine the sensitivity of CCA cells to complement‐mediated cytotoxicity, human pooled AB serum (HPS) was used to perform cytolysis experiments on CCA cells. The results indicated that the HPS group had a significantly higher number of trypan blue‐positive cells compared to the heat‐inactivated HPS (Hi‐HPS) group, suggesting effective complement‐mediated cell lysis. Notably, the cell lysis activity was markedly inhibited by the anti‐C6 blocking antibody (Figure 5A).
FIGURE 5.
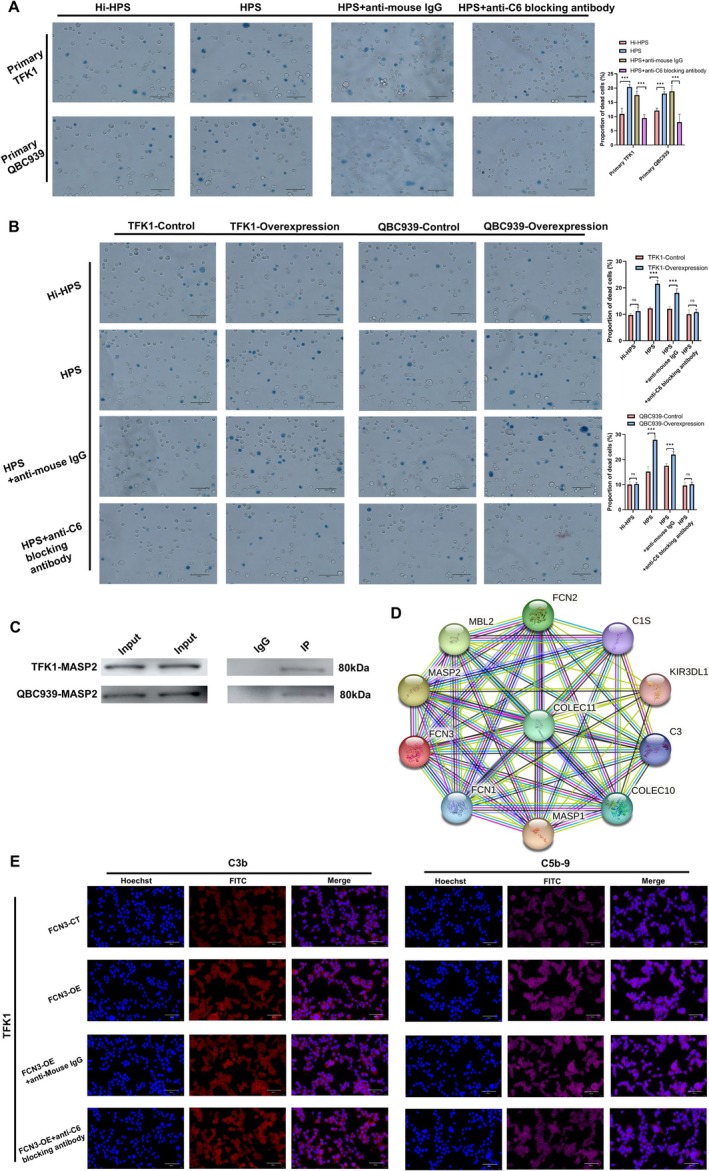
FCN3 activates complement by binding MASP2 and promotes human serum complement‐mediated cytolysis on CCA cells. (A) The sensitivity of primary CCA cells to complement‐mediated killing was validated using a human serum complement‐mediated cytotoxicity assay. (B) Overexpression of FCN3 in CCA cells enhanced the complement‐mediated cytolysis effect. However, when heat‐inactivated human pooled AB serum (Hi‐HPS) (complement inactivated by heating the serum at 56°C for 30 min) or a C6 blocking antibody were added to inhibit the complement pathway, the cytolysis effect on CCA cells was significantly weakened. (C) Co‐IP experiments confirmed the interaction between FCN3 and MASP2. (D) Results from the STRING database further supported a strong interaction between FCN3 and MASP2. (E) In TFK1 cells, red fluorescence represents the localization and expression levels of C3b, while purple fluorescence indicates the position and expression levels of C5b‐9. Blue fluorescence marks the position of the nucleus. ***p < 0.001.
3.6. FCN3 Significantly Promotes Human Serum Complement‐Mediated Cytolysis of CCA Cells
As illustrated in Figure 5B, the number of trypan blue‐positive cells in the HPS‐treated FCN3 overexpression group (HPS + FCN3‐OE) was significantly higher than in the HPS‐treated control group (HPS + FCN3‐CT). Interestingly, the enhanced cell lysis activity observed in the HPS + FCN3‐OE group was suppressed when treated with either Hi‐HPS or the anti‐C6 blocking antibody.
3.7. FCN3 Binds MASP2 to Activate the MBL Complement Pathway and Promote MAC Formation
Previous studies have demonstrated that MASPs are essential enzymes in the lectin pathway, where both the MBL and ficolin families can bind to MASPs to activate the MBL complement pathway [7, 8]. To identify which MASP interacted with FCN3, Co‐IP and Western blotting analyses were conducted. The results revealed a specific interaction between FCN3 and MASP2, which was further supported by data from the STRING database (Figure 5C,D). Additionally, FCN3 was found to enhance the formation of complement components C3b and C5b‐9. Interestingly, while adding an anti‐C6 blocking antibody to the FCN3‐OE group inhibited the formation of C5b‐9, it had no effect on the formation of C3b (Figure 5E, Figure S2A,B).
3.8. FCN3 Induces Necroptosis of CCA Cells via the RIPK1/RIPK3/MLKL Pathway
Western blotting analysis demonstrated that the phosphorylation levels of RIPK1, RIPK3, and MLKL were markedly elevated in the FCN3 overexpression group (FCN3‐OE) compared to the control group (FCN3‐CT), indicating activation of the necroptosis pathway (Figure 6A). TEM further corroborated these findings, revealing distinct necroptotic features in the FCN3‐OE group, such as cell membrane rupture, organelle swelling, disintegration of the nucleus and cytoplasm, and increased cell volume. In contrast, these necroptotic characteristics were not observed in the FCN3‐CT group (Figure 6B). Moreover, flow cytometry analysis showed an increase in the proportion of apoptotic and necrotic cells in the FCN3‐OE group, while a decrease was noted in the FCN3 knockdown group (Figure 6C).
FIGURE 6.

FCN3 mediates the necroptosis of CCA cells through the RIPK1/RIPK3/MLKL pathway. (A) Western blotting analysis showed that the phosphorylation levels of RIPK1, RIPK3, and MLKL were increased in the FCN3 overexpression (FCN3‐OE) group, while they were reduced in the FCN3 knockdown (FCN3‐KD) group. This suggested that FCN3 upregulation enhanced the activation of the necroptosis pathway. (B) TEM confirmed that CCA cells in the FCN3‐OE group exhibited prominent features of necroptosis, such as swelling of organelles and rupture of the plasma membrane. (C) The FCN3 overexpression group showed a higher number of apoptotic and necrotic cells compared to the FCN3 knockdown group, indicating that FCN3 promoted both apoptotic and necroptotic cell death in CCA cells. ***p < 0.001.
4. Discussion
FCN3 comprises an N‐terminal gel‐like domain and a C‐terminal fibrinogen‐like domain [9]. As a secreted protein, FCN3 is primarily synthesized in hepatocytes and bile duct cells within the liver, and it is present in both serum and bile, where it serves a pivotal function in the innate immune system [10, 11].
FCN3 recognizes and binds specific carbohydrate structures on the surface of pathogens, such as N‐acetylglucosamine and sialic acid, through its fibrinogen‐like domain [12, 13]. Upon binding to pathogens, FCN3 activates the MBL pathway, which leads to the formation of several proteases that cleave complement components C4 and C2 to generate C3 convertase (C4b2a complex). This complex formation is a crucial step in activating the MBL pathway [2, 14]. The C3 convertase can subsequently cleave C3 into C3a and C3b. The C3b component is deposited on the pathogen surface, enhancing recognition and clearance by phagocytes [15, 16]. Additionally, C3b can bind to C5 convertase, which cleaves C5 into C5a and C5b. C5b then interacts with other complement components (C6, C7, C8, and C9) to form the MAC, C5b‐9. This complex creates pores in cell membranes, resulting in cell lysis [17, 18].
Interestingly, the C5b‐9 complex has a dual role; while the fully lysed C5b‐9 exerts an antitumor effect, sublytic levels of C5b‐9 can promote tumor growth. Studies have demonstrated that complement‐dependent cytotoxicity mediated by the C5b‐9 complex involves the regulation of JNK and Bid pathways, leading to cell apoptosis. Additionally, this cytotoxicity is dependent on the RIPK1, RIPK3, and MLKL signaling pathways, which lead to cell necroptosis [5, 6].
FCN3 has been implicated in the development of several types of tumors. Michalski et al. [19] have demonstrated that the fibrinogen‐like domain of FCN3 can bind to the surface of ovarian cancer cells, influencing their immune response and contributing to the pathogenesis of ovarian cancer. In a study by Jang et al. [20], FCN3 induces cell cycle arrest and apoptosis in lung adenocarcinoma cells (A549 and H23). This effect is mediated by the activation of the unfolded protein response during endoplasmic reticulum stress, suggesting that FCN3 functions as a tumor suppressor gene in lung adenocarcinoma.
Furthermore, research by Dong et al. [21] has revealed that FCN3 is expressed at low levels in hepatocellular carcinoma (HCC) tissues. It regulates the nuclear translocation of eukaryotic initiation factor 6 (EIF6) by binding to the ribosome maturation factor (SBDS), thereby inducing ribosomal stress and activating the p53 pathway, which plays a role in the progression of HCC. Additionally, Yuan et al. [9] have confirmed that FCN3 inhibits the synthesis of monounsaturated fatty acids (MUFA) by suppressing the IR/SREBP1c signaling axis, thereby promoting ferroptosis in HCC.
A growing body of research has demonstrated that necroptosis, a regulated form of cell death, can significantly impact tumor development, making it a prominent topic in cancer therapy research [22, 23, 24, 25, 26, 27]. For instance, Wang et al. have found that OSW‐1 can trigger necroptosis in colorectal cancer (CRC) through the RIPK1/RIPK3/MLKL signaling pathway [28]. Meier et al. have reported that necroptosis can activate antigen‐presenting cells, which, in turn, stimulate CD8+ T cells to elicit robust anti‐tumor immune responses [29]. Additionally, several studies have underscored the role of chemotherapy agents and natural compounds in inducing necroptosis and subsequently inhibiting tumor growth. For example, jaceosidin has shown considerable potential as an inducer of necroptosis for treating human glioblastoma multiforme [30]. Similarly, cisplatin has been reported to induce necroptosis through both TNF‐α‐dependent and ‐independent pathways [31]. Despite these advancements, the specific role of necroptosis in CCA remains largely unexplored, highlighting a critical gap in current research.
This study was the first to report the function and potential mechanism of FCN3 in CCA. We discovered that the expression of FCN3 was significantly down‐regulated in CCA tumor cells and tissues at both the mRNA and protein levels. A series of in vitro experiments demonstrated that FCN3 markedly inhibited the proliferation, migration, and colony formation of CCA cells. These findings were further validated by in vivo animal experiments, which showed that FCN3 suppressed the growth of CCA tumor tissues.
Transcriptome sequencing and human serum complement‐mediated cytolysis assays both indicated that FCN3 exerted its effects in CCA primarily through the complement pathway. Co‐IP experiments confirmed the interaction between FCN3 and MASP2, while Western blotting analysis and TEM provided evidence that FCN3 inhibited tumor progression via necroptosis. Collectively, these findings suggested that FCN3 bound to and activated MASP2, thereby triggering the complement cascade to induce necroptosis of CCA cells through the RIPK1/RIPK3/MLKL pathway, functioning as a tumor suppressor gene in CCA.
5. Conclusion
This study revealed that FCN3 acted as a tumor suppressor gene in CCA by binding to MASP2, thereby triggering the complement cascade and inducing necroptosis in CCA cells. These findings shed light on a novel mechanism by which FCN3 exerted its anti‐tumor effects, positioning it as a pivotal player in the regulation of tumor cell death through the complement pathway. By uncovering the role of FCN3 in promoting necroptosis via the RIPK1/RIPK3/MLKL axis, our research opened up exciting possibilities for new therapeutic strategies targeting FCN3 or the complement system in CCA. This breakthrough not only expanded our understanding of CCA pathogenesis but also offered promising new avenues for developing targeted therapies to combat this aggressive cancer.
Author Contributions
G.Z. designed the research. Z.Z. performed the experiments and wrote the manuscript. M.Y. and X.G. plotted figures. H.Z. was responsible for statistical analysis. S.Z. and Y.L. analyzed the data. Y.L. and J.J. acquired the data. All authors reviewed and approved the submitted version.
Ethics Statement
This work was approved by the Ethics Committee of the Qilu Hospital of Shandong University. Human CCA tissues were obtained from patients undergoing surgery at the Department of Hepatobiliary Surgery, the Qilu Hospital of Shandong University. All CCA patients agreed to provide CCA tissue specimens for this study. All subjects signed an informed consent form. All experiments in this study strictly followed the requirements and principles of the Declaration of Helsinki.
Consent
All authors have given consent for publication.
Conflicts of Interest
The authors declare no conflicts of interest.
Supporting information
Figure S1.
Acknowledgments
We thank members of the laboratory for comments and suggestions.
Funding: This work was supported by grants from the National Natural Science Foundation of China (82172347) and the Taishan scholar program of Shandong Province (tstp20221156).
Data Availability Statement
All data generated for this study are included in the article; further inquiries can be directed to the corresponding author.
References
- 1. Brindley P. J., Bachini M., Ilyas S. I., et al., “Cholangiocarcinoma,” Nature Reviews. Disease Primers 7, no. 1 (2021): 65. [DOI] [PMC free article] [PubMed] [Google Scholar]
- 2. Banales J. M., Marin J. J. G., Lamarca A., et al., “Cholangiocarcinoma 2020: The Next Horizon in Mechanisms and Management,” Nature Reviews. Gastroenterology & Hepatology 17, no. 9 (2020): 557–588. [DOI] [PMC free article] [PubMed] [Google Scholar]
- 3. Matsushita M., Endo Y., Hamasaki N., and Fujita T., “Activation of the Lectin Complement Pathway by Ficolins,” International Immunopharmacology 1, no. 3 (2001): 359–363. [DOI] [PubMed] [Google Scholar]
- 4. Matsushita M. and Fujita T., “Ficolins and the Lectin Complement Pathway,” Immunological Reviews 180 (2001): 78–85. [DOI] [PubMed] [Google Scholar]
- 5. Lusthaus M., Mazkereth N., Donin N., and Fishelson Z., “Receptor‐Interacting Protein Kinases 1 and 3, and Mixed Lineage Kinase Domain‐Like Protein Are Activated by Sublytic Complement and Participate in Complement‐Dependent Cytotoxicity,” Frontiers in Immunology 9 (2018): 306. [DOI] [PMC free article] [PubMed] [Google Scholar]
- 6. Fishelson Z. and Kirschfink M., “Complement C5b‐9 and Cancer: Mechanisms of Cell Damage, Cancer Counteractions, and Approaches for Intervention,” Frontiers in Immunology 10 (2019): 752. [DOI] [PMC free article] [PubMed] [Google Scholar]
- 7. Takahashi M., Iwaki D., Kanno K., et al., “Mannose‐Binding Lectin (MBL)‐Associated Serine Protease (MASP)‐1 Contributes to Activation of the Lectin Complement Pathway,” Journal of Immunology (Baltimore, Md.: 1950) 180, no. 9 (2008): 6132–6138. [DOI] [PubMed] [Google Scholar]
- 8. Tereshchenko S. Y., Smolnikova M. V., and Freidin M. B., “Ficolin‐3 and MASP‐2 Gene Variants in Siberian Arctic Populations: Summarized Evidence of Selective Pressure for the High Frequency of Lectin Complement Pathway Deficiency,” Scandinavian Journal of Immunology 97, no. 3 (2023): e13249. [DOI] [PubMed] [Google Scholar]
- 9. Yuan Y., Xu J., Jiang Q., et al., “Ficolin 3 Promotes Ferroptosis in HCC by Downregulating IR/SREBP Axis‐Mediated MUFA Synthesis,” Journal of Experimental & Clinical Cancer Research: CR 43, no. 1 (2024): 133. [DOI] [PMC free article] [PubMed] [Google Scholar]
- 10. Cedzyński M. and Świerzko A. S., “Components of the Lectin Pathway of Complement in Solid Tumour Cancers,” Cancers 14, no. 6 (2022): 1543. [DOI] [PMC free article] [PubMed] [Google Scholar]
- 11. Pieczarka C., Andrade F. A., Catarino S. J., et al., “Ficolin‐1 and Ficolin‐3 Polymorphisms and Susceptibility to Rheumatoid Arthritis,” Autoimmunity 53, no. 7 (2020): 400–407. [DOI] [PubMed] [Google Scholar]
- 12. Sugimoto R., Yae Y., Akaiwa M., et al., “Cloning and Characterization of the Hakata Antigen, a Member of the Ficolin/Opsonin p35 Lectin Family,” Journal of Biological Chemistry 273, no. 33 (1998): 20721–20727. [DOI] [PubMed] [Google Scholar]
- 13. Alhomoud M., Magro C., Seshan S., et al., “Deposition of Complement Components C5b‐9 and MASP2 in Tissues Is Not a Feature of GVHD and May Assist in Discriminating GVHD From Thrombotic Microangiopathy Following Allogenic Transplantation,” Bone Marrow Transplantation 58, no. 11 (2023): 1270–1274. [DOI] [PubMed] [Google Scholar]
- 14. Endo Y., Matsushita M., and Fujita T., “New Insights Into the Role of Ficolins in the Lectin Pathway of Innate Immunity,” International Review of Cell and Molecular Biology 316 (2015): 49–110. [DOI] [PubMed] [Google Scholar]
- 15. Swierzko A. S., Kilpatrick D. C., and Cedzynski M., “Mannan‐Binding Lectin in Malignancy,” Molecular Immunology 55, no. 1 (2013): 16–21. [DOI] [PubMed] [Google Scholar]
- 16. Talaat I. M., Elemam N. M., and Saber‐Ayad M., “Complement System: An Immunotherapy Target in Colorectal Cancer,” Frontiers in Immunology 13 (2022): 810993. [DOI] [PMC free article] [PubMed] [Google Scholar]
- 17. Matsushita M., “Ficolins: Complement‐Activating Lectins Involved in Innate Immunity,” Journal of Innate Immunity 2, no. 1 (2010): 24–32. [DOI] [PubMed] [Google Scholar]
- 18. Li H., Zhang F., Zhang D., and Tian X., “Changes of Serum Ficolin‐3 and C5b‐9 in Patients With Heart Failure,” Pakistan Journal of Medical Sciences 37, no. 7 (2021): 1860–1864. [DOI] [PMC free article] [PubMed] [Google Scholar]
- 19. Lindelöf L., Rantapää‐Dahlqvist S., Lundtoft C., et al., “A Survey of Ficolin‐3 Activity in Systemic Lupus Erythematosus Reveals a Link to Hematological Disease Manifestations and Autoantibody Profile,” Journal of Autoimmunity 143 (2024): 103166. [DOI] [PubMed] [Google Scholar]
- 20. Jang H., Jun Y., Kim S., et al., “FCN3 Functions as a Tumor Suppressor of Lung Adenocarcinoma Through Induction of Endoplasmic Reticulum Stress,” Cell Death & Disease 12, no. 4 (2021): 407. [DOI] [PMC free article] [PubMed] [Google Scholar]
- 21. Ma D., Liu P., Wen J., et al., “FCN3 Inhibits the Progression of Hepatocellular Carcinoma by Suppressing SBDS‐Mediated Blockade of the p53 Pathway,” International Journal of Biological Sciences 19, no. 2 (2023): 362–376. [DOI] [PMC free article] [PubMed] [Google Scholar]
- 22. Kaczmarek A., Vandenabeele P., and Krysko D. V., “Necroptosis: The Release of Damage‐Associated Molecular Patterns and Its Physiological Relevance,” Immunity 38, no. 2 (2013): 209–223. [DOI] [PubMed] [Google Scholar]
- 23. Lawlor K. E., Khan N., Mildenhall A., et al., “RIPK3 Promotes Cell Death and NLRP3 Inflammasome Activation in the Absence of MLKL,” Nature Communications 6 (2015): 6282. [DOI] [PMC free article] [PubMed] [Google Scholar]
- 24. Kang K., Quan K. T., Byun H. S., et al., “3‐O‐Acetylrubianol C (3AR‐C) Induces RIPK1‐Dependent Programmed Cell Death by Selective Inhibition of IKKβ,” FASEB Journal: Official Publication of the Federation of American Societies for Experimental Biology 34, no. 3 (2020): 4369–4383. [DOI] [PubMed] [Google Scholar]
- 25. Zhang D. W., Shao J., Lin J., et al., “RIP3, an Energy Metabolism Regulator That Switches TNF‐Induced Cell Death From Apoptosis to Necrosis,” Science (New York, N.Y.) 325, no. 5938 (2009): 332–336. [DOI] [PubMed] [Google Scholar]
- 26. Maelfait J., Liverpool L., Bridgeman A., Ragan K. B., Upton J. W., and Rehwinkel J., “Sensing of Viral and Endogenous RNA by ZBP1/DAI Induces Necroptosis,” EMBO Journal 36, no. 17 (2017): 2529–2543. [DOI] [PMC free article] [PubMed] [Google Scholar]
- 27. Zhu J., Li J., Yang K., et al., “NR4A1 Depletion Inhibits Colorectal Cancer Progression by Promoting Necroptosis via the RIG‐I‐Like Receptor Pathway,” Cancer Letters 585 (2024): 216693. [DOI] [PubMed] [Google Scholar]
- 28. Wang N., Li C. Y., Yao T. F., Kang X. D., and Guo H. S., “OSW‐1 Triggers Necroptosis in Colorectal Cancer Cells Through the RIPK1/RIPK3/MLKL Signaling Pathway Facilitated by the RIPK1‐p62/SQSTM1 Complex,” World Journal of Gastroenterology 30, no. 15 (2024): 2155–2174. [DOI] [PMC free article] [PubMed] [Google Scholar]
- 29. Meier P., Legrand A. J., Adam D., and Silke J., “Immunogenic Cell Death in Cancer: Targeting Necroptosis to Induce Antitumour Immunity,” Nature Reviews. Cancer 24, no. 5 (2024): 299–315. [DOI] [PubMed] [Google Scholar]
- 30. Park K. R., Jeong Y., Lee J., Kwon I. K., and Yun H. M., “Anti‐Tumor Effects of Jaceosidin on Apoptosis, Autophagy, and Necroptosis in Human Glioblastoma Multiforme,” American Journal of Cancer Research 11, no. 10 (2021): 4919–4930. [PMC free article] [PubMed] [Google Scholar]
- 31. Xu Y., Ma H. B., Fang Y. L., et al., “Cisplatin‐Induced Necroptosis in TNFα Dependent and Independent Pathways,” Cellular Signalling 31 (2017): 112–123. [DOI] [PubMed] [Google Scholar]
Associated Data
This section collects any data citations, data availability statements, or supplementary materials included in this article.
Supplementary Materials
Figure S1.
Data Availability Statement
All data generated for this study are included in the article; further inquiries can be directed to the corresponding author.