

Abstract
Background:
Lung cancer complicated by malignant pleural effusions (MPEs) is associated with significantly increased morbidity and mortality, yet the mechanisms of MPE development remain poorly understood. This study sought to elucidate whether there were specific genomic alterations and/or immunologic biomarkers associated with the presence of MPEs.
Methods:
Analysis of comprehensive genomic and immunologic profiling for 275 locally advanced (stage III) or advanced (stage IV) lung adenocarcinomas was subcategorized into cytology-confirmed MPE-positive (MPE+; n = 139 stage IV) and MPE-negative (MPE−; n = 30 stage III + n = 106 stage IV) groups.
Results:
Smoking frequency (p = .0001) and tumor mutational burden (p < .001) were demonstrated to be lower in the MPE+ group compared to the MPE− group. Median overall survival in the MPE+ group was shorter than in the MPE− group across all data (2.0 vs. 5.5 years; p < .0001) and for smokers (1.2 vs. 6.4 years; p < .0001). There were a number of differences at the genomic level across all cases and when stratifying by smoking status, including a higher frequency of EGFR mutations and a lower frequency of STK11 mutations in the MPE+ cohort. Finally, investigation of the comutational profiles of tumors by MPE status revealed differences in TP53- and STK11-mutant tumors between the two groups.
Conclusions:
Overall, these findings imply that there are both clinical and genetic factors associated with advanced lung adenocarcinoma MPEs. Future studies of these alterations may prove important both for understanding the pathophysiology of MPE development in advanced cancer and for the earlier detection of at-risk patients.
Keywords: advanced-stage lung adenocarcinoma, comutational profile, cytology, malignant pleural effusion, next-generation sequencing (NGS), tumor mutational burden (TMB)
INTRODUCTION
Despite impressive advances over the past decade, lung cancer remains the leading cause of cancer-related death in both males and females, with an estimated 125,070 deaths in the United States for 2024.1 The majority of patients with lung cancer present at an advanced stage, which corresponds to a less than 9% 5-year survival for those with stage IV disease.2 Lung cancer involvement of the pleural cavity via malignant pleural effusion (MPE) is identified in approximately 15% of patients with non–small cell lung cancer (NSCLC) at the time of presentation, which increases to approximately 50% over the course of disease progression.3,4 Overall, lung cancer represents the most common cause of MPE in men, and the second most common cause of MPE in women (after breast cancer).5,6 Importantly, cytology-confirmed MPEs in patients with NSCLC delineate stage IV disease and portend a poor prognosis, with extended morbidity and mortality associated with the symptomatic management of MPE.3,7,8
Despite the poor prognosis associated with MPEs, the pathophysiology underlying their development remains poorly understood. Importantly, some pleural effusions in patients with lung cancer are devoid of any malignant cells on the basis of cytologic evaluation. These “paramalignant effusions” can develop secondary to lymphatic obstruction, bronchial obstruction, or atelectasis, or as a result of the systemic effects of the tumor or treatment.9,10 As such, it is important to distinguish a true MPE from a cytologically benign effusion. Although the diagnostic sensitivity of pleural fluid cytology for patients with lung cancer with suspected pleural disease is relatively high (approximately 80%),11 in clinically suspicious cases with a negative cytology result a pleural biopsy can be performed via a thoracoscopic or percutaneous route. Previous studies have looked at different factors predictive of MPEs in lung cancer. The likelihood of tumor visceral pleural invasion relates to the proportion of a solid component on chest computed tomography (CT) imaging and a larger pleural contact length-to-size ratio. MPEs directly correlate with tumor size, mediastinal lymph node involvement, and NSCLC with either adenocarcinoma, large cell, or not otherwise specified histology.3,12
With the recent advances in the understanding of the genomic and immunologic landscapes of lung adenocarcinoma, we hypothesized that there may be certain driver mutations, mutational profiles, or immunologic biomarkers associated with MPEs. To investigate this, we compiled comprehensive genomic profiling data of advanced-stage lung adenocarcinomas, which compared cohorts of patients who had a cytology-confirmed MPE (MPE+) compared to those without MPE (MPE−).
MATERIALS AND METHODS
Case selection
After local institutional review board approval, we identified all pathology-confirmed lung adenocarcinoma cases diagnosed between May 2014 and March 2024 from an academic medical center with a multidisciplinary thoracic oncology clinic (Beth Israel Deaconess Medical Center) that also had comprehensive genomic profiling via next-generation sequencing (NGS) performed at the time of diagnosis (N = 588). We then excluded all cases of early-stage disease (stage I or II), any cases with radiographic evidence of pleural effusions but without cytologic evaluation, any cases with a sampled pleural effusion that exhibited a second malignancy other than lung adenocarcinoma, any cases with inconclusive/indeterminate cytology results, and any cases with high microsatellite instability (n = 313 cases met exclusion criteria). This left a cohort of locally advanced (stage III; n = 30) and advanced-stage (stage IV; n = 245) lung adenocarcinoma cases that were further subcategorized into cytology-confirmed MPE+ (n = 139) and MPE− (n = 136) groups. All cytology cases were evaluated by subspecialty-trained cytopathologists with the use of specific immunohistochemical markers to confirm all cases of malignancy (Figure S1). In the MPE+ group, all cases had a cytology-confirmed lung adenocarcinoma MPE(s) at any point during disease progression. In the MPE− group, the cases either had no radiographic evidence of a pleural effusion(s) or, if an effusion was present, it was sampled, evaluated by cytology, and confirmed to be negative for malignant cells. See Figure S2 for a summary flowchart outlining the methods of case selection for this study.
Patient clinical and demographic characteristics
All patient clinical and demographic characteristics were retrospectively extracted from electronic medical records, including patient-reported sex and race. The deidentified patient age at the time of initial diagnosis and NGS testing was recorded. Smoking status was stratified into two groups: the smoker group included both current and former smokers who have had >100 cigarettes in their lifetime, whereas the nonsmoker group included both individuals with no smoking history and those who smoked <100 cigarettes in their lifetime (i.e., equivalent to never smokers).13 Kaplan–Meier survival curves were generated on the basis of retrospective review of electronic medical records by obtaining the initial date of lung cancer diagnosis and either the time of death or censoring by last contact or time to study end point (May 31, 2024) as the last censored timeline for living cases.
Comprehensive genomic profiling
NGS was performed with the commercially available FoundationOne CDx test (Foundation Medicine, Cambridge, Massachusetts) on all cases at the time of diagnosis before initiation of treatment. The specimen site/testing substrate used for NGS was recorded from the Foundation Medicine report and confirmed via the electronic medical record. For patients who underwent iterative rounds of NGS testing during the course of their disease, only the results from the first test were included. The genomic analysis included gene substitutions, insertion and deletion events, copy number alterations, and select gene arrangements across 324 genes. For ALK, ROS1, and RET, only gene fusions and rearrangements were included in the mutation analysis (point mutations were not). Although all results were reviewed, genomic alterations that were identified in a low number of cases (<4 cases across the total cohort) were not included in the final figures and tables. Additionally, microsatellite instability status and tumor mutational burden (TMB) measured as mutations per megabase (mut/Mb) were assessed as part of the FoundationOne CDx test results.
Programmed cell death ligand 1 immunohistochemistry analysis
Programmed cell death ligand 1 (PD-L1) immunohistochemistry (IHC) testing with the PD-L1 clone 22C3 pharmDx kit (Agilent Technologies, Santa Clara, California) on the Autostainer Link 48 platform (Dako, Carpinteria, California) was performed at Foundation Medicine. PD-L1 results were reported via the tumor proportion score (TPS): the percentage of at least 100 viable tumor cells with complete or partial membranous PD-L1 staining. Tumor PD-L1 expression was divided into three clinically relevant TPS groups: <1% (no expression), 1%–49% (low expression), and ≥50% (high expression). Cases where PD-L1 IHC was not performed were excluded from the PD-L1 analysis (n = 9 in the MPE− group; n = 6 in the MPE+ group).
Statistical analysis
For age, smoking status, and mean TMB, two-tailed t-tests were performed. For all other categorical analyses, a χ2 test was performed. For Kaplan–Meier survival curves, statistical analysis was performed with a log-rank (Mantel–Cox) χ2 test. Given the potential risk of multiple hypothesis testing in this study, a more stringent threshold for considering statistical significance was chosen (p < .01), although p values of less than .05 to greater than .01 are still provided in the figures and tables. Asterisk coding is provided for the reporting of statistical significance values throughout this article: *p < .05, **p < .01, ***p < .001, and ****p < .0001.
RESULTS
Clinical correlates, TMB, and PD-L1 expression in MPE+ lung adenocarcinomas
To examine whether there are clinical or genomic differences underpinning the development of MPE in lung adenocarcinomas, patients with locally advanced (stage III; n = 30) and advanced-stage (stage IV; n = 245), pathology-confirmed lung adenocarcinoma cases were further subcategorized into MPE+ and MPE− groups (Figure S2). Among all the cases, there were no significant differences between the MPE+ and MPE− groups with respect to age, sex, or race. Interestingly, the frequency of smokers was significantly higher in the MPE− group compared to the MPE+ group (77.9% vs. 56.8%; p = .0001; Table 1). Overall survival (OS) was lower in the MPE+ group as compared to the MPE− group (p < .0001), with median OS of 2.0 years in the MPE+ group and 5.5 years in the MPE− group (Figure 1). Substratification by smoking status demonstrated significant differences in OS in smokers (1.2 years for MPE+ vs. 6.4 years for MPE−; p < .0001) but not in nonsmokers (3.6 years for MPE+ vs. 4.0 years for MPE−; p = .14) (Figure S3).
TABLE 1.
Clinical and demographic characteristics of the study population.
| Characteristics | MPE− lung adenocarcinoma (n = 136) | MPE+ lung adenocarcinoma (n = 139) | p |
|---|---|---|---|
| Age, years | |||
| Average (range) | 68.0 (33–93) | 68.7 (37–94) | .576 |
| Sex, No. (%) | |||
| Male | 63 (46.3) | 58 (41.7) | .368 |
| Female | 73 (53.7) | 81 (58.3) | |
| Smoker, No. (%) | 106 (77.9) | 79 (56.8) | .001 (***) |
| Race (self-reported), No. (%) | |||
| White | 90 (66.2) | 88 (63.3) | .560 |
| African American | 12 (8.8) | 19 (13.7) | .204 |
| Asian | 21 (15.4) | 28 (20.1) | .322 |
| Hispanic | 5 (3.7) | 2 (1.4) | .239 |
| Not provided/other | 8 (5.9) | 2 (1.4) | .049 (*) |
| Stage, No. (%) | |||
| III | 30 (22.1) | 0 | NA |
| IV | 106 (77.9) | 139 (100) | |
| Substrate for NGS, No. (%) | |||
| Primary tumor | 49 (36.0) | 32 (23.0) | .054 |
| Metastasis | 77 (56.6) | 97 (69.8) | |
| Blood | 10 (7.4) | 10 (7.2) | |
Abbreviations: MPE, malignant pleural effusion; NA, not applicable; NGS, next-generation sequencing.
p < .05,
p < .001.
FIGURE 1.
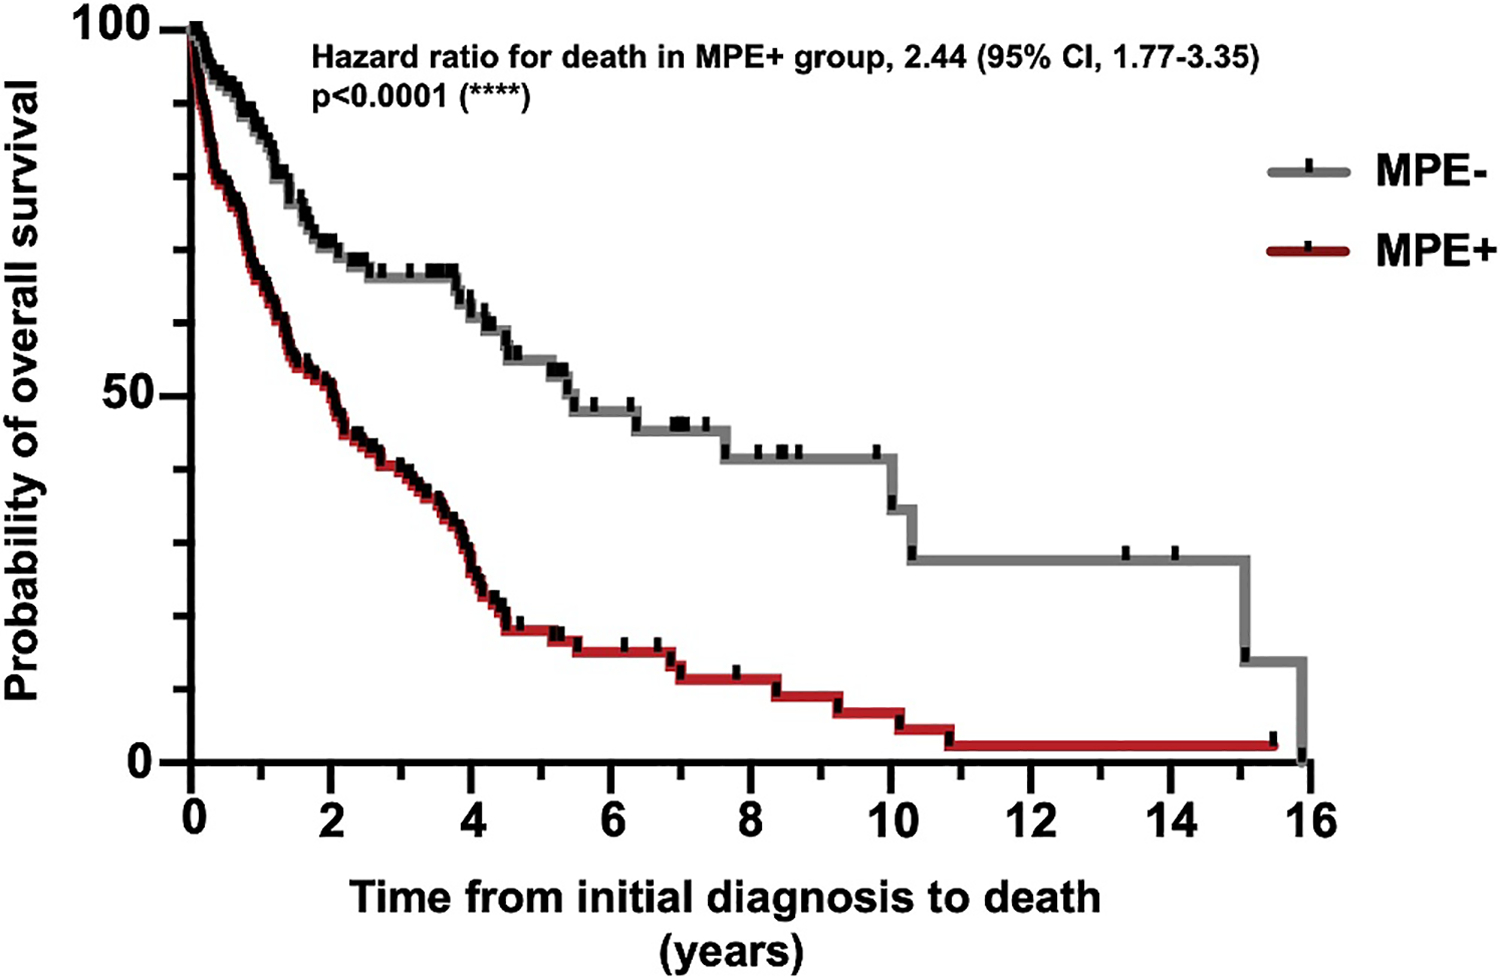
Comparison of overall survival between the MPE+ and MPE− groups. The MPE+ group (n = 134; five patients lost to follow-up) had decreased overall survival compared to the MPE− group (n = 123; 13 patients lost to follow-up) within the entire cohort (****p < .0001). MPE indicates malignant pleural effusion.
In line with the higher observed smoking frequency, the mean TMB was also significantly lower in the MPE+ group as compared to the MPE− group across all data (5.73 vs. 10.59; p = .0009) and the smokers-only cohort (7.24 vs. 12.53; p = .009) but not the nonsmoker cohort (3.38 vs. 3.81; p = .60) (Figure 2A). When grouping cases by the clinically relevant binary breakdown of TMB low (<10 mut/Mb) versus TMB high (≥10 mut/Mb), we found that the MPE+ group had a significantly lower proportion of TMB-high cases across all data (14.78 vs. 34.45; p = .001) and trended lower in smokers (22.86 vs. 40.66; p = .017) but not in nonsmokers (2.22 vs. 7.69; p = .27) (Figure 2B).
FIGURE 2.

Comparison of TMB and PD-L1 TPS in MPE+ versus MPE− cases. (A) The MPE+ group has a lower overall TMB across the entire data set (p = .0009; n = 232) and in the smokers group (p = .009; n = 161). Among nonsmokers, there is not a significant difference in TMB between the MPE+ and MPE− groups (n = 71). (B) The proportion of TMB-high cases (≥10 mut/Mb) was significantly higher in the MPE− group compared to the MPE+ group among all data (33.33 vs. 14.78; p = .0009) and smokers (40.66 vs. 22.86; p = .02) but not nonsmokers. (C) Sorting cases into PD-L1–negative (TPS, <1%), low-positive (TPS, 1%–49%), and high-positive (TPS, ≥50%) groups reveals there is no statistically significant difference in the distribution of PD-L1 TPS grouping between the MPE+ and MPE− groups across all data (n = 260), smokers-only data (n = 180), or nonsmokers-only data (n = 80). *p < .05, **p < .01, ***p < .001. MPE indicates malignant pleural effusion; mut/mb, mutations per megabase; NS, not significant; PD-L1, programmed cell death ligand 1; TMB, tumor mutational burden; TPS, tumor proportion score.
In addition to TMB, PD-L1 TPS is an important biomarker predicting the response to immunotherapy in NSCLC. To understand whether there were differences in PD-L1 TPS between the MPE− and MPE+ groups, cases were subcategorized as PD-L1 TPS negative (<1%), low positive (1%–49%), or high positive (≥50%). There were no significant differences in PD-L1 TPS scoring between the MPE− and MPE+ groups across all data or when grouping by smoking status (Figure 2C).
Comprehensive genomic profiling reveals subtle differences in mutational frequency across multiple genes between MPE+ and MPE− tumors
Given the differences in overall TMB between the MPE+ and MPE− groups, we next compared the frequency of specific genetic alterations between the two groups. First, we examined the differences on a single-gene basis. Across all data, no single genes achieved a significance level of p < .01. In the MPE+ group, there was a trend toward an increased frequency of EGFR mutations, whereas in the MPE− group, there was a trend toward an increased frequency of STK11, VHL, and PALB2 mutations (Figure 3; Table S1). Next, cases were further subcategorized by smoking status. Although no single genes achieved a significance level of p < .01, among smokers there was a trend toward a higher frequency of STK11 mutations in the MPE− group and a trend toward a higher frequency of PIK3CA and CTNNB1 mutations in the MPE+ group (Figure 4; Table S2). Among nonsmokers, there were no significant differences between the MPE+ and MPE− groups across all observed genes (Table S3). Altogether, these findings suggest that there are multiple subtle differences in mutation frequency between MPE+ and MPE− tumors, especially in smokers, which might contribute to the underlying pathobiological propensity of MPE development.
FIGURE 3.

Comparative mutational frequency of MPE+ versus MPE− cases. Genomic alterations in MPE+ and MPE− lung adenocarcinoma cases, including mutations in the common driver oncogenes (A) EGFR, (B) KRAS, and (C) BRAF and modulatory genes including (D) TP53, (E) CDKN2A/B, and (F) STK11. In MPE+ tumors there is a trend toward an increased frequency of EGFR mutations (p = .03), whereas in MPE− tumors there is a trend toward an increased frequency of STK11 mutations (p = .01). *p < .05. MPE indicates malignant pleural effusion; NS, not significant.
FIGURE 4.

Comparison of mutation frequency in MPE+ versus MPE− cases stratified by smoking status. Genomic alterations in MPE+ and MPE− lung adenocarcinoma cases, including mutations in the common driver oncogenes (A) EGFR, (B) KRAS, and (C) BRAF and modulatory genes including (D) TP53, (E) CDKN2A/B, and (F) STK11. Among smokers, there is a trend toward an increased frequency of STK11 mutations (p = .02) in the MPE− group. *p < .05. MPE indicates malignant pleural effusion; NS, not significant.
Analysis of mutant-subtype tumors reveals differences in TMB, but not PD-L1 TPS, between the MPE+ and MPE− groups
Across this lung adenocarcinoma data set (n = 275), the most frequently mutated genes were TP53 (62.5%; n = 172), KRAS (30.5%; n = 84), EGFR (30.2%; n = 83), CDKN2A/B (25.5%; n = 70), and STK11 (15.6%; n = 43), all with well-established roles in lung cancer pathogenesis. The observed rates of MPE+ for each of these mutations were as follows: TP53, 50.6%; KRAS, 52.4%; EGFR, 60.2%; CDKN2A/B, 51.4%; and STK11, 32.6%. To understand whether there were differences between MPE− and MPE+ cases when subgrouping by these specific mutations, TMB was reexamined. Interestingly, mean TMB was significantly lower in the MPE+ group as compared to the MPE− group in TP53 tumors (6.5 vs. 13.6; p = .0008), with a trend toward a lower mean TMB in CDKN2A/B tumors (5.1 vs. 10.7; p = .038) (Figure S4A). These results were consistent when grouping data by TMB low (<10 mut/Mb) and TMB high (≥10 mut/Mb), with a significantly smaller proportion of TMB-high cases in the MPE+ group in TP53-mutant tumors (19.5% for MPE+ vs. 48.6% for MPE−; p = .0002) and a trend toward a lower TMB in CDKN2A/B-mutant tumors (13.9% for MPE+ vs. 37.5% for MPE−; p = .02) (Figure S4B). In EGFR-, KRAS-, and STK11-mutant tumors, there was no significant difference in TMB between the MPE+ and MPE− groups (Figure S4A,B).
Next, we assessed PD-L1 TPS by mutation subtype and found that there was no significant difference between the MPE+ and MPE− groups across the examined genes (Figure 5C,F; Figures S4C and S5).
FIGURE 5.

Detailed analysis of EGFR- and KRAS-mutant tumors. (A,B) The EGFR-L858R mutation is more frequent in the MPE+ group among all cases (p = .04) and smokers (p = .02). The exon 20 mutation is more frequent in MPE− nonsmokers (p = .02). (C,F) EGFR-mutant (n = 83) and KRAS-mutant (n = 84) tumors do not have any significant differences in comutational profile between MPE+ and MPE− cases across the above selected genes. (D,E) There is no significant difference in the mutational frequency of the KRAS-G12C mutation subtype or all other non-G12C mutations between the MPE+ (n = 44) and MPE− (n = 40) groups among all cases, smokers-only cases, or nonsmokers-only cases. *p < .05. MPE indicates malignant pleural effusion; NS, not significant; PD-L1, programmed cell death ligand 1; TPS, tumor proportion score.
Comutation analysis demonstrated minor differences in mutational frequency between the MPE+ and MPE− groups
Given the complex genetic landscape underlying tumorigenesis, we next investigated whether there were differences in the comutational profile in the five most frequently mutated genes in this cohort, as previously mentioned. The most commonly identified mutations in EGFR-mutant tumors included exon 19 deletions, point mutations at L858R and G719X, and exon 20 insertions. Across all data, there was a trend toward an increased frequency of the EGFR-L858R mutation in the MPE+ group (Figure 5A; p = .04). When grouping patients by smoking status, we observed a trend toward a decreased frequency of the EGFR-G719X mutation in MPE+ smokers compared to MPE− smokers, albeit at a low overall prevalence (p = .04). In the nonsmokers group, we observed a trend toward a decreased frequency of the EGFR exon 20 insertion mutations in the MPE+ group compared to the MPE− group, albeit at a low overall prevalence (p = .04; Figure 5B). Analysis of the comutational profile of EGFR-mutant tumors showed no significant differences between the MPE+ and MPE− groups (Figure 5C). In KRAS-mutant tumors, the most clinically relevant targetable genetic alteration is the KRAS-G12C mutation. Across all data and when subgrouping by smoking status, there was no significant difference in the frequency of this mutation between MPE+ and MPE− tumors (Figure 5D,E).
Next, we examined comutation patterns in TP53-, STK11-, and CDKN2A/B-mutant tumors (Figure S5). In TP53-mutant tumors, there was a trend toward an increased frequency of PIK3CA mutations in MPE+ cases (p = .03). In STK11-mutant tumors, there was a trend toward an increased frequency of CDKN2A/B mutations in MPE+ cases (p = .02). In CDKN2A/B-mutant tumors, there were no significant differences in the comutational profiles between the MPE+ and MPE− groups.
DISCUSSION
In this large cohort of patients with advanced-stage lung adenocarcinoma, we show that a cytologically confirmed MPE is associated with significantly poorer OS as compared to those without MPE (Figure 1). Although patients with a smoking history have a significantly lower rate of MPE+ as compared to nonsmokers, those smokers with MPE have significantly poorer OS (Table 1; Figure S3). These findings reaffirm the importance of smoking as a risk factor not only for the development of lung cancer but also for the likelihood of developing MPE.
Given the importance of immune checkpoint inhibitor (ICI) therapy as a viable therapeutic option for patients with advanced-stage lung cancer, we also correlated immunologic biomarkers with MPE. A high TMB (≥10 mut/Mb) has been found to be an independent predictor of response to programmed cell death 1/PD-L1 inhibition in NSCLC, and has a tumor-agnostic Food and Drug Administration approval for second-line treatment of solid tumors.14,15 In our study, we found that MPE+ lung adenocarcinomas had a significantly lower mean and categorized high (≥10 mut/Mb) TMB compared to the MPE− group, both in the entire cohort as well as in the smokers cohort (Figure 2A,B). PD-L1 tumor cell protein expression assessed by IHC, on the other hand, did not show any significant differences with respect to MPE, regardless of smoking status, although there was a trend toward a higher proportion of high PD-L1 TPS (≥50%) in MPE+ compared to MPE− cases (Figure 2C). This divergence between TMB and PD-L1 TPS patterns further suggests that these are not tightly correlated, and thereby serve as independent biomarkers to assess for possible ICI therapy selection. Prior studies have shown that PD-L1 TPS scoring of MPE cytology cell blocks is feasible,16,17 although some variability in scoring exists when comparing paired tumor samples; depending on the PD-L1 TPS threshold for positivity, scoring concordance has been described to range from approximately 70% to 90%.17–19 A large cohort of more than 15,000 patients with lung cancer found that overall, metastatic lesions tended to have higher PD-L1 TPS as compared to primary sites, and high PD-L1 TPS (≥50%) was significantly more common in MPEs compared to primary sites (odds ratio [OR], 1.48; 95% CI, 1.23–1.78).20 Notably, a recent pilot study using multiplexed immunofluorescence to perform a detailed characterization of the immune cell landscape between MPE and paired primary lung adenocarcinomas found overall good concordance, which suggests that evaluation of MPEs could potentially be used as a surrogate for the primary tumor with respect to advanced immunologic characterization.21 Further investigations are required to observe whether the differences in TMB and PD-L1 between lung adenocarcinomas with and without MPE have any significant implications for the effectiveness of ICI therapy in treated patients.
As alluded to earlier, although previous studies have focused on different tumor parameters or imaging characteristics that are associated with pleural invasion and the development of MPE,3,12 less is known about the genomic characteristics of lung adenocarcinomas that may contribute to MPE development. In our study, although some differences were noted in single genes and comutational profiles between the MPE+ and MPE− cohorts, none of these differences achieved the stringent p < .01 we set for significance. However, we did observe that EGFR mutations (specifically EGFR-L858R) trended toward an increased frequency in MPE+ patients as compared to MPE− patients. A few previous studies have linked EGFR mutations to an increased likelihood of MPE, with results similar to the findings in the current study. Namely, in an Asian cohort composed of 227 patients with lung adenocarcinoma, the EGFR mutation rate was found to be significantly higher in patients with MPEs (68.4%) compared to patients without (50.5%).22 A separate study of Asian patients with advanced-stage (IIIB–IV) lung cancer found by chest imaging (although not cytologically confirmed) that a pleural effusion was significantly more common in patients with EGFR- or ALK-positive tumors compared to KRAS-mutant lung cancers.23 As a potential confounding factor in these findings, the prevalence of EGFR mutations in lung adenocarcinoma is generally higher in Asian cohorts as compared to Western cohorts24,25; however, a study of a cohort of Dutch patients with lung cancer also found that lung adenocarcinomas with malignant pleural or pericardial effusion were significantly enriched for EGFR mutations (OR, 2.80; 95% CI, 1.22–6.41), whereas the frequency of KRAS mutations was significantly lower (OR, 0.35; 95% CI, 0.14–0.86).26 Finally, a large cohort of lung adenocarcinoma cases tested via the Memorial Sloan Kettering-IMPACT (Integrated Mutation Profiling of Actionable Cancer Targets) targeted sequencing platform demonstrated pleural metastasis to have a higher proportion of EGFR alterations (48% vs. 32%).27 As such, EGFR-mutated lung adenocarcinomas appear to have an increased risk of developing MPE, although the actual mechanisms underlying this are not clear. The findings of increased risk of MPE in certain lung cancer genomic subgroups (as exemplified by EGFR-L858R) could be related to genomic alterations that ultimately affect aberrant cellular behaviors.28
In addition to the EGFR mutations, we identified several other genes that had variable associations with MPE, although none reached the stringent p < .01 level set for significance in this study. STK11 mutations were less frequently encountered in MPE+ patients, especially in patients with a smoking history. MPE+ patients with TP53-mutant tumors trended toward an increased frequency of PIK3CA comutations, and MPE+ STK11-mutant tumors trended toward an increased frequency of CDKN2A/B comutations. Given the low overall prevalence of these comutations, future studies with larger cohorts will be important for investigating these findings and others gleaned from our data in greater detail.
Strengths of this study include the large study cohort, extensive genomic and biomarker assessment of all cases, correlation with patient characteristics, and survival analysis. To establish as clean a comparative cohort as possible, care was taken to only include cytology-confirmed malignant effusions in the MPE+ group, and conversely to only include cases without pleural effusion or cytologically proven benign paramalignant effusions in the MPE− group. Inclusion of the MPE− group provided us with the ability to make direct comparisons of MPE+ and MPE− tumors rather than solely analyzing the genomic profiles of MPEs. Also, by only focusing on locally advanced and advanced-stage lung adenocarcinomas, we avoided potential confounding factors related to differences in tumor biology, clinical behavior, and genomic landscape between early- and late-stage lung cancers.29,30 There are limitations to this study that have implications for the conclusions that can be drawn from these findings. The tumor substrates used for genomic profiling in this study represent a mixture of primary tumor and metastatic sites, including the MPE itself, which is reflective of the real-world necessity of obtaining tumor material from the most accessible sites for biomarker testing to drive clinical decision-making. Notably, this study was not designed to specifically compare the molecular landscape of lung adenocarcinoma in the MPE to the primary tumor. Certainly, tumor evolution during the course of disease progression and metastasis is well recognized, with acquired mutations oftentimes resulting in drug resistance; however, typically the primary oncogenic driver mutations persist in the metastatic sites.31–33
Ultimately, the goal of this study was to investigate the potential link between the genomics of lung adenocarcinomas and MPE development. We observed distinct differences in smoking status, TMB, survival, and specific genetic alterations between MPE+ and MPE− lung adenocarcinomas. Although our results do not point to a single mutational profile unique to the MPE+ group, the observed differences in frequency of certain mutations or mutation combinations could aid in understanding the aberrant cellular behaviors that ultimately contribute to MPE development (i.e., increased tumor size, invasiveness, etc.). Future studies with larger cohorts could examine the potential utility of generating a scoring scheme to assess the risk of developing MPE. Comprehensive genomic profiling of tumors at earlier stages of development together with the abovementioned features and CT scan characteristics (such as size, nodal involvement, and peripheral location) could reasonably provide added clinical benefit by identifying patients at increased risk for MPE development earlier in disease progression.3,12 Given the significant morbidity and mortality associated with MPEs, earlier detection of high-risk patients could prove clinically beneficial with respect to pursuing more aggressive treatment and/or increased screening. Similarly, additional investigation into correlating mutational profiles with metastatic sites beyond just the pleura could provide added prognostic and therapeutic clinical benefit.
Supplementary Material
ACKNOWLEDGMENTS
This work was funded in part by the National Cancer Institute of the National Institutes of Health (Grant R37 CA218707 to Daniel B. Costa).
CONFLICT OF INTEREST STATEMENT
Adnan Majid reports receiving consulting fees and honoraria from Olympus America and Latin America, Boston Scientific, Cook Medical, Pulmonx, Praxis Medical, Steris, Pinnacle Biologics, and UpTo-Date, unrelated to the current work. Daniel B. Costa reports receiving consulting fees and honoraria from Takeda/Millennium Pharmaceuticals, AstraZeneca, Pfizer, Blueprint Medicines, and Janssen; institutional research support from Takeda/Millennium Pharmaceuticals, AstraZeneca, Pfizer, Merck Sharp and Dohme, Merrimack Pharmaceuticals, Bristol-Myers Squibb, Clovis Oncology, Spectrum Pharmaceuticals, Tesaro, and Daiichi Sankyo; consulting fees from Teladoc and Grand Rounds/Included Health; and royalties from Life Technologies, unrelated to the current work. Paul A. VanderLaan reports receiving consulting fees from Gala/Galvanize Therapeutics, Ruby Robotics, Intuitive Surgical, Veracyte, and Agilent Technologies, unrelated to the current work. The other author declares no conflicts of interest
Funding information
National Cancer Institute/National Institutes of Health, Grant/Award Number: R37 CA218707
REFERENCES
- 1.Siegel RL, Giaquinto AN, Jemal A. Cancer statistics, 2024. CA Cancer J Clin. 2024;74(1):12–49. doi: 10.3322/caac.21820 [DOI] [PubMed] [Google Scholar]
- 2.Cancer Stat Facts: Lung and Bronchus Cancer. National Cancer Institute Surveillance, Epidemiology, and End Results Program. Accessed May 19, 2024. https://seer.cancer.gov/statfacts/html/lungb.html
- 3.Morgensztern D, Waqar S, Subramanian J, Trinkaus K, Govindan R. Prognostic impact of malignant pleural effusion at presentation in patients with metastatic non-small-cell lung cancer. J Thorac Oncol. 2012;7(10):1485–1489. doi: 10.1097/JTO.0b013e318267223a [DOI] [PubMed] [Google Scholar]
- 4.Aydin Y, Turkyilmaz A, Intepe YS, Eroglu A. Malignant pleural effusions: appropriate treatment approaches. Eurasian J Med. 2009;41(3):186–193. [PMC free article] [PubMed] [Google Scholar]
- 5.Lew M, Cantley R, Heider A, Jing X. Diagnosis and categorization of malignant effusions: a 6-year review from a single academic institution. Diagn Cytopathol. 2021;49(5):615–621. doi: 10.1002/dc.24433 [DOI] [PubMed] [Google Scholar]
- 6.Dermawan JKT, Policarpio-Nicolas ML. Malignancies in pleural, peritoneal, and pericardial effusions. Arch Pathol Lab Med. 2020;144(9):1086–1091. doi: 10.5858/arpa.2019-0429-OA [DOI] [PubMed] [Google Scholar]
- 7.Porcel JM, Gasol A, Bielsa S, Civit C, Light RW, Salud A. Clinical features and survival of lung cancer patients with pleural effusions. Respirology. 2015;20(4):654–659. doi: 10.1111/resp.12496 [DOI] [PubMed] [Google Scholar]
- 8.Zamboni MM, da Silva CT Jr, Baretta R, Cunha ET, Cardoso GP. Important prognostic factors for survival in patients with malignant pleural effusion. BMC Pulm Med. 2015;15(1):29. doi: 10.1186/s12890-015-0025-z [DOI] [PMC free article] [PubMed] [Google Scholar]
- 9.Sahn SA. Pleural diseases related to metastatic malignancies. Eur Respir J. 1997;10(8):1907–1913. doi: 10.1183/09031936.97.10081907 [DOI] [PubMed] [Google Scholar]
- 10.Epelbaum O, Rahman NM. Contemporary approach to the patient with malignant pleural effusion complicating lung cancer. Ann Transl Med. 2019;7(15):352. doi: 10.21037/atm.2019.03.61 [DOI] [PMC free article] [PubMed] [Google Scholar]
- 11.Pairman L, Beckert LEL, Dagger M, Maze MJ. Evaluation of pleural fluid cytology for the diagnosis of malignant pleural effusion: a retrospective cohort study. Intern Med J. 2022;52(7):1154–1159. doi: 10.1111/imj.15725 [DOI] [PMC free article] [PubMed] [Google Scholar]
- 12.Heidinger BH, Schwarz-Nemec U, Anderson KR, et al. Visceral pleural invasion in pulmonary adenocarcinoma: differences in CT patterns between solid and subsolid cancers. Radiol Cardiothorac Imaging. 2019;1(3):e190071. doi: 10.1148/ryct.2019190071 [DOI] [PMC free article] [PubMed] [Google Scholar]
- 13.Bondy SJ, Victor JC, Diemert LM. Origin and use of the 100 cigarette criterion in tobacco surveys. Tob Control. 2009;18(4):317–323. doi: 10.1136/tc.2008.027276 [DOI] [PubMed] [Google Scholar]
- 14.Hellmann MD, Ciuleanu TE, Pluzanski A, et al. Nivolumab plus ipilimumab in lung cancer with a high tumor mutational burden. N Engl J Med. 2018;378(22):2093–2104. doi: 10.1056/NEJMoa1801946 [DOI] [PMC free article] [PubMed] [Google Scholar]
- 15.FDA Approves Pembrolizumab for Adults and Children With TMB-H Solid Tumors. Food and Drug Administration Drug Approvals and Databases. Accessed May 19, 2024. https://www.fda.gov/drugs/drug-approvals-and-databases/fda-approves-pembrolizumab-adults-and-children-tmb-h-solid-tumors [Google Scholar]
- 16.Torous VF, Rangachari D, Gallant BP, Shea M, Costa DB, VanderLaan PA. PD-L1 testing using the clone 22C3 pharmDx kit for selection of patients with non-small cell lung cancer to receive immune checkpoint inhibitor therapy: are cytology cell blocks a viable option? J Am Soc Cytopathol. 2018;7(3):133–141. doi: 10.1016/j.jasc.2018.02.003 [DOI] [PMC free article] [PubMed] [Google Scholar]
- 17.Ma H, Jia J, Sun Z, et al. The detection of PD-L1 expression on liquid-based cytology in pleural effusion of lung adenocarcinoma and its prognostic evaluation: between paired liquid-based cytology and cell block samples. Diagn Cytopathol. 2024;52(5):235–242. doi: 10.1002/dc.25276 [DOI] [PubMed] [Google Scholar]
- 18.Mahajan S, Nambirajan A, Gupta I, Gupta N, Gupta P, Jain D. Malignant pleural effusion cell blocks are reliable resources for PD-L1 analysis in advanced lung adenocarcinomas: a concordance study with matched histologic samples. J Am Soc Cytopathol. 2022;11(5):253–263. doi: 10.1016/j.jasc.2022.04.004 [DOI] [PubMed] [Google Scholar]
- 19.Song Z, Cheng G, Zhang Y. PD-L1 expression in malignant pleural effusion samples and its correlation with oncogene mutations in non-small cell lung cancer. J Thorac Dis. 2020;12(4):1385–1392. doi: 10.21037/jtd.2020.02.06 [DOI] [PMC free article] [PubMed] [Google Scholar]
- 20.Moutafi MK, Tao W, Huang R, et al. Comparison of programmed death-ligand 1 protein expression between primary and metastatic lesions in patients with lung cancer. J Immunother Cancer. 2021;9(4):e002230. doi: 10.1136/jitc-2020-002230 [DOI] [PMC free article] [PubMed] [Google Scholar]
- 21.Laberiano-Fernandez C, Gan Q, Wang SM, et al. Exploratory pilot study to characterize the immune landscapes of malignant pleural effusions and their corresponding primary tumors from patients with breast carcinoma and lung adenocarcinoma. J Am Soc Cytopathol. 2024;13(3):161–173. doi: 10.1016/j.jasc.2024.02.005 [DOI] [PMC free article] [PubMed] [Google Scholar]
- 22.Wu SG, Gow CH, Yu CJ, et al. Frequent epidermal growth factor receptor gene mutations in malignant pleural effusion of lung adenocarcinoma. Eur Respir J. 2008;32(4):924–930. doi: 10.1183/09031936.00167407 [DOI] [PubMed] [Google Scholar]
- 23.Park J, Kobayashi Y, Urayama KY, Yamaura H, Yatabe Y, Hida T. Imaging characteristics of driver mutations in EGFR, KRAS, and ALK among treatment-naïve patients with advanced lung adenocarcinoma. PLoS One. 2016;11(8):e0161081. doi: 10.1371/journal.pone.0161081 [DOI] [PMC free article] [PubMed] [Google Scholar]
- 24.Midha A, Dearden S, McCormack R. EGFR mutation incidence in non-small-cell lung cancer of adenocarcinoma histology: a systematic review and global map by ethnicity (mutMapII). Am J Cancer Res. 2015;5(9):2892–2911. [PMC free article] [PubMed] [Google Scholar]
- 25.Yamaguchi N, Vanderlaan PA, Folch E, et al. Smoking status and self-reported race affect the frequency of clinically relevant oncogenic alterations in non-small-cell lung cancers at a United States-based academic medical practice. Lung Cancer. 2013;82(1):31–37. doi: 10.1016/j.lungcan.2013.07.013 [DOI] [PMC free article] [PubMed] [Google Scholar]
- 26.Smits AJ, Kummer JA, Hinrichs JW, et al. EGFR and KRAS mutations in lung carcinomas in the Dutch population: increased EGFR mutation frequency in malignant pleural effusion of lung adenocarcinoma. Cell Oncol. 2012;35(3):189–196. doi: 10.1007/s13402-012-0078-4 [DOI] [PMC free article] [PubMed] [Google Scholar]
- 27.Lengel HB, Mastrogiacomo B, Connolly JG, et al. Genomic mapping of metastatic organotropism in lung adenocarcinoma. Cancer Cell. 2023;41(5):970–985.e3. doi: 10.1016/j.ccell.2023.03.018 [DOI] [PMC free article] [PubMed] [Google Scholar]
- 28.Tsai MF, Chang TH, Wu SG, et al. EGFR-L858R mutant enhances lung adenocarcinoma cell invasive ability and promotes malignant pleural effusion formation through activation of the CXCL12-CXCR4 pathway. Sci Rep. 2015;5(1):13574. doi: 10.1038/srep13574 [DOI] [PMC free article] [PubMed] [Google Scholar]
- 29.Yue D, Liu W, Gao L, et al. Integrated multiomics analyses revealing different molecular profiles between early- and late-stage lung adenocarcinoma. Front Oncol. 2021;11:746943. doi: 10.3389/fonc.2021.746943 [DOI] [PMC free article] [PubMed] [Google Scholar]
- 30.Qian J, Zhao S, Zou Y, et al. Genomic underpinnings of tumor behavior in in situ and early lung adenocarcinoma. Am J Respir Crit Care Med. 2020;201(6):697–706. doi: 10.1164/rccm.201902-0294OC [DOI] [PMC free article] [PubMed] [Google Scholar]
- 31.Vignot S, Frampton GM, Soria JC, et al. Next-generation sequencing reveals high concordance of recurrent somatic alterations between primary tumor and metastases from patients with non-small-cell lung cancer. J Clin Oncol. 2013;31(17):2167–2172. doi: 10.1200/JCO.2012.47.7737 [DOI] [PubMed] [Google Scholar]
- 32.Kang Y, Jin Y, Li Q, Yuan X. Advances in lung cancer driver genes associated with brain metastasis. Front Oncol. 2021;10:606300. doi: 10.3389/fonc.2020.606300 [DOI] [PMC free article] [PubMed] [Google Scholar]
- 33.Liu N, Yu M, Yin T, et al. Progression of malignant pleural effusion during the early stage of gefitinib treatment in advanced EGFR-mutant lung adenocarcinoma involving complex driver gene mutations. Signal Transduct Target Ther. 2020;5(1):63. doi: 10.1038/s41392-020-0161-7 [DOI] [PMC free article] [PubMed] [Google Scholar]
Associated Data
This section collects any data citations, data availability statements, or supplementary materials included in this article.