

Abstract
Organophosphonates (OPs) are widely used as chelating agents in domestic and industrial applications. While regarded as hardly biodegradable, OPs can undergo abiotic transformation with phosphate (PO43−) as a main transformation product. As some OPs are suspected precursors of glyphosate in surface waters, their environmental fate is of current interest. Due to analytical challenges posed by quantification of individual OPs, monitoring PO43− formation is a widely used proxy to monitor OP transformations. The molybdenum blue (MB) method, employing UV/Vis spectroscopy, is frequently used for PO43− quantification due to its sensitivity and operational simplicity. However, while interference of certain inorganic ions is well-documented, the effects of OPs on the accuracy of the MB method remain unexplored. This study investigated the effects of six OPs, namely N-(phosphonomethyl)glycine (glyphosate), 1-hydroxyethylidene(1,1-diphosphonic acid) (HEDP), iminodi(methylene phosphonate) (IDMP), aminotris(methylene phosphonate) (ATMP), ethylenediaminetetra(methylene phosphonate) (EDTMP), and diethylenetriaminepenta(methylene phosphonate) (DTPMP). Spectral analysis of pure PO43− standards using the MB method exhibits two characteristic absorption maxima (λmax) at 710 and 880 nm. In the presence of OPs, a new λmax appears around 760 nm. This is accompanied by an increase in absorbance values at both 710 and 880 nm, leading to significant over-quantification of PO43− concentrations. Among the evaluated OPs, DTPMP exhibits the most substantial interference (PO43− over-quantification by up to 240%), while glyphosate causes minimal interference (≤ 20%). The effects are most pronounced at OPs:PO43− ratios ≥1. A case study simulating DTPMP transformation confirms PO43− over-quantification of up to 350%, revealing limitations of the MB method. Therefore, careful data evaluation and complementary analytical techniques for accurate PO43− measurements are indispensable in OP transformation research.
Graphical abstract

Supplementary Information
The online version contains supplementary material available at 10.1007/s00216-025-05850-y.
Keywords: Aminopolyphosphonates, DTPMP, Glyphosate, UV–visible spectroscopy, Colorimetric analyses, Interference
Introduction
Organophosphonates (OPs) are a class of organophosphorus compounds characterized by the presence of one or multiple phosphonic acid groups [–CH2–PO(OH)2]. Their physicochemical properties comprise high polarity and water solubility, thermal stability, and metal chelating ability [1, 2]. As structural analogues of well-known polycarboxylates such as ethylenediaminetetraacetate (EDTA), OPs are increasingly used as alternatives in industrial and consumer applications, for example, as complexing agents in textile and paper production, or as bleaching stabilizers in household detergents and cosmetics [3]. In 2012, OP consumption in Europe was reported to be 49,000 t, while global consumption reached 94,000 t [3]. Data on environmental concentration, however, is scarce. One of the few studies showed the total concentration of the five most commonly used OPs in the influent of wastewater treatment plants (WWTPs) ranged from 131 to 384 μg/L in 2019 [4]. A considerable amount of aminophosphonates is eliminated by sorption onto sewage sludge (around 85%) [5], but the remaining fraction in the effluent increases environmental phosphorus loading [6].
Recent research has shown that the transformation of diethylenetriaminepenta(methylene phosphonate) (DTPMP), one of the most widely used OPs in industrial applications, can lead to the formation of glyphosate [7], the world’s dominant herbicide, with yields ranging from 0.06 to 0.16 mol-% [8]. This discovery has significantly increased interest in the environmental fate of a wider range of OPs, particularly in relation to their transformation processes. Previous research has explored various mechanisms of OP transformations in laboratory experiments, including catalytic oxidation [9, 10], photolysis [11–13], hydrolysis [14–17], and microbial transformation [18]. Because analysis of individual OPs is challenging, quantification of one of their major transformation products, namely phosphate (PO43−), is frequently used to prove and monitor OP degradation in laboratory studies. While various chromatographic techniques have been established for the separation and determination of PO43− species [19–21], UV/Vis spectroscopy, particularly the molybdenum blue (MB) method, is widely applied for PO43− determination due to its sensitivity and operational simplicity. The MB reaction occurs in two stages. Initially, a 12-heteropoly acid (12-MPA) is formed from PO43− and molybdate under acidic conditions. This intermediate is subsequently reduced to an intensely colored phosphomolybdenum blue (PMB) species (see Eqs. 1 and 2) [22].
| 1 |
| 2 |
Since the establishment of the MB method [23], a number of modifications have been proposed to reduce the reaction time, prolong the stability of the PMB species, eliminate interferences, and increase the sensitivity of the method [24, 25]. Among these modified methods, the one by Murphy and Riley [26], which uses a mixed reagent containing ammonium molybdate, potassium antimony tartrate, sulfuric acid, and ascorbic acid, is the most widely accepted. Based on these developments, many countries and regional associations have established standardized protocols for PO43− determination. Table S1 in the Supporting Information provides a comparative analysis of the similarities and differences between these protocols.
Until today, the MB method remains a widely accepted and utilized approach for PO43−quantification in laboratory OP transformation studies [27–30]. In previous research, the generation of PO43− has frequently been employed as a primary and often sole indicator to validate OP degradation in various contexts, such as hydrolysis [17], mineral oxidation [31], and biodegradation [32]. However, the effect of OPs on PO43− quantification by the MB method is still largely unexplored, despite the coexistence of OPs and PO43− in OP transformation studies. Nagul et al. [22] proposed that organic acids, such as tartrate and oxalate, inhibit the MB reaction by forming coordination complexes that sequester Mo(VI) and interfere with the formation of 12-MPA. Given the ability of OPs to coordinate with metals, they may cause similar interferences. While some studies have mentioned the interference of organic phosphorus compounds [33], they primarily refer to polyphosphates and labile organic P compounds, rather than OPs. When inaccuracies in PO43− quantification have been observed, they have been attributed to the hydrolysis of organic phosphorus compounds and thus the formation of PO43− during analytical procedures [34]. However, this explanation does not apply to scenarios involving OPs. For the quantification of total phosphorus using the MB method, a digestion procedure recommended in the established protocols is indispensable. However, when solely PO43− content is of interest–excluding any phosphorus derived from other molecules–digestion procedures cannot be applied. The effect of OPs on the accurate quantification of solely PO43− using the MB method is unknown. This issue is particularly critical in laboratory studies investigating the fate and transformation of OPs, where PO43− concentration serves as a proxy for OP transformation and therefore precise and accurate PO43− measurements are essential.
In this study, we investigated the effects of four commonly used OPs found in industrial products, namely aminotris(methylene phosphonate) (ATMP), ethylenediaminetetra(methylene phosphonate) (EDTMP), DTPMP, and 1-hydroxyethylidene(1,1-diphosphonic acid) (HEDP), along with iminodi(methylene phosphonate) (IDMP), a major transformation product of DTPMP, EDTMP, and ATMP [35], as well as glyphosate on the quantification of PO43− by the MB method. The MB method described by Laskov et al. [36] was employed to record full-range visible light absorption spectra (Vis-spectra) of PO43− standards in ultrapure water and compare them to PO43− spectra in OP matrices. To quantitatively evaluate the effects, single-factor experiments were performed by fixing either the PO43− or OP concentrations. Two absorption maxima (λmax) were identified from the Vis-spectra, allowing for quantitative comparison of absorbance values at λmax. Furthermore, PO43− formation from DTPMP transformation was simulated. This was done by varying the PO43−:DTPMP ratios expected for different transformation stages. This study aims to provide guidelines for the use of the MB method for phosphate quantification in the presence of OPs, thereby preventing misinterpretations in OP transformation studies.
Materials and methods
Chemicals
Ammonium molybdate [(NH4)Mo7O27·4H2O] (≥ 99%) and potassium antimonyl tartrate [K(SbO)C4H4O6·0.5H2O] (99.0% ~ 103%) were purchased from Merck (Darmstadt, Germany). Potassium phosphate [K2HPO4] (≥ 99%), ascorbic acid [L( +)C6H8O6] (≥ 99%), and sulfuric acid [H2SO4] (96%) were purchased from Thermo Fisher Scientific (Waltham, Massachusetts, USA). Glyphosate (PESTANAL®, ≥ 98.0%), HEDP (≥ 95%), IDMP (≥ 97%), ATMP (≥ 97.0%) solids were purchased from Sigma-Aldrich (St Louis, MO, USA). EDTMP and DTPMP were bought as solid acid from Zschimmer & Schwarz (Lahnstein, Germany) under the name “CUBLEN ELC 950” and “CUBLEN D 900 GR,” respectively. In order to ascertain the purity of the purchased EDTMP and DTPMP, 31P-{1H}-NMR measurements were conducted. The analysis revealed the purity of EDTMP and DTPMP used in the experiments regarding P is > 97.48% and > 98.60%, respectively (for details, see the NMR section in Supporting Information). Additionally, phosphate impurities in the tested OPs were quantified using ion chromatography (IC) coupled to inductively coupled plasma mass spectrometry (ICP-MS). The analysis revealed that all measured phosphate concentrations were below the limit of detection (LOD, 0.0041 µM) or limit of quantification (LOQ, 0.0138 µM). Therefore, phosphate impurity levels are given as maximum values based on the LOD or LOQ, ranging from 0.2 to 2.7 mol-%. Further details can be found in the IC-ICP-MS section of Supporting Information. The water used for all solutions has been purified by an ultrapure water purification system (Barnstead, GenPurePro, Thermo Scientific, Waltham, MA, USA) down to a conductivity below 0.06 μS/cm2.
Procedure for phosphate determination by molybdenum blue method
If not described differently, PO43− quantification was conducted using the MB method by Laskov (MBTü) as outlined in the introduction. The molybdate sulfuric acid reagent stock solution contained 21.04 mM ammonium molybdate, 1.12 mM potassium antimony tartrate, and 4.60 M sulfuric acid. This reagent stock solution was stored in the dark at 4 °C until analysis.
The final coloring reagent contained 1.68 mM ammonium molybdate, 0.09 mM potassium antimony tartrate, 0.37 M sulfuric acid, and 0.01 M ascorbic acid. The ascorbic acid and therefore the final coloring reagent were freshly prepared on the day of analysis.
For color development, 2 mL of coloring reagent was mixed with 1 mL of either the sample or standard solution in 10-mm cuvettes (disposable plastic, BRAND, Wertheim, Germany). The cuvettes were sealed and shaken gently to ensure thorough mixing. After a reaction time of 30 min, the absorption spectrum was recorded over a wavelength range of 400 nm to 1100 nm using a UV–Vis spectrophotometer (METTLER TOLEDO, Greifensee, Switzerland).
Results and discussions
Determination of pure phosphate standards by the MB method
Pure PO43− standards were prepared in ultrapure water and subsequently analyzed using both the MB method according to Laskov et al. [36] employed in this study (referred to as MBTü) and the most widely adopted protocol established by the American Public Health Association (MBAPHA) [37]. The subtle differences between these two methods are detailed in Table S1. Given the differing concentration ranges suitable for linear analyses, a standard series of 5–100 µM was selected for the MBTü method, while a standard series of 5–50 µM was employed for the MBAPHA method. The absorption spectra exhibited a high degree of similarity (see Fig. 1a and b), suggesting both methods to be comparably effective for PO43− quantification. The two characteristic absorption maxima (λmax) at 710 and 880 nm, which indicate the formation of the PMB complex, were consistent and reproducible. Accordingly, the absorbance values at these two wavelengths are typically used for PO43− quantification. Additionally, external calibrations measured at 710 and 880 nm were compared for both MB variants (Fig. 1c). The coefficients of determination (R2) of all calibration curves, derived from linear regression, were ≥ 0.99, underscoring a high level of accuracy for both methods in quantifying PO43−. The MBTü method was employed for all subsequent spectral investigations in this study.
Fig. 1.
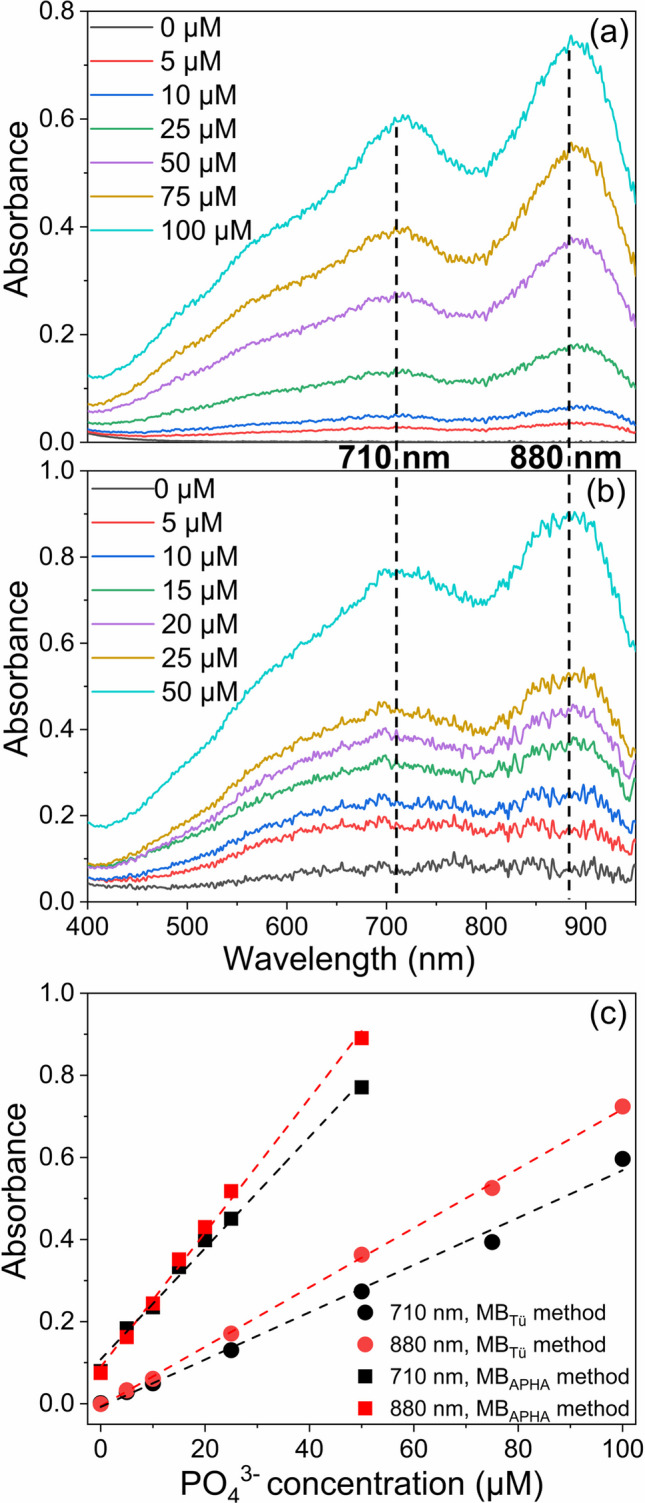
Absorption spectra of pure PO43− standards obtained using the a MBTü method and b MBAPHA method. c Calibration standards prepared using the MBTü method and MBAPHA method measured at λmax = 710 nm and 880 nm
Effects of OP presence on PO43− quantification by the MB method
Qualitative effects of OP background on PO43− quantification
Following the validation of the MBTü method for pure phosphate standards, PO43− standards in the range from 5 to 100 µM were prepared in ultrapure water and in different OP matrices. The OP matrices contained one of the before mentioned OPs at a concentration of 1 mM (see Fig. S5). In the absorption spectra of standards containing either glyphosate or ATMP, the two λmax at 710 nm and 880 nm remained unchanged (see Fig. 2). For the standards containing HEDP and IDMP, the λmax at 880 nm was not discernible in the absorption spectrum. In the presence of EDTMP and DTPMP, a new λmax at 760 nm emerged, which suggests the formation of new colored species. Furthermore, the absorbance values at λmax = 760 nm showed a positive correlation with the PO43− concentration (see Fig. S5), indicating that PO43− is associated with the formation of this new species. Figure 2 shows the absorption spectra of 100 µM PO43− in ultrapure water compared to the spectra obtained in 1 mM OP matrices. In the presence of glyphosate, HEDP, ATMP, and IDMP, the λmax at 710 nm exhibited a shift towards longer wavelength (up to 740 nm), with this shift occurring progressively in the order of the OPs listed. Simultaneously, the visibility of λmax at 880 nm was compromised. With EDTMP or DTPMP in the matrix, a new λmax at 760 nm obscured the original two λmax = 710 and 880 nm. This indicates that the formation of the new species in the presence of OPs replaced the PMB species. Organic acids such as tartrate [38], oxalate [39], and malate [40] are known to inhibit PMB formation, which results from the formation of coordination complexes with Mo(VI) [41]. Similarly, the emergence of the λmax at 760 nm caused by the presence of OPs is likely attributable to a coordination complex with Mo(VI).
Fig. 2.

Comparison of absorption spectra for mix standards containing 100 µM PO43− and 1 mM of individual OPs
Quantitative effects of OP background on PO43− quantification
To quantitatively explore the effects of the six OPs on PO43− quantification, the absorption spectra of mix standards with varying concentrations of PO43− and 1 mM of each OP, respectively, were acquired (Fig. S5). The absorbance values at λmax = 710 and 880 nm were further measured in duplicate (Fig. 3). The relative increase in absorbance for the different OP matrices relative to PO43− standards in ultrapure water was then calculated (Table S3). For all PO43− concentrations tested, the presence of 1 mM OP resulted in an increase in absorbance at both λmax, except for glyphosate. This increase was more pronounced at 710 nm. However, careful examination of the absorption spectra presented in Fig. S5 reveals that the observed increase in absorbances is not due to the enhancement of distinct absorption maxima at 710 or 880 nm for PMB species. Rather, the spectral evolution is characterized by the emergence of a new absorption band centered at 760 nm, which progressively increases in intensity. This newly developed λmax partially overlaps the 710 and 880 nm regions, causing an apparent increase in absorbances at both wavelengths. Consequently, without a thorough analysis of the complete spectra for each measurement, one might erroneously conclude that the specific absorbance at λmax of 710 or 880 nm has increased. The most significant increase was observed for DTPMP, with a relative 19.8-fold increase in absorbance at 710 nm, in a mixture containing 5 µM PO43− and 1 mM DTPMP.
Fig. 3.

Absorbance at λmax = 710 nm and 880 nm for mix standards with varying concentrations of PO43− and a fixed concentration of 1 mM OPs. Error bars represent the standard deviation of duplicate experiments. If error bars are not visible, their size is smaller than the marker used to represent the data
Notably, PO43− impurities in OPs cannot account for the observed PO43− over-quantification in our study. This conclusion is based on two key observations. Firstly, nuclear magnetic resonance (NMR) analyses (Figs. S1–S3) revealed that phosphorus-containing impurities in the used EDTMP and DTPMP chemicals were minimal, amounting to only 1.37% and 3.40%, respectively. Even when assuming the highest possible PO43− impurities in OPs, as determined by the LODs of IC-ICP-MS, the contribution is quantitatively insufficient to explain the magnitude of over-quantification. For instance, in the case of DTPMP, the maximum possible impurity of 2.0 mol-% would only result in a fivefold increase in absorbance, which falls far short of the observed 19.8-fold increase. Secondly, if PO43− impurities were the sole cause, we would expect to see a linear relationship between absorbance and PO43− concentration, with a constant offset relative to pure PO43− standards. However, our results, as demonstrated in Fig. 3, showed spectral changes that are inconsistent with this explanation. Collectively, these findings indicate that the formation of new species rather than simple additive effects from impurities is the reason for the observed over-quantification of PO43−.
Given that the fixed concentration of OPs with varying PO43− concentrations induced distinct quantitative effects on the absorbance values at 710 and 880 nm, it seemed conceivable that varying concentrations of OPs would lead to additional effects. The systematic evaluation of the effects of different OPs and PO43− concentrations will be discussed in the following.
Impact of varying OP concentrations
To investigate the effects of varying OP concentrations on PO43− quantification, PO43− standards at three different concentrations (2 µM, 10 µM, and 100 µM) were prepared containing varying OP concentrations (0.2–20 µM, 1–100 µM, and 10–1000 µM). While previous discussions have primarily focused on relatively high molar ratios of OPs:PO43− (≥ 10), this section will additionally focus on ratios ranging from 0.1 to 10. To account for variations in PO43− measurements independent of OPs, ten individual PO43− standards at each concentration were prepared in ultrapure water and measured concurrently. The standard deviation of those measurements is represented by the dotted line in Fig. 4, with all SD values < 0.005.
Fig. 4.

Absorbance at λmax = 710 nm (left column) and 880 nm (right column) for fixed PO43− concentrations of 2 µM, 10 µM, and 100 µM, with varying OPs-to-PO43− molar ratios, using the MBTü method. The dotted lines represent the standard deviation of ten individual PO43− standards at three fixed concentrations, with all SD values < 0.005. Columns share the same x-axis, and rows share the same y-axis. Error bars represent the standard deviation of triplicate experiments. If error bars are not visible, their size is smaller than the marker used to represent the data
With the PO43− concentration fixed at 2 µM (Fig. 4a and b), the absorbance values for all matrices at both λmax generally fell within the deviation range for the individual PO43− standards in ultrapure water, except in the presence of DTPMP at 710 nm. Notably, starting from a molar ratio of DTPMP:PO43− > 2, a significant increase in absorbance was observed compared to the PO43− standard in ultrapure water. To quantitatively assess the increase in absorbance, the relative differences between the PO43− standards in (i) ultrapure water and (ii) the presence of OPs were calculated (Tables S2–S7). For DTPMP at 710 nm, the absorbance reached 91% at a molar ratio of 3, eventually building up to approximately 200% at a molar ratio of 10.
Similar results were observed for DTPMP when the concentration of PO43− was fixed at 10 µM (Fig. 4c and d). Additionally, for EDTMP, a slight increase in absorbance at 710 nm of approximately 20% was noted starting from a molar ratio of 8. Absorbances at λmax = 880 nm were more robust, with increases in absorbance observed solely for IDMP and DTPMP when the molar ratio reached 6, resulting in values ranging from 10 to 20%.
The increase in absorbance became more pronounced for PO43− concentration fixed at 100 µM, particularly for EDTMP and DTPMP (for quantitative details, see Tables S6 and S7). The highest relative increase in absorbance at λmax = 710 and 880 nm was observed at molar ratio of 10, with values of 81% and 13% for EDTMP, and 202% and 47% for DTPMP, respectively. Moreover, a trend of increasing absorbance at 710 nm in the cases of ATMP and IDMP was also observable. However, the relative increases in the values remained below 20%.
In general, the increase in absorbance due to the presence of OPs was more pronounced at 710 nm compared to 880 nm across all samples tested. This effect intensified with increasing OP concentrations, indicating that the MB reaction involved not only the coloring reagents and PO43− but also the OPs. As a result, varying concentrations of both PO43− and OPs induced spectral changes that disrupted the accuracy of absorbance measurements at 710 or 880 nm. This consequently impairing the linear correlation between PO43− concentration and absorbance, ultimately reflecting as an over-quantification of PO43− concentration across all OP backgrounds. However, implementing straightforward correction factors is challenging in studies involving OP transformation due to the dynamic variations in both PO43− and OP concentrations.
Among the six OPs tested, DTPMP exhibited the most substantial interference in PO43− quantification, likely due to its greater numbers of phosphonic acid groups. Cavaleiro et al. [38] reported that the tartaric acid primarily coordinates with Mo(VI) in a bidentate manner, to form stable five- or six-membered coordination rings. In contrast, organic acids that lack the necessary atom(s) on an α-carbon for the formation of such coordination rings do not appear to interfere with phosphate determination [42]. This also accounts for the lower interference observed for glyphosate and HEDP, as their interaction with Mo(VI) is likely too weak to significantly affect the MB reaction and, consequently, the photometric analysis.
Notably, the significant over-quantification of phosphate is of particular relevance in scenarios involving OP transformations in laboratory experiments, where OP initial concentrations are generally in the high µM to low mM range [11, 27, 43]. However, the interference effects of OPs observed at such high concentrations may not directly translate to environmental conditions, where the phosphate concentrations (0–2 mg/L in rivers [44]) usually are much higher than OP concentrations (0–3 µg/L in rivers and 0–50 µg/L in wastewater effluents [45]). Those typical environmental concentrations align with the experiments containing 2 µM phosphate (~ 0.06 mg/L in P) and OPs-to-phosphate molar ratio of 0.1, corresponding to OP concentration of 0.2 µM (~ 40–110 µg/L for OPs). Under these conditions negligible interference was observed, suggesting that the limitations of the MB method in the presence of OPs are probably irrelevant at environmental concentration levels.
As some OP transformation studies are conducted in more complex matrices containing cations and anions, which potentially influence the formation of the new species identified in this work. To assess the impact of matrix composition, we compared samples prepared in ultrapure water with those in a mixed matrix designed to simulate environmentally relevant conditions. The mixed matrix included earth metal cations (Ca2+, Mg2+, Fe2+, Na+, K+) and anions (Cl−, NO3−, HCO3−, SO42−). As illustrated in Fig. S6, the matrix did not exert additional effects on phosphate quantification beyond the interferences caused by OPs.
Case study—measurement of phosphate formation during simulated DTPMP transformation
In studies investigating OP transformations in laboratory experiments, the formation of PO43− is often used for quantification of reaction progress. However, the coexistence of OPs and PO43− throughout the transformation process impairs PO43− quantification, as demonstrated by the findings in this study. To assess the potential over-quantification of PO43− concentration by the MB method, a typical laboratory DTPMP degradation experiment was simulated with an initial concentration of 1 mM and under the assumption that equimolar concentration of PO43− is formed as DTPMP is degraded. Eleven samples with differing PO43− and DTPMP concentrations mimicking different stages of the degradation process were prepared. The absorbance of the simulated degradation samples was compared with that of PO43− standards in ultrapure water at corresponding concentrations (Fig. 5).
Fig. 5.

Comparison of absorbance at λmax = 710 nm and 880 nm of PO43− produced during DTPMP degradation with that of pure PO43− standards prepared in ultrapure water at equivalent concentrations. Error bars represent the standard deviation of triplicate experiments. If error bars are not visible, their size is smaller than the marker used to represent the data
Quantification using the MB method revealed substantially higher absorbances at 710 nm for the simulated degradation samples compared to PO43− standards of equivalent concentration prepared in ultrapure water. For instance, the absorbance corresponding to the generation of 10 µM PO43− in DTPMP degradation samples was approximately equivalent to that of 40 µM pure PO43− standards. The relative over-quantification of PO43− concentration at 810 nm was significantly lower than that observed at 710 nm. Specifically, the relative increase in absorbance for the DTPMP degradation samples containing 40 µM PO43−, when compared to equivalent pure PO43− standards, was only 8%. However, this deviation cannot be ignored, particularly during the early stages of DTPMP degradation when the molar ratio is relatively high.
Conclusion
This study highlights significant limitations of the MB method for PO43− quantification in the presence of OP chelating agents. The results showed substantial changes in the absorption spectra, characterized by the appearance of a new absorption maximum at 760 nm. The original λmax at 710 nm and 880 nm were shifted to longer wavelengths, accompanied by increased absorbance at these two λmax. These phenomena are attributed to the formation of new colored species involving PO43−, molybdate, and OPs, which disrupted the linear relationship between absorbance values and PO43− concentration, resulting in quantification inaccuracies.
Single-factor experiments demonstrated concentration-dependent interference, with higher concentrations of both substances exacerbating quantification inaccuracies. Notably, significant over-quantification of PO43− concentration was observed in the presence of larger OPs, such as EDTMP and DTPMP, particularly when the OPs-to-PO43− molar ratio exceeded 1. The relative increases in absorbance were less pronounced at λmax = 880 nm, suggesting 880 nm is more reliable for PO43− quantification. Among the OPs tested, DTPMP exhibited the strongest impact on absorbance values at both λmax, while glyphosate showed minimal effects. A case study simulating DTPMP degradation revealed over-quantification of PO43− by up to 350%, especially during early transformation stages, highlighting the method’s limitations in such contexts.
In view of these challenges, although the MB method remains a valuable tool for rapid PO43− quantification, its limitations require careful consideration of the specific OPs involved and their concentrations, particularly in OP transformation research at high concentrations. However, our results indicate negligible interference at low OP and PO43− concentrations, suggesting that the limitations of the MB method are probably irrelevant at environmentally relevant concentrations. To address these limitations in more complex matrices, future research should prioritize the development and application of complementary analytical techniques, such as chromatographic separation, post-column reactions prior to spectrometry, or the utilization of IC-ICP-MS, to improve the accuracy and reliability of PO43− quantification.
Supplementary Information
Below is the link to the electronic supplementary material.
(DOCX 6.92 MB)
Acknowledgements
We express gratitude to Dr. Daniel Buchner (Department of Geosciences, University of Tübingen) for his contributions to the improvement of this manuscript. We thank Sarah Bieger and Markus Kramer (Department of Chemistry, University of Tübingen) for conducting NMR to assess the purity of EDTMP and DTPMP. We also extend our gratitude to Mathis Athmer (Institute of Inorganic and Analytical Chemistry, University of Münster) for performing IC-ICP-MS and his contribution to quantify phosphate content in the purchased chemicals.
Author contribution
Ruoning Guo: methodology, visualization, validation, investigation, writing—original draft. Anna M. Röhnelt: methodology, validation, writing—review and editing. Philipp R. Martin: conceptualization, writing—review and editing. Stefan B. Haderlein: conceptualization, supervision, resources, writing—review and editing.
Funding
Open Access funding enabled and organized by Projekt DEAL. R.G. received the financial support provided by China Scholarship Council.
Data availability
The datasets generated during and/or analyzed during the current study are available from the corresponding author on reasonable request.
Declarations
Competing interests
The authors declare no competing interests.
Footnotes
Publisher's Note
Springer Nature remains neutral with regard to jurisdictional claims in published maps and institutional affiliations.
References
- 1.Grandcoin A, Piel S, Baurès E. Aminomethylphosphonic acid (AMPA) in natural waters: its sources, behavior and environmental fate. Water Res. 2017Jun;117:187–97. [DOI] [PubMed] [Google Scholar]
- 2.Nowack B. Environmental chemistry of phosphonates. Water Res. 2003;37(11):2533–46. [DOI] [PubMed] [Google Scholar]
- 3.Rott E, Steinmetz H, Metzger JW. Organophosphonates: a review on environmental relevance, biodegradability and removal in wastewater treatment plants. Sci Total Environ. 2018;615:1176–91. [DOI] [PubMed] [Google Scholar]
- 4.Rott E, Happel O, Armbruster D, Minke R. Behavior of PBTC, HEDP, and aminophosphonates in the process of wastewater treatment. Water. 2019;12(1):53. [Google Scholar]
- 5.Nowack B. The behavior of phosphonates in wastewater treatment plants of Switzerland. Water Res. 1998;32(4):1271–9. [Google Scholar]
- 6.Altaf R, Sun B, Lu H, Zhao H, Liu D. Removal and recovery of phosphonates from wastewater via adsorption. Crit Rev Environ Sci Technol. 2023;53(9):1032–58. [Google Scholar]
- 7.Schwientek M, Rügner H, Haderlein SB, Schulz W, Wimmer B, Engelbart L, et al. Glyphosate contamination in European rivers not from herbicide application? Water Res. 2024;263: 122140. [DOI] [PubMed] [Google Scholar]
- 8.Röhnelt AM, Martin PR, Athmer M, Bieger S, Buchner D, Karst U, et al. Glyphosate is a transformation product of a widely used aminopolyphosphonate complexing agent. Nat Commun. 2025;16(1):2438. [DOI] [PMC free article] [PubMed] [Google Scholar]
- 9.Röhnelt AM, Martin PR, Buchner D, Haderlein SB. Transformation of iminodi(methylene phosphonate) on manganese dioxides – passivation of the mineral surface by (formed) Mn 2+. Environ Sci Technol. 2023;57(32):11958–66. [DOI] [PubMed] [Google Scholar]
- 10.Martin PR, Buchner D, Jochmann MA, Elsner M, Haderlein SB. Two pathways compete in the Mn(II)-catalyzed oxidation of aminotrismethylene phosphonate (ATMP). Environ Sci Technol. 2022;56(7):4091–100. [DOI] [PubMed] [Google Scholar]
- 11.Kuhn R, Tóth E, Geppert H, Fischer T, Liebsch S, Martienssen M. Identification of the complete photodegradation pathway of ethylenediaminetetra(methylenephosphonic acid) in Aqueous Solution. Clean: Soil, Air, Water. 2017;45(5):1500774. [Google Scholar]
- 12.Lesueur C, Pfeffer M, Fuerhacker M. Photodegradation of phosphonates in water. Chemosphere. 2005;59(5):685–91. [DOI] [PubMed] [Google Scholar]
- 13.Marks RGH, Drees F, Rockel S, Kerpen K, Jochmann MA, Schmidt TC. Mechanistic investigation of phosphonate photolysis in aqueous solution by simultaneous LC-IRMS and HRMS analysis. J Photochem Photobiol, A. 2023;439: 114582. [Google Scholar]
- 14.Steber J, Wierich P. Properties of aminotris (methylenephosphonate) affecting its environmental fate: degradability, sludge adsorption, mobility in soils, and bioconcentration. Chemosphere. 1987;16(6):1323–37. [Google Scholar]
- 15.Martell AE, Motekaitis RJ, Fried AR, Wilson JS, MacMillan DT. Thermal decomposition of EDTA, NTA, and nitrilotrimethylenephosphonic acid in aqueous solution. Can J Chem. 1975Nov 15;53(22):3471–6. [Google Scholar]
- 16.Tschäbunin G, Schwedt G, Fischer P. Zur Analytik von Polymethylenphosphonsäuren: III. Untersuchungen zur Stabilität von Ethylendiamintetramethylenphosphonsäure (EDTMP) in wäßriger Lösung [1]. Z Anal Chem. 1989;333(2):123–8.
- 17.Schowanek D, Verstraete W. Hydrolysis and free radial mediated degradation of phosphonates. J Environ Qual. 1991Oct;20(4):769–76. [Google Scholar]
- 18.Ruffolo F, Dinhof T, Murray L, Zangelmi E, Chin JP, Pallitsch K, et al. The microbial degradation of natural and anthropogenic phosphonates. Molecules. 2023;28(19):6863. [DOI] [PMC free article] [PubMed] [Google Scholar]
- 19.Jolley D, Maher W, Cullen P. Rapid method for separating and quantifying orthophosphate and polyphosphates: application to sewage samples. Water Res. 1998;32(3):711–6. [Google Scholar]
- 20.Ruizcalero V, Galceran M. Ion chromatographic separations of phosphorus species: a review. Talanta. 2005;66(2):376–410. [DOI] [PubMed] [Google Scholar]
- 21.Packa V, Maedler S, Howell T, Bostan V, Diep N, Tooley R, et al. Unbiased measurement of phosphate and phosphorus speciation in surface waters. Environ Sci Technol. 2019;53(2):820–8. [DOI] [PubMed] [Google Scholar]
- 22.Nagul EA, McKelvie ID, Worsfold P, Kolev SD. The molybdenum blue reaction for the determination of orthophosphate revisited: opening the black box. Anal Chim Acta. 2015;890:60–82. [DOI] [PubMed] [Google Scholar]
- 23.Fiske CH, Subbarow Y. The colorimetric determination of phosphorus. J Biol Chem. 1925;66(2):375–400. [Google Scholar]
- 24.Lowry OH, Lopez JA. The determination of inorganic phosphate in the presence of labile phosphate esters. J Biol Chem. 1946;162(3):421–8. [PubMed] [Google Scholar]
- 25.Vaskovsky VE, Kostetsky EY, Vasendin IM. A universal reagent for phospholipid analysis. J Chromatogr A. 1975;114(1):129–41. [DOI] [PubMed] [Google Scholar]
- 26.Murphy J, Riley JP. A modified single solution method for the determination of phosphate in natural waters. Anal Chim Acta. 1962;27:31–6. [Google Scholar]
- 27.Jaisi DP, Li H, Wallace AF, Paudel P, Sun M, Balakrishna A, et al. Mechanisms of bond cleavage during manganese oxide and UV degradation of glyphosate: results from phosphate oxygen isotopes and molecular simulations. J Agric Food Chem. 2016;64(45):8474–82. [DOI] [PubMed] [Google Scholar]
- 28.Riedel R, Krahl K, Buder K, Böllmann J, Braun B, Martienssen M. Novel standard biodegradation test for synthetic phosphonates. J Microbiol Methods. 2023;212: 106793. [DOI] [PubMed] [Google Scholar]
- 29.Mutke XAM, Drees F, Lutze HV, Schmidt TC. Oxidation of the N-containing phosphonate antiscalants NTMP and DTPMP in reverse osmosis concentrates: reaction kinetics and degradation rate. Chemosphere. 2023;341: 139999. [DOI] [PubMed] [Google Scholar]
- 30.Marks RGH, Rockel SP, Kerpen K, Somnitz H, Martin PR, Jochmann MA, et al. Effects of pH-dependent speciation on the photolytic degradation mechanism of phosphonates. J Photochem Photobiol, A. 2024;448: 115327. [Google Scholar]
- 31.Barrett KA, McBride MB. Oxidative degradation of glyphosate and aminomethylphosphonate by manganese oxide. Environ Sci Technol. 2005;39(23):9223–8. [DOI] [PubMed] [Google Scholar]
- 32.Obojska A, Lejczak B, Kubrak M. Degradation of phosphonates by streptomycete isolates. Appl Microbiol Biotechnol. 1999;51(6):872–6. [DOI] [PubMed] [Google Scholar]
- 33.Baginski ES, Foa PP, Zak B. Determination of phosphate: study of labile organic phosphate interference. Clin Chim Acta. 1967;15(1):155–8. [Google Scholar]
- 34.Baldwin DS. Reactive “organic” phosphorus revisited. Water Res. 1998;32(8):2265–70. [Google Scholar]
- 35.Marks RGH, Rockel SP, Kerpen K, Somnitz H, Martin PR, Jochmann MA, et al. Effects of pH-dependent speciation on the photolytic degradation mechanism of phosphonates. J Photochem Photobiol, A. 2024;448: 115327. [Google Scholar]
- 36.Laskov C, Herzog C, Lewandowski J, Hupfer M. Miniaturized photometrical methods for the rapid analysis of phosphate, ammonium, ferrous iron, and sulfate in pore water of freshwater sediments. Limnology & Ocean Methods. 2007;5(1):63–71. [Google Scholar]
- 37.Association APH. Standard methods for the examination of water and wastewater. 23rd ed. Washington DC: APHA Press; 2017. [Google Scholar]
- 38.Cavaleiro AMVSV, Gil VMS, Pedrosa De Jesus JD, Gillard RD, Williams PA. N.m.r. studies of complexes of molybdenum(VI) with tartaric acid in aqueous solution. Transition Met Chem. 1984;9(2):62–7.
- 39.Cruywagen JJ, Heyns JB, Van De Water RF. A potentiometric, spectrophotometric, and calorimetric investigation of molybdenum(VI)–oxalate complex formation. J Chem Soc, Dalton Trans. 1986;9:1857–62. [Google Scholar]
- 40.Cruywagen JJ, Rohwer EA, Wessels GFS. Molybdenum(VI) complex formation—8. Equilibria and thermodynamic quantities for the reactions with citrate. Polyhedron. 1995;14(23–24):3481–93.
- 41.Chalmers RA, Sinclair AG. Analytical applications of β-heteropoly acids: this influlsnce of complexing agents on selective formation. Anal Chim Acta. 1966;34:412–8. [Google Scholar]
- 42.Wei LL, Chen CR, Xu ZH. The effect of low-molecular-weight organic acids and inorganic phosphorus concentration on the determination of soil phosphorus by the molybdenum blue reaction. Biol Fertil Soils. 2009;45(7):775–9. [Google Scholar]
- 43.Sun S, Wang S, Ye Y, Pan B. Highly efficient removal of phosphonates from water by a combined Fe(III)/UV/co-precipitation process. Water Res. 2019;153:21–8. [DOI] [PubMed] [Google Scholar]
- 44.Kinniburgh JH, Barnett M. Orthophosphate concentrations in the River Thames: reductions in the past decade: orthophosphate concentrations in the River Thames. Water Environ J. 2009;24(2):107–15. [Google Scholar]
- 45.Armbruster D, Rott E, Minke R, Happel O. Trace-level determination of phosphonates in liquid and solid phase of wastewater and environmental samples by IC-ESI-MS/MS. Anal Bioanal Chem. 2020;412(20):4807–25. [DOI] [PubMed] [Google Scholar]
Associated Data
This section collects any data citations, data availability statements, or supplementary materials included in this article.
Supplementary Materials
(DOCX 6.92 MB)
Data Availability Statement
The datasets generated during and/or analyzed during the current study are available from the corresponding author on reasonable request.