

Abstract
Aquatic food production plays a crucial role in ensuring global food security, improving the quality of life, and reducing greenhouse gas (GHG) emissions. In this study, we have comprehensively evaluated the GHG emissions associated with China’s fisheries, considering both production and consumption. Scenario analysis was used to compare the potential of GHG emissions reduction under two conditions: maintaining current protein intake levels, and increasing the consumption of aquatic foods to align with global average. Our findings reveal that in 2020, the total GHG emissions from aquatic foods in China reached approximately 64.51 million tonnes CO2e (45.69 kg CO2e/per capita). However, when calculated from the consumption side, emissions amounted to just 19.32 million tonnes CO2e (13.69 kg CO2e/per capita). Increasing the consumption of aquatic foods could reduce GHG emissions by 24.55 million tonnes CO2e (17.39 kg CO2e/per capita). Effective strategies to achieve these reductions include minimizing waste in production and consumption, modifying dietary habits, and substituting terrestrial animal meat with aquatic foods.
Subject terms: Environmental impact, Agriculture
Introduction
Global warming, driven by the greenhouse effect, presents a major challenge for humanity1. It brings about numerous adverse environmental consequences, including food shortages2, heightened global socioeconomic inequality3, and the deterioration of human living conditions. These challenges are expected to worsen if greenhouse gas (GHG) emissions are not managed effectively4. In response, countries worldwide have set a shared goal of achieving carbon neutrality by developing low-carbon economies in the near future5. China, in particular, announced an ambitious target in 2019: to peak GHG emissions by 2030 and achieve carbon neutrality by 2060.
The interaction between climate change and food production systems are believed to significantly influences GHG emissions6. Agriculture, as a key human activity, accounts for approximately a quarter of global GHG emissions7,8. Reducing GHG emissions from agricultural systems has therefore become central to achieving global GHG reduction targets9. In addition, it is widely recognized that global dietary patterns have a significant environment impact and serve as a critical driver of climate change10. Globally, economically advanced countries have tended to shift towards meat-heavy diets11,12, which are closely associated with a significant rise in carbon emissions12.
Aquatic goods, as a vital source of daily nutrition, generally produce relatively lower GHG emissions compared to terrestrial animal protein sources1,13. Expanding the utilization of aquatic resources through capture fisheries and seawater aquaculture aligns with the goals of improving nutritional health (Sustainable Development Goal-SDGs-2) and promoting sustainable consumption and production (SDGs-12)14. Improving the efficiency of aquatic food production and reducing waste throughout production and consumption are important to achieving these goals.
Aquatic foods offer substantial economic, environmental, and nutritional benefits. Previous studies have examined the economic benefits of fish production across various aquaculture systems15. Fisheries uniquely exhibit both carbon emission and carbon sequestration capabilities16 (GHG emissions from aquatic food primarily from the use of equipment and inputs to facilities during fishing, farming, processing and transportation. While shellfish in aquatic food form calcium carbonate shells through calcification, which sequesters carbon for a long time. Algae absorb carbon dioxide through photosynthesis, and some of the carbon is deposited with the algae into the deep sea or sediments.), thereby playing a positive role in alleviating environmental pressures. Currently, GHG emissions from aquatic foods have received considerable attention from scholars17, with research typically addressed three primary areas. First, GHG emissions are often evaluated within separate sectors, such as freshwater or seawater fisheries16,18, capture fisheries or aquaculture1,19,20, and the aquatic foods processing industry21. Second, the potential contribution of fisheries to carbon sequestration has been addressed in previous research22. Third, spatiotemporal variations in GHG emissions from seawater aquaculture in China have been explored18. Nevertheless, comprehensive studies encompassing the entire lifecycle of aquatic foods, from production to transportation and consumption, and their potential for reducing GHG emissions remain limited. The quantification of this potential also requires further exploration.
This study introduces key innovations by comparing GHG emissions from fisheries across production and consumption stages and quantifying the potential of aquatic foods to reduce GHG emissions. Using statistical data, this research focuses on China as a case study. The objectives of this study are to (1) calculate the carbon footprint of the fishery industry by integrating the production, transportation, and consumption processes; (2) compare GHG emissions of various animal-based foods per unit of protein; and (3) evaluate the potential impact of dietary consumption pattern adjustments on GHG emissions in China.
Results
GHG emissions of aquatic foods production
In 2020, the total GHG emissions from aquatic foods production were estimated at 71.22 million tonnes CO2e. Seawater fisheries were found to produce higher GHG emissions compared to freshwater fisheries, primarily due to the high emissions from capture fisheries, which form the majority of Chinese seawater fisheries. The total carbon sinks from fisheries were about 18.81 million tonnes CO2e (Fig. 1a). As a result, the net GHG emissions from aquatic food production, initially calculated at 83.32 million tonnes CO2e (71.22 million tonnes from production plus 12.1 million tonnes from transportation), were reduced to 64.51 million tonnes CO2e (Table S2). This indicates that carbon sinks from aquaculture can offset approximately one-fifth of the net GHG emissions from aquatic food production. Shellfish and algae are particularly effective for carbon sequestration and are considered key species for enhancing carbon sink storage in aquaculture. In 2020, the carbon sequestration capacity of shellfish amounted to 8.18 million tonnes of CO2e, while algae contributed 3.47 million tonnes of CO2e (Table S2).
Fig. 1. GHG emissions from aquatic foods in China.

a GHG emissions and carbon sinks during aquatic food production. The carbon sinks of aquaculture can offset the net GHG emissions from aquatic foods. b Emissions from production and transport in the fishery and processing sectors. APPI refers to the aquatic product processing industry. c GHG emissions from the transportation of imported (1.05 million tonnes CO2e) and exported aquatic foods (3.75 million tonnes CO2e) are included in the total GHG emissions.
GHG emissions from the aquatic product processing industry (APPI) total 6.18 million tonnes CO2e (Fig. 1b, Table S2), with approximately 2.93 million tonnes CO2e resulting from the transportation of materials and products. Notably, emissions from the transportation process within fisheries and the APPI sector account for 47% of the total GHG emissions from APPI.
Direct GHG emissions from the transportation of aquatic foods, based on input-output data, amount to approximately 12.1 million tonnes CO2e, which represents 19% of the total GHG emissions from the fisheries sector. Thus, aquatic foods production accounts for 81% of total GHG emissions. Within this, transportation directly linked to the fishery sector contributes only 16% of the sector’s total emissions (Fig. 1b). This indicates that transportation-induced emissions are not the primary source of GHG emissions in the fishery industry. Instead, direct and indirect emissions from aquatic foods production play a more significant role.
In 2020, China’s import and export volumes of aquatic foods in China were relatively low. GHG emissions from aquatic food exports were about 3.75 million tonnes CO2e, accounting for 6% of the total aquatic food emissions. Emissions from aquatic food imports were around 1.05 million tonnes of CO2e, mainly arising from domestic transportation (Fig. 1c). Notably, GHG emissions from imports were much lower than those from aquatic food production. Increasing aquatic food imports could potentially help meet protein demand while reducing China’s overall GHG emissions.
In 2020, the per capita carbon footprint for aquatic food production in China was 45.69 kg CO2e, while the footprint from a consumption perspective was only 13.69 kg CO2e (Fig. 2). The carbon footprint estimated based on production and transportation is 3.3 times (Per capita possession/Per capita consumption) higher than that based solely on consumption (Fig. 3). Actual GHG emissions from aquatic food consumption in China amounted to 19.32 million tonnes CO2e, equivalent to 30% of total emissions from aquatic foods.
Fig. 2. Comparison of GHG emissions from aquatic food production and consumption.

a Comparison of world per aquatic food consumption, China’s per capita/per year aquatic food consumption, and China’s per capita/per year aquatic food possession. b Comparison of GHG emissions from world per aquatic food consumption, China’s per capita/per year aquatic food consumption, and China’s per capita/per year aquatic food possession. c Comparison of GHG emissions from production versus consumption.
Fig. 3. GHG emission from aquatic foods in production, transportation, and consumption.
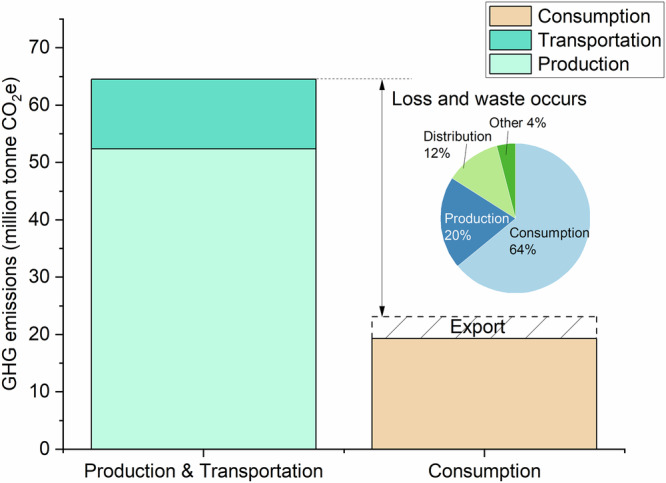
The gap between production, transportation, and consumption emissions is mostly due to losses and waste. Pie charts illustrate the proportions of waste sources, using data from Karwowska29.
According to the Food and Agriculture Organization of the United Nations (FAO), the global average carbon per capita footprint of aquatic food consumption in 2020 was 20.19 kg CO2e, higher than China’s average. However, due to China’s large population and growing demand for healthy food, there may be concerns about environmental impacts if per capita aquatic food consumption increases to match the global average. If China’s per capita aquatic food carbon footprint were to reach 20.19 kg CO2e, the total carbon footprint of aquatic foods in the country would be approximately 95.20 million tonnes CO2e.
GHG emissions intensity of aquatic food production
The GHG emissions coefficients, measured in units of crude protein, differ between freshwater and seawater foods. The GHG emissions (tonne CO2e) per tonne protein, referred to as GHG emissions intensity (GEI), are approximately 9.66 for freshwater foods and 13.70 for seawater foods (Fig. 4). Consequently, seawater fisheries tend to produce higher GHG emissions, resulting in a higher GEI compared to freshwater fisheries. The total GEI for aquatic food is about 11.42 (Fig. 4). Fish, being the largest contributor to GEI, exhibit both high yields and high protein content. On the other hand, while shellfish have high yields, their low edible flesh content results in lower protein yields. Promoting the development of aquatic foods with low GHG emissions intensities could enhance protein yields, reduce GHG emissions, and support sustainable food production.
Fig. 4. GHG emission intensity of aquatic food production.

a Protein content of aquatic foods, b GHG emissions from aquatic foods, c GHG emissions intensity of aquatic foods.
GHG emissions for different consumption patterns
This study explores the potential reduction in GHG emissions through three consumption scenarios: increasing aquatic food consumption under the current dietary pattern, increasing freshwater food consumption, and increasing seawater food consumption (Table 1).
Table 1.
Scenarios of aquatic food consumption
| Scenarios of aquatic foods consumption | ||
|---|---|---|
| Current Aquatic Food Scenario (CAFS) | Freshwater Food Scenario (FFS) | Seawater Food Scenario (SFS) |
| Keeping the current protein intake unchanged | ||
|
Increase aquatic food consumption
Global average of aquatic food consumption |
Increase freshwater food consumption
Global average of aquatic food consumption |
Increase seawater food consumption
Global average of aquatic food consumption |
The GHG emissions coefficient for crude protein produced from terrestrial animal meat, egg, and poultry (TAMEP) products is about 37.52. This means that TAMEP products generate nearly four times the GHG emissions per unit of protein compared to freshwater products (9.66) and 2.7 times the emissions of seawater products (13.70). The current per capita GHG emissions, referred to as the Status Quo, amount to 316.37 kg CO2e. Under the Current Aquatic Foods Scenario (CAFS), per capita GHG emissions decrease to 298.99 kg CO2e, representing a reduction of 17.39 kg CO2e (5.50% of the Status Quo emissions). This reduction occurs when per capita aquatic food consumption increases to align with the global average. China is projected to lower its GHG emissions by approximately 24.55 million tonnes CO2e (Table S3). Under the Freshwater Food Scenario (FFS), where aquatic food consumption increases to the global average solely through higher freshwater food intake, per capita GHG emissions drop to 297.81 kg CO2e. This corresponds to a reduction of approximately 26.22 million tonnes CO2e (5.87% of the Status Quo emissions) compared to the current consumption pattern. If dietary patterns change according to the Seawater Food Scenario (SFS), where only seawater aquatic food consumption rises to the global average level, China can achieve a GHG emissions reduction of 22.41 million tonnes CO2e (5.02% of the Status Quo emissions) relative to the current situation (Fig. 5, Table S3). Studies suggest that increasing aquatic food consumption in daily life can contribute to environmental conservation due to its higher nutritional value compared to TAMEP products13,23. Therefore, promoting aquatic food consumption represents a promising measure for China to advance toward its carbon neutrality goal by 2060.
Fig. 5. Comparison of greenhouse gas (GHG) emissions by scenario analysis.

a GHG emissions per capita in the Status Quo Scenario in 2020. TAMEP stands for Terrestrial Animal Meat, Eggs and Poultry. b GHG emissions under different scenarios compared with the Status Quo. CAFS stands for Current Aquatic Foods Scenario, FFS is Freshwater Food Scenario and SFS is Seawater Food Scenario.
According to the scenario analysis, replacing some TAMEP with fish could reduce GHG emissions by 24.55 million tonnes CO2e per year. From 2020 to 2050, this shift could result in a cumulative reduction of 737 million tonnes CO2e, which represents 8.9% of the total CO2 reduction target by 2050 under the 1.5 °C scenario (Fig. 6). Replacing TAMEP-source proteins, such as pigs, beef, mutton, and other terrestrial meat, with proteins from aquatic foods offers significant potential to mitigate GHG emissions while simultaneously contributing to food and nutrition security9,24–26. In 2020, per capita aquatic food consumption in China was significantly lower than the global average. However, if per capita aquatic food consumption increases to the global average under the current domestic production system, an additional 28.97 million tonnes CO2e emissions would be generated. On the other hand, if the shortfall in aquatic food supply in China is addressed through imports, the target of achieving low per capita GHG emissions could be met. This would not only support sustainable consumption but also enhance international trade in aquatic foods.
Fig. 6. Comparison of potential aquatic foods emission reduction.
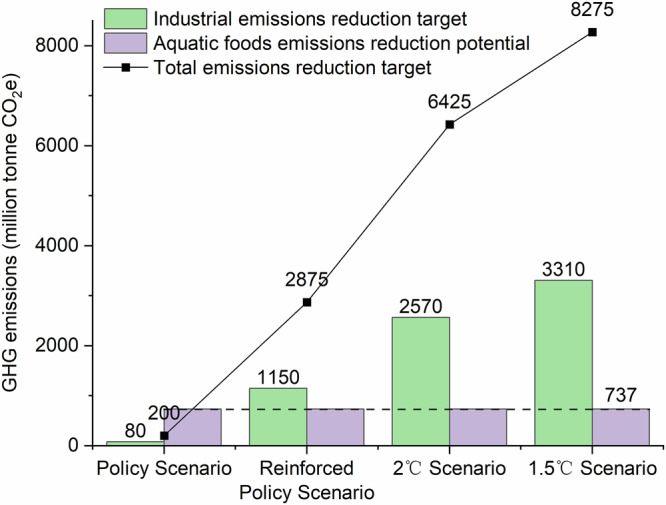
The dashed line is the GHG mitigation potential of aquatic foods by 2050. The solid line is the GHG mitigation target for different scenarios by 2050. Data of the Industrial sector were obtained from China’s Long-term Low-carbon Development Strategy and Pathways48.
In Fig. 6, the carbon emission reduction potential of four scenarios on 2020–2050 low-carbon development strategy is compared. The Policy Scenario is supported by China’s Nationally Determined Contribution (NDC) targets, action plans and related policies under the Paris Agreement. It also incorporates a continuation of current trends and policy measures. In the Reinforced Policy Scenario, efforts are further intensified to reduce the energy intensity of GDP and carbon dioxide intensity. The share of non-fossil energy in primary energy consumption is increased, alongside stricter policies for implementing clean energy solutions. The 2 °C Scenarios focuses on achieving the 2 °C global temperature control target, with corresponding policies and actions aimed at reducing carbon emissions through optimized energy use. The 1.5 °C Scenario aims to limit the global temperature rise to less than 1.5 °C. It includes achieving net-zero carbon dioxide emissions and further reductions in other greenhouse gases by the middle of the 21st century.
Discussion
Aquatic food production and consumption significantly impact GHG emissions. GHG emissions from aquatic foods, when estimated based on production and transportation, exceed those estimated based solely on current consumption data (Fig. 3). Typically, GHG emissions from aquatic food consumption are calculated based on statistical data primarily provided by sellers, which often leads to an underestimation. Notably, the early production stages contribute the most to aquatic food emissions (81%). Therefore, reducing emissions at this stage is crucial. From the production to the consumption of aquatic foods, a great amount of loss or waste may occur, which is often ignored27. For example, GHG emissions from the preceding stages of aquatic food production are not considered when calculating the emissions of processed aquatic foods28. Karwowska29 reported that the majority of the loss and waste (64%) occurs at the consumer level, while 20% occurs during processing and 12% during distribution. The food supply system involves many sectors, including food producers’ health and safety, transportation costs, and storage capacity30. Lu27 reported that loss and waste within the food supply chain are primary contributors to the discrepancy between GHG estimations from production versus consumption. Based on an estimation by the FAO31 in 2011, the rate of food loss and waste during processing and distribution within the East Asian supply chain is approximately 11% (5% in processing and packaging, and 6% in distribution). This relatively low rate contributes to the small carbon footprint of aquatic foods, as estimated from analyzed consumption data.
The production of aquatic foods has contributed to the reduction of GHG emissions. GHG emissions from food consumption and associated activities within food supply chains are estimated to account for nearly one-third of global GHG emissions32. Terrestrial animal meat and dairy products are responsible for approximately 80% of these emissions from food systems32. According to the FAO31, fisheries only account for about 5% of the total GHG emissions from agriculture and fisheries combined. Aquatic foods are notably diverse compared to terrestrial meats33, offering higher nutrient density and unique nutritional benefits, such as Omega-3 fatty acids (e.g., DHA, EPA), vitamin B12, and minerals (e.g., iodine, selenium)34. Our study has also confirmed that protein from aquatic foods plays a key role in reducing GHG emissions. The environmental benefits of an aquatic foods diet are highly dependent on species selection and production methods. Locally consumed mussels, kelp, and well-managed small fish can have a lower carbon footprint than a vegetarian diet. While pork remains the main source of animal protein in the Chinese diet, the demand for aquatic foods has risen alongside income growth35,36. To optimize the environmental benefits, it is essential to prioritize low trophic level species in aquatic foods selection, following the “sardine principle”. Consuming small fish such as anchovies and herring is 10 times more efficient in biomass use compared to tuna. Dietary patterns are a key driver of environmental impacts, especially in the context of climate change37. Achieving true environmental sustainability requires a focus on three principles: (1) reducing meat consumption, (2) shortening the geographical radius of supply chains, and (3) adhering to the principle of “low trophic priority”.
Strategies for balancing the demand and supply of aquatic food consumption in China are essential for achieving sustainable development. The importance of food production and consumption in ensuring environmental sustainability is well established38. Our study indicates that in 2020, per capita aquatic food consumption in China was lower than the global average. If China’s aquatic food consumption reaches the global average, it could lead to the adoption of a dietary pattern that is more effective in reducing GHG emissions. Addressing the gap between the current provision and the rising demand for aquatic foods in China has become a vital task. Balancing the import and export of aquatic foods has become crucial to bridge this gap. Additionally, increasing food diversity and promoting the sustainable use of natural resources would further support environmental and economic benefits. China plays an important role in aquatic food production, consumption, and international trade33. Strengthening China’s fishery industry may have significant implications for the global aquatic foods trade, food security, and the conservation of marine environments39. This would also contribute to achieving the global goals for sustainable consumption and production of aquatic foods, as outlined in SDGs-12.
Methods
This study was designed to examine the entire lifecycle of aquatic foods production and transportation. First, we calculated the total GHG emissions from China’s aquatic food sector and quantified the emissions volumes at each stage. The potential contribution of China’s aquatic foods consumption to reducing emissions was evaluated by comparing the emissions per unit of crude protein from aquatic foods with those from terrestrial animal foods, such as meat and eggs. In this study, three different scenarios of increasing aquatic food consumption were designed in order to estimate and compare the environmental impacts of aquatic food consumption in China. One is based on the current pattern of aquatic food consumption; the second is to increase freshwater food consumption; and the last one is to increase seawater food consumption alone. These three scenarios were used to examine the potential contribution of aquatic food production to the SDGs, particularly in providing sufficient daily nutrition for humans.
Estimation of the fishery carbon footprint
Greenhouse gas emissions from the entire lifecycle of aquatic foods, known as the carbon footprint (CF), are commonly reported in units of mass of CO2e40. The CF of China’s fisheries can be obtained by subtracting the carbon sinks from the total GHG sources, which comprise of emissions from both the production and transportation processes. Additionally, GHG emissions related to the import and export of aquatic foods were considered (Fig. 7). Finally, the status quo for per capita/per year possession, consumption, and demand for aquaculture and capture fisheries in China was calculated based on population and dietary pattern guidelines.
Fig. 7. Framework on the GHG footprint of aquatic foods in China.

The CF of China’s fisheries can be obtained by subtracting carbon sinks from the total GHG sources, which comprise emissions from the production and transportation processes of aquatic foods. These processes, include capture, aquaculture, and the aquatic product processing industry (APPI). Detailed calculation methods for the carbon footprint of aquatic food production and transportation are presented in Table S1.
GHG emissions in aquatic food production
The total GHG emissions from capture fisheries and aquaculture production processes were estimated from both direct and indirect sources. Direct emissions include diesel combustion from fishing vessel21 and the CH4 and N2O from aquaculture41(Table S1). Indirect GHG emissions stem from electricity usage by equipment for aquatic food processing and transportation (Fig. 7)21. GHG emissions linked to the aquatic product processing industry (APPI), including aquatic frozen products, fishmeal products, dry pickled products, algae processing products, canned products, and aquatic feed processing, were calculated based on t data from the Fishery Statistical Yearbook of China42 (Table S1).
Shellfish and algae are important components of carbon sinks in mariculture. Phytoplankton and particulate organic matter in seawater can be removed through food filtration and photosynthesis, respectively. Consequently, large amounts of carbon from seawater can be absorbed and fixed. The carbon sink potential of seawater fisheries in China was estimated through two paths: accumulation of Particulate Organic Carbon (POC) and Dissolved Organic Carbon (DOC) during the growth of shellfish and seaweeds22 (Table S1).
The carbon sink potential of freshwater fisheries was calculated based on the mean carbon content in freshwater fishes, assuming all carbon in freshwater fisheries comes from natural sources. Among them, filter feeder fish, such as silver carp and aristichthys nobilis mainly rely on plankton that originate from natural sources. For omnivorous fishes such as grass carp, crucian carp, and common carp, approximately 20% of their food comes from natural baits (e.g., plankton and seaweed), and 50% of the food consumed by river crabs is from natural sources22. Therefore, the carbon sink potential of freshwater fisheries was estimated based on the proportion of natural food intake throughout their life cycle (Table S1).
GHG emissions in aquatic food transportation
In this study, GHG emissions from aquatic food transportation were calculated using methods proposed by Dong and Miller43 in 2021. GHG emissions from transportation, i.e., post-production, include refrigerated warehouses, first-stage refrigerated transport (long haul), distribution centers, second stage refrigerated transport (short haul) and retail outlets. GHG emissions from the transportation were estimated based on fuel combustion, packaging processing, refrigerant use, refrigerant leakage, and waste management (Table S1).
GHG emissions from import and export of aquatic foods
GHG emissions from aquatic food exports were estimated based on the energy usage during aquatic food production and transportation. This was defined according to the proportion of exported aquatic foods relative to the total aquatic food production in China. However, GHG emissions from imported aquatic foods were limited to energy usage for domestic transportation. The total GHG emissions for imported aquatic foods were calculated based on their percentage in the total domestic aquatic food supply during transportation (Table S1).
GHG emissions of aquatic foods per capita
As of 2020, per capita aquatic food production in China was approximately 46.39 kg. Thus, the per capita GHG emissions associated with China’s aquatic food production can be calculated accordingly. However, per capita aquatic food consumption in China stood at only 13.9 kg/year in 2020, significantly lower than the global average level 20.5 kg/year, as reported by the Food and Agriculture Organization of the United Nations (FAO)44. Per capita GHG emissions from aquatic food consumption in China were calculated based on the population size and dietary patterns (Table S1).
The data for aquatic food production, aquaculture scale, and capture fisheries power used in this study were collected from China Fishery Statistical Yearbook (2020)42. Forage yield data were obtained from the China Statistical Yearbook45. The CO2 coefficient of electricity consumption (ω) 0.6101 tonnes CO2/MWh is based on the officially released data by the National Development and Reform Commission of China in 201546. The sources of the other data are listed in Table S1.
Quantification of GHG emissions intensity of aquatic foods
The GHG emissions intensity (GEI) of aquatic foods is defined as the GHG emissions per unit protein in each aquatic product. It reflects the potential contribution of each product to GHG emissions, with a high GEI indicating a heavy burden of GHG emissions associated with the production of these foods. The GEI of aquatic foods is defined by Eqs. 1 and 2:
| 1 |
Where, is protein yield (tonne); the yield of the product (tonne); is the coefficient of protein corresponding to the aquatic foods (crude protein content). The protein content of each aquatic product is based on the data of Boyd11 and the list of Chinese Foods Ingredients.
| 2 |
Where, is GEI of unit protein production (kg CO2/kg protein); is total crude protein yield (tonne); is the GHG emissions induced by the corresponding protein production (tonne).
Scenario analysis of aquatic food consumption
Scenario analysis is a useful tool for evaluating the potential effects of future developments. It allows an in-depth understanding of the changes that could occur under different conditions and predicts how aquatic food consumption may influence carbon neutrality. In this study, three scenarios were employed to examine the contribution of aquatic food production and consumption to GHG emissions reduction. Scenario 1 (Current Aquatic Foods Scenario, CAFS) maintains the current protein intake, increasing aquatic food consumption to the global average level while retaining the same dietary pattern. Scenario 2 (Freshwater Food Scenario, FFS) increases freshwater food consumption only, and Scenario 3 (Seawater Food Scenario, SFS) increases seawater food consumption only, up to the global average level.
In general, aquatic foods offer a higher nutritional value and lower environmental effects than terrestrial animal meat, eggs, and poultry (TAMEP) products13,23. Thus, the potential contribution of fisheries to GHG emissions reduction can be evaluated by comparing the GHG emissions per crude protein between TAMEP and aquatic foods. Protein was used as the nutritional measurement unit, aligning with its role as the main nutrient source in both aquatic and TAMEP products, as highlighted in previous studies47. For comparison purposes, we assumed that the total crude protein consumed in all scenarios remains constant at 9.41 kg per capita/per year, based on the current dietary patterns of Chinese people (Eq. 1). Second, the GHG emissions per unit of protein for TAMEP products and aquatic foods were calculated using Eq. 2. Finally, the potential contribution to GHG emissions reduction was discussed based on increasing aquatic food consumption to align with the global average level.
Supplementary information
Acknowledgements
This work was funded by the National Natural Science Foundation of China (No. 42130402). The icon in Fig. 7 is from the publicly available icon library of iconfount(https://www.iconfont.cn).
Author contributions
Y.C.: Investigation, Data curation, Methodology, Writing—original draft. F.W.: Writing—review & editing. H.Z.: Funding acquisition, Methodology, Validation, Writing—review & editing.
Data availability
All data are available from the corresponding author upon request.
Competing interests
The author declares no competing interests.
Footnotes
Publisher’s note Springer Nature remains neutral with regard to jurisdictional claims in published maps and institutional affiliations.
Supplementary information
The online version contains supplementary material available at 10.1038/s41538-025-00457-0.
References
- 1.Parker, R. W. et al. Fuel use and greenhouse gas emissions of world fisheries. Nat. Clim. Change8, 333 (2018). [Google Scholar]
- 2.Mora, C. et al. Broad threat to humanity from cumulative climate hazards intensified by greenhouse gas emissions. Nat. Clim. Change8, 1062 (2018). [Google Scholar]
- 3.Diffenbaugh, N. S. & Burke, M. Global warming has increased global economic inequality. Proc. Natl. Acad. Sci. USA116, 9808–9813 (2019). [DOI] [PMC free article] [PubMed] [Google Scholar]
- 4.West, J. J. et al. Co-benefits of mitigating global greenhouse gas emissions for future air quality and human health. Nat. Clim. Change3, 885–889 (2013). [DOI] [PMC free article] [PubMed] [Google Scholar]
- 5.Kong, F. & Wang, Y. F. How to understand carbon neutrality in the context of climate change? With special reference to China COMMENT. Sustain Environ.8, 1–14 (2022). [Google Scholar]
- 6.Special Report on Climate Change and Land. IPCC (2019).
- 7.Poore, J. & Nemecek, T. Reducing food’s environmental impacts through producers and consumers (vol 363, eaaw9908, 2019). Science363, 939–939 (2019). [DOI] [PubMed] [Google Scholar]
- 8.Climate change 2013: the physical science basis. Contribution of working group I to the fifth assessment report of the intergovernmental panel on climate change. IPCC (2013).
- 9.Willett, W. et al. Food in the Anthropocene: the EAT-Lancet Commission on healthy diets from sustainable food systems. Lancet393, 447–492 (2019). [DOI] [PubMed] [Google Scholar]
- 10.Campbell, B. M. et al. Agriculture production as a major driver of the Earth system exceeding planetary boundaries. Ecol. Soc.22, (2017).
- 11.Kearney, J. Food consumption trends and drivers. Philos. T R. Soc. B365, 2793–2807 (2010). [DOI] [PMC free article] [PubMed] [Google Scholar]
- 12.Zhu, Y. Y., Zhang, Y. & Zhu, X. H. Carbon emission effects driven by evolution of Chinese dietary structure from 1987 to 2020. Chin. Geogr. Sci.34, 181–194 (2024). [Google Scholar]
- 13.Cavaliere, A. et al. Exploring the environmental impact associated with the abandonment of the Mediterranean Diet, and how to reduce it with alternative sustainable diets. Ecol. Econ.209, (2023).
- 14.Gephart, J. A. et al. Environmental performance of blue foods. Nature597, 360 (2021). [DOI] [PubMed] [Google Scholar]
- 15.Laine, C., Ollikainen, M., Kankainen, M., Setälä, J. & Vielma, J. Social net benefits from aquaculture production: a comparison of net cage cultivation and recirculating aquaculture systems. Aquacult. Econ. Manag. (2023).
- 16.Gao, Y. et al. Spatial-temporal differentiation and influencing factors of marine fishery carbon emission efficiency in China. Environ. Dev. Sustain.26, 453–478 (2024). [Google Scholar]
- 17.Chen, G. Z., Bai, J. H., Bi, C., Wang, Y. Q. & Cui, B. S. Global greenhouse gas emissions from aquaculture: a bibliometric analysis. Agr. Ecosyst. Environ.348, (2023).
- 18.Xu, C. J. et al. Assessment of greenhouse gases emissions and intensity from Chinese marine aquaculture in the past three decades. J. Environ. Manage329, (2023). [DOI] [PubMed]
- 19.MacLeod, M. J., Hasan, M. R., Robb, D. H. & Mamun-Ur-Rashid, M. Quantifying greenhouse gas emissions from global aquaculture. Sci. Rep.-UK10, (2020). [DOI] [PMC free article] [PubMed]
- 20.Chang, C. C., Chang, K. C., Lin, W. C. & Wu, H. Carbon footprint analysis in the aquaculture industry: assessment of an ecological shrimp farm. J. Clean. Prod.168, 1101–1107 (2017). [Google Scholar]
- 21.Xu, H. et al. Estimation of fishery energy consumption in China. China Fish.11, 74–76 (2007). in Chinese. [Google Scholar]
- 22.Lai, Q. Y. et al. Current and Future Potential of Shellfish and Algae Mariculture Carbon Sinks in China. Int. J. Env. Res. Pub. He.19, (2022). [DOI] [PMC free article] [PubMed]
- 23.van Dooren, C., Marinussen, M., Blonk, H., Aiking, H. & Vellinga, P. Exploring dietary guidelines based on ecological and nutritional values: A comparison of six dietary patterns. Food Policy44, 36–46 (2014). [Google Scholar]
- 24.Bene, C. et al. Feeding 9 billion by 2050-Putting fish back on the menu. Food Secur.7, 261–274 (2015). [Google Scholar]
- 25.Thilsted, S. H. et al. Sustaining healthy diets: The role of capture fisheries and aquaculture for improving nutrition in the post-2015 era. Food Policy61, 126–131 (2016). [Google Scholar]
- 26.Gephart, J. A. et al. Scenarios for Global Aquaculture and Its Role in Human Nutrition. Rev. Fish. Sci. Aquac.29, 122–138 (2020). [Google Scholar]
- 27.Lu, S. J. et al. Quantifying supply chain food loss in China with primary data: A large-scale, field-survey based analysis for staple food, vegetables, and fruits. Resour. Conserv. Recy.177, (2022).
- 28.Chen, D. D., Gao, W. S., Gao, Y. Q. & Zhang, Q. Ecological footprint analysis of food consumption of rural residents in China in the latest 30 years. Agric. Agric. Sci. Proc.1, 106–115 (2010). [Google Scholar]
- 29.Karwowska, M., Laba, S. & Szczepanski, K. Food loss and waste in meat sector-why the consumption stage generates the most losses? Sustainability-Basel13, (2021).
- 30.Parry, M. L., Rosenzweig, C., Iglesias, A., Livermore, M. & Fischer, G. Effects of climate change on global food production under SRES emissions and socio-economic scenarios. Glob. Environ. Chang14, 53–67 (2004). [Google Scholar]
- 31.Global food losses and food waste. FOA (2011).
- 32.Scarborough, P. et al. Dietary greenhouse gas emissions of meat-eaters, fish-eaters, vegetarians and vegans in the UK. Climatic Change125, 179–192 (2014). [DOI] [PMC free article] [PubMed] [Google Scholar]
- 33.Naylor, R. L. et al. Blue food demand across geographic and temporal scales (vol 12, 5413, 2021). Nat. Commun.12, (2021). [DOI] [PMC free article] [PubMed]
- 34.Zamborain-Mason, J. et al. A decision framework for selecting critically important nutrients from aquatic foods. Curr. Environ. Health Rep.10, 172–183 (2023). [DOI] [PMC free article] [PubMed] [Google Scholar]
- 35.Cai, J. N. & Leung, P. Unlocking the potential of aquatic foods in global food security and nutrition: A missing piece under the lens of seafood liking index. Glob Food Secur-Agr.33, (2022).
- 36.Koehn, J. Z., Allison, E. H., Golden, C. D. & Hilborn, R. The role of seafood in sustainable diets. Environ. Res. Lett.17, (2022).
- 37.Lucas, S. et al. The environmental impact of the consumption of fishery and aquaculture products in France. J. Clean Prod.299, (2021).
- 38.Merino, G. et al. Can marine fisheries and aquaculture meet fish demand from a growing human population in a changing climate?. Glob. Environ. Chang22, 795–806 (2012). [Google Scholar]
- 39.Su, S., Tang, Y., Chang, B. W., Zhu, W. B. & Chen, Y. Evolution of marine fisheries management in China from 1949 to 2019: How did China get here and where does China go next?. Fish Fish21, 435–452 (2020). [Google Scholar]
- 40.Meinrenken, C. J. et al. The Carbon Catalogue, carbon footprints of 866 commercial products from 8 industry sectors and 5 continents. Sci. Data9, (2022). [DOI] [PMC free article] [PubMed]
- 41.Ma, Y. et al. A comparison of methane and nitrous oxide emissions from inland mixed-fish and crab aquaculture ponds. Sci. Total Environ.63, 7517–7523 (2018). [DOI] [PubMed] [Google Scholar]
- 42.Chinese Academy of Fishery Sciences. China Fishery Statistical Yearbook2020 (2020).
- 43.Dong, Y. B. & Miller, S. A. Assessing the lifecycle greenhouse gas (GHG) emissions of perishable food products delivered by the cold chain in China. J. Clean Prod.303, (2021).
- 44.Action, S. I. World fisheries and aquaculture. FAO, 2020 1–244 (2020).
- 45.National Bureau of Statistics of China. China Statistical Yearbook 2020 (2020).
- 46.National Development and Reform Commission of China. Accounting methods and Reporting Guidelines for greenhouse gas emissions of enterprises Power generation facilities (2017).
- 47.Boyd, C. E., McNevin, A. A. & Davis, R. P. The contribution of fisheries and aquaculture to the global protein supply. Food Secur.14, 805–827 (2022). [DOI] [PMC free article] [PubMed] [Google Scholar]
- 48.Institute of Climate Change, Sustainable Development of Tsinghua University. China’s Long-Term Low-Carbon Development Strategies and Pathways: Comprehensive Report (2022).
Associated Data
This section collects any data citations, data availability statements, or supplementary materials included in this article.
Supplementary Materials
Data Availability Statement
All data are available from the corresponding author upon request.