

Abstract
While food directed immunoglobulin E (IgE) has been studied in the context of allergies, the prevalence and magnitude of IgG responses against dietary antigens are incompletely characterized in the general population. Here, we measured IgG binding against food and environmental antigens obtained from allergen databases and the IEDB (immune epitope database), represented in a phage displayed library of 58,233 peptides. By profiling blood samples of a large cohort representing the average adult Israeli population (n=1,003), we showed that many food antigens elicited systemic IgG in up to 50% of individuals. Dietary intake of specific food protein correlated with antibody binding, suggesting that diet can shape the IgG epitope repertoire. Our work documents abundant systemic IgG responses against food antigens and provides a reference map of the exact immunogenic epitopes on a population scale, laying the foundation to unravel the role of food- and environmental antigen-directed antibody binding in disease contexts.
Graphical Abstract
Introduction
Humans are constantly exposed to a myriad of potential antigens, ranging from commensal and pathogenic microbes, environmental antigens such as plant pollen or dust, to the daily ingestion of food. Diet can effect both the innate and adaptive immune system in a plethora of ways (Childs et al., 2019). Yet, while the immune recognition of microbiota has been studied in depth (Bunker and Bendelac, 2018; Li et al., 2020; Zeng et al., 2016), immune responses against food have primarily been studied in the context of allergies (Tordesillas et al., 2017; Yu et al., 2016).
The development of food allergies is believed to be impacted by environmental factors, including the gut microbiome composition (Alexander and Turnbaugh, 2020; Pascal et al., 2018; Stephen-Victor et al., 2020). The most frequent type of food allergies are driven by immunoglobulin E (IgE) antibodies binding to food proteins (Yu et al., 2016), which can also cause local immune responses and pain in the intestines (Aguilera-Lizarraga et al., 2021). While in animal models the production of allergen specific IgA and IgG has also been investigated (Zhang et al., 2020), in humans the roles of Ig classes other than IgE in the context of allergies are less frequently studied. It has been shown that food proteins can elicit mucosal IgA (Hoh and Boyd, 2018), detectable in stool samples (Frossard et al., 2004; Kamemura et al., 2015), as well as systemic IgA in blood (Husby et al., 1985; Konstantinou et al., 2014a, 2014b; Vazquez-Ortiz et al., 2013). Mucosal IgA responses have been suggested to counteract allergic responses (Corthésy, 2013), although this view has been challenged by recent work reporting that regular food exposure only induces weak IgA responses in a subset of test animals (Zhang et al., 2020).
Systemic antibody production of IgG, the primary antibody class accounting for ~75% of serum Igs, against food proteins has been investigated even less frequently. Studies from the 1980s testing a few protein food antigens have demonstrated that non-allergic individuals can produce IgG against some food items (Husby et al., 1985). In the early 2000s, serological tests for the subclass IgG4 binding to food proteins have been promoted as means to diagnose hypersensitivity. However, in a position paper by the European Academy of Allergy and Clinical Immunology (EAACI), such food specific IgG responses have been recognized as occurring simply from frequent exposure to these foods without any pathological implication (Hamilton, 2009; Stapel et al., 2008). On the contrary, IgG4 against allergens is rather elevated in allergen-specific immunotherapy and considered to exert protective effects as “blocking antibodies” by competing allergen binding by IgE (Eckl-Dorna et al., 2019; James and Till, 2016; Santos et al., 2015). In this respect, the ratio of IgG4/IgE specific for a certain allergen, has been shown to be higher in sensitized but tolerant individuals, than in allergic individuals (Nikolov et al., 2021; Okamoto et al., 2012; Santos et al., 2015) (although depending on the context (Datema et al., 2019; Michailidou et al., 2021) and the type of allergic disorder can also play a role (Smoldovskaya et al., 2018)). In addition to this beneficial role of IgG4, also the IgG1 subclass is relevant in the context of IgE driven allergies, as affinity maturation of IgE antibodies is viewed to follow a trajectory via precursor IgG1 cells switching to IgE (Satitsuksanoa et al., 2021; Xiong et al., 2012) with complex mechanisms of IgG1 memory cells mediating memory of IgE responses (He et al., 2017; Hoof et al., 2020; Saunders et al., 2019). Overall beyond some specific examples, IgG responses have been reported for very few food proteins due to limitations of conventional ELISAs to screen larger sets of antigens, and the exact epitopes targeted are vastly unknown (Gocki and Bartuzi, 2016; Stapel et al., 2008).
Recently, wheat (Monaco et al., 2021) and peanut (Chen et al., 2021) specific IgE and IgG responses have been profiled in allergic and non-allergic individuals, leveraging a high throughput phage display based methodology (‘AllerScan’ (Chen et al., 2021; Monaco et al., 2021) based on phage immunoprecipitation sequencing (PhIP-Seq) (Mohan et al., 2018)). However, the frequency and magnitude of systemic antibody responses in the general population against proteins from a variety of different foods have never been systematically assessed. Hence, the antibody driven ‘baseline’ and the human food specific Ig epitope repertoires are widely unknown.
Here, we profiled antibody responses against databases of food and environmental proteins represented as 58,233 peptides in a large cohort of 1,003 Israeli individuals. We showed that certain foods were frequently targeted by antibody responses, correlating with dietary intake, and providing a reference map of the exact immunogenic epitopes of food proteins.
Results
Generated a library of 58,233 peptides from food and environmental antigens
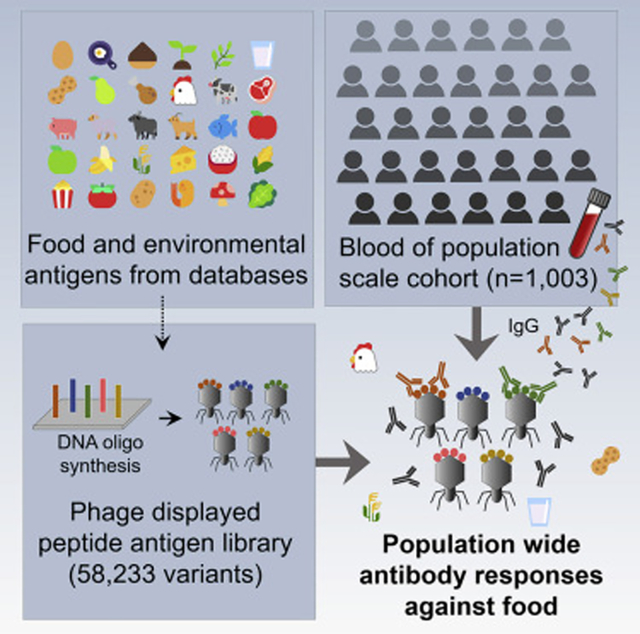
We applied a high throughput method relying on phage displayed synthetic oligo libraries (PhIP-Seq, (Mohan et al., 2018)) that allows to test for hundreds of thousands of rationally selected peptide antigens in parallel (Fig. 1a). With conventional ELISAs it is only possible to test a single antigen at a time. With peptide array methodologies, several thousands of antigens can be measured at once, however every antigen needs to be tediously produced or purified in advance. In contrast, PhIP-Seq allows to produce and to measure hundreds of thousands of variants in parallel. Furthermore, the library design of PhIP-Seq can be based on protein sequences from virtually any source, that can be rationally selected (rather than cloning cDNA libraries, as performed in conventional phage display) (Mohan et al., 2018).
Fig. 1: Profiling of blood samples of a large cohort representing the average adult Israeli population (n=1,003) by PhIP-Seq detects a variety of antibody responses against food antigens represented as phage displayed library.

a, Outline of the PhIP-Seq (Mohan et al., 2018) workflow to measure serum Ig epitope repertoires. *All B cell epitopes deposited in the immune epitope database (IEDB, (Vita et al., 2015)) except for non-human host and Chagas disease were included (STAR methods section, allergens from IEDB were not counted to this part of the library).
b, Content of the phage displayed 58,233-variant antigen library. The total number of 7,541 proteins encompasses 1,434 proteins from the IEDB and 6,107 proteins from allergen databases. Due to in part highly similar sequences, these proteins were grouped into 1,334 lead sequences, that were completely represented, while for the other proteins differences to these lead proteins were encoded as separate peptides (STAR methods).
c, On average, ~322±106 peptides of the food and environmental antigen library are significantly (see STAR methods for statistical framework) enriched per individual (in the full antigen library, 246±97 peptides when excluding controls). The center line shows the median. Box limits indicate the 25th and 75th percentiles as determined by Excel software. Whiskers extend to 1.5 times the interquartile range from the 25th and 75th percentiles. n = 1,003 individuals.
d,e Comparison of the abundance of antibody responses against proteins from allergen databases with proteins from the IEDB. The coloring in e is the same as in b. A full list of peptides bound in >5/10% is provided in Table S 1). Statistical test for difference: Number of bound peptides on average 84±56 peptides for proteins from allergen databases (out of 25,519), 160±54 for IEDB (out of 31410). Mann-Whitney test on the proportion of samples significantly bound for each peptide in the allergen database group vs. in the IEDB group p-value < 10-111.
f,g Comparison of the magnitude of antibody responses against antigens from allergen databases (mostly food proteins) vs. antigens from the IEDB (Mann-Whitney test on fold change of all peptides and all samples p-value < 10−31). In panel f log FC values (‘Fold change’ referring to the ratio between reads in the IP reaction with antibodies vs. input sequencing of the phage library, an estimate for binding strength) are plotted for the entire library. In panel g a histogram of the FC values of the number of peptides bound are summarized.
We have previously implemented this methodology to profile antibody responses against microbiota at population scale (Vogl et al., 2021). Here, we aimed to generate a comprehensive antigen library encompassing an array of various food and environmental proteins. Therefore, we included all proteins deposited in five allergen databases: WHO/IUIS Allergen Nomenclature Database (Radauer et al., 2014), Allergome (Mari et al., 2006), AllergenOnline (Goodman et al., 2016) (including the list of celiac proteins), the Structural Database of Allergenic Proteins (SDAP) (Ivanciuc et al., 2003), and the Database of allergen families (AllFam) (Radauer et al., 2008). These databases represent the largest collections of allergenic proteins in humans including varying metadata around routes of exposure and the source organisms, as well as details on the protein function of the allergens. Beyond food proteins, representing the primary interest of this study, these databases also encompass various other allergens such as proteins from dust mites, cockroaches, or bumblebees. These antigens were included in our library, as the annotations of the databases were not always accurate, sometimes not assigning foods to the correct category by default. Hence, we always processed the entire databases not to miss any food proteins. Even though these environmental allergens had elicited only sparse antibody responses in our PhIP-Seq experiments, they were analyzed together with the food proteins and not removed from the analysis pipeline: From a technical perspective, it was reassuring that despite all these different antigens had been measured in parallel, little cross-reactivity had occurred (discussed in further detail below).
We included also nearly all B cell antigens deposited in the Immune Epitope Database (IEDB) (Vita et al., 2015) (Methods section). The IEDB contains a vast array of proteins from bacterial and viral pathogens, human proteins targeted in autoimmune responses, as well as allergens. Rather than only including the allergens from the IEDB, we included also the other antigen groups, as these could serve as benchmarks and controls. Antibody responses against food and environmental antigens can be compared against the magnitude of binding against antigens from infectious diseases. Concomitantly, little binding against human proteins (‘self’) is expected in individuals not suffering from autoimmune diseases, serving as a negative baseline threshold. Furthermore, by including antigens of infectious diseases, food specific antigen responses can be correlated with bacterial and viral antigens to test for associations (as anti-food Ig responses could be linked to increased antigen exposure via increased gut permeability during gastrointestinal infections). In the following analyses, we grouped the allergens of the IEDB with the proteins from the allergen databases (to avoid bias when comparing the latter to antigens of infectious diseases or auto-antigens, and to avoid duplication of proteins [as there was a substantial overlap between databases]).
Overall, 7,541 proteins were divided into 58,233 peptides (length of 54 amino acids with overlaps of 20 amino acids), allowing for high-resolution, epitope-resolved analysis of protein segments targeted by antibodies. In detail, 25,527 peptides from allergen databases, 31,436 peptides from the IEDB, and 1,270 peptides of various positive and negative controls were included (Fig. 1b). The peptides were encoded in Escherichia coli codon usage and barcoded within the coding sequence (CDS) for identification (STAR methods and ref. (Vogl et al., 2021)). The experimental workflow was optimized and validated as outlined previously (Vogl et al., 2021) by a series of controls metrics yielding reliable results (Figure S 1).
Measured population-scale Ig responses against food proteins
With this large library of food and environmental proteins available, we measured the serum antibody responses of 1,003 Israeli individuals. While severe conditions (chronic inflammation, gastrointestinal issues, cancer etc.) were excluded, this cohorts exhibits a range of health issues frequently observed in populations with a western lifestyle such as obesity (see (Zeevi et al., 2015) for detailed recruitment criteria and cohort characteristics). Environmental and food allergies were not explicit exclusion criteria for enrollment in the study (implications elaborated in the discussion section). We had previously analyzed serum Ig repertoires against microbiota of nearly the same individuals and details on the cohort have been published (Vogl et al., 2021; Zeevi et al., 2015). In short, the participants were aged 17–70 years with metadata such as metagenomics sequencing and blood tests available. Overall, we tested 58 million antibody–peptide interactions (58,233 epitopes in each of the 1,003 individuals). On average 322±106 peptides were significantly enriched per individual (by scoring against input reads and Bonferroni correction, as described in the STAR methods, Fig. 1c).
Antigens deposited in the IEDB were significantly more abundantly bound than food proteins selected from allergen databases (Mann-Whitney p-value <10−111, Fig. 1d,e). This result was expected, as the IEDB contains many antigens of infectious diseases, that are known to be targeted by antibodies either from previous infections or from vaccination (see Table S 1 for a list). Concomitantly, the food proteins deposited in the databases, have been reported to elicit IgE responses in relatively few allergic individuals, in line with their underrepresentation compared to the IEDB. However, we detected abundant antibody responses against certain peptides of food proteins in approximately half of the cohort (Fig. 1d, Fig. 2a, Table S 1). Some peptides of the cow milk protein casein were bound in up to 53% of individuals and antibodies against casein from water buffalo (peptides bound in up to 43% of individuals) and sheep (up to 41%) were frequently detected, possibly owing to cross-reactivity between highly similar sequences of domestic even-toed ungulates (Fig. 2b,g, Figure S 2–Figure S 4, Fig. 3, Table S 2 ). Also, peptides of chicken egg proteins were frequently bound (ovomucoid in up to 38% of individuals) as well as cereals such as wheat (26%) or rice (22%). Other frequent Ig responses included binding against peptides of legumes such as lentils (in 18% of individuals), peas (12%), and chickpeas (9%), as well as proteins form Solanaceae (tomato in 18% and potato in 10%, Table S 1). Similar to milk caseins, these proteins frequently showed antibody binding to multiple overlapping peptides, suggesting a distinct immunogenic region an potential cross-reactivity (Fig. 2b,d–g, Figure S 3, Table S 2).
Fig. 2: Frequent antibody responses against food proteins (a,b) cluster to shared epitopes (c-i).
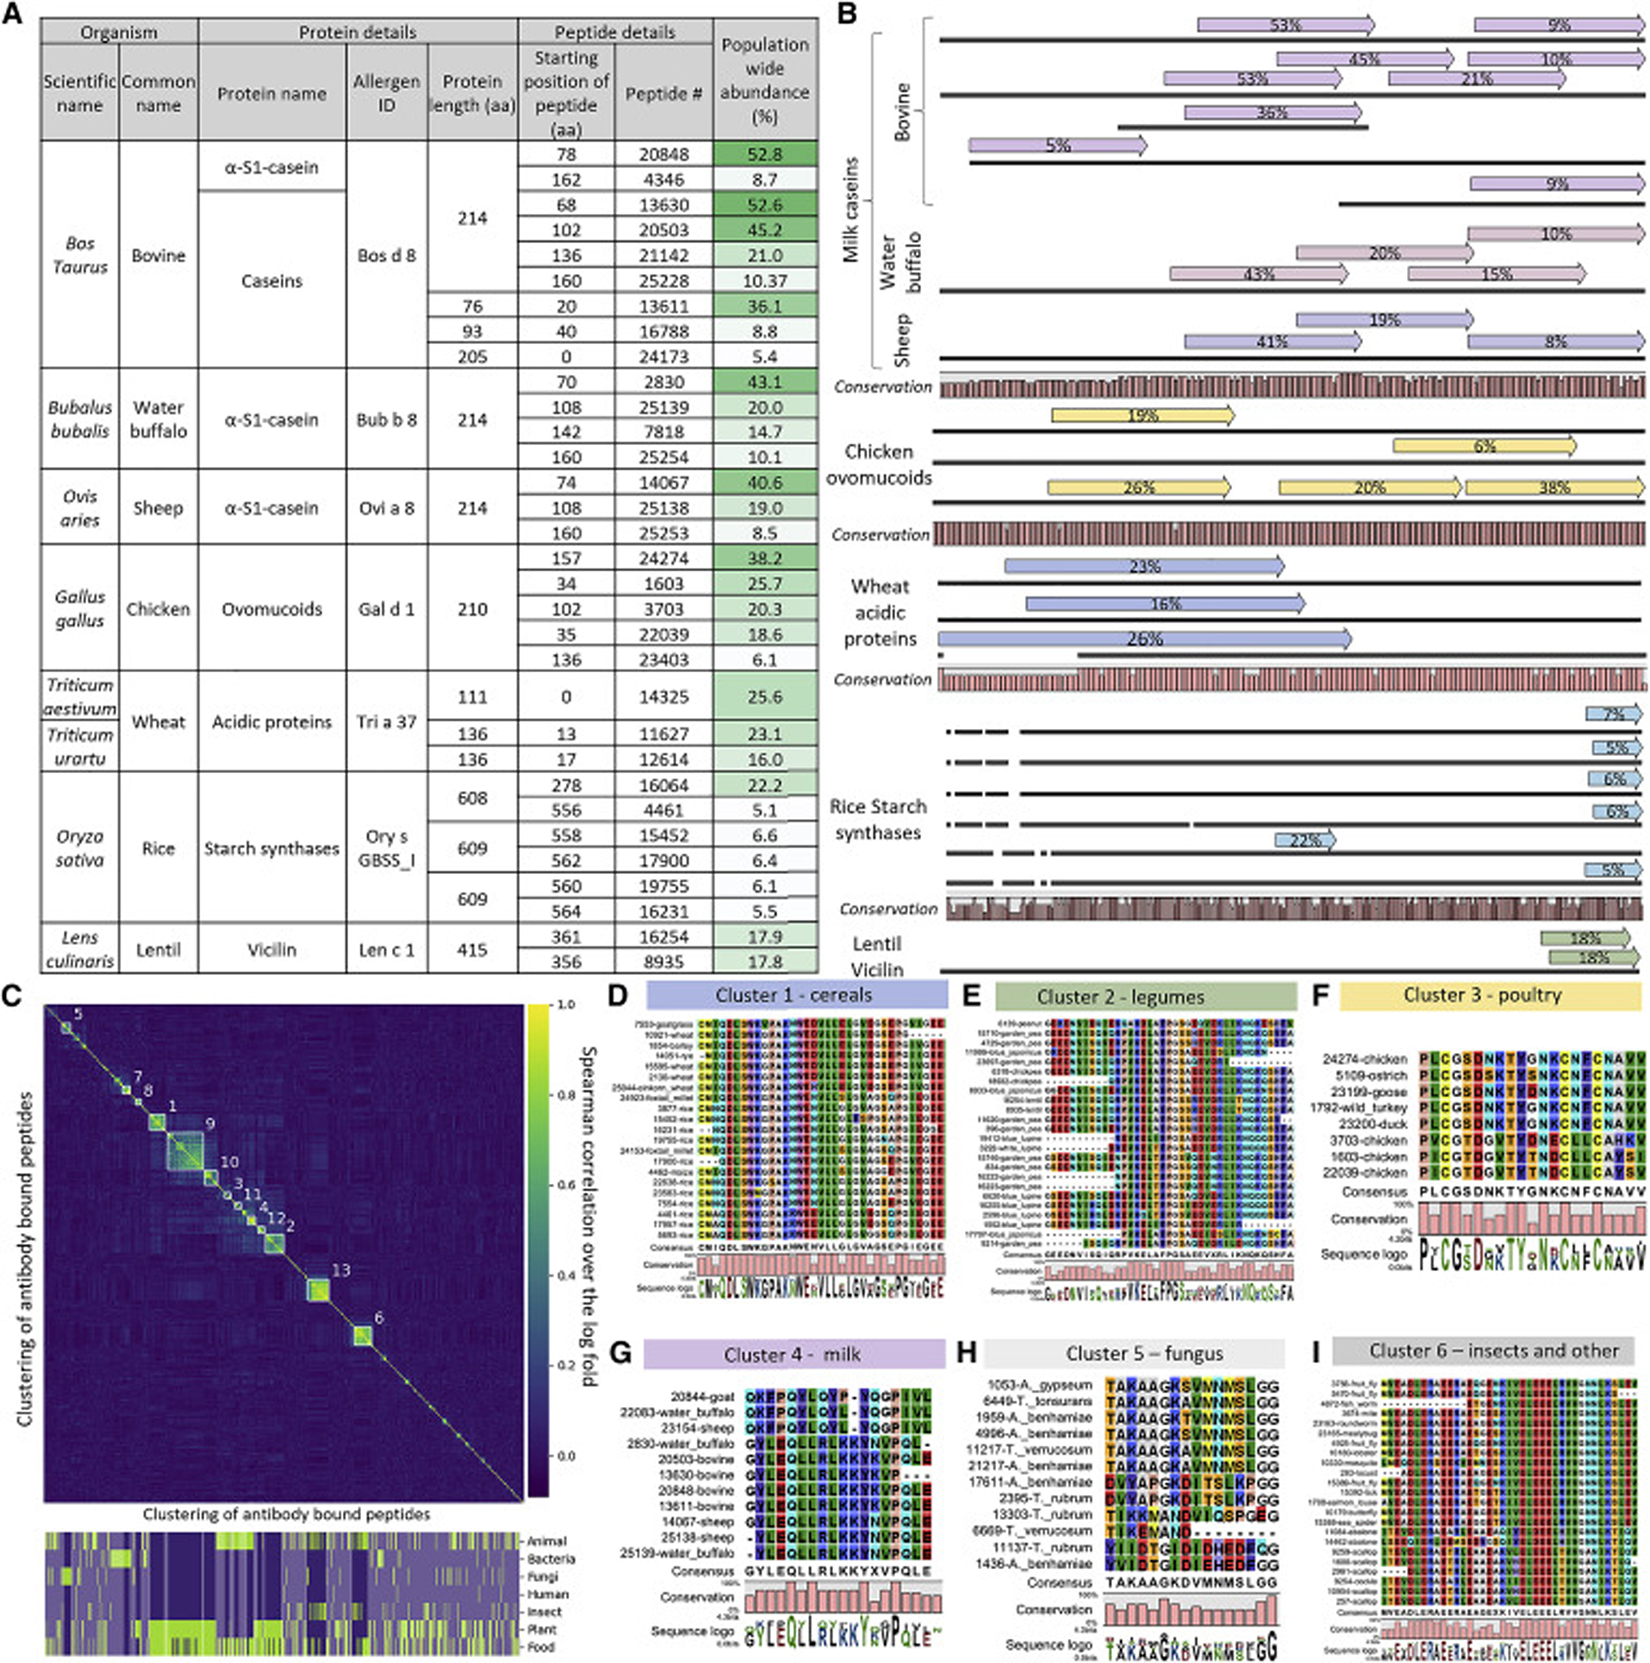
a, The frequency of antibody binding against selected peptides from food proteins is listed. Only proteins for which antibody binding against at least two peptides were detected and where binding against at least one peptide occurred in more than ca. 20% of the cohort, see Table S 1 for an extended table).
b, Alignments of peptides from panel a to the originating proteins. Similar proteins (such as bovine caseins) are grouped together. Each dark line represents a protein, arrows above represent antibody bound peptide (the % number in the arrow indicates population wide antibody binding abundances [also listed in panel a]), the percentage of conservation between the protein sequences is illustrated at the bottom. Conservation was assessed by aligning the protein sequences with CLC Main Workbench 6.9.2 in standard settings (the bars show the conservation ratio from 0 to 1 for each amino acid position). Alignments for each protein group are drawn to scale, and all groups are relatively scaled to fit the width of the panel (the y-axis is simply the length of the respective amino acid sequence). This illustration provides a condensed overview, see Figure S 2 for detailed alignments.
c, Clustering of antibody responses against food proteins to test for shared epitopes. A clustered distance matrix between all peptides from food proteins, which are bound in >2% of the cohort, is shown. Clustering is based on average distance hierarchical clustering, on a distance matrix calculated by the Spearman correlation over the log fold changes of pairs of peptides, on the full set of samples. Marked clusters are all clusters of 10 peptides or above, when setting the clustering height threshold at 0.7. See Table S 2 for detailed information on the bound peptides. Bottom of the panel: Binary classifications if the peptides are part of a category/group (true = green/false = purple). Opaque sections are not part of a marked cluster.
d-i, Peptides from representative clusters shown in panel c were aligned to highlight shared epitopes. Alignments were generated with MegaX (MUSCLE algorithm in standard settings, (Kumar et al., 2018)) and visualized with CLC Main Workbench 6. Core motifs are shown, whereas the full alignments and alignments for additional clusters are provided in Figure S 3.
Fig. 3: Combined clustering of antibody bound peptides from allergen databases and the IEDB (a) shows mixed clusters (b-f) primarily originating from clustering thresholds (g) and cross-reactivity against shared motifs (h-i).
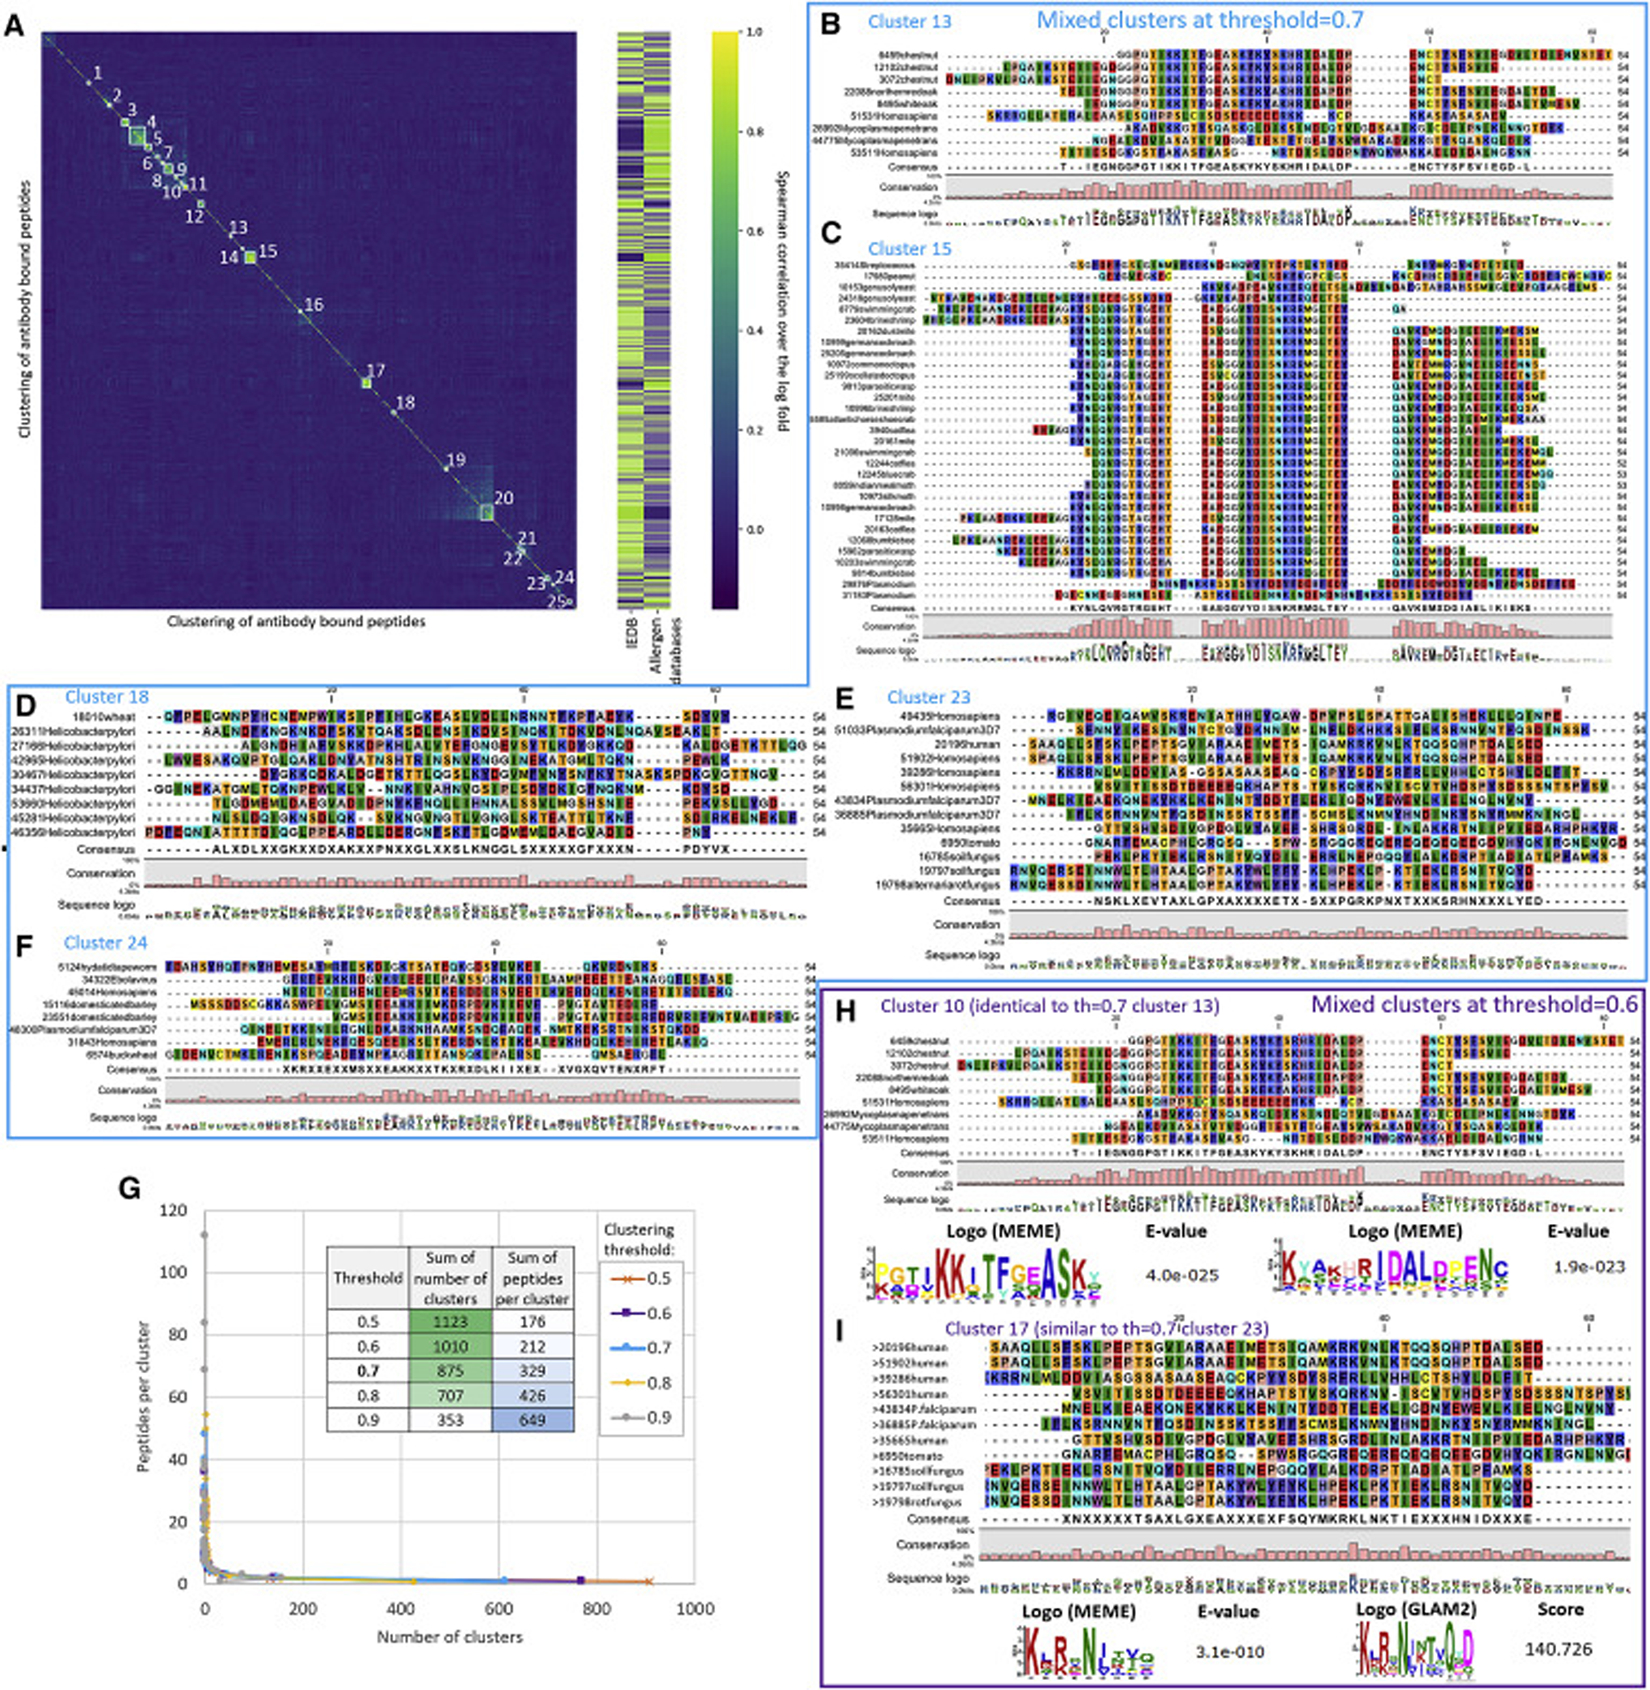
a, In Fig. 2c (Figure S 3) and Figure S 4 peptides from allergen databases (25,527 peptides) or the IEDB (31,436 peptides) were clustered separately. Here, clustering of antibody responses against all 56,963 peptides together is shown (following the same clustering parameters outlined in Fig. 2c, Figure S 3, Figure S 4). See Table S 2 for detailed information on the clusters and the bound peptides constituting them.
b-f, Alignments of mixed clusters containing peptides originating from both allergens databases and the IEDB at the default clustering height threshold (0.7). The blue frame around the clusters shown in panels b-f indicates, that they were calculated at the same threshold.
G, Effect of different clustering height thresholds on the number and size of clusters. See also Figure S 4.
H,i, Decreasing the clustering height threshold to 0.6 leaves only two mixed clusters, which each contain shared motifs. These motifs were identified using MEME (Bailey and Elkan, 1994; Bailey et al., 2006) (motif width between 5 and 54 amino acids, max. 10 motifs, motifs occurring in all sequences) and GLAM2 (Frith et al., 2008) (default settings). The purple frame around the clusters shown in panels h and i indicates, that they were calculated at the same threshold.
Overall, the magnitude of antibody responses against food proteins from allergen databases was significantly (Mann-Whitney test on fold change of all peptides and all samples p-value < 10−31) lower than against the IEDB (Fig. 1f,g). PhIP-Seq does not provide an absolute quantification obtainable for single antigens with ELISAs with calibration curves, yet the FC values (‘fold change’ referring to the ratio between reads in the IP reaction with antibodies vs. input sequencing of the phage library) represents a parallelized estimate for binding strength.
Ig responses against certain food groups cluster to shared epitopes
Given the similar antibody binding frequencies against food proteins from closely related phylogenetic origin (Fig. 2b), we next analyzed if these Ig responses are correlated between individuals. Hierarchical clustering (Fig. 2c) yielded 13 clusters, originating from both food proteins as well as environmental antigens. The clustering peptides typically shared sequence motifs, suggesting cross-reactivity against the same epitope (see sections of the motifs highlighted in Fig. 2d–i, Figure S 3 for full alignments, and Table S 2 for detailed information on the bound peptides).
Clusters of antibody responses against food proteins encompassed cereals (Fig. 2d), in particular wheat (Figure S 3b,i,j), as well as bovine milk proteins (Fig. 2g, Figure S 3f), poultry (Fig. 2f), and legumes (Fig. 2e). For example, a shared motif in starch synthases from wheat, barley, rye, maize, and rice was commonly bound by antibodies (Fig. 2d). Also, high-molecular-weight (Figure S 3i) and low-molecular-weight (Figure S 3c) glutenin, predominately from wheat, were bound in glutamine-rich regions. IgA and IgG anti-gliadin antibodies are a serological marker for Celiac disease (CeD) (van der Windt et al., 2010). However, for this cohort CeD had been an exclusion criterion (Zeevi et al., 2015). The observed anti-gliadin antibodies may also occur in individuals undiagnosed with CeD or only be associated with subclinical symptoms in our cohort (although complex phenotypes relating to immune responses against wheat proteins have been discussed in the setting of gluten sensitivity (Geisslitz et al., 2021; Junker et al., 2012)). For milk caseins, we observed binding to a shared motif from cow, goat, sheep, and water buffalo (as hinted by alignments of bound peptides to entire proteins, Fig. 2b). Also, for diverse legumes ranging from peas, over peanuts to chickpeas we observed antibody binding to a shared motif. Similarly, ovomucoids from various poultry (e.g. chicken, duck, turkey, goose) exhibited binding in a conserved motif (Fig. 2f).
Taken together, these responses suggested that exposures to one of the respective proteins sharing a motif, can lead to cross-reactivity to rather distantly related species (e.g. chicken and ostrich egg proteins), with potential relevance for diagnostics of allergies.
Beyond food proteins, clusters of antibody responses against bacterial, fungal, and insect proteins (which had been included as part of the allergen databases) were observed (Fig. 2h,I; Figure S 3a,k,l,m). Bound proteins included a subtilisin-like protease from Trichophyton rubrum (the most common fungus causing athlete’s foot, Fig. 2h) and Streptokinase (a known bacterial virulence factor against which few people can develop IgE responses and allergies).
Moreover, we observed two clusters (Figure S 3l,m) of antibody responses targeting the insect proteins arginine kinase and tropomyosin. These responses appear to represent cross-reactivity from potential contact with dust mites, cockroaches, bumblebees or wasps, rather than exotic moths or crabs (which however share a high sequence similarity for these motifs and were detected as well, Figure S 3l,m, Table S 2). Clusters of antibody responses also exist among viruses and pathogens from the IEDB, which in part originated from shared epitopes as well as from potential polyclonal responses (see Figure S 4 and Table S 2). Combined clusters of antigens from allergen databases and the IEDB (Fig. 3) did not show clear cross-reactivity and epitope similarity between food proteins and infectious diseases with the sets of antigens covered by our library. This finding does not directly support the idea, that the observed Ig responses against food are driven primarily by co-infection cross-reactivity (Fig. 3). However, given that unknown antigens or pathogens not deposited in databases could be involved, we cannot exclude this hypothesis (see the discussion section for details).
PhIP-Seq based on protein A/G beads detects primarily IgG against food proteins
As both systemic IgG and IgA responses against selected food antigens have been reported (Gocki and Bartuzi, 2016; Hamilton, 2009; Husby et al., 1985; Konstantinou et al., 2014a, 2014b; Stapel et al., 2008; Vazquez-Ortiz et al., 2013), we aimed to characterize the Ig classes detected binding to food proteins in our PhIP-Seq workflow (Fig. 4). Our default experimental setup relied on a mixture of protein A and protein G coated beads (which binds all antibody classes, yet with varying affinity, see STAR methods for details). To distinguish between Ig classes we performed experiments with protein A or protein G coated beads separately (Fig. 4a–c), as well as dedicated IgG and IgA specific capture antibodies (Fig. 4d–f, and Table S 3 for a list of the bound peptides).
Fig. 4: IgG is the predominant antibody class against food proteins and antigens from the IEDB detected with a protein A/G based PhIP-Seq workflow.

Data of 80 individuals (who had also been analyzed as part of the cohort shown in Fig. 1) are shown. In panels a-f Pearson R is shown. See Table S 3 for detailed lists on the respective peptides bound by protein A vs. G beads and in IgA vs. IgG capture experiments
a-c Relying on different binding affinities of protein A and G for antibody classes, we processed 80 serum samples each with 1.) a mixture of protein A and G (a), 2.) protein A alone (b), and 3.) protein G alone (c), as outlined in ref. (Vogl et al., 2021) and performed similarly for antibody response against microbiota, see extended discussion below.
d-f Application of an experimental workflow to detect IgA and IgG subclasses separately (following procedures reported in the literature (Shrock et al., 2020; Vogl et al., 2021) and STAR methods). In panel d, a comparison of peptides bound by IgA vs. IgG specific beads is shown. Samples with IgG specific beads were sequenced with 0.8 million reads, however we do not expect a strong impact thereof, as the number of detected peptides typically saturates (Vogl et al., 2021). In panel e and f comparisons of peptides bound by a mixture of protein A and G vs. IgG or IgA specific beads are shown. For the IgA vs. IgG experiments a different batch of phages was used.
G Number of bound peptides per sample for each set of magnetic beads used. Center lines show the medians; box limits indicate the 25th and 75th percentiles as determined by R software; whiskers extend 1.5 times the interquartile range from the 25th and 75th percentiles, outliers are represented by dots. N = 80 sample points (plotted with BoxPlotR (Spitzer et al., 2014)).
H Binding of food antigens by IgG highlighted concurring binding data of IgG and protein A/G specific workflows. While in the other panels also antigens from the IEDB are included, here only bound peptides originating from allergen databases (appearing in up to 50% of the population) are plotted. Prominent food antigens are labeled with their common names (see Table S 1 and Table S 3 for reference).
Antibody binding between protein A and protein G was strongly correlated (Pearson R=0.90), with few antigens bound only by protein A (Fig. 4a). Also, comparing binding between the mixture of protein A and G with protein G or protein A, showed high consistency: In the mixture of protein A and G with protein G (Fig. 4b) antigens bound by protein G are masked, whereas protein A specific binding persists. Vice versa, in the mixture of protein A and G with protein A (Fig. 4c) unique binding by protein A is masked. As protein A and protein G only overlap in their binding profiles to IgG (Fig. 4S 8), these results suggest primary detection of IgG against food antigens in our experimental setting.
This observation was further confirmed by employing an alternative experimental workflow relying on magnetic beads coated with IgG and IgA specific capture antibodies (rather than using protein A/G for the pulldown, see STAR methods). Some peptides were nearly exclusively bound by IgA and others near universally by IgG (Fig. 4d), although IgA yielded in general less abundant signals than IgG (Fig. 4g, Table S 3). A third group of peptides showed binding by both IgA and IgG to varying extents. In general, more peptides were bound per sample when using IgG specific beads than when employing IgA specific beads (Fig. 4g). Both Ig specific workflows showed lower numbers of enriched antigens compared to protein A/G beads, possibly owing to technical aspects (Fig. 4). Alternatively, also biological factors such as lower binding rates of IgA to the antigens of our phage library may contribute to these results.
We also compared peptides bound by IgA and IgG to results obtained from the mixture of protein A and G (Fig. 4e,f). Peptides bound by IgG and the mixture of protein A+G showed a large overlap (R=0.72). In contrast IgA bound peptides showed less overlap to protein A+G (similar to the binding overlap between IgA and IgG, shown in Fig. 4f vs. d). These results were expected from the protein A vs. G experiments, that had already suggested primarily detection of IgG subtypes. Specifically relating to anti-dietary immune responses, we found that food antigens were bound at similar percentages in our study population when comparing IgG specific detection workflow with a mixture of protein A and G (S 8h), further supporting detection of IgG responses against food antigens.
To further validate these observations, we performed peptide ELISAs with food antigens against which we had detected Ig binding in PhIP-Seq (Figure S 5). For most selected peptides of animal and plant origin the IgG ELISA and PhIP-Seq data were in good agreement (Figure S 5a–l). Peptides of egg ovomucoid proteins appeared to contain multiple epitopes, covered by the PhIP-Seq assay but not within the shorter peptides used in the ELISA (see Figure S 5f,g). By comparing ELISA binding against peptides with slightly varying sequences (although similar consensus motifs, Fig. 2c–i) confirmed cross-reactivity suggested by the PhIP-Seq data (Figure S 5m–q vs. r–v). Binding against the same peptides was also tested with an IgE secondary antibody, yielding weaker signals and no clear correlations (Figure S 5w,x) suggesting that allergic responses do not play a major role in the binding of these peptides.
Taken together, these results demonstrated that the vast majority of the observed binding events against food proteins (as well as pathogens from the IEDB) were driven by IgG responses in our experimental setting (although, in general also IgA or IgE, as well as other antibody classes could be detected with modified experimental PhIP-Seq workflows, if desired).
Ig-epitope repertoires against food proteins show high longitudinal stability
Immunological memory is a hallmark of adaptive immune response: Infections or vaccinations frequently result in antibody responses detectable for decades and thereby protect from reinfection. Such longitudinal antibody responses have mostly been studied in the context of pathogens, and we have previously shown that commensal microbiota can elicit durable Ig responses (Vogl et al., 2021). Here, we were interested to know whether Ig responses against food would also elicit long-term antibody responses and how their stability would compare to pathogens.
We used a subset 214 out of the 1,003 individuals from our cohort, for whom we had collected longitudinal blood samples after approximately five years (Vogl et al., 2021). By comparing the baseline sample of every individual with the five-year follow up samples of all individuals (Fig. 5), we observed a high correlation of matched samples of the same individual, but not of random pairs of individuals. We performed this analysis with antibody responses against the entire library (Fig. 5a), only proteins from allergen databases (encompassing mostly antibody responses against food, Fig. 5b), as well as proteins from the IEDB (Fig. 5c). Comparing the correlation coefficients of matched and unmatched samples (Fig. 5d, Figure S 6a,b) suggested a higher discriminatory power between individuals of antibodies against proteins from allergen databases than against proteins from the IEDB. Sample pairs of the same individual correlated with R=0.72 (mean Spearman correlation of log fold change) for proteins from allergen databases, while antigens from the IEDB correlated with R=0.80. However, the correlation between unmatched samples was much higher for IEDB samples (R=0.33) than for samples from allergen databases (R=0.08). Therefore, the difference between the correlation of a sample with the same individual’s sample five years apart and of a different individual’s sample was more significant for antibody responses against proteins from allergen databases than for IEDB antigens (Mann Whitney score p-value < 10−46). As the IEDB encompasses antibody binding against many antigens of infectious diseases (Fig. 1f), this higher convergence is likely due to shared antibody responses against pathogens (as previously observed when comparing the stability of pathogens and commensal microbiota (Vogl et al., 2021)).
Fig. 5: Ig epitope repertoires against food proteins are stable over a period of 5 years and exceed the discriminatory power of antigens from the IEDB.
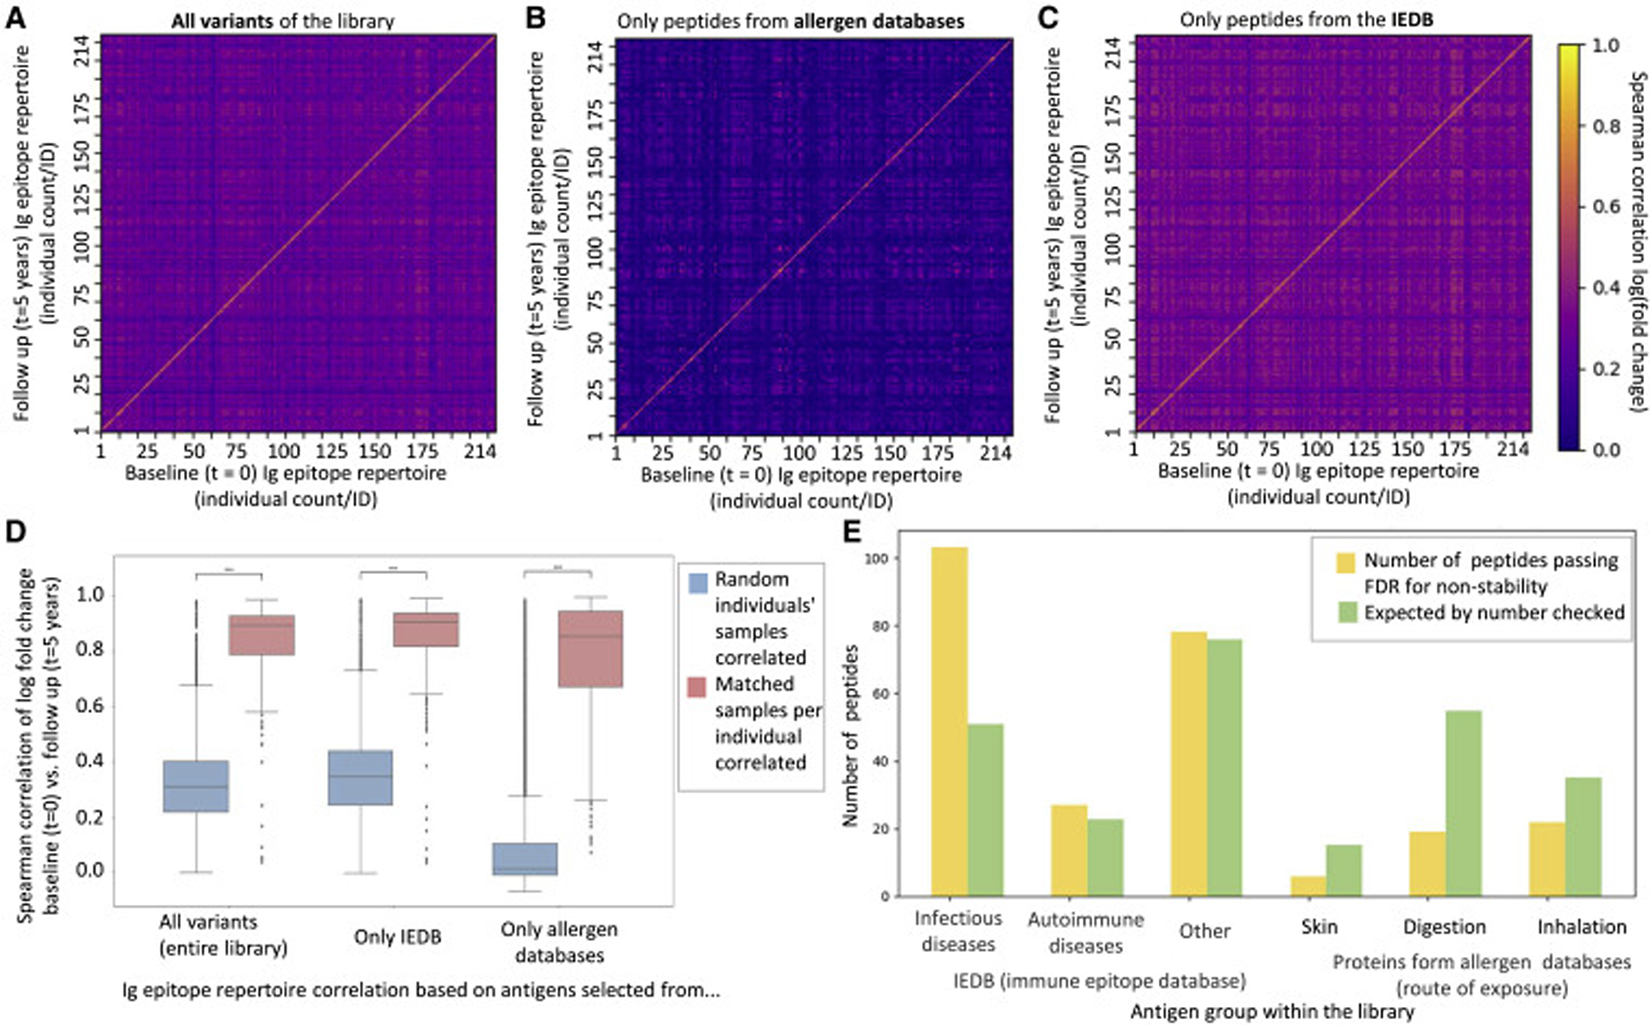
a-c, Antibody epitope repertoire stability of 214 individuals over five years against the entire antigen library (a), proteins from allergen databases (b), and proteins from the IEDB (c). Spearman correlations of log(fold change) over all peptides which appear in >2% of individuals, of all baseline (t = 0) and follow-up (t = 5 years) samples compared with each other are shown (a universal legend is provided next to panel c). Antigen group sizes: entire library: 1,670 peptides; allergen databases 669; IEDB 1,001.
d, Correlation coefficients of panels a-c are summarized as box plots to allow for comparison of their stability and discriminatory power. Comparisons of random/unmatched pairs of samples (214² − 214 comparisons) and individuals’ matched samples (214 comparisons) collected five years apart. The center line shows the median. Box limits indicate the 25th and 75th percentiles as determined by the python Seaborn package, boxplot. Whiskers extend to 1.5 times the interquartile range from the 25th and 75th percentiles. The difference between the correlations of matched samples, and that of random pairs of samples is significantly higher for allergens databases vs. IEDB (Mann-Whitney p-value < 10−46). Analyses for additional subgroups are shown in Figure S 6a,b.
e, Comparing stability of antibody responses between different groups of antigens. For each peptide, each individual was marked binding the peptide for each point in time. Upon summing individuals, a two-by-two matrix of first vs. second time points was constructed. A chi-square score was computed on said matrix to assess stability compared to expected stability. All p-values were corrected using Benjamini-Yekutieli FDR correction (no assumption of independence) with 0.05 threshold. For each sub-group of peptides, the number of passed peptides is shown in yellow, vs. the expected that appears in green. This test was performed on a group of 214 individuals, for which we have two serum samples 5 years apart. The set of antibody bound peptides tested was the same 1,670 peptides mentioned in panel a.
We also performed an analysis to understand if changes in Ig binding over five years are over- or underrepresented in any specific groups of antigens (Fig. 5e). The category of infectious diseases was overrepresented in the group of less stable antibody responses, suggesting that there is generally both a higher convergence to infectious disease (Fig. 5d, Figure S 6a,b), as well as a greater fluctuation over time (Fig. 5e), than against proteins from allergy databases.
Ig responses against food associate with and predict age, gender, and dietary intake
Next, we analyzed if the observed antibody responses would associate with human health and diet parameters. To this end, we leveraged metadata available for this cohort (Vogl et al., 2021) and applied machine learning algorithms (Gradient Boosted Trees, STAR methods) to predict age and gender from Ig epitope repertoires (Fig. 6a–f). Regarding age, comparing the youngest quintile of our cohort (<31 years of age) with the oldest quintile (>56 years of age) showed several diverging immune responses (Fig. 6a). These included antigens of viruses and bacteria, but also some food proteins (full list in Table S 4). For example, peptides from rice or a legume was more frequently bound by antibodies in older individuals, whereas Ig responses against peptides from milk or chicken proteins were overrepresented in the younger quintile (Fig. 6a, Table S 4). Training machine learning algorithms on these Ig epitope repertoires could predict age with R²=0.31 (Fig. 6b). We applied SHAP (SHapley Additive exPlanations) analysis (Lundberg and Lee, 2017) to understand antibody responses against which peptides were contributing to this outcome (Fig. 6c). Several peptides originating from pathogenic bacteria and viruses (such as herpesviruses and Streptococcus sp.) as well as food (e.g. milk) and environmental antigens (e.g. dust mite) were identified (a list of the exact proteins is provided in Table S 4).
Fig. 6: Antibody responses against food proteins associate with and predict age, gender, and dietary intake.

A list of the significantly (Fisher’s exact test) different peptides (relating to panels a, d, g) as well peptides driving SHAP analyses (panels c,f,i) is provided in Table S 4.
a-c, Age associations (a) and predictions (b,c). In panel a, each dot represents a peptide, with its prevalence in the respective cohort (youngest quintile <31 years of age, n=192; oldest quintile >56 yoa., n=197) plotted on the x and y axes. Selected food antigens are marked with arrows, see Table S 4 for details. Machine learning based predictions were performed with Gradient Boosting trees with 10-fold cross-validation (STAR methods section, b) and contributing features, representing antibody responses, were evaluated by SHAP analysis (Lundberg and Lee, 2017). Yob – year of birth. The numeric identifiers of peptides can be found in the supporting library content file (see Data availability statement).
d-f, Gender associations (d), prediction with Machine learning with Gradient Boosting trees with 10-fold cross-validation (e) as well as SHAP analysis of contributing features (f, similar to panel c). We also verified that the predictive value of the antibody responses is not driven by age (Figure S 6a).
g-i, Testing for associations of consumption of dietary intake of egg products with antibody responses against egg proteins (g) and prediction of dietary intake from these antibody repertoires (h). We identified individuals consuming egg recipes from food frequency questionnaires filled by participants (Bar et al., 2020), defining consuming as a frequency of more than once a month. Each dot in panel a represents a peptide, with its prevalence in the respective cohort plotted on the x and y axes. Machine learning based predictions were performed with Gradient Boosting trees with 10-fold cross-validation (h) and contributing features, representing antibody responses, were evaluated by SHAP analysis (i, as outlined for panel a). For the predictions, we also included gender and age as features to test for any contributing effects (e.g. if older individuals would for example consume more egg products).
For gender, there were also significant differences against binding of a few peptides (Fig. 6d). A peptide from a cereal protein was overrepresented in males (Fig. 6d, Table S 4), possibly owing to dietary differences between genders. We performed a similar machine learning driven analysis and could classify between men and women with an AUC (area under the curve) of 0.71 (Fig. 6e, Figure S 6c). SHAP analysis indicated, that mostly antibody responses against viral and bacterial proteins (e.g. influenza viruses, Staphylococcus sp.) were contributing to this result, although also some food proteins from chicken and lentils appeared (Fig. 6f, Table S 4).
We also leveraged serum metabolomics data available for a subset of individuals within this cohort (Bar et al., 2020) to test for potential links between antibody binding to food proteins and metabolites. As diet is a key contributor to the chemical makeup of the serum metabolome (Bar et al., 2020), we hypothesized that intake of foods leading to elevated concentrations of certain metabolites, could also associate with antibody responses against proteins of the same food. By correlating clusters of antibody responses against food proteins (Fig. 2c, Figure S 6d) with serum metabolites, we found a significant (p-value 4.2*10−6 Benjamini Yekutieli FDR, Figure S 6d) association of legumes (cluster in Fig. 2e) with 3-methoxytyrosine (a variant of the essential amino acid tyrosine). As legumes are rich in tyrosine, this finding may point towards an effect of high dietary intake of certain foods eliciting antibody responses against protein antigens thereof.
To further study such potential links between dietary intake and antibody responses, we next investigated food frequency questionnaires (FFQs) available for our cohort (Zeevi et al., 2015). The observed Ig responses against dietary antigens may on the one hand be elicited by regular dietary intake of the respective foods. On the other hand, gastrointestinal infections could lead to increased translocation of food antigens (via decreased intestinal barrier function caused by damage to the mucosa) and the elevated immune status due to infection. Correlation of antibody responses against infectious diseases and food antigens did not show clear associations (see Fig. 3 and the section “Limitations of the study”).
However, we found a significant association of dietary intake of egg products (documented by FFQs) with antibody responses against several peptides of egg proteins (ovomucoids, Fig. 6g, Table S 4). All six peptides, that were significantly more frequently bound by antibodies in individuals consuming egg products, were stemming from egg ovomucoid proteins (list in Table S 4). Antibody responses against a peptide from celery were significantly more frequent in individuals, who did not consume egg products (potentially owing to a higher likelihood of developing plant protein directed Ig responses when consuming animal proteins less frequently). Dietary intake of these egg products could also be predicted from the Ig epitope repertories (AUC=0.65, Fig. 6h) with several peptides of egg proteins contributing to the outcome (Fig. 6i). Overall, these results suggest that consumption of certain food items leads to elevated systemic antibody responses against proteins of the respective foods (although our study reports only an association and not a causal link, see below).
Discussion
Given the substantial amounts of food regularly ingested by humans (estimated for an adult at two kilograms per day (USDA ERS, 2022)), and the high content of potential protein, glycan, and lipid antigens, a variety of immunomodulatory effects of diet have been discussed (Childs et al., 2019; Wu et al., 2018). While IgG responses against foods have previously been reported, these studies have typically focused on small sets of dozens of antigens (Gocki and Bartuzi, 2016; Hamilton, 2009; Husby et al., 1985; Stapel et al., 2008) and small cohorts of a few dozen individuals. Here, we have performed the broadest study to date focused on systemic food directed immune responses: Our cohort of 1,003 individuals exceeded the size of previous studies (Chen et al., 2021; Monaco et al., 2021) by an order of magnitude, and was combined with a comprehensive library of food and environmental antigens (encompassing five complete allergen databases, as well as the IEDB).
We found a wide variety of food antigens from animal as well as plant sources eliciting antibody responses in the serum of our population scale cohort. Mechanistically, it has been suggested that such Ig responses are caused by incompletely digested proteins penetrating the gut epithelium and capture of antigens by Peyer’s patch M cells, dendritic cells, or enterocytes (Gocki and Bartuzi, 2016). The applied PhIP-Seq workflow allowed to pinpoint the exact epitopes of food (and environmental) proteins targeted by antibodies, pointing towards substantial cross-reactivity (for example between the legumes lentils and peanuts or poultry such as turkey and duck). Such epitope resolved analyses may also have implications for the diagnosis of allergies, as IgE responses developed against one antigen may result in symptoms upon digestion of rather distantly related plant or animal species.
Our cohort consisted of an average representation of the adult Israeli population with allergies against environmental or food antigens not being exclusion criteria. However, chronic gastrointestinal symptoms were an exclusion criterion (Zeevi et al., 2015), making it unlikely that patients with severe symptoms of food allergies would have been recruited. The prevalence of food allergies in Israel in young adults is less than 1% (Nachshon et al.) and rather low compared to other countries with a western lifestyle (Lyons et al.). Therefore, it appears unlikely, that a large fraction of our cohort would suffer from food allergies. Israeli allergy incidence rates reported in the literature (Nachshon et al.) are much lower than antibody binding rates of more than 50% observed for common food proteins in our cohort. Also in verification experiments of these commonly bound food peptides, we detected little IgE binding. Hence, together with the near exclusive detection of IgG responses with our experimental design, we can reasonably rule out allergies contributing to the majority of the observed signals (infrequently occurring antibody responses against food proteins in ~1% of our cohort may be affected by allergies, but these have been excluded, as we were only analyzing antibody responses occurring in >2% of individuals). Furthermore, as we had collected FFQ data for this cohort, we also tested for correlations of dietary intake and antibody responses. If our cohort had included a larger number of allergic individuals avoiding certain foods, we would have expected to find a negative correlation with the antibody responses. However, we only detected a positive correlation, further suggesting that food allergies do not strongly contribute to the findings reported here.
Detailed information on respiratory or contact allergies were not collected for our cohort (Zeevi et al., 2015), yet IgE antibody responses against such environmental antigens could be studied: In principle PhIP-Seq allows focused studies of different Ig classes using specific capture antibodies and can be applied to study IgE epitope repertoires recognized in allergies (Chen et al., 2021; Monaco et al., 2021). ‘AllerScan’ has been used to profile antibody responses in wheat (Monaco et al., 2021) and peanut (Chen et al., 2021) allergy and immunotherapy, indicating also a remedial induction of IgG responses against IgE targets. In this respect, the IgG responses detected in our study (alongside findings in animal models (Mohammed et al., 2019)), may also suggest protection from allergies against their targets. Studying these aspects would require IgG subclass resolved analysis, as IgG4 is especially associated with protective effects in immunotherapy (Eckl-Dorna et al., 2019; James and Till, 2016; Santos et al., 2015), while IgG1 is involved in the trajectory towards IgE responses (Satitsuksanoa et al., 2021; Xiong et al., 2012). Given that microbiota have been recognized as a potential factor modulating food allergies (Abdel-Gadir et al., 2019; Campbell et al., 2020; Huus et al., 2020), applying the library of food and environmental antigens reported here, alongside libraries of microbiota antigens (Vogl et al., 2021), and detailed FFQs, could be used to shed light on the Ig epitope repertoires recognized in allergic individuals and underlying mechanisms.
Notably, antibody responses against food in our population scale cohort showed a wide interindividual variability. While some shared epitopes were commonly bound, we did not detect near universal antibody binding, as has been reported for viral and bacterial antigens (Mina et al., 2019; Vogl et al., 2021; Xu et al., 2015). This finding may be impacted by sensitivity thresholds of PhIP-Seq as the antibody binding against food antigens appeared in general to be weaker than the responses against pathogens. However, given that responses against similar dietary antigens correlated well, which would not be expected from large experimental noise and many binding events barely passing detection thresholds, the observed population wide abundances may indeed be representative. The fact that these food-directed Ig responses were also longitudinally stable, also suggests an adequate sensitivity. If desired, and potentially relevant for the allergy diagnostics suggested above, the PhIP-Seq detection thresholds could potentially be improved by sequencing with a higher coverage and enriching for Ig classes of interest.
In this study, we had focused on proteins previously deposited in immunological databases. By agnostically selecting library content from proteomes of plant or animal species consumed as food, it could also be possible to detect antibody responses against additional dietary antigens. Nonetheless, it is noteworthy that some food items (milk, egg, wheat, legumes) appear to be more frequently bound by antibodies than other common dietary components (such as potatoes, tomatoes, or beef which are also frequently consumed by our cohort (Zeevi et al., 2015)). The relatively high protein content of these foods (as well as their frequent consumption in various forms) may contribute to this observation. We did indeed find associations of antibody repertoires with dietary intake (from FFQs) and metabolites (Figure S 6c), suggesting that consumption frequency and nature of the food can shape systemic blood antibody reactivity. On the other hand, relating to some food groups being less frequently bound by antibodies (such as Solanaceae), certain food proteins may also be less immunogenic.
Overall, our work documents a wide range of food proteins targeted by systemic antibody responses and provides thereby a reference map of the exact immunogenic epitopes bound by IgG at population scale. Given that interactions between dietary antigens and the immune system have been implied in autoimmune diseases (Vojdani et al., 2020), the ability to profile hundreds of thousands of human self-antigens (Larman et al., 2011, 2013), dietary antigens, as well as antigens of viral and bacterial pathogens (Mina et al., 2019; Vogl et al., 2021; Xu et al., 2015) by PhIP-Seq paves the way towards studying cross-reactivity and molecular mimicry.
Limitations of the study
A major caveat of this type of study is, that it provides only functional data on the food antigens bound by Igs, while the underlying BCR sequences driving these binding events remain unknown. Hence, it is unclear if converging antibody binding against the same antigen in different individuals is achieved by similar VDJ recombination events, or if vastly dissimilar recombination events and mutations can target the same food antigens. In this respect, also the contribution of differences in individuals’ naïve B cell repertoires is unknown. However, these open questions are challenging to address, as currently no high-throughput methods are available, that would allow to identify the BCR sequences even of hundreds of antigens in hundreds of people at reasonable cost.
Beyond this antibody function – BCR sequence relationship, our study also leaves the contribution of individuals’ HLA types unaddressed. HLA alleles would likely shape T cell dependent B cell activation in a protein specific manner. For example, certain HLA polymorphisms predispose for food allergies (Hemler et al., 2015; Kostara et al., 2020). Linking PhIP-Seq data of antiviral antibody responses to genetic data has indeed shown associations to HLA alleles (Venkataraman et al., 2022), suggesting that large enough cohorts could also be used to disentangle the impact of HLA polymorphisms of antibody responses against food proteins.
Furthermore, the antibody responses that we can detect in our experimental setup are constrained by the content of our PhIP-Seq library. By selecting antigens from existing databases, our library is limited towards food and environmental allergens, that were already known to elicit an immune response (although primarily anti-food IgE responses had been reported, while our work provides a population scale perspective on IgG responses against food antigens). While we thereby primarily studied antibody responses against allergenic proteins, it will also be informative to select additional food proteins representative of the diversity of foods documented by the FFQs of this cohort, as an even more exploratory library. Yet, selecting relevant proteins potentially bound by Igs from large plant and animal genomes could represent a challenge by itself.
In the same way, our representation of infectious diseases is limited to what has been deposited in the IEDB. Hence, the lack of correlation between food proteins and infectious disease responses does not automatically favor or exclude one of the two hypotheses mentioned in the section “Ig responses against food associate with and predict age, gender, and dietary intake”.
While providing statistically highly significant associations, our study does not shed light on a causal role of the uptake of dietary antigens eliciting the respective detected antibody responses. Demonstrating such effects would require a longitudinal controlled feeding study, that appears for a number of reasons challenging to carry out on such a large cohort of humans as studied in this work.
Regarding the machine learning analyses to predict age, sex, etc., no independent validation cohorts were available to better assess the predictive power of the peptides found to be predictive. Few cohorts worldwide are as deeply profiled as the one studied in this work, especially relating to dietary intake. Running a validation cohort to reach the statistical power required, would also be affected by cost considerations. The analyses in this work are corroborated by 10-fold cross-validations, providing robustness and assessing the predictive power over the held-out fold.
Relating to technical limitations of the underlying PhIP-Seq technology, antibody responses against carbohydrates (such as starch, fibers, sugar) or lipids would be missed by PhIP-Seq, as these libraries only cover peptide antigens. This relates to general caveats of using PhIP-Seq, as has previously been discussed in depth (Mohan et al., 2018). In short, limitations of PhIP-Seq include the length of displayed peptides, folding issues, and missing posttranslational modifications (PTMs), amongst others (Mohan et al., 2018). One commonly stated issue with PhIP-Seq may be less critical in the context of food directed antibody responses: The length of PhIP-Seq displayed peptides is constrained by DNA synthesis of the oligos encoding the underlying peptides (max. 54 amino acids in our study). Hence, larger conformational epitopes may be missed because of this length issues (although also other factors such as incorrect folding or missing PTMs can lead to missing signals against conformational epitopes). Yet, as food proteins are proteolytically degraded in the intestines, fragments reaching systemic circulation may have already been broken down to mainly linear epitopes (depending on the definition, between 5 to 20 aa (Berglund et al., 2008; Forsström et al., 2014, 2015)), that would be completely represented by our chosen display strategy. In this respect, it is also noteworthy that in many cases several peptides per food protein or several peptides of similar sequences were bound by antibodies at near identical frequencies supporting a high sensitivity and reproducibility of our PhIP-Seq implementation.
STAR methods
Resource availability
Lead contact
Further information and requests for resources should be directed to and will be coordinated by the lead contact Thomas Vogl (thomas.vogl@meduniwien.ac.at).
Materials availability
The phage library is available upon request.
Data and Code availability
The majority of data generated or analyzed during this study are included with the manuscript (and its supplementary information files) or deposited in publicly available databases. DOIs to access these datasets are provided in the key resource table. The figshare directory contains details on the antigen library (library_contents.csv), the cohort (cohort.csv), as well as antibody binding data of all individuals (fold_data.csv). Raw data for the PhIP-Seq experiments are deposited in the Harvard Dataverse public repository.
Custom code for analyses is also available via a DOI to a GitHub repository.
Any additional information required to reanalyze the data reported in this paper is available from the lead contact upon request.
Key resources table.
| REAGENT or RESOURCE | SOURCE | IDENTIFIER |
|---|---|---|
| Antibodies | ||
| HRP conjugated anti human IgG antibody | Southern Biotech | Cat#204205 |
| anti human IgE antibody | Southern Biotech | Cat#9250-05 |
| mouse anti-human IgG Fc-BIOT | Southern Biotech | Cat#9040-08 |
| goat anti-human IgA-BIOT | Southern Biotech | Cat# 2050-08 |
| Bacterial and virus strains | ||
| T7Select 10-3 cloning kit | Merck | Cat#70550-3 |
| Biological samples | ||
| 1,054 serum samples of 1,010 individuals | Korem et al., 2017; Zeevi et al., 2015 | n.a. |
| Chemicals, peptides, and recombinant proteins | ||
| IPEGAL CA 630 | Sigma-Aldrich | Cat#I3021 |
| Protein A magnetic beads | Thermo Fisher Scientific | Cat#10008D |
| Protein G magnetic beads | Thermo Fisher Scientific | Cat#10009D |
| 1-Step™ Turbo TMB-ELISA Substrate Solution | Rhenium | Cat#TS-34022 |
| Q5 polymerase | New England Biolabs | Cat#M0493L |
| Bovine Serum Albumin, heat shock fraction, pH 7, ≥98% | Sigma-Aldrich / Merck | Cat#A7906-100G |
| Pierce Streptavidin Magnetic Beads | ThermoFisher | Cat#88817 |
| Critical commercial assays | ||
| QIAquick gel extraction kit | Qiagen | Cat#28704 |
| QIAquick PCR purification kit | Qiagen | Cat#28104 |
| Deposited data | ||
| Raw and analyzed data | This paper |
https://doi.org/10.6084/m9.figshare.17098958
https://doi.org/10.7910/DVN/3SOZCQ |
| Code | This paper. | DOI: 10.5281/zenodo.7307894 |
| Experimental models: Cell lines | ||
| Experimental models: Organisms/strains | ||
| Oligonucleotides | ||
| library amplification primer fwd | GATGCGCCGTGGGAATTCT | n.a. |
| library amplification primer rev | GTCGGGTGGCAAGCTTTCA | n.a. |
| Recombinant DNA | ||
| Oligo pool (200 mers) | Twist Bioscience | n.a. |
| Software and algorithms | ||
| See data availability statement. | ||
| Other | ||
| Nunc™ Immobilizer™ Streptavidin Plates | Thermo Scientific™ | Cat#436014 |
| BioTides™ Peptides | JPT Peptide Technologies (Berlin, Germany) | n.a. |
| Freedom Evo liquid handling robot with | Tecan | n.a. |
| FrameStar® 96, fully skirted, white frame, 50 plates | Tamar | Cat#4ti-0960/W |
| MASTERBLOCK, 96w, PP, 2ml, Natural, 50/case | Danyel biotech | Cat#60-780270 |
| Corning Axygen® AM-2ML-SQ AxyMat™ | Biolab Ltd | Cat#AXY-AM-2ML-SQ |
EXPERIMENTAL MODEL AND SUBJECT DETAILS
Human Cohorts (incl. Serum samples, clinical data and metagenomics)
1,054 serum samples of 1,010 individuals had been collected in Israel in 2013/2014 for previous studies (Korem et al., 2017; Zeevi et al., 2015) along with clinical and metagenomics data. See (Zeevi et al., 2015) for detailed recruitment criteria and cohort characteristics. The 214 longitudinal serum samples had been obtained from participants of one of the previous studies (Zeevi et al., 2015) after ca. five years in 2019/2020. Research with these samples has been approved by the Tel Aviv Sourasky Medical Center (#0658–12-TLV) and the Weizmann Institute of Science’s institutional review board (#1079–1) and the participants had consented to using the samples.
METHOD DETAILS
Serum samples, clinical data and metagenomics
Various phenotypes and blood test results were available for most (>900 for phenotype/blood test) individuals (Zeevi et al., 2015), with results of few tests missing for some individuals. We focused most of the antibody epitope repertoire analysis on baseline samples (1st sample collected per individual). Seven samples did not pass the overall threshold (as applied in previous studies (Vogl et al., 2021)) of >200 peptides significantly bound (after correction of batch effects, see below) and were excluded from analyses (see section ‘Data analysis’ below), leaving data of 1,003 individuals for the analysis.
Library content
In order to analyze the population wide reactivity to verity of known B cell antigens we have included immune epitopes from IEDB (immune epitope database, https://www.iedb.org/ (Vita et al., 2015)).
For one part of the library, we took the full list of B cell antigens deposited in the IEDB as it was deposited online on the 14/01/2018 with the exception of non-human host, allergens (which were taken separately, for the second part of the library, at same the time) and Chagas disease epitopes. In all cases full proteins where taken, and not just the epitope(s) deposited in the IEDB.
For the second part of the library, we focused on antigens known to cause allergic reaction in humans. We used sequences from six different databases. On top of the IEDB allergen list mentioned above, we downloaded the full proteins that were reported to cause allergies from: WHO/IUIS Allergen Nomenclature Database (www.allergen.org) (Radauer et al., 2014), Allergome (www.allergome.org) (Mari et al., 2006), AllergenOnline (www.allergenonline.org) (Goodman et al., 2016) including the list of celiac proteins, Structural Database of Allergenic Proteins (SDAP) (fermi.utmb.edu) (Ivanciuc et al., 2003), and Database of allergen families, AllFam (www.meduniwien.ac.at/allfam/) (Radauer et al., 2008). Additional allergenic helminth proteins were taken from Fitzsimmons et al. (Fitzsimmons et al., 2014). To avoid redundancy, protein sequences that appeared in more than one database were only taken once. Regarding the term ‘human allergen’ in Fig. 1b, there are some cases reported, where allergic IgE binding against human self-antigens has been detected (Maurer et al., 2018; Sanjuan et al., 2016). As these allergen databases are very large, even these rare events are documented and we included them by taking the entire database.
In order to make the interpretation of the data easier, we further annotated the allergenic proteins. In addition to the species scientific name of the protein, we have also added the common name of the species. We have characterized the proteins by their sources: plant, animal, insect, bacteria or human. Proteins that are consumed as foods/common foods regarding the Israeli diet were marked as such. Finally, we have indicated the routes of exposure: digestion, inhalation or skin contact. The routes of inhalation and skin contact appear rather irrelevant for food proteins, but for some plants such as apples, both proteins from the fruit body (intake by digestion) as well as pollen (inhalation) were included in our PhIP-seq library and were annotated as such by the allergen databases. In our classification, apples are food items including all proteins and thereby both annotations are listed. Disentangling this for thousands of proteins (without proper annotations in the databases) is challenging, hence we have left in the original annotations.
Encoding of proteins into peptides
All proteins were split into 54 aa long peptides, with 20 aa overlap, so that every 21 aa length stretch of amino acids will appear in at least one such peptide. These peptides were encoded into DNA, using the E. Coli codon usage table and probabilities, with a few restrictions on translation, including avoiding of restriction sites and creating a unique barcode of length 44 / 75 nts (Vogl et al., 2021) at the 3’ end, which is at hamming distance 3 / 5 from any other barcode, so that it allows to identify the peptide even with 1 / 2 errors, by sequencing its last 44 / 75 bps. If the coding produced a DNA sequence which did not match these criteria the peptide was recoded until success (see ref. see (Vogl et al., 2021) for details).
Since many of the proteins from allergen databases (the second part of the library) are very close to each other in amino acid sequence (such as different glutenin proteins of different types of cereals), we clustered all allergen proteins using cd-hit at 70% identity. Overall, 6,107 protein sequences were split into 1,334 clusters. For each cluster we took the full sequence of the lead protein, and only parts with a difference in the amino-acid sequence from all other proteins, so that every stretch of 21 aa from any of the original proteins in the set will be represented in our final peptide set. These full proteins, and differential peptides, were encoded (including barcodes) as outlined above.
The oligo library was ordered from Twist Bioscience as a 200-mer pool (library amplification primers: fwd, GATGCGCCGTGGGAATTCT; rev, GTCGGGTGGCAAGCTTTCA) and cloned into T7 phages following the manufacturers recommendations (Merck, T7Select 10–3 cloning kit, product no. 70550–3).
Batch and FC correction
Initial Scoring and definition of significantly enriched peptides
After sequencing, the reads from each well are down-sampled to 1.25 million identified reads, by barcode, per well (if enough reads exist). If a well did not produce at least 0.75 million identified reads it was discarded. In order to assess which oligos are actually significantly up-regulated, a p-value is calculated for each oligo, given its input read numbers, a Generalized Poisson Distribution of the expected output read numbers for the respective input read number, and its output read number (Vogl et al., 2021), and only oligos whose p-values pass the minimal threshold of the plate are said to have passed.
Hence, a significantly enriched epitope (a “hit”) is one for which the p-value passes the threshold cutoff of the specific plate. We computed this p-value on the output sequencing read number of the peptide, under the expected Generalized Poisson Distribution for its input read number (=baseline sequencing of each variant of the phage library without adding any antibodies or performing washing steps). The output read number is obtained by sequencing the phages bound in the immune-precipitation step. The computation of this is detailed in (Vogl et al., 2021).
A cutoff of >200 was applied to all significantly bound peptides (as applied in previous studies (Vogl et al., 2021)), including both the library discussed in this manuscript and the one previously described (Vogl et al., 2021). This was done as a few samples appeared faulty due to technical issues (while the passing ones followed a normal distribution). The analyses performed in this manuscript were all on the subsets of allergen databases and IEDB (as shown in Fig. 1c) and therefore include samples with less than 200 peptides in the figures (for this subset, even though the overall number had been greater).
Correction for Batch Effects
Every plate of samples processed contained four copies of an ‘anchor sample’ (internal control, four fixed wells in the plate), this anchor sample was created once by mixing serum samples of three individuals and subsequently used on all plates. These anchors were used to verify all plates behaved in an equivalent manner, to assess the noise between technical replicates), and to identify batch effects. There was a drift in the number of oligos passing the fixed minimal p-value threshold over time. In order to correct for this batch effect a correction to the minimal p-value per plate was made so as not to use a constant threshold on all plates, but to determine a plate specific threshold such that the same average number of oligos pass for the four anchor samples across all plates. This correction affects both the existence data (the set of oligos that pass per sample) and the fold change data, as we only determine fold change for the oligos that pass the minimal threshold.
Correction of Fold Change for Simplex Limitations
The output read numbers of oligo variant binding (i.e. the DNA sequencing result linked to the respective peptide), measured in the PhIPSeq assay, is given on a simplex, i.e. the total number of oligos is not meaningful, and for the sake of noise reduction is downsampled to a constant coverage (1.25 million reads). Therefore, any oligo which is up-regulated by the process causes all other oligos to look as if they were down-regulated (as it “takes up more space” of the output). The process of scoring (described above) identifies all oligos which pass the threshold p-value.
This process does not, however, make the fold-change (output read number divided by input read number) comparable between different samples. In order to make the fold change comparable, with no objective read number to lean upon, we assess the background fold change in the following way:
Take all oligos whose input read numbers are above the base minimal read number used for assessing the Generalized Poisson Distributions.
Take only oligos whose p-value is under the 95% quantile of p-values (the assessment of the GPD parameters assumes at least 95% of oligos aren’t up-regulated).
Take the median value of fold-change on this set of oligos.
This value is then used to normalize the fold-change of all passing oligos, and the fold change of any peptide that did not pass the threshold p-value is set to 1.
Immunoprecipitation and sequencing.
PhIP-Seq experiments were carried out as outlined in a published protocol (Mohan et al., 2018) with lab specific modifications detailed in ref. (Vogl et al., 2021). Experiments with altered immunoprecipitation conditions (using protein A or protein G separately) and IgA and IgG specific capture antibodies were also performed as outlined (Vogl et al., 2021) and are described in detail below.
Antibody binding with protein A vs. G covered beads
Food antigens can be bound by different antibody classes such as IgG (Gocki and Bartuzi, 2016; Hamilton, 2009; Husby et al., 1985; Stapel et al., 2008), IgA (Husby et al., 1985; Konstantinou et al., 2014a, 2014b; Vazquez-Ortiz et al., 2013) and IgE (Yu et al., 2016) (the latter in the context of allergies) in blood, as well as mucosal IgA (Frossard et al., 2004; Kamemura et al., 2015). To gain understanding by which antibody classes the antigens of our library are bound, we performed an experiment with altered immunoprecipitation conditions (Fig. 1a). In addition to using a mixture of protein A and protein G coated beads (which binds all antibody classes), we mixed the same serum samples separately with protein A alone and protein G alone. According to the manufacturer’s specifications of the superparamagnetic beads used in these experiments (Thermo Fisher Scientific, catalog numbers 10008D [protein A] and 10009D [protein G]), protein A binds strongly to human IgG1,2,4 and weakly/moderately to IgG3, IgA, IgM, and IgE, while it does not bind IgD. In contrast, protein G binds strongly to human IgG1,2,4 as well as IgG3, but does not bind to IgA, IgM, IgE or IgD.
Hence, antigens detected with both protein A and protein G indicate binding of IgG subclasses, whereas antigens bound by IgA, IgM, and IgE can be identified by only binding to protein A beads.
We processed serum samples of 80 individuals each with a mixture of protein A and G (equivalent to the standard protocol used for serum measurements shown in this work), protein A alone, and protein G alone. Antibody binding between protein A and protein G was strongly correlated (Pearson R=0.90), with few antigens (ca. 10–20 depending on cutoff criteria) bound only by protein A (Fig. 4a). Comparing binding between the mixture of protein A and G with protein G or protein A, showed high consistency: When comparing the mixture of protein A and G beads with protein G beads (Fig. 4b) antigens bound uniquely by protein G in Fig. 4a are masked, whereas protein A specific binding persists (Fig. 4b). Vice versa, when comparing in the mixture of protein A and G with protein A (Fig. 4c) unique binding by protein A, evident in Fig. 4a, is masked (except for a few peptides showing near universal binding with protein A, but unexpectedly not bound by protein A+G (and vice versa, likely owing to experimental conditions).
Among the peptides more frequently bound by protein A (Fig. 4a,b), viral antigens from herpesvirus 4/Epstein-Barr virus were most frequent, while no food antigens were detected, suggesting primary detection of IgG against food antigens in our experimental setting. This notion was further confirmed by the IgA/IgG specific workflows described below.
Antibody binding with IgG and IgA specific beads
In addition to the experiments with protein A and G separately, we also verified the same set of 80 samples with beads covered with IgG and IgA capture antibodies (following a published PhIP-Seq protocol (Shrock et al., 2020; Vogl et al., 2021)). Rather than mixing the phage/antibody complexes with protein A+G, we mixed them with IgA and IgG specific biotinylated capture antibodies (Mouse Anti-Human IgG Fc-BIOT and Goat Anti-Human IgA-BIOT, Southern Biotech) by adding 6 µg of each capture antibody (in a separate reaction) prior to the overnight incubation step (outlined in the STAR methods). Sample IgG/IgA concentrations (3 µg used per reaction) were determined as outlined previously (Vogl et al., 2021). For the pulldown in the immunoprecipitation step, 25 µL of Pierce Streptavidin Magnetic Beads (ThermoFisher Scientific) were added per reaction (washed according to the manufacturer’s recommendations). The following incubation/washing steps were performed identical to when using a mixture of protein A and G.
Following this protocol, we measured serum samples of 80 individuals with this IgA and IgG specific workflow (Fig. 4d). These were the same 80 samples, that we had also measured with the standard protein A+G workflow and protein A and protein G separately (Fig. 4a–c). Some peptides were nearly exclusively bound by IgA and others near universally by IgG (Fig. 4d) – although IgA yielded in general less abundant signals than IgG (discussed in detail below). A third group of peptides showed binding by both IgA and IgG to varying extents. In general, more peptides were bound per sample when using IgG specific beads (median 66 peptides per sample) than when employing IgA specific beads (on average 12 peptides per sample) as illustrated in Fig. 4g. This difference may be due to technical aspects such as different affinity of the employed IgA/IgG capture antibodies for their targets or varying binding efficiency of these biotinylated capture antibodies to the Streptavidin coated beads (despite using the same amount of IgA and IgG in the immunoprecipitations [3 µg] and availability of capturing beads in excess [according to the manufacturer’s specifications]). Potentially sensitivity could be increased for the IgA specific beads by systematically gauging different phage and antibody amounts (as demonstrated by ref. (Vogl et al., 2021) for protein A and G). Alternatively, to these experimental factors, also biological factors such as lower binding rates of IgA to the antigens of our phage library may contribute to these results. Elucidating the exact underlying factors will require additional experiments, however our data demonstrate that IgG and IgA responses can be resolved with the reported workflow (Shrock et al., 2020)of applying capture antibody with specificities for human antibody subclasses (detecting primarily IgG responses against food antigens, Fig. 4h and discussion below).
We also compared peptides bound by IgA and IgG to results obtained from the mixture of protein A and G (Fig. 4e,f). Peptides bound by IgG and the mixture of protein A+G showed a large overlap (R=0.72). In contrast IgA bound peptides showed less overlap to protein A+G (similar to the binding overlap between IgA and IgG, shown in Fig. 4f vs. d). These results were expected from the protein A vs. G experiments, that had already suggested primarily detection of IgG subtypes. Overall, we found that also food antigens were bound at similar percentages, confirming that we are primarily detecting IgG against food antigens (Fig. 4h). The somewhat skewed binding profile in Fig. 4e (with the mixture of protein A and G showing general higher prevalences per peptide than IgG specific beads) may be caused by experimental factors: 1.) Protein A and G bind also other antibody classes than IgG (although at lower affinity), hence additional binding to other classes may contribute to the signals observed with the protein A and G mixture. 2.) The mixture of protein A and G detected on average per sample a larger number of peptides than the IgG specific beads (Fig. 4g). While protein A+G coated beads detected approximately 332 (median) peptides per sample, IgG specific beads detected 66 peptides per sample. As we had used the same amount of normalized IgG (3 µg) in both cases, this difference may rather be due to different binding capacities or affinity (although we had in both cases provided beads in excess according to the manufacturer’s recommendations). Hence the skewing and seemingly greater binding with protein A+G than IgG specific beads could be due to technical aspects. Potentially sensitivity could also be increased for the IgG specific beads by systematically testing different phage and antibody amounts (as referenced above for IgA (Vogl et al., 2021)). We had also prepared a different batch of phages for the IgA vs. IgG experiment. Even though binding of each variant is normalized by the baseline abundances (input read numbers, see STAR methods), this factor may cause additional variation. This aspect applies only to the IgA and IgG experiments, the rest of the data presented in the manuscript has been measured from the same batch of phage material.
Overall, the subclass experiments (Fig. 4a to h) show that our workflow based on a mixture of protein A and G detects primarily IgG for the cohort of ~1,000 samples discussed in the main text. For a subset of 80 samples we demonstrate that IgA and IgG specific binding of antigens can be analyzed with the reported workflow (Shrock et al., 2020) of applying capture antibody with specificities for human antibody subclasses. For these samples, some peptides are recognized nearly exclusively by IgA or IgG, whereas for others the two antibody classes overlap to varying extents.
These results indicate that the vast majority of detected antibody binding events against antigens of food (as well as pathogens from the IEDB) in this study are attributable to IgG subclasses. Yet, this finding does not preclude binding of additional antibody classes such as IgA, IgM, IgE. These antibody classes may also bind to our antigen library but may not be detectable due to lower affinities to protein A: Protein A has high affinity for IgG1,2,4 subclasses, but only weak/moderate affinity for IgG3, IgA, IgM, and IgE. Additionally, serum contains larger amounts of IgG (~75%) than IgA (~15%), IgM (~10%) or IgE (<0.01%) (Schroeder and Cavacini, 2010).
Therefore, detection of IgA, IgM, and IgE is in the current experimental setting is disfavored by a higher affinity of protein A (and G) for IgG as well as larger amounts of serum IgG competing for binding.
Hence, while the results of this study focus on serum IgG responses, it could be highly informative to study overlaps between antibody classes as well as systemic and mucosal repertoires (Chen et al., 2020; Fadlallah et al., 2018) using this PhIP-Seq microbiota antigen library. Especially for IgE, a workflow has already been published that allows for robust detection of allergies via PhIP-Seq (Monaco et al., 2021).
Machine learning and data analysis
We used the gradient boosting trees regressor and classifier from scikit-learn (Pedregosa et al., 2011) as predictive model algorithms for the different phenotypes. For each phenotype we turned hyperparameters using a 10-fold cross-validation. We tuned the parameters in the following order: (1) n_estimators from the range of 1–400 (2) max_depth from the range of 1–200 (3) min_samples_leaf from the range of 1–200. The rest of the parameters had the default values of scikit-learn. Predictions were then performed on a 10-fold cross-validation with a different random seed so that any overfitting of hyperparameters would worsen prediction accuracy. The standard deviation of AUC was computed by 100 bootstraps on 75% of the predictions and was performed after predicting values on the entire cohort. For all machine learning predictions, antibody bound peptides were filtered in two ways: 1.) Values that did not pass the p-value for being significantly enriched in the antibody assay were excluded. 2.) Only peptides that were bound by antibodies in more than 5% of the population were used as features (for each phenotype it is the population where this phenotype exists).
Peptide ELISAs
To validate the PhIP-Seq results, we selected 12 peptides included within our PhIP-Seq library for analysis in a peptide ELISA (results shown in Figure S 5). We included a positive control of a viral peptide (Epstein-Barr virus [EBV] nuclear antigen 1) with frequent population scale antibody responses (Xu et al., 2015) (corresponding peptide in the PhIP-Seq library: #47461) as well as a negative control of a human protein (SAPK4/MAPK13) that was expected not to elicit antibody binding in sera of individuals without autoimmune diseases (corresponding PhIP-Seq peptides: #33821, #33822, #33823 [the identical peptide was encoded as negative controls 3x within the library, with neither DNA encoding of the peptide eliciting binding, see (Vogl et al., 2021) for details]). The 20aa sequence in the positive control appears also in other peptides (#58796, #58797, #58798, #47462, #47463, #49412). However, as Ig responses against all of these peptides in PhIP-Seq showed a similar correlation to the IgG ELISA peptide (Spearman R 0.66 to 0.84), only data for one representative peptide (R=0.71) is shown in Figure S 5. We had also previously successfully used the same positive and negative controls in ELISA experiments (Vogl et al., 2021).
Beyond the controls, we included 10 peptides of animal and plant food proteins. In part we selected peptides from similar clusters and shared motifs (Fig. 2) to assess potential cross reactivity. In detail we included peptides from three milk proteins from cow (#20848), sheep (#14067), and goat (#20844). We also included peptides from chicken (#1603) and ostrich (#5109) egg proteins. In addition, a peptide from lentil (#16254), from wheat (#14325), and from einkorn (#11627) were selected. We included also insect peptides or shrimp (#23604) and dust mite (#25201). As chemical synthesis of 54 aa peptides displayed on the phages is costly, we aimed to reduce the peptide length. Therefore, we selected 20 aa sections representing the overlap of adjacent peptides of the same protein bound in PhIP-Seq, or peptides featuring conserved motifs (Fig. 2). The following aa sequences were selected: EBV - PPPGRRPFFHPVAEADYFEY, SAPK4 - KIMGMEFSEEKIQYLVYQML, cow - YLEQLLRLKKYKVPQLEIVP, sheep - YLEQLLRLKKYNVPQLEIVP, goat - QFYQKFPQYLQYPYQGPIVL, chicken - RPICGTDGVTYTNDCLLCAY, ostrich - MPLCGSDSKTYSNKCNFCNA, lentil – QIQRPVKELAFPGSSREVDR, wheat - NCYNLCRARGAQKLCAGVCR, einkorn - DCYNLCRARGAQKLCANVCR, shrimp - EAEGGIYDISNKRRMGLTEY, dust mite - ESVGGVYDISNKRRMGLTEY.
These aa sequences were ordered from JPT Peptide Technologies (Berlin, Germany) as biotinylated chemically synthesized peptides and the peptide ELISA was performed according to the manufacturer’s guidelines with the recommended concentrations (Protocols BioTides™ Peptides Revision 1.0, and Peptide ELISA Revision 1.2). In short, the peptides were bound to Streptavidin coated plates (Thermo Scientific™ Nunc™ Immobilizer™ Streptavidin Plates, cat. no. 436014) and incubated with serum samples (diluted 1:1,000 fold). Antibody binding was detected with an HRP conjugated anti human IgG antibody (Southern Biotech, cat. no. 204205) or an anti human IgE antibody (Southern Biotech, cat. no. 9250–05) and TMB as substrate. Sera of 40 individuals (for whom also PhIP-Seq data was available) were tested with each of the 12 peptides with both the IgG and IgE secondary antibody.
Supplementary Material
Table S 1: Supporting .xlsx file with most frequently antibody bound peptides in >5% of the cohort. Relating to Fig. 1. Lists of bound peptides are provided separately for proteins from allergen databases (top) and bacterial and viral proteins from the IEDB (bottom).
Table S 2: Supporting .xlsx file providing details on peptides constituting the clusters from allergen databases (Fig. 2c–i and Figure S 3; here sheet ‘Allergen databases clusters’), the IEDB (Figure S 4, here sheet ‘IEDB clusters’), and the combination of allergen databases and the IEDB (Fig. 3, here sheet ‘Allergens DBs + IEDB clusters’). Relating to Fig. 2. For the combination of allergen databases and the IEDB, different clustering thresholds were applied and the respective clusters are listed in the sheets “AllerDBs+IEDBclusters(extra0.6)” and “AllerDBs+IEDBclusters(extra0.5)”. In addition, list of all the peptides clustered in Fig. 2c (sheet: all_allergen_pep_order) and Figure S 4a (sheet: all_IEDB_pep_order) are provided (i.e. all the peptides on the X/Y axes of the distance matrices – “all_allergen_pep_order” and).
Table S 4: Supporting .xlsx file listing peptides significantly associated with age, gender, or egg consumption (Fig. 6a,d,e) as well as peptides identified by SHAP analysis to drive predictions of age, gender, and dietary intake of egg products (see Fig. 6b,c;e,f;g,h) as well as peptides associated with dietary intake of eggs. Relating to Fig. 6. Results of peptides associated with intake of egg (sheet name ‘Egg FFQ Abs’) is corrected for 4690 tests of food frequencies s vs. peptides related to those foods (Fisher exact test with FDR corrected p-value below 0.05 [same test also applied for testing age/gender associations). Also a list antibody bound peptides significantly associated with the metabolite 3-methoxytyrosine (Figure S 6d) is provided.
Table S 3: Supporting xlsx file providing detailed lists on the respective peptides bound by protein A vs. G beads and in IgA vs. IgG capture experiments shown in Fig. 3. Realted to Fig. 3. See STAR methods for details.
Acknowledgments
E.S. is supported by grants from the European Research Council, the Israel Science Foundation, and by the Seerave Foundation. T.V. gratefully acknowledges support from the Austrian Science Fund (FWF, Erwin Schrödinger fellowship J 4256).
Inclusion and diversity
We support inclusive, diverse, and equitable conduct of research.
Footnotes
Declaration of interests
The authors declare no competing interests.
References
- Abdel-Gadir A, Stephen-Victor E, Gerber GK, Noval Rivas M, Wang S, Harb H, Wang L, Li N, Crestani E, Spielman S, et al. (2019). Microbiota therapy acts via a regulatory T cell MyD88/RORγt pathway to suppress food allergy. Nat. Med. [DOI] [PMC free article] [PubMed] [Google Scholar]
- Aguilera-Lizarraga J, Florens MV, Viola MF, Jain P, Decraecker L, Appeltans I, Cuende-Estevez M, Fabre N, Van Beek K, Perna E, et al. (2021). Local immune response to food antigens drives meal-induced abdominal pain. Nature 590, 151–156. [DOI] [PMC free article] [PubMed] [Google Scholar]
- Alexander M, and Turnbaugh PJ (2020). Deconstructing Mechanisms of Diet-Microbiome-Immune Interactions. Immunity 53, 264–276. [DOI] [PMC free article] [PubMed] [Google Scholar]
- Bailey TL, and Elkan C (1994). Fitting a mixture model by expectation maximization to discover motifs in biopolymers. Proceedings. Int. Conf. Intell. Syst. Mol. Biol. 2, 28–36. [PubMed] [Google Scholar]
- Bailey TL, Williams N, Misleh C, and Li WW (2006). MEME: discovering and analyzing DNA and protein sequence motifs. Nucleic Acids Res. 34, W369–73. [DOI] [PMC free article] [PubMed] [Google Scholar]
- Bar N, Korem T, Weissbrod O, Zeevi D, Rothschild D, Leviatan S, Kosower N, Lotan-Pompan M, Weinberger A, Le Roy CI, et al. (2020). A reference map of potential determinants for the human serum metabolome. Nature 588, 135–140. [DOI] [PubMed] [Google Scholar]
- Berglund L, Andrade J, Odeberg J, and Uhlén M (2008). The epitope space of the human proteome. Protein Sci. 17, 606–613. [DOI] [PMC free article] [PubMed] [Google Scholar]
- Bunker JJ, and Bendelac A (2018). IgA Responses to Microbiota. Immunity 49, 211–224. [DOI] [PMC free article] [PubMed] [Google Scholar]
- Campbell E, Hesser LA, and Nagler CR (2020). B cells and the microbiota: a missing connection in food allergy. Mucosal Immunol. [DOI] [PubMed] [Google Scholar]
- Chen G, Shrock EL, Li MZ, Spergel JM, Nadeau KC, Pongracic JA, Umetsu DT, Rachid R, MacGinnitie AJ, Phipatanakul W, et al. (2021). High-resolution epitope mapping by AllerScan reveals relationships between IgE and IgG repertoires during peanut oral immunotherapy. Cell Reports Med. 2, 100410. [DOI] [PMC free article] [PubMed] [Google Scholar]
- Chen K, Magri G, Grasset EK, and Cerutti A (2020). Rethinking mucosal antibody responses: IgM, IgG and IgD join IgA. Nat. Rev. Immunol. [DOI] [PMC free article] [PubMed] [Google Scholar]
- Childs Calder, and Miles (2019). Diet and Immune Function. Nutrients 11, 1933. [DOI] [PMC free article] [PubMed] [Google Scholar]
- Corthésy B (2013). Multi-faceted functions of secretory IgA at mucosal surfaces. Front. Immunol. 4, 185. [DOI] [PMC free article] [PubMed] [Google Scholar]
- Datema MR, Eller E, Zwinderman AH, Poulsen LK, Versteeg SA, van Ree R, and Bindslev-Jensen C (2019). Ratios of specific IgG4 over IgE antibodies do not improve prediction of peanut allergy nor of its severity compared to specific IgE alone. Clin. Exp. Allergy 49, 216–226. [DOI] [PMC free article] [PubMed] [Google Scholar]
- Eckl-Dorna J, Villazala-Merino S, Linhart B, Karaulov AV, Zhernov Y, Khaitov M, Niederberger-Leppin V, and Valenta R (2019). Allergen-specific antibodies regulate secondary allergen-specific immune responses. Front. Immunol. 10, 1–15. [DOI] [PMC free article] [PubMed] [Google Scholar]
- Fadlallah J, Sterlin D, Fieschi C, Parizot C, Dorgham K, El Kafsi H, Autaa G, Ghillani-Dalbin P, Juste C, Lepage P, et al. (2018). Synergistic convergence of microbiota-specific systemic IgG and secretory IgA. J. Allergy Clin. Immunol. [DOI] [PubMed] [Google Scholar]
- Fitzsimmons CM, Falcone FH, and Dunne DW (2014). Helminth allergens, parasite-specific IgE, and its protective role in human immunity. Front. Immunol. 5, 1–12. [DOI] [PMC free article] [PubMed] [Google Scholar]
- Forsström B, Axnäs BB, Stengele K-P, Bühler J, Albert TJ, Richmond TA, Hu FJ, Nilsson P, Hudson EP, Rockberg J, et al. (2014). Proteome-wide Epitope Mapping of Antibodies Using Ultra-dense Peptide Arrays. Mol. Cell. Proteomics 13, 1585–1597. [DOI] [PMC free article] [PubMed] [Google Scholar]
- Forsström B, Bisławska Axnäs B, Rockberg J, Danielsson H, Bohlin A, and Uhlen M (2015). Dissecting antibodies with regards to linear and conformational epitopes. PLoS One 10, 1–11. [DOI] [PMC free article] [PubMed] [Google Scholar]
- Frith MC, Saunders NFW, Kobe B, and Bailey TL (2008). Discovering sequence motifs with arbitrary insertions and deletions. PLoS Comput. Biol. 4, e1000071. [DOI] [PMC free article] [PubMed] [Google Scholar]
- Frossard CP, Hauser C, and Eigenmann PA (2004). Antigen-specific secretory IgA antibodies in the gut are decreased in a mouse model of food allergy. J. Allergy Clin. Immunol. 114, 377–382. [DOI] [PubMed] [Google Scholar]
- Geisslitz S, Shewry P, Brouns F, America AHP, Caio GPI, Daly M, D’Amico S, De Giorgio R, Gilissen L, Grausgruber H, et al. (2021). Wheat ATIs: Characteristics and Role in Human Disease. Front. Nutr. 8, 667370. [DOI] [PMC free article] [PubMed] [Google Scholar]
- Gocki J, and Bartuzi Z (2016). Role of immunoglobulin G antibodies in diagnosis of food allergy. Postep. Dermatologii i Alergol. 33, 253–256. [DOI] [PMC free article] [PubMed] [Google Scholar]
- Goodman RE, Ebisawa M, Ferreira F, Sampson HA, van Ree R, Vieths S, Baumert JL, Bohle B, Lalithambika S, Wise J, et al. (2016). AllergenOnline: A peer-reviewed, curated allergen database to assess novel food proteins for potential cross-reactivity. Mol. Nutr. Food Res. 60, 1183–1198. [DOI] [PubMed] [Google Scholar]
- Halfmann R, Alberti S, Krishnan R, Lyle N, O’Donnell CW, King OD, Berger B, Pappu RV, and Lindquist S (2011). Opposing Effects of Glutamine and Asparagine Govern Prion Formation by Intrinsically Disordered Proteins. Mol. Cell 43, 72–84. [DOI] [PMC free article] [PubMed] [Google Scholar]
- Hamilton RG (2009). Relevance of (IgG anti-IgE)-IgE complexes, IgG subclass and modern IgG antibody autoanalyzers in the dying IgG reagin story. Allergy Eur. J. Allergy Clin. Immunol. 64, 317–318. [DOI] [PubMed] [Google Scholar]
- He J-S, Subramaniam S, Narang V, Srinivasan K, Saunders SP, Carbajo D, Wen-Shan T, Hidayah Hamadee N, Lum J, Lee A, et al. (2017). IgG1 memory B cells keep the memory of IgE responses. Nat. Commun. 8, 641. [DOI] [PMC free article] [PubMed] [Google Scholar]
- Hemler JA, Phillips EJ, Mallal SA, and Kendall PL (2015). The evolving story of human leukocyte antigen and the immunogenetics of peanut allergy. Ann. Allergy. Asthma Immunol. 115, 471–476. [DOI] [PMC free article] [PubMed] [Google Scholar]
- Hoh RA, and Boyd SD (2018). Gut Mucosal Antibody Responses and Implications for Food Allergy. Front. Immunol. 9, 2221. [DOI] [PMC free article] [PubMed] [Google Scholar]
- Hoof I, Schulten V, Layhadi JA, Stranzl T, Christensen LH, Herrera de la Mata S, Seumois G, Vijayanand P, Lundegaard C, Niss K, et al. (2020). Allergen-specific IgG+ memory B cells are temporally linked to IgE memory responses. J. Allergy Clin. Immunol. 146, 180–191. [DOI] [PMC free article] [PubMed] [Google Scholar]
- Husby S, Oxelius VA, Teisner B, Jensenius JC, and Svehag SE (1985). Humoral immunity to dietary antigens in healthy adults. Occurrence, isotype and IgG subclass distribution of serum antibodies to protein antigens. Int. Arch. Allergy Appl. Immunol. 77, 416–422. [DOI] [PubMed] [Google Scholar]
- Huus KE, Bauer KC, Brown EM, Bozorgmehr T, Woodward SE, Serapio-Palacios A, Boutin RCT, Petersen C, and Finlay BB (2020). Commensal Bacteria Modulate Immunoglobulin A Binding in Response to Host Nutrition. Cell Host Microbe 1–13. [DOI] [PubMed] [Google Scholar]
- Ivanciuc O, Schein CH, and Braun W (2003). SDAP: database and computational tools for allergenic proteins. Nucleic Acids Res. 31, 359–362. [DOI] [PMC free article] [PubMed] [Google Scholar]
- James LK, and Till SJ (2016). Potential Mechanisms for IgG4 Inhibition of Immediate Hypersensitivity Reactions. Curr. Allergy Asthma Rep. 16, 23. [DOI] [PMC free article] [PubMed] [Google Scholar]
- Junker Y, Zeissig S, Kim S-J, Barisani D, Wieser H, Leffler DA, Zevallos V, Libermann TA, Dillon S, Freitag TL, et al. (2012). Wheat amylase trypsin inhibitors drive intestinal inflammation via activation of toll-like receptor 4. J. Exp. Med. 209, 2395–2408. [DOI] [PMC free article] [PubMed] [Google Scholar]
- Kamemura N, Takashima M, Morita H, Matsumoto K, Saito H, and Kido H (2015). Measurement of allergen-specific secretory IgA in stool of neonates, infants and toddlers by protection against degradation of immunoglobulins and allergens. J. Med. Invest. 62, 137–144. [DOI] [PubMed] [Google Scholar]
- Konstantinou GN, Nowak-Węgrzyn A, Bencharitiwong R, Bardina L, Sicherer SH, and Sampson HA (2014a). Egg-white-specific IgA and IgA2 antibodies in egg-allergic children: is there a role in tolerance induction? Pediatr. Allergy Immunol. 25, 64–70. [DOI] [PMC free article] [PubMed] [Google Scholar]
- Konstantinou GN, Bencharitiwong R, Grishin A, Caubet J-C, Bardina L, Sicherer SH, Sampson HA, and Nowak-Węgrzyn A (2014b). The role of casein-specific IgA and TGF-β in children with food protein-induced enterocolitis syndrome to milk. Pediatr. Allergy Immunol. 25, 651–656. [DOI] [PMC free article] [PubMed] [Google Scholar]
- Korem T, Zeevi D, Zmora N, Weissbrod O, Bar N, Lotan-Pompan M, Avnit-Sagi T, Kosower N, Malka G, Rein M, et al. (2017). Bread Affects Clinical Parameters and Induces Gut Microbiome-Associated Personal Glycemic Responses. Cell Metab. 25, 1243–1253.e5. [DOI] [PubMed] [Google Scholar]
- Kostara M, Chondrou V, Sgourou A, Douros K, and Tsabouri S (2020). HLA Polymorphisms and Food Allergy Predisposition. J. Pediatr. Genet. 9, 77–86. [DOI] [PMC free article] [PubMed] [Google Scholar]
- Kumar S, Stecher G, Li M, Knyaz C, and Tamura K (2018). MEGA X: Molecular Evolutionary Genetics Analysis across Computing Platforms. Mol. Biol. Evol. 35, 1547–1549. [DOI] [PMC free article] [PubMed] [Google Scholar]
- Larman HB, Zhao Z, Laserson U, Li MZ, Ciccia A, Gakidis MAM, Church GM, Kesari S, Leproust EM, Solimini NL, et al. (2011). Autoantigen discovery with a synthetic human peptidome. Nat. Biotechnol. 29, 535–541. [DOI] [PMC free article] [PubMed] [Google Scholar]
- Larman HB, Laserson U, Querol L, Verhaeghen K, Solimini NL, Xu GJ, Klarenbeek PL, Church GM, Hafler DA, Plenge RM, et al. (2013). PhIP-Seq characterization of autoantibodies from patients with multiple sclerosis, type 1 diabetes and rheumatoid arthritis. J. Autoimmun. 43, 1–9. [DOI] [PMC free article] [PubMed] [Google Scholar]
- Li H, Limenitakis JP, Greiff V, Yilmaz B, Schären O, Urbaniak C, Zünd M, Lawson MAE, Young ID, Rupp S, et al. (2020). Mucosal or systemic microbiota exposures shape the B cell repertoire. Nature. [DOI] [PubMed] [Google Scholar]
- Lundberg SM, and Lee SI (2017). A unified approach to interpreting model predictions. Adv. Neural Inf. Process. Syst. 2017-Decem, 4766–4775. [Google Scholar]
- Lyons SA, Burney PGJ, Ballmer-Weber BK, Fernandez-Rivas M, Barreales L, Clausen M, Dubakiene R, Fernandez-Perez C, Fritsche P, Jedrzejczak-Czechowicz M, et al. Food Allergy in Adults: Substantial Variation in Prevalence and Causative Foods Across Europe. J. Allergy Clin. Immunol. Pract. 7, 1920–1928.e11. [DOI] [PubMed] [Google Scholar]
- Mari A, Scala E, Palazzo P, Ridolfi S, Zennaro D, and Carabella G (2006). Bioinformatics applied to allergy: allergen databases, from collecting sequence information to data integration. The Allergome platform as a model. Cell. Immunol. 244, 97–100. [DOI] [PubMed] [Google Scholar]
- Maurer M, Altrichter S, Schmetzer O, Scheffel J, Church MK, and Metz M (2018). Immunoglobulin E-Mediated Autoimmunity. Front. Immunol. 9, 689. [DOI] [PMC free article] [PubMed] [Google Scholar]
- Michailidou D, Schwartz DM, Mustelin T, and Hughes GC (2021). Allergic Aspects of IgG4-Related Disease: Implications for Pathogenesis and Therapy. Front. Immunol. 12, 693192. [DOI] [PMC free article] [PubMed] [Google Scholar]
- Mina MJ, Kula T, Leng Y, Li M, de Vries RD, Knip M, Siljander H, Rewers M, Choy DF, Wilson MS, et al. (2019). Measles virus infection diminishes preexisting antibodies that offer protection from other pathogens. Science 366, 599–606. [DOI] [PMC free article] [PubMed] [Google Scholar]
- Mohammed AD, Khan MAW, Chatzistamou I, Chamseddine D, Williams-Kang K, Perry M, Enos R, Murphy A, Gomez G, Aladhami A, et al. (2019). Gut Antibody Deficiency in a Mouse Model of CVID Results in Spontaneous Development of a Gluten-Sensitive Enteropathy. Front. Immunol. 10, 2484. [DOI] [PMC free article] [PubMed] [Google Scholar]
- Mohan D, Wansley DL, Sie BM, Noon MS, Baer AN, Laserson U, and Larman HB (2018). PhIP-Seq characterization of serum antibodies using oligonucleotide-encoded peptidomes. Nat. Protoc. 13, 1958–1978. [DOI] [PMC free article] [PubMed] [Google Scholar]
- Monaco DR, Sie BM, Nirschl TR, Knight AC, Sampson HA, Nowak-Wegrzyn A, Wood RA, Hamilton RG, Frischmeyer-Guerrerio PA, and Larman HB (2021). Profiling serum antibodies with a pan allergen phage library identifies key wheat allergy epitopes. Nat. Commun. 12. [DOI] [PMC free article] [PubMed] [Google Scholar]
- Muralidharan V, and Goldberg DE (2013). Asparagine Repeats in Plasmodium falciparum Proteins: Good for Nothing? PLoS Pathog. 9, 8–11. [DOI] [PMC free article] [PubMed] [Google Scholar]
- Nachshon L, Schwartz N, Elizur A, Schon Y, Cheryomukhin M, Katz Y, and Goldberg MR The Prevalence of Food Allergy in Young Israeli Adults. J. Allergy Clin. Immunol. Pract. 7, 2782–2789.e4. [DOI] [PubMed] [Google Scholar]
- Nikolov G, Todordova Y, Emilova R, Hristova D, Nikolova M, and Petrunov B (2021). Allergen-Specific IgE and IgG4 as Biomarkers for Immunologic Changes during Subcutaneous Allergen Immunotherapy. Antibodies (Basel, Switzerland) 10. [DOI] [PMC free article] [PubMed] [Google Scholar]
- Okamoto S, Taniuchi S, Sudo K, Hatano Y, Nakano K, Shimo T, and Kaneko K (2012). Predictive value of IgE/IgG4 antibody ratio in children with egg allergy. Allergy Asthma. Clin. Immunol. 8, 9. [DOI] [PMC free article] [PubMed] [Google Scholar]
- Pascal M, Perez-Gordo M, Caballero T, Escribese MM, Lopez Longo MN, Luengo O, Manso L, Matheu V, Seoane E, Zamorano M, et al. (2018). Microbiome and Allergic Diseases. Front. Immunol. 9, 1584. [DOI] [PMC free article] [PubMed] [Google Scholar]
- Pedregosa et al. (2011) Scikit-learn: Machine Learning in Python, JMLR 12, pp. 2825–2830 [Google Scholar]
- Radauer C, Bublin M, Wagner S, Mari A, and Breiteneder H (2008). Allergens are distributed into few protein families and possess a restricted number of biochemical functions. J. Allergy Clin. Immunol. 121. [DOI] [PubMed] [Google Scholar]
- Radauer C, Nandy A, Ferreira F, Goodman RE, Larsen JN, Lidholm J, Pomés A, Raulf-Heimsoth M, Rozynek P, Thomas WR, et al. (2014). Update of the WHO/IUIS Allergen Nomenclature Database based on analysis of allergen sequences. Allergy Eur. J. Allergy Clin. Immunol. 69, 413–419. [DOI] [PubMed] [Google Scholar]
- Sanjuan MA, Sagar D, and Kolbeck R (2016). Role of IgE in autoimmunity. J. Allergy Clin. Immunol. 137, 1651–1661. [DOI] [PubMed] [Google Scholar]
- Santos AF, James LK, Bahnson HT, Shamji MH, Couto-Francisco NC, Islam S, Houghton S, Clark AT, Stephens A, Turcanu V, et al. (2015). IgG4 inhibits peanut-induced basophil and mast cell activation in peanut-tolerant children sensitized to peanut major allergens. J. Allergy Clin. Immunol. 135, 1249–1256. [DOI] [PMC free article] [PubMed] [Google Scholar]
- Satitsuksanoa P, Daanje M, Akdis M, Boyd SD, and van de Veen W (2021). Biology and dynamics of B cells in the context of IgE-mediated food allergy. Allergy 76, 1707–1717. [DOI] [PubMed] [Google Scholar]
- Saunders SP, Ma EGM, Aranda CJ, and Curotto de Lafaille MA (2019). Non-classical B Cell Memory of Allergic IgE Responses. Front. Immunol. 10, 715. [DOI] [PMC free article] [PubMed] [Google Scholar]
- Schroeder HW, and Cavacini L (2010). Structure and function of immunoglobulins. J. Allergy Clin. Immunol. 125, S41–S52. [DOI] [PMC free article] [PubMed] [Google Scholar]
- Shrock E, Fujimura E, Kula T, Timms RT, Lee I, Leng Y, Robinson ML, Sie BM, Li MZ, Chen Y, et al. (2020). Viral epitope profiling of COVID-19 patients reveals cross-reactivity and correlates of severity. Science 370, 1–23. [DOI] [PMC free article] [PubMed] [Google Scholar]
- Siebenga JJ, Vennema H, Zheng D-P, Vinjé J, Lee BE, Pang X-L, Ho ECM, Lim W, Choudekar A, Broor S, et al. (2009). Norovirus illness is a global problem: emergence and spread of norovirus GII.4 variants, 2001–2007. J. Infect. Dis. 200, 802–812. [DOI] [PubMed] [Google Scholar]
- Smoldovskaya O, Feyzkhanova G, Voloshin S, Arefieva A, Chubarova A, Pavlushkina L, Filatova T, Antonova E, Timofeeva E, Butvilovskaya V, et al. (2018). Allergen-specific IgE and IgG4 patterns among patients with different allergic diseases. World Allergy Organ. J. 11, 35. [DOI] [PMC free article] [PubMed] [Google Scholar]
- Spitzer M, Wildenhain J, Rappsilber J, and Tyers M (2014). BoxPlotR: a web tool for generation of box plots. Nat. Methods 11, 121–122. [DOI] [PMC free article] [PubMed] [Google Scholar]
- Stapel SO, Asero R, Ballmer-Weber BK, Knol EF, Strobel S, Vieths S, and Kleine-Tebbe J (2008). Testing for IgG4 against foods is not recommended as a diagnostic tool: EAACI Task Force Report. Allergy Eur. J. Allergy Clin. Immunol. 63, 793–796. [DOI] [PubMed] [Google Scholar]
- Stephen-Victor E, Crestani E, and Chatila TA (2020). Dietary and Microbial Determinants in Food Allergy. Immunity 53, 277–289. [DOI] [PMC free article] [PubMed] [Google Scholar]
- Tordesillas L, Berin MC, and Sampson HA (2017). Immunology of Food Allergy. Immunity 47, 32–50. [DOI] [PubMed] [Google Scholar]
- USDA ERS (2022) U.S. Department of Agriculture, Economic Research Service, 945; https://www.ers.usda.gov/Data/FoodConsumption/, accessed 30.08.2022 [Google Scholar]
- Vazquez-Ortiz M, Pascal M, Juan M, Alsina L, Martín-Mateos MA, and Plaza AM (2013). Serum allergen-specific IgA is not associated with natural or induced tolerance to egg in children. Allergy 68, 1327–1332. [DOI] [PubMed] [Google Scholar]
- Venkataraman T, Valencia C, Mangino M, Morgenlander W, Clipman SJ, Liechti T, Valencia A, Christofidou P, Spector T, Roederer M, et al. (2022). Analysis of antibody binding specificities in twin and SNP-genotyped cohorts reveals that antiviral antibody epitope selection is a heritable trait. Immunity 55, 174–184.e5. [DOI] [PMC free article] [PubMed] [Google Scholar]
- Vita R, Overton JA, Greenbaum JA, Ponomarenko J, Clark JD, Cantrell JR, Wheeler DK, Gabbard JL, Hix D, Sette A, et al. (2015). The immune epitope database (IEDB) 3.0. Nucleic Acids Res. 43, D405–D412. [DOI] [PMC free article] [PubMed] [Google Scholar]
- Vogl T, Klompus S, Leviatan S, Kalka IN, Weinberger A, Wijmenga C, Fu J, Zhernakova A, Weersma RK, and Segal E (2021). Population-wide diversity and stability of serum antibody epitope repertoires against human microbiota. Nat. Med. 27, 1442–1450. [DOI] [PubMed] [Google Scholar]
- Vojdani A, Gushgari LR, and Vojdani E (2020). Interaction between food antigens and the immune system: Association with autoimmune disorders. (Elsevier B.V; ). [DOI] [PubMed] [Google Scholar]
- van der Windt DAWM, Jellema P, Mulder CJ, Kneepkens CMF, and van der Horst HE (2010). Diagnostic Testing for Celiac Disease Among Patients With Abdominal Symptoms. JAMA 303, 1738. [DOI] [PubMed] [Google Scholar]
- Wu D, Lewis ED, Pae M, and Meydani SN (2018). Nutritional Modulation of Immune Function: Analysis of Evidence, Mechanisms, and Clinical Relevance. Front. Immunol. 9, 3160. [DOI] [PMC free article] [PubMed] [Google Scholar]
- Xiong H, Dolpady J, Wabl M, Curotto de Lafaille MA, and Lafaille JJ (2012). Sequential class switching is required for the generation of high affinity IgE antibodies. J. Exp. Med. 209, 353–364. [DOI] [PMC free article] [PubMed] [Google Scholar]
- Xu GJ, Kula T, Xu Q, Li MZ, Vernon SD, Ndung’u T, Ruxrungtham K, Sanchez J, Brander C, Chung RT, et al. (2015). Viral immunology. Comprehensive serological profiling of human populations using a synthetic human virome. Science 348, aaa0698. [DOI] [PMC free article] [PubMed] [Google Scholar]
- Yu W, Freeland DMH, and Nadeau KC (2016). Food allergy: immune mechanisms, diagnosis and immunotherapy. Nat. Rev. Immunol. 16, 751–765. [DOI] [PMC free article] [PubMed] [Google Scholar]
- Zeevi D, Korem T, Zmora N, Israeli D, Rothschild D, Weinberger A, Ben-Yacov O, Lador D, Avnit-Sagi T, Lotan-Pompan M, et al. (2015). Personalized Nutrition by Prediction of Glycemic Responses. Cell 163, 1079–1094. [DOI] [PubMed] [Google Scholar]
- Zeng MY, Cisalpino D, Varadarajan S, Hellman J, Warren HS, Cascalho M, Inohara N, and Núñez G (2016). Gut Microbiota-Induced Immunoglobulin G Controls Systemic Infection by Symbiotic Bacteria and Pathogens. Immunity 44, 647–658. [DOI] [PMC free article] [PubMed] [Google Scholar]
- Zhang B, Liu E, Gertie JA, Joseph J, Xu L, Pinker EY, Waizman DA, Catanzaro J, Hamza KH, Lahl K, et al. (2020). Divergent T follicular helper cell requirement for IgA and IgE production to peanut during allergic sensitization. Sci. Immunol. 5, 64–70. [DOI] [PMC free article] [PubMed] [Google Scholar]
Associated Data
This section collects any data citations, data availability statements, or supplementary materials included in this article.
Supplementary Materials
Table S 1: Supporting .xlsx file with most frequently antibody bound peptides in >5% of the cohort. Relating to Fig. 1. Lists of bound peptides are provided separately for proteins from allergen databases (top) and bacterial and viral proteins from the IEDB (bottom).
Table S 2: Supporting .xlsx file providing details on peptides constituting the clusters from allergen databases (Fig. 2c–i and Figure S 3; here sheet ‘Allergen databases clusters’), the IEDB (Figure S 4, here sheet ‘IEDB clusters’), and the combination of allergen databases and the IEDB (Fig. 3, here sheet ‘Allergens DBs + IEDB clusters’). Relating to Fig. 2. For the combination of allergen databases and the IEDB, different clustering thresholds were applied and the respective clusters are listed in the sheets “AllerDBs+IEDBclusters(extra0.6)” and “AllerDBs+IEDBclusters(extra0.5)”. In addition, list of all the peptides clustered in Fig. 2c (sheet: all_allergen_pep_order) and Figure S 4a (sheet: all_IEDB_pep_order) are provided (i.e. all the peptides on the X/Y axes of the distance matrices – “all_allergen_pep_order” and).
Table S 4: Supporting .xlsx file listing peptides significantly associated with age, gender, or egg consumption (Fig. 6a,d,e) as well as peptides identified by SHAP analysis to drive predictions of age, gender, and dietary intake of egg products (see Fig. 6b,c;e,f;g,h) as well as peptides associated with dietary intake of eggs. Relating to Fig. 6. Results of peptides associated with intake of egg (sheet name ‘Egg FFQ Abs’) is corrected for 4690 tests of food frequencies s vs. peptides related to those foods (Fisher exact test with FDR corrected p-value below 0.05 [same test also applied for testing age/gender associations). Also a list antibody bound peptides significantly associated with the metabolite 3-methoxytyrosine (Figure S 6d) is provided.
Table S 3: Supporting xlsx file providing detailed lists on the respective peptides bound by protein A vs. G beads and in IgA vs. IgG capture experiments shown in Fig. 3. Realted to Fig. 3. See STAR methods for details.
Data Availability Statement
The majority of data generated or analyzed during this study are included with the manuscript (and its supplementary information files) or deposited in publicly available databases. DOIs to access these datasets are provided in the key resource table. The figshare directory contains details on the antigen library (library_contents.csv), the cohort (cohort.csv), as well as antibody binding data of all individuals (fold_data.csv). Raw data for the PhIP-Seq experiments are deposited in the Harvard Dataverse public repository.
Custom code for analyses is also available via a DOI to a GitHub repository.
Any additional information required to reanalyze the data reported in this paper is available from the lead contact upon request.
Key resources table.
| REAGENT or RESOURCE | SOURCE | IDENTIFIER |
|---|---|---|
| Antibodies | ||
| HRP conjugated anti human IgG antibody | Southern Biotech | Cat#204205 |
| anti human IgE antibody | Southern Biotech | Cat#9250-05 |
| mouse anti-human IgG Fc-BIOT | Southern Biotech | Cat#9040-08 |
| goat anti-human IgA-BIOT | Southern Biotech | Cat# 2050-08 |
| Bacterial and virus strains | ||
| T7Select 10-3 cloning kit | Merck | Cat#70550-3 |
| Biological samples | ||
| 1,054 serum samples of 1,010 individuals | Korem et al., 2017; Zeevi et al., 2015 | n.a. |
| Chemicals, peptides, and recombinant proteins | ||
| IPEGAL CA 630 | Sigma-Aldrich | Cat#I3021 |
| Protein A magnetic beads | Thermo Fisher Scientific | Cat#10008D |
| Protein G magnetic beads | Thermo Fisher Scientific | Cat#10009D |
| 1-Step™ Turbo TMB-ELISA Substrate Solution | Rhenium | Cat#TS-34022 |
| Q5 polymerase | New England Biolabs | Cat#M0493L |
| Bovine Serum Albumin, heat shock fraction, pH 7, ≥98% | Sigma-Aldrich / Merck | Cat#A7906-100G |
| Pierce Streptavidin Magnetic Beads | ThermoFisher | Cat#88817 |
| Critical commercial assays | ||
| QIAquick gel extraction kit | Qiagen | Cat#28704 |
| QIAquick PCR purification kit | Qiagen | Cat#28104 |
| Deposited data | ||
| Raw and analyzed data | This paper |
https://doi.org/10.6084/m9.figshare.17098958
https://doi.org/10.7910/DVN/3SOZCQ |
| Code | This paper. | DOI: 10.5281/zenodo.7307894 |
| Experimental models: Cell lines | ||
| Experimental models: Organisms/strains | ||
| Oligonucleotides | ||
| library amplification primer fwd | GATGCGCCGTGGGAATTCT | n.a. |
| library amplification primer rev | GTCGGGTGGCAAGCTTTCA | n.a. |
| Recombinant DNA | ||
| Oligo pool (200 mers) | Twist Bioscience | n.a. |
| Software and algorithms | ||
| See data availability statement. | ||
| Other | ||
| Nunc™ Immobilizer™ Streptavidin Plates | Thermo Scientific™ | Cat#436014 |
| BioTides™ Peptides | JPT Peptide Technologies (Berlin, Germany) | n.a. |
| Freedom Evo liquid handling robot with | Tecan | n.a. |
| FrameStar® 96, fully skirted, white frame, 50 plates | Tamar | Cat#4ti-0960/W |
| MASTERBLOCK, 96w, PP, 2ml, Natural, 50/case | Danyel biotech | Cat#60-780270 |
| Corning Axygen® AM-2ML-SQ AxyMat™ | Biolab Ltd | Cat#AXY-AM-2ML-SQ |