Abstract
Background
Lactate, as an end product of glycolysis, plays an important role in cellular metabolism and signal transduction, and recent studies have shown that it is closely related to cellular differentiation, but its potential role in osteogenic differentiation has not yet been fully investigated.
Methods
We obtained two datasets containing human mesenchymal stem cells and human osteoblasts, GSE12266 and GSE18043, from the GEO database, which contained a total of 14 samples with sequencing data, and searched for lactate metabolism-related genes from the Genecards database. Ten differentially expressed core genes related to lactate metabolism were identified by differential expression analysis, protein interaction network analysis, and correlation expression analysis, and determined to play a key role in osteogenic differentiation. The effects of hub genes on the immune microenvironment of osteogenic differentiation were explored by enrichment analysis and immune infiltration analysis, and the significant effects of the key gene TYRO Protein Tyrosine Kinase-Binding Protein(TYROBP) on the characterization of bone marrow mesenchymal stem cells (BMSCs) were experimentally verified, and it was determined by drug sensitivity analysis that TYROBP may be a regulatory target of certain drugs affecting osteogenic differentiation.
Result
We successfully screened 10 differentially expressed hub genes related to lactate metabolism, and their area under the curve AUC values for predicting osteogenic differentiation were all highly favorable. Enrichment analysis showed that lactate metabolism may affect osteoblast differentiation through immune infiltration, and the immune infiltration results confirmed the strong association between hub genes and osteoblast immune infiltration status. It was verified that decreasing TYROBP expression promoted cell viability, proliferation and migration ability of BMSCs. Drug sensitivity analysis showed that TYROBP may be a major regulator of drug-induced MSC differentiation.
Conclusion
Our study reveals the critical role of lactate metabolism in osteoblast differentiation, identifies the role of the key gene TYROBP in the regulation of BMSCs, and provides new insights for studies related to the regulation of osteoblast differentiation.
Keywords: Lactate metabolism, Osteogenic differentiation, Immune infiltration, Human mesenchymal stem cells
Introduction
Osteogenic differentiation is a key step in the process of osteogenesis and plays an important role in bone tissue regeneration and repair [1, 2]. Osteogenic differentiation is mainly regulated by fibroblast growth factors (FGFs), bone morphogenetic proteins (BMPs), and Wnt/β-catenin signaling pathways, which work together to induce the maturation of osteogenic precursor cells by promoting the expression of transcription factors such as RUNX2 and Osterix [3–7]. In addition, biochemical factors in the microenvironment, such as calcium ion concentration, oxygen concentration and lactate concentration, also have a significant effect on osteogenic differentiation [8–12]. Although existing studies have revealed many key mechanisms, a large number of unanswered questions remain. How to optimize the regulatory mechanisms of bone tissue regeneration in the clinical setting still requires further research, especially for application in pathological conditions such as osteoporosis [13–15]. Traditionally, lactate has been regarded as a metabolic waste product, which is mainly produced from pyruvate through lactate dehydrogenase (LDH) catalysis [16, 17]. Lactate is able to enter and leave cells via monocarboxylic acid transporter proteins (MCTs), maintain intra- and extracellular pH balance, and be converted to glucose in the liver or reused as an energy source by other tissues via the Coris cycle [18, 19]. In recent years, global studies have revealed that lactate is not only a metabolic by-product, but also an important signaling molecule, which is widely involved in a variety of cellular physiological processes, including the regulation of cellular metabolism, the maintenance of redox homeostasis, and the influence of immune response and cell differentiation [20–22]. More and more studies have been conducted to demonstrate that lactate metabolism plays a key role in stem cell differentiation and tumor microenvironment [23–25]. Mathias et al. [25] found that mitochondrial pyruvate uptake directs metabolic flexibility to guide T cell differentiation and anti-tumor responses; Li et al. [26] found that restriction of glycolysis contributes to the generation of secretory profiles from ISCs of intestinal stem cells, and that dysregulation of glycolysis subsequently disrupted the balance between self-renewal and differentiation of ISC; Dong et al. [27] demonstrated that proteolysis, regulated by intracellular lactate, contributes to self-renewal of ESCs from embryonic stem cells, and revealed the potential mechanism of proteolysis in the differentiation of extraembryonic endoderm stem cells. In addition, recently, lactate metabolism has been continuously found to affect the osteogenic differentiation of human mesenchymal stem cells (hMSCs). For example, the study of Nuno et al. [28] demonstrated that hMSCs osteogenesis is dependent on glutamine catabolism and lactate metabolism, but the existing studies have not elucidated the targets and mechanisms by which lactate metabolism affects osteogenic differentiation, and this area is still highly explorable. Therefore, our study aimed to explore the potential targets of lactate metabolism affecting osteogenic differentiation. We identified 10 hub genes that may be important targets for lactate metabolism to regulate osteogenic differentiation and experimentally verified the effects of TYROBP on bone marrow mesenchymal stem cells (BMSCs) properties. In addition, we discuss the correlation between key genes, immune microenvironment, and drug sensitivity.
Materials and methods
Data collection
We obtained two datasets, GSE12266 and GSE18043, from the GEO database (https://www.ncbi.nlm.nih.gov/geo/), containing a total of seven human BMSCs samples and seven human osteoblasts samples, and the samples contained genome-wide expression matrices. All samples’ names, sample types, and corresponding datasets are shown in Table 1. We obtained 5802 lactate metabolism-related genes (genes with a set relevance score > 1 and encoding proteins) from the Genecards website (https://www.genecards.org/).
Table 1.
Generalization of BMSCs and osteoblast samples
Screening for differentially expressed genes related to lactate metabolism
We used the R package “limma” to de-batch the GSE12266 and GSE18043 datasets, and then performed differential expression analysis (|log2foldchange| > 1, p-value < 0.05) on BMSCs and osteoblast samples to obtain differentially expressed genes (DEGs). And the intersection of DEGs and LRGs was taken to obtain differentially expressed lactate metabolism related genes (DELRs).
Biological pathway enrichment analysis
The obtained DELRs were subjected to Gene Ontology (GO), Kyoto Encyclopedia of Genomes (KEGG) enrichment analysis and Gene Set Enrichment Analysis (GSEA) using the R package “clusterProfiler” (screening criteria: adjusted P-value less than 0.05) to investigate the possible involvement of biological pathways.
Screening of hub genes
We performed protein-protein interaction (PPI) network analysis of DELRs using the STRING database and visualized the results using Cytoscape software (version 3.9.1) (setting a minimum interaction score of 0.5). Betweenness, Closeness, Degree, Maximum Clique Centrality (MCC), and Maximum Neighborhood Component (MNC) scores were used to sort the top 50% and take the intersection as the criteria for screening hub genes. Table 2 demonstrates the definitions and biological significance of the different screening metrics.
Table 2.
Network centrality metrics for hub gene identification: definitions and biological significance
| Screening Metric | Definition | Biological Significance |
|---|---|---|
| Betweenness | The frequency at which a node acts as an intermediary in the shortest path between other nodes | Genes with high Betweenness Centrality often bridge distinct functional modules, coordinating global signaling pathways |
| Closeness | The reciprocal of the average shortest path length from a node to all other nodes | Genes with high Closeness Centrality are typically centrally positioned in the network, enabling rapid response to environmental stimuli |
| Degree | The number of direct connections (edges) a node has within the network | High-Degree genes are frequently core members of functional modules |
| MCC | The difference between the size of the largest connected component containing the node and the connectivity of its neighbors | High-MCC genes reside in tightly interconnected subnetworks, stabilizing modular functional units |
| MNC | The size of the largest connected subgraph within a node’s neighborhood, reflecting local network density | High-MNC genes often serve as core components of localized functional clusters (e.g., protein complexes or signaling pathway branches) |
Immune microenvironment analysis
To explore the association of osteogenic differentiation and hub genes with the immune microenvironment, we analyzed the immune infiltration of BMSCs and osteoblasts using the R packages “GSVA” and “xCell”, respectively, and explored the differences between the two results. The GSVA method is used to study the global regulatory patterns of immune function and to assess changes in the overall activity of the immune-related gene set in a sample. xCell method’s reference data integrates gene expression profiles from normal and tumor tissues, and its algorithm is more tolerant of heterogeneity in non-tumor samples, and thus serves as a complement to the GSVA method. We analyzed the correlation between hub genes and immune scores using the R package “limma”, and assessed the impact of osteogenic differentiation on the BMSCs immune microenvironment.
Exploring the effect of hub genes on osteogenic differentiation
The R package “ROCR” was used to calculate the AUC values of hub genes for predicting osteogenic differentiation, and the R package “ggpubr” was used to plot the box plots of the effects of hub gene expression levels on immunity scores. The R package “ggplot2” was used to plot the correlation between TYROBP and different immunization scores, and the correlation between TYROBP and other hub gene expression levels.
Drug sensitivity analysis
The Connectivity Map (CMap, https://clue.io/) is a database of gene expression profiles based on cellular responses to perturbations or interventions [29], which can be used to screen for potential interventional compounds associated with genes and diseases. To explore the association between hub genes and drug sensitivity, we used the R package “limma” to identify DEGs between different hub gene expression subgroups, and screened the 10 genes with the largest positive and negative logFC values (p < 0.05), respectively, and submitted them to the CMap database. In the obtained result files, the potential interventional drugs of hub genes were screened according to the absolute Score values. The 2D and 3D structures of the drugs were also accessed at the pubchem database (https://pubchem.ncbi.nlm.nih.gov/).
Cell culture and gene transfection
Human BMSCs were obtained from Cyagen Biosciences. BMSCs were cultured in Human Bone Marrow Mesenchymal Stem Cell Complete Medium (Cyagen Biosciences, HUXMA-90011) supplemented with 1% penicillin-streptomycin at 37 °C in 5% CO₂. The TYROBP knockdown group was recorded as siRNA, and the negative control group was recorded as siRNA nc (transfection reagent alone), both synthesized by Baiqiandu Biotechnology Co. The untreated control group was recorded as Control. siRNA constructs were transfected into BMSCs with Lipofectamin 2000 (Invitrogen, USA). Mitomycin C was added to TYROBP-knockdown BMSCs to inhibit cell proliferation, and it was recorded as siRNA + MMC group. Table 3 lists the alternative four siRNA sequences, and the siTYROBP#4 sequence with the highest knockdown efficiency was selected to knock down TYROBP.
Table 3.
The sequences of SiRNAs
| SiRNA Targets | Sequences |
|---|---|
| siTYROBP#1 sense | 5′- CCCGUACAGGCCCAGAGUGTT − 3′ |
| siTYROBP#2 sense | 5′- GAAGGGACCCGGAAACAACTT − 3′ |
| siTYROBP#3 sense | 5′- ACAGAGGCAAUAUUACAGATT − 3′ |
| siTYROBP#4 sense | 5′- CUGGGUGACUUGGUGUUGATT − 3′ |
Quantitative Real-time PCR (qRT-PCR) detection
Total RNA was extracted from the cells using the High Pure RNA Isolation Kit (Invitrogen, California, USA) and an equal amount of RNA was reverse transcribed to cDNA using the PrimeScript RT kit (TaKaRa, PR037A, Japan). qRT-PCR analysis was performed subsequently. The primer sets used are shown in Table 4.
Table 4.
The primer sequences for qRT-PCR
| Gene | Primer Sequence (5′-3′) |
|---|---|
| actin-F | ACTGCCGCATCCTCTTCCT |
| actin-R | TCAACGTCACACTTCATGATGGA |
| TYROBP-F | CTGGCTGGGATTGTTCTGGG |
| TYROBP-R | TAAGGCGACTCAGTCTCAGC |
Western blot
We isolated chondrocyte proteins by lysis using RIPA (Boster) and then determined their concentration using the BCA Assay Kit (Boster). Proteins were separated by 8% SDS-PAGE and transferred to PVDF membranes, which were closed with 5% skimmed milk for 1 h and incubated with primary antibodies. The membranes were incubated overnight at 4 °C and immunoblotted with the appropriate secondary antibody the next day. We performed optical density analysis of each Western blot from 3 separate experiments using Image J software. Expression of each protein was normalized and presented as the ratio of the intensity of the signal for the protein to that of the loading control.
Cell counting Kit-8 (CCK-8) assay
The cell viability of BMSCs was evaluated using the CCK-8 (Beyotime, China) according to the manufacturer’s instructions. BMSCs were seeded into 96-well plates at a density of 2 × 10^4 cells/mL (100 µL/well) in different experimental groups, with three technical replicates per group. After 24 and 48 h of incubation, 10 µL of CCK-8 working solution was added to each well. To prevent evaporation, sterile PBS was added around the peripheral wells. The plates were then incubated for 2.5 h at 37 °C in the dark. The absorbance was measured at 450 nm using a microplate reader (BioTek Instruments, USA). Wells containing medium and CCK-8 without cells served as blank controls. All experiments were performed in triplicate and data were expressed as mean ± SD.
5-Ethynyl-2’-deoxyuridine (EdU) assay
Inoculate an equal volume of the prepared cell suspension into a 6-well plate and incubate in an incubator (37℃, 5% CO2) for 24 h. The cells were covered with fixative and fixed for 15 min at room temperature, then washed 2–3 times with PBS buffer. EdU reaction liquid and DAPI were added according to the instructions for the staining of cell nuclei, respectively, and the cells were washed with PBS buffer and then observed under a fluorescence microscope.
Transwell assay
We inoculated transfected BMSCs in 6-well plates and placed them in a 37 °C, 5% CO₂ incubator. Subsequently, we prepared cell suspensions using serum-free medium and inoculated them uniformly into Transwell chambers pre-laid with matrix gel. Next, we added 500 µL of complete medium containing 10% fetal bovine serum (FBS) to the lower chamber and subsequently placed the cell-loaded chambers vertically into the lower chamber using sterile forceps. After incubation under standard culture conditions (37 °C, 5% CO₂) for 24 h, we gently rinsed the migrated cells by PBS, stained them using 0.1% crystal violet solution for 15 min, and finally observed them under a microscope for observation and image acquisition. After completing transfection in the siRNA + MMC group, we added 10 µg/mL mitomycin C to the culture medium before cell suspension preparation and pretreated the cells at 37 °C for 2 h to inhibit cell proliferation. Subsequently, we washed the cells gently by PBS for 3 times and centrifuged (1000 rpm, 5 min) to remove the drug residues thoroughly, and replaced with fresh serum-free medium for cell suspension preparation before subsequent Transwell experiments. The rest of the experimental steps were consistent with the other groups.
Wound-healing assay
We inoculated transfected BMSCs at a density of 4 × 10^5 per well in 6-well culture plates and placed them in a 37 °C, 5% CO₂ incubator for 24 h until cell monolayer fusion reached 90%. Before scratching we pretreated the siRNA + MMC group by adding complete medium containing 10 µg/mL mitomycin C for 2 h, followed by gentle rinsing with prewarmed PBS (5 mL/dose) for 3 times to completely remove drug residues. Subsequently, we used a 200 µl sterile pipette gun tip to make standardized horizontal line scratches vertically on the cell surface of the monolayer. To remove detached cells, we gently rinsed the culture wells 3 times with PBS pre-warmed to 37 °C, and finally changed to serum-free medium. We measured the change in scratch width under the microscope at 0, 12, and 24 h after scratching and took photographs, respectively.
Flow cytometry
We inoculated different groups of BMSCs in 6-well plates after 7 days of transfection treatment. We added LPS (1 µg/mL) for 24 h of stimulation to induce inflammatory factor secretion. Brefeldin A (1 µg/mL) was added for the last 4 h of LPS stimulation to block cytokine secretion into the extracellular compartment. We then collected cells, fixed them in 4% paraformaldehyde for 15 min at room temperature, and ruptured the membranes with 0.1% Triton X-100 for 10 min. We then incubated the cells with APC anti-human IL-10 Antibody (501409, Biolegend, USA) and FITC anti-human TNF-α Antibody (376207, Biolegend, USA) for 30 min at 4 °C, protected from light.The cells were washed twice with PBS, and resuspended in 200 µL PBS, then analyzed using flow cytometry.
Cell stainingWe stained different groups of BMSCs when they were cultured in Mesenchymal Stem Cell Oseogenic Differentiation Medium for 7 and 14 days.
For ALP staining: we washed the BSMCs with PBS for 3 times, fixed them using 4% paraformaldehyde for 20 min at room temperature, and subsequently washed them well with distilled water.The ALP staining procedure was as follows: add ALP incubation solution and incubate for 6 h at 37 °C protected from light; after incubation, rinse them with distilled water for 2 min, and uniformly cover the samples with the co solution for a 5-minute reaction at 37 °C. Subsequently, we added sulfide working solution dropwise to cover the samples and incubated them at 37 °C away from light until a black precipitate was generated, and rinsed them with distilled water for 3 times (3 min each). The stained samples were dried at room temperature, then sequentially subjected to xylene transparency for 5 min, and sealed with neutral gum.ALP-positive areas (gray-black granules/clumps of precipitates) were observed by light microscope and images were captured. Three independent replicates were set up for each group of the experiment.
For VonKossa staining: we washed the BSMCs three times with PBS, fixed them with 4% paraformaldehyde for 20 min at room temperature, and subsequently washed them well with distilled water.The steps of Vonkossa staining were as follows: silver nitrate solution was added dropwise to the slides, and the slides were illuminated with UV light for 2 h and then rinsed three times with distilled water, incubated with Hematoxylin staining solution for 3–5 min, and rinsed three times with distilled water. Subsequently, we used differentiation solution to differentiate for 5 s. Then we added reblue solution to reblue for 5 s. 85% alcohol was immersed for 5 min, and then 95% alcohol was added for 5 min to dehydrate. We added eosin staining solution to incubate for 5 min, discarded the staining solution, and added anhydrous ethanol to soak for 15 min and repeated three times, respectively.The samples were dried at room temperature, and then sequentially subjected to xylene hyaluronanization for 5 min, and neutral gum sealing. The areas of calcium salt deposition were black or brownish black, the nuclei were blue, and the background was red. The images were observed and captured by light microscope. Three independent replicates were set up for each group of the experiment.
Statistical analysis
Statistical analysis of this study was performed using R software (version 4.4.2). Cell experiments were performed in three independent biological replicates (n = 3). Expression profiling microarray data of samples were obtained from the GEO database https://www.ncbi.nlm.nih.gov/geo/). Differences between subgroups were analyzed using a two-tailed t-test, with P < 0.05 indicating a statistically significant difference.
Results
Screening of DELRs
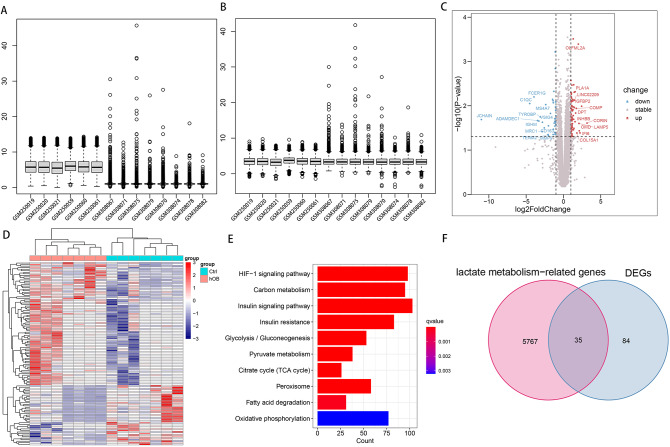
Figure 1A, B shows the visualized box line plots before and after de-batch effect for the two datasets GSE12266 and GSE18043, respectively. Figure 1C shows volcano plots of DEGs for BMSCs and osteoblasts with gene names labeled for the 24 genes with the largest absolute value of log2FoldChange, respectively. Figure 1D shows the expression heat map of DEGs. Figure 1E shows that 5802 LRGs were significantly enriched in a large number of lactate metabolism-related pathways such as HIF-1 signaling pathway, Carbon metabolism, Insulin signaling pathway, Insulin resistance, Glycolysis / Gluconeogenesis, Pyruvate metabolism, Citrate cycle (TCA cycle), Peroxisome, Fatty acid degradation, Oxidative phosphorylation. Figure 1F shows the Venn diagram of the intersection of LRGs and DEGs.
Fig. 1.
Acquisition of DELRs. Visualized box line plots of two datasets, GSE12266 and GSE18043, before (A) and after (B) de-batch effect. (C) Volcano plots of DEGs from BMSCs and osteoblasts. (D) Heatmap of DEGs expression in BMSCs and osteoblasts. (E) 5802 LRGs were significantly enriched in a large number of lactate metabolism-related pathways such as HIF-1 signaling pathway, Carbon metabolism, Insulin signaling pathway, Insulin resistance, Glycolysis / Gluconeogenesis, Pyruvate metabolism, Citrate cycle (TCA cycle), Peroxisome, Fatty acid degradation, Oxidative phosphorylation. (F) Venn diagram of the intersection of DEGs with LRGs
Functional resolution and mechanism exploration of DELRs
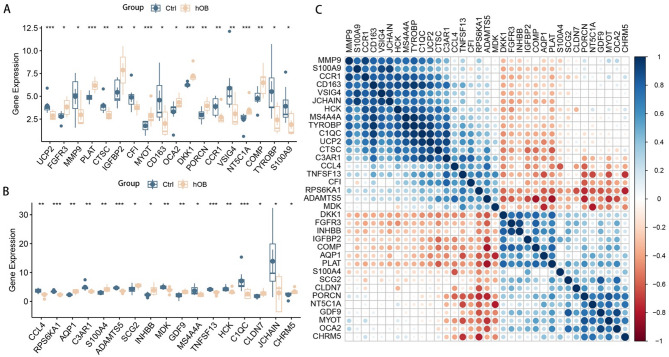
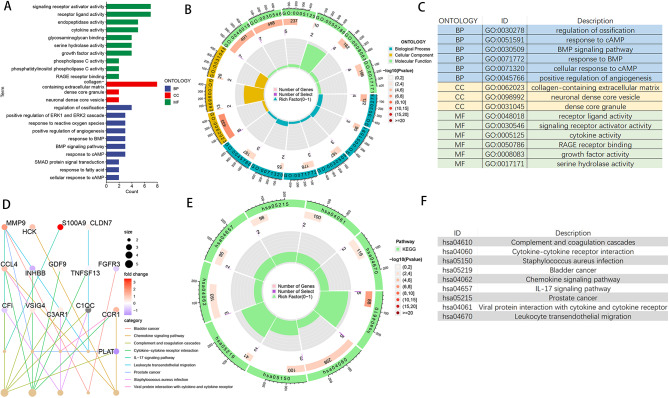
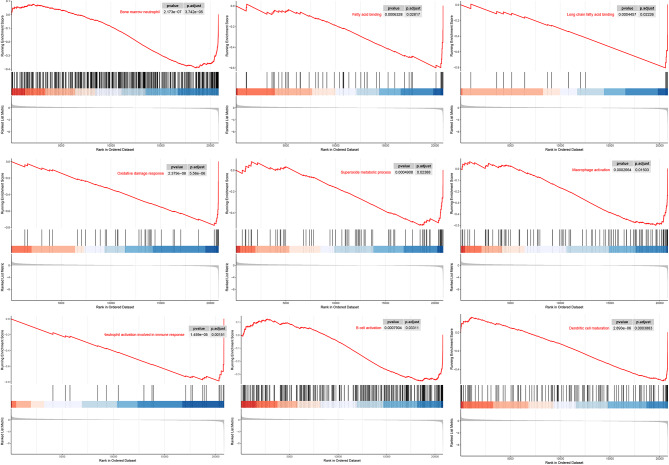
Differential expression box line plots drawn for the 35 DELRs are shown in Fig. 2A, B. All 35 DELRs were significantly differentially expressed in BMSCs and osteoblasts. Correlation expression heatmaps (Fig. 2C) were drawn for the DELRs to explore the expression patterns and correlations among them, and strong positive or negative correlations were found for most genes. We performed GO, KEGG, and GSEA enrichment analysis on 35 DELRs to explore the potential mechanisms or pathways by which these genes affect osteogenic differentiation. Figure 3A-C shows the results of GO enrichment analysis, DELRs were significantly enriched in Regulation of ossification, response to cAMP, BMP signaling pathway, response to BMP, positive regulation of angiogenesis, phospholipase C activity, response to fatty acid, response to reactive oxygen species, glycosaminoglycan binding, RAGE receptor binding, and a large number of other pathways related to lactate metabolism, osteogenic differentiation, and immunity. Figure 3D-F shows the results of KEGG enrichment analysis, DELRs were significantly enriched in immune-related pathways, including Chemokine signaling pathway, complement and coagulation cascades, Cytokine-cytokine receptor interaction, IL- 17 signaling pathway and so on. Figure 4 shows the results of GSEA enrichment analysis, DELRs were significantly enriched in immune infiltration-related pathways, including fatty acid binding, oxidative damage response, superoxide process, macrophage activation, neutrophil activation involved in immune response, B cell activation, Dendritic cell maturation and so on.
Fig. 2.
Expression patterns of DELRs. (A, B) Box line plots of differential expression of 35 DELRs. (C) Correlation heatmap of the expression levels of the 35 DELRs
Fig. 3.
GO and KEGG enrichment analysis of DELRs. (A) Categorical histogram of GO enrichment analysis results. (B) Circle plots of GO enrichment analysis results. (C) Pathway annotation of GO enrichment analysis circle diagram. (D) Radiogram of KEGG enrichment analysis results. (E) Circle diagram of KEGG enrichment analysis results. (F) Pathway annotation of KEGG enrichment analysis circle graph
Fig. 4.
GSEA enrichment analysis of DELRs showed that DELRs were significantly enriched in lactate metabolism and immune infiltration related pathways including fatty acid binding, oxidative damage response, superoxide process, macrophage activation, neutrophil activation involved in immune response, B cell activation, Dendritic cell maturation and so on
Screening of hub genes
We mapped the PPI network to explore the hub genes of DELRs. The results showed that TYROBP, MMP9, CD163, and CCR1 were the top 4 sorted by Closeness score (Fig. 5A). Figure 5B shows the top 50% of DELRs sorted by MCC, with TYROBP having the highest score. Figure 5C shows the histogram sorting of Degree values of 35 DELRs, with the top three being TYROBP, CD163, and MMP9. we took the intersection of genes sorted in the top 50% of Betweenness, Closeness, Degree, MCC, and MNC scores, and obtained a total of six hub genes, which were CCL4, VSIG4, C3AR1, CCR1, TYROBP, CD163.
Fig. 5.
Screening for hub genes. (A) 35 DELRs were mapped for PPI network by Closeness value. (B) Network map of the top 8 DELRs based on MCC values, with TYROBP scoring the highest. (C) Histogram of the 35 DELRs sorted according to their Degree values, with the top three being MMP9, CD163, and TYROBP. (D) DELRs ranked in the top 50% in terms of Betweenness, Closeness, Degree, MCC, and MNC scores were taken for intersection, yielding 6 hub genes, which were CCL4, VSIG4, C3AR1, CCR1, TYROBP, CD163
Exploration of the effect of hub genes on immune infiltration
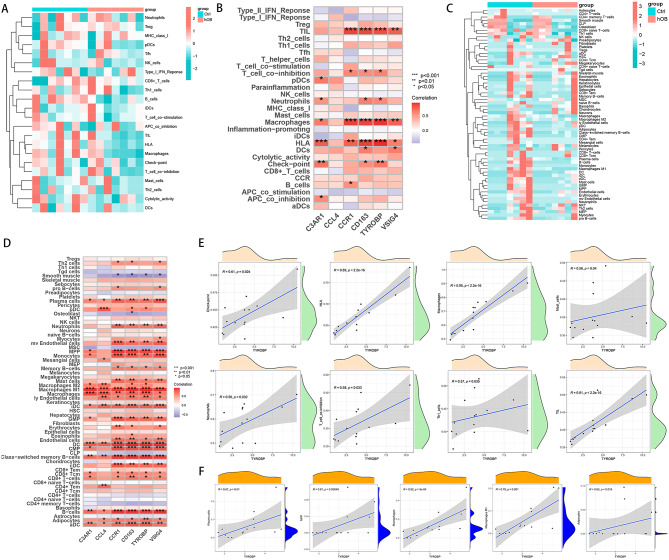
In order to explore the effect of DELRs on the immune microenvironment of BMSCs and osteoblasts, we analyzed the immune infiltration of 14 samples using the R software packages “GSVA” and “xCell”, respectively. Figures 6A and C show the heatmaps of immune infiltration by GSVA and xCell methods, respectively, and the results showed that the immune infiltration was worse in the osteoblast group samples. We used the R software package “ggplot2” to plot the correlation heat map between hub genes and immune scores. Figure 6B shows that in the GSVA method, hub genes were significantly and positively correlated with the immune scores of TIL, T cell co-inhibition, Neutrophils, Macrophages, HLA, Check-poingt, and B cells. Figure 6D shows that in the xCell method, hub genes were significantly associated with a large number of immune cells such as Plasma cells, Neutrophils, Macrophages, Macrophages M1, iDC, GMP, Memory cells, DC, Class-switched memory B cells, B cells, aDC, and Adipocytes. We correlated TYROBP, which has the highest MCC score, with a variety of GSVA immunity scores, and the results showed that TYROBP was significantly and positively correlated with Check-point, HLA, Macrophages, Mast cells, Neutrophils, T cell co-inhibition, Th1 cells, and TIL (Fig. 6E). Figure 6F shows that TYROBP was significantly positively correlated with xCell immune scores such as Plasma cells, MPP, Macrophages, Macrophages M1, and Adipocytes. Both immune infiltration analysis methods showed that TYROBP was significantly positively correlated with Macrophages and Neutrophils. xCell further indicated that TYROBP was significantly positively correlated with M1-type Macrophages (pro-inflammatory macrophages). TYROBP was lowly expressed in osteoblasts, and heat maps obtained by both immune infiltration analysis methods showed that poorer immune infiltration in the osteoblast group. It is suggested that TYROBP is likely to promote immune infiltration of BMSCs and osteoblasts.
Fig. 6.
Association of hub genes with the immune microenvironment. Heatmap of immune infiltration analysis of BMSCs and osteoblast samples using GSVA (A) and xCell (C) methods. Correlation heatmap of hub genes with immune scores obtained by GSVA (B) and xCell (D) methods. (E) TYROBP was significantly positively correlated with Check-point, HLA, Macrophages, Mast cells, Neutrophils, T cell co-inhibition, Th1 cells, and TIL in the GSVA immune infiltration analysis. (F) TYROBP was significantly positively correlated with Plasma cells, MPP, Macrophages, Macrophages M1, and Adipocytes in xCell immune infiltration analysis
Exploring the mechanism of the effect of the hub genes TYROBP and CD163 on osteogenic differentiation
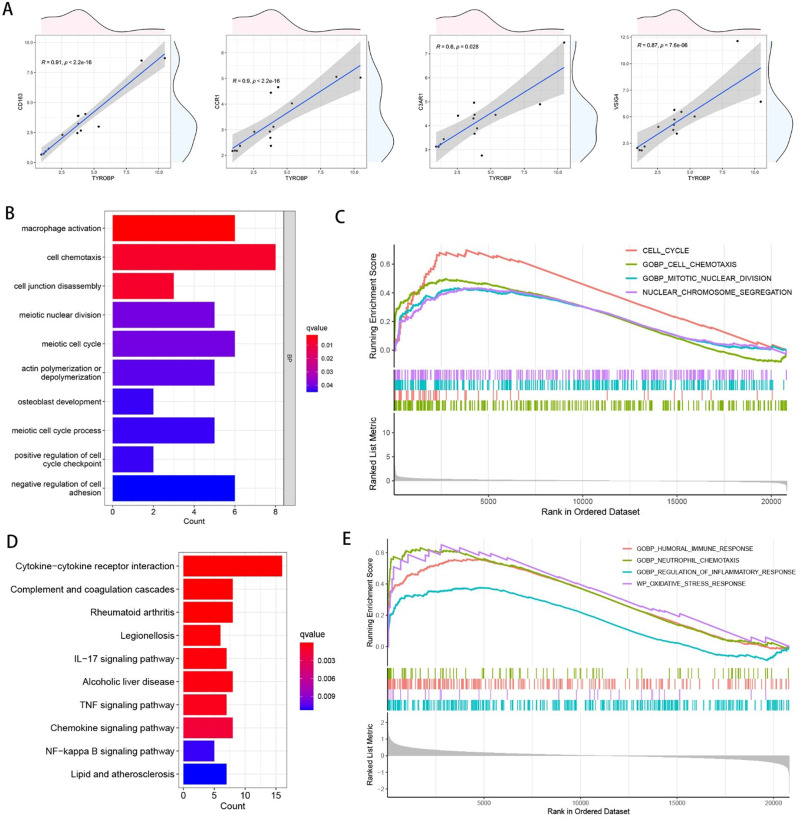
In order to explore the effects of the hub genes TYROBP and CD163 with the highest MCC, Closeness, and Degree values on osteogenic differentiation, we used the R package “ROCR” to calculate the AUC values of TYROBP and CD163 for predicting osteogenic differentiation as 0.755 and 0.694, respectively. We plotted the scatter plots of the correlation between TYROBP and other hub genes, and the results are shown in Fig. 7A, which shows that TYROBP is significantly positively correlated with VSIG4, C3AR1, CCR1, and CD163. In order to deeply explore the potential mechanisms by which TYROBP and CD163 affect osteogenic differentiation, we performed differential expression analysis (log2FoldChange was set to 2, and p-value was set to 0.05) of different TYROBP and CD163 expression subgroups, respectively, and subjected the differentially expressed genes to GO and KEGG enrichment analysis. The results, as shown in Fig. 7B, showed that the DEGs of TYROBP were significantly enriched in pathways related to cell cycle, osteogenic differentiation, and immune infiltration, such as cell chemotaxis, cell junction disassembly, meiotic nuclear division, meiotic cell cycle, positive regulation of cell cycle checkpoint, macrophage activation, osteoblast development, negative regulation of cell adhesion. Differentially expressed genes were then subjected to GSEA enrichment analysis. As shown in Fig. 7C, the DEGs of TYROBP were significantly enriched in cell cycle-related pathways, such as cell cycle and nuclear chromosome segregation, which suggests that TYROBP may affect the osteogenic differentiation of BMSCsby influencing cell cycle and immune infiltration. Figure 7D shows that the DEGs of CD163 are significantly enriched in the Cytokine-cytokine receptor interaction, Complement and coagulation cascades, Rheumatoid arthritis, Legionellosis, IL- 17 signaling pathway, Alcoholic liver disease, TNF signaling pathway, Chemokine signaling pathway, NF-kappa B signaling pathway, Lipid and atherosclerosis. Figure 7E shows the results of GSEA enrichment analysis of CD163, we got GOBP_CELL_CHEMOTAXIS, CELL_CYCLE, GOBP_MITOTIC_NUCLEAR_DIVISION, NUCLEAR_CHROMOSOME_SEGREGATION, which suggests that CD163 may influence osteogenic differentiation by regulating cell cycle-related pathways.
Fig. 7.
Exploration of the mechanism by which TYROBP affects osteogenic differentiation. (A) Scatter plot of the correlation between TYROBP and other hub genes. TYROBP was divided into different expression subgroups for differential expression analysis, and the DEGs obtained were subjected to GO enrichment analysis (B) and GSEA enrichment analysis (C). CD163 was divided into different expression subgroups for differential expression analysis, and the DEGs obtained were subjected to GO enrichment analysis (D) and GSEA enrichment analysis (E)
Drug sensitivity analysis
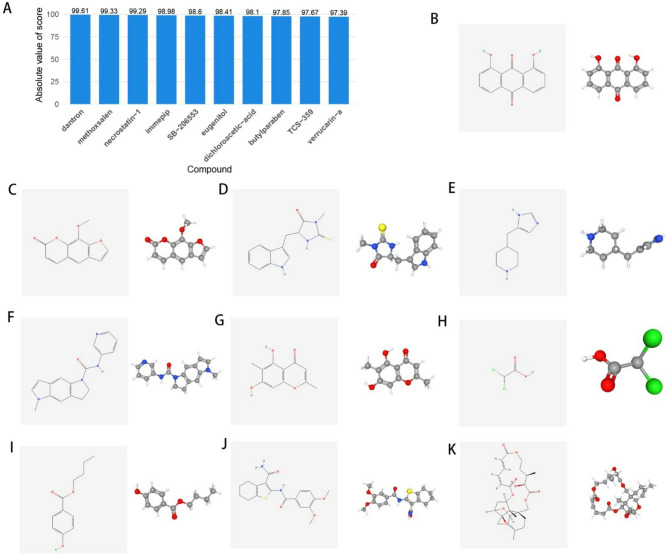
To further explore potential small molecule compounds that may intervene in TYROBP gene expression patterns and influence osteogenic differentiation, we imported DEGs from different TYROBP expression subgroups into the CMap database. The 10 compounds with the highest absolute Score values were obtained including dantron, ethoxsalen, necrostatin-1, immepip, SB-206,553, eugenitol, dichloroacetic-acid, butylparaben, TCS-359, and verrucarin-a. These 10 compounds are considered as potential drugs to intervene in TYROBP. Figure 8A illustrates the histogram of the 10 drugs after sorting them according to the absolute Score values. The 2D and 3D structures of these 10 drugs are shown in Fig. 8B-K (available from the PubChem database).
Fig. 8.
Correlation analysis between TYROBP expression levels and drug sensitivity. (A) Histogram of 10 drugs sorted by absolute Score values. (B-K) 2D and 3D molecular structures of dantron, ethoxsalen, necrostatin-1, immepip, SB-206,553, eugenitol, dichloroacetic-acid, butylparaben, TCS-359, and verrucarin-a
TYROBP inhibits the proliferation and migration ability of BMSCs
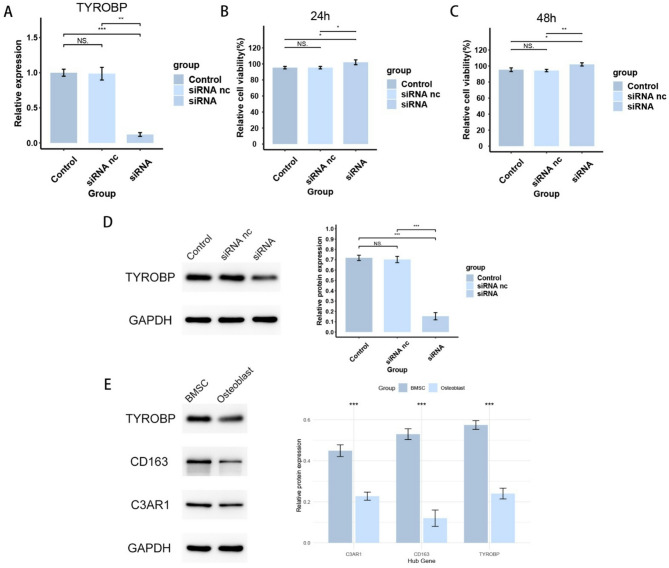
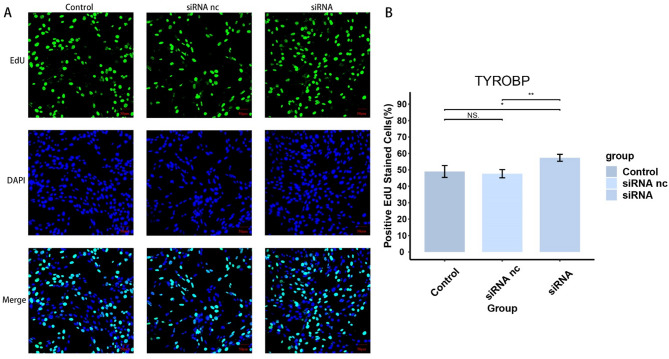
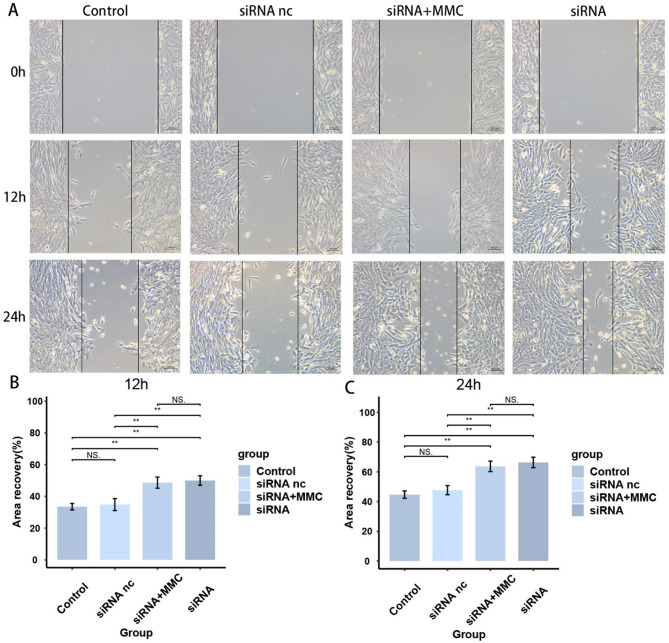
To verify the effect of TYROBP expression level on BMSCs, we knocked down TYROBP and transfected BMSCs cells for subsequent experiments. As the results are shown in Fig. 9A, the siRNA group successfully knocked down TYROBP. siRNA nc group was transfected with empty plasmid, and there was no significant difference in TYROBP levels between siRNA and Control groups. Figure 9B-C shows a significant increase in cell viability in the siRNA group after 24 and 48 h of cell processing, respectively, indicating that the TYROBP expression level had a significant effect on the cell viability of BMSCs. Figure 10 shows a significant increase in the proliferative capacity of BMSCs after TYROBP knockdown. Figures 11 and 12 showed that the migration ability of BMSCs in the siRNA group was significantly higher than that in the Control and siRNA nc groups. While the siRNA + MMC group inhibited cell proliferation, the migration ability of BMSCs was still higher than that of Control and siRNA nc groups, indicating that the knockdown of TYROBP could still enhance the migration ability of BMSCs after excluding the effect of cell proliferation. The above results indicated that TYBOBP had a significant effect on the proliferation and migration ability of BMSCs.
Fig. 9.
qRT-PCR and western blot results of BMSCs. (A) qRT-PCR confirmed that the expression level of TYROBP was successfully knocked down in BMSCs. (B, C) Cell viability of BMSCs at 24 h and 48 h. (D) Western blot confirmed that the expression level of TYROBP was successfully knocked down in BMSCs. (E) Western blot confirmed that the expression levels of hub genes CD163, C3AR1, and TYROBP were lower in osteoblasts than in BMSCs
Fig. 10.
Regulation of BMSCs proliferation by TYROBP expression level
Fig. 11.
TYROBP knockdown significantly increased the invasive capacity of BMSCs
Fig. 12.
TYROBP knockdown significantly increased migration of BMSCs
TYROBP promotes secretion of inflammatory factors and inhibits osteogenic differentiation of BMSCs
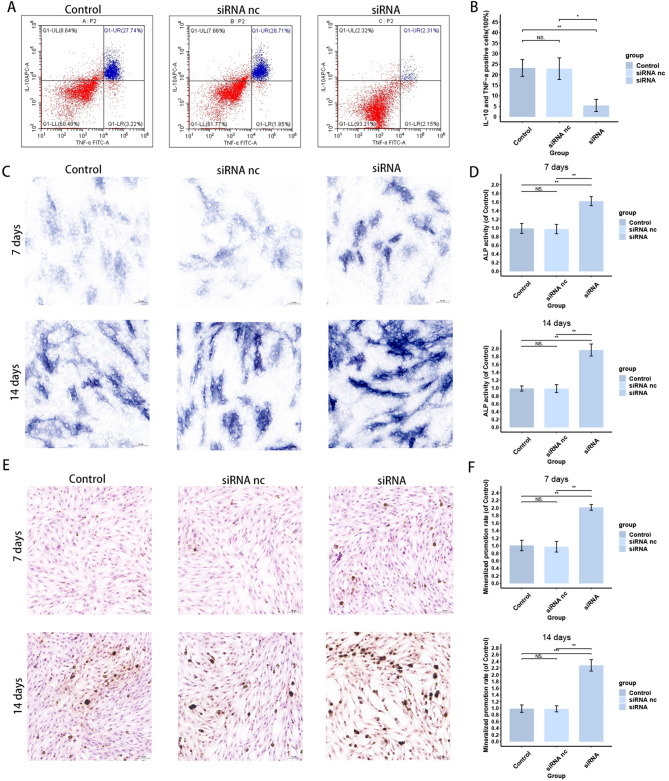
To further verify the effect of TYROBP on the immune microenvironment of BMSCs, we detected the inflammatory factor secretion of BMSCs in different groups. The results are shown in Fig. 13A, B the proportion of IL-10 and TNF-α positive cells in the siRNA group was significantly lower than that of other two groups, suggesting that the knockdown of TYROBP decreased the secretion of inflammatory factors by BMSCs, that is, the level of inflammatory factor secretion was positively correlated with TYROBP. In addition, to verify the effect of TYROBP on osteogenic differentiation of BMSCs, we performed ALP and Vonkossa staining on BMSCs cultured at 7 and 14 days to detect the osteogenic differentiation ability. the results of ALP staining are shown in Fig. 13C, D the alkaline phosphatase level of the siRNA group was higher than that of the other two groups at both 7 and 14 days. The results of Vonkossa staining are shown in Fig. 13E, F and the BMSCs in the siRNA group also showed a stronger osteogenic differentiation ability at both the 7- and 14-day time points. Both staining results indicated that knockdown of TYROBP promoted osteogenic differentiation of BMSCs. The above results suggest that TYROBP has a significant effect on both the immune status and osteogenic differentiation ability of BMSCs.
Fig. 13.
TYROBP regulates inflammatory factor expression and osteogenesis of BMSCs. (A, B) Effect of TYROBP knockdown on the proportion of IL-10 and TNF-α positive cells. (C, D) Effect of TYROBP knockdown on ALP staining results of BMSCs. (E, F) Effect of TYROBP knockdown on Vonkossa staining results of BMSCs
Discussion
With the aging of the global population and the increasing incidence of bone-related diseases such as osteoporosis and fractures, how to effectively promote bone tissue regeneration has become one of the focuses in the field of bone science research [30–32]. hMSCs not only have the ability to differentiate into osteoblasts at the site of bone injury, but also secrete a variety of growth factors, which can promote the generation of bone matrix and help accelerate the process of bone repair [33]. The process of osteogenic differentiation is regulated by several signaling pathways and molecular mechanisms, and it is known that the key regulators include BMPs, Wnt/β-catenin signaling pathway, and so on, but so far, the regulatory mechanism of osteogenic differentiation has not been fully elucidated [3, 5, 34, 35]. Therefore, an in-depth study of the molecular mechanisms of osteogenic differentiation in hMSCs could help develop new therapeutic strategies to better cope with complex bone injury situations. Lactate is the end product of the glycolysis process and has traditionally been considered a waste product of metabolism under hypoxic conditions. However, recent studies have shown that lactate is not only a by-product of energy metabolism, but also plays a regulatory role within the cell through multiple pathways [17]. Lactate can enter or leave cells via MCTs, regulate extracellular pH, and act as a signaling molecule to influence gene expression, cellular metabolism, and epigenetic regulation [36–38]. Especially under hypoxic or metabolic stress conditions, elevated lactate levels are thought to be able to influence the differentiation fate of stem cells by modulating cellular metabolic reprogramming and signaling pathways [39–41]. For example, lactate metabolism can regulate macrophage differentiation through the HIF-1α/SRC/LDHA pathway in early normal pregnancy [42], whereas lactate-accumulating LDHB can also regulate myogenic differentiation of C2C12 myoblasts through the glycolytic pathway [43]. However, current studies on the effects of lactate metabolism on osteogenic differentiation of hMSCs are still in the exploratory stage. the study of Nuno et al. [28] initially found that the osteogenic differentiation of hMSCs was dependent on glutamine catabolism and lactate metabolism, but the existing studies did not elucidate the targets and mechanisms by which lactate metabolism affects osteogenic differentiation. Exploring the molecular targets and regulatory mechanisms between lactate metabolism and osteogenic differentiation is necessary for the development of bone tissue regenerative medicine.
In this study, by querying the microarray data from the GEO database, we obtained two datasets, GSE12266 and GSE18043, which contained a total of 7 BMSCs samples and 7 osteoblast samples after de-batch effect for subsequent studies. The necessity of FDR control as the gold standard for reducing false positives in routine transcriptome analysis has been validated in a large number of studies [44, 45]. In this study, the homogeneity of the gene expression matrix was elevated after merging the datasets by de-batching effect, which relatively compresses the effect value of real biological differences. Therefore, if traditional FDR/Bonferroni correction is used in this scenario, it may over-penalize genes with low to medium effect values but with biological significance, significantly increasing the risk of false negatives. We also tried to screen DEGs with FDR, Bonferroni method and found that the result was not even a single DEG. Considering that the empirical Bayesian shrinkage corrects for small-sample variance bias in the differential expression analysis performed with the limma package, which makes the raw p-value closer to the true error rate, we finally chose the p-value as the screening criterion for DEGs. Lactate metabolism-related genes were obtained from the Genecards database. After taking the intersection of lactate metabolism-related genes and osteoblast differentially expressed genes to obtain 35 DELRs, we explored these genes in depth. We drew correlation heatmaps for the DELRs to visualize the expression patterns of these genes. The 35 DELRs in the heatmap were clearly divided into two clusters, suggesting that they may have two strong co-expression patterns and regulate opposite biological functions. Subsequently, we performed GO, KEGG, and GSEA enrichment analyses of the DELRs to explore the molecular mechanisms and biological pathways involved in them. The GO enrichment results showed that the DELRs were enriched in a large number of biological pathways related to lactate metabolism, osteogenic differentiation, and immune infiltration, including Regulation of ossification, response to cAMP, BMP signaling pathway, response to BMP, positive regulation of angiogenesis, phospholipase C activity, response to fatty acid, response to reactive oxygen species, glycerol, and other biological pathways. reactive oxygen species, glycosaminoglycan binding, and RAGE receptor binding. KEGG enrichment analysis also yielded a large number of immune infiltration-related pathways, including Chemokine signaling pathway, completion and coagulation cascades, Cytokine-cytokine receptor interaction, IL-17 signaling pathway. GSEA enrichment analysis also showed that these genes were significantly enriched in lactate metabolism and immune-related pathways, including Fatty acid binding, oxidative damage response, superoxide process, macrophage activation, neutrophil activation involved in immune response, B cell activation, and Dendritic cell maturation. The immunoinfiltration heatmaps obtained by the two methods GSVA and xCell also showed that the immunoinfiltration of osteoblasts was significantly lower than that of BMSCs. These results strongly reflect that DELRs may affect osteogenic differentiation by influencing the immune infiltration status of cells. The relationship between osteogenic differentiation and immune infiltration has also been a hot research topic at the intersection of bone biology and immunology in recent years [46]. Existing studies have shown that the process of osteogenic differentiation involves complex intercellular signaling, and the immune cell infiltration status also plays a key role in this process [47, 48]. The process of bone tissue formation and repair is not only dependent on osteoblast differentiation, but also significantly regulated by immune cells [49, 50].
To explore the key genes of lactate metabolism affecting osteogenic differentiation, we performed a secondary screening of 35 DELRs using the STRING database and Cytoscape software. We constructed PPI networks for DELRs and calculated to get their Betweenness, Closeness, Degree, MCC, and MNC scores. We obtained the top 50% of the score sorted genes respectively to take the intersection, and we got 6 hub genes in total, which are CCL4, VSIG4, C3AR1, CCR1, TYROBP, CD163. It has been shown that MMP9 may be involved in the regulation of osteogenic differentiation of BMSCs. TYROBP has been found to trigger osteoclastogenesis in cooperation with DAP10 and MDL-1 [51]. CD163 significantly upregulates the TGF-ß/BMP signaling pathway and osteogenesis-related gene expression in osteoblasts [52]. Fu et al. [53] found that CCR1 inhibitors may control bone destruction in patients with multiple myeloma via osteoblast/osteoclast coupling. Megan et al. [54] found that the C3a/C3aR signaling axis may act as a novel regulatory signaling axis in young bone. Lee et al. [55] noted that CCL4 enhances osteoclast recruitment to bone at an early stage, and that a reduction in CCR5, the receptor for CCL4, promotes osteoclastogenesis when RANKL is prevalent. Miao et al. found that VSIG4 inhibited RANKL-induced osteoclastogenesis by enhancing Nrf2-dependent antioxidant responses to reactive oxygen species production [56]. We heatmapped the correlation of these 6 hub genes with immune scores and found that most of the hub genes were significantly and positively correlated with TIL, T cell co-inhibition, neutrophils, Macrophages, HLA, Check-point, and B cells, which was highly consistent with the results of previous enrichment analysis. MCC refers to the identification of nodes with centrality of gene sets in the largest clusters, and it is often used by researchers to screen hub genes [57, 58]. We selected TYROBP with the highest MCC score for more in-depth functional profiling.
TYROBP is known as Transmembrane Immune Signaling Adaptor, also called DAP12 (DNAX Activating Protein of 12 kDa) or KARAP (Killer Cell-Activating Receptor-Associated Protein). This gene encodes a transmembrane signaling polypeptide which contains an immunoreceptor tyrosine-based activation motif (ITAM) in its cytoplasmic domain. It can bind non-covalently to activation receptors on the surface of a wide range of immune cells to mediate signaling and cell activation following receptor-ligand binding [59]. The encoded protein may associate with the killer-cell inhibitory receptor (KIR) family of membrane glycoproteins and may act as an activating signal transduction element. This protein may bind zeta-chain (TCR) associated protein kinase 70 kDa (ZAP-70) and spleen tyrosine kinase (SYK) and play a role in signal transduction, bone modeling, brain myelination, and inflammation [60]. TYROBP deficiency significantly attenuates AC16 cell viability loss, LDH release, and apoptosis [61], and the TREM2/TYROBP axis modulates the ratio of M1/M2 subtypes of macrophages and increases the release of LDH and ROS, which are involved in the regulation of lactate metabolism and inflammation [62]. Correlation analysis of TYROBP with other hub genes showed that the expression level of TYROBP was significantly and positively correlated with C3AR1, CCR1, CD163, and VSIG4. Also, TYROBP was significantly positively correlated with the immune scores Check-point, HLA, Macrophages, Mast cells, Neutrophils, T cell co-inhibition, Th1 cells, and TIL. Both immune infiltration analysis methods, GSVA and xCell, showed that TYROBP was significantly positively correlated with Macrophages, Neutrophils, and xCell further indicated that TYROBP was significantly positively correlated with M1-type Macrophages (pro-inflammatory macrophages). TYROBP was lowly expressed in osteoblasts, while the heat maps obtained by both immune infiltration analysis methods showed poorer immune infiltration in the osteoblast group. This suggests that TYROBP is likely to promote immune infiltration in BMSCs and osteoblasts. Based on the expression level of TYROBP, high and low expression subgroups were classified, and then GO enrichment analysis of their differentially expressed genes revealed significant enrichment in a large number of cell cycle, osteogenic differentiation, and immune-related pathways, including cell chemotaxis, cell junction disassembly, meiotic nuclear division, meiotic cell cycle, positive regulation of cell cycle checkpoint, macrophage activation, osteoblast development, negative regulation of cell adhesion. More in-depth GSEA enrichment analysis also revealed that the differentially expressed genes were significantly enriched in cell cycle-related biological pathways, including cell cycle, nuclear chromosome segregation. these results strongly suggest that TYROBP may influence osteogenesis and differentiation by regulating cell cycle and immune-related processes. differentiation. We used the CMap database to find 10 potential intervening drugs for TYROBP, including dantron, ethoxsalen, necrostatin-1, immepip, SB-206,553, eugenitol, dichloroacetic-acid, butylparaben, TCS-359, and verrucarin-a. Existing studies also suggest that some of these drugs are highly correlated with osteogenic differentiation. For example, methoxsalen attenuates diabetes-induced osteoporosis by down-regulating osteoclast metabolism in mice [63]; Feng et al. [64] found that necrostatin-1 administration reduced the incidence of osteonecrosis and the osteogenic response in the subchondral region, and that necrostatin-1 intervention restored bone remodeling in the necrotic area of the femoral head in rats; Yan et al. [65] also showed that necrostatin-1 pretreatment improved the osteogenic differentiation of periodontal ligament stem cells (PDLSCs) and effectively promoted the ectopic regeneration of odontoblast-like structures in nude mice PDLSCs; Hu et al. [66] found that butylparaben significantly promoted the adipogenic differentiation of pluripotent mesenchymal stem cells, but inhibited osteogenic and chondrogenic differentiation. Combined with the present study, the intervention of the above drugs in osteogenic differentiation may be realized through TYROBP targets. However, the drug sensitivity analysis in this study was not validated using experiments, so this conclusion is highly speculative and needs to be further explored in the future.
To further validate the effect of TYROBP on BMSCs, we knocked down TYROBP in BMSCs, followed by CCK8 assay, EdU assay, Transwell assay and wound healing assay. The results showed that cell viability, proliferation and migration of BMSCs were significantly increased after TYROBP expression was down-regulated. We added a set of siRNA + MMC to the Transwell assay and wound healing assay, that is, we added mitomycin C to inhibit cell proliferation in TYROBP knockdown BMSCs to exclude its effect on the detection of migratory ability of BMSCs, making the regulatory role of TYROBP on the migratory ability of BMSCs clearer. Our results showed that alkaline phosphatase activity was significantly higher in the siRNA group than in the other two groups at the 7- and 14-day time points. Since ALP activity is positively correlated with the degree of early osteogenic differentiation, our results confirm that BMSCs with knockdown of TYROBP have more active osteogenic differentiation. VonKossa staining results demonstrated that calcium salt deposition was significantly higher in TYROBP knockdown BMSCs than in the other two groups at different time points, suggesting that TYROBP was able to regulate the extracellular matrix mineralization ability of BMSCs. Flow cytometry experiments also confirmed that TYROBP could promote the secretion of inflammatory factors in BMSCs, indirectly indicating that TYROBP could affect the immune status of BMSCs. The above experiments indicate that TYROBP can regulate the cellular functions of BMSCs, especially the osteogenic differentiation ability, and is an important regulatory target for the osteogenic differentiation of BMSCs.
Due to the limited amount of BMSCs and osteoblast samples in the database, we were unable to externally validate the effect of TYROBP on the immune microenvironment, and we are planning to collect samples of human BMSCs and osteoblasts for sequencing analysis to make up for the scarcity of public databases on such samples. We did not perform promoter assay to confirm the regulatory role of TYROBP on the osteogenic differentiation pathway, which is a limitation of this study, and we look forward to more scholars to explore this topic in depth in the future. In conclusion, our study provides new insights into the osteogenic differentiation of BMSCs from the perspective of lactate metabolism, identifies the regulatory role of the key gene TYROBP on BMSCs, and provides new ideas for studies related to the regulation of osteogenic differentiation.
Conclusion
Our study reveals the critical role of lactate metabolism in osteoblast differentiation, identifies the role of the key gene TYROBP in the regulation of BMSCs, and provides new insights for studies related to the regulation of osteoblast differentiation.
Acknowledgements
We sincerely appreciate Mengyu Wang, Zhaoshuo He, Junzhi Liu, Zhichao Yang, and Deyu Tian for their advice on linguistic editing, resources, data curation, and manuscript writing.
Author contributions
Conceptualization, L.H., Z.P.; methodology, T.Z.; software, L.H.; validation, L.H.; formal analysis, L.H.; investigation, L.H.; resources, L.H.; data curation, L.H.; writing—original draft preparation, L.H.; writing—review and editing, L.H.; visualization, L.H.; supervision, Z.Z.; project administration, F.S.; funding acquisition, F.S. and L.W.;All authors have read and agreed to the published version of the manuscript. All authors have read and agreed to the published version of the manuscript.
Funding
This research was funded by National High Level Hospital Clinical Research Funding (BJ-2023-085, BJ-2024-172), 14th Five Year Plan for National Key Research and Development Project (2022YFC3601905).
Data availability
No datasets were generated or analysed during the current study.
Declarations
Competing interests
The authors declare no competing interests.
Footnotes
Publisher’s note
Springer Nature remains neutral with regard to jurisdictional claims in published maps and institutional affiliations.
Liangkun Huang and Zijie Pei contributed equally to this work.
Contributor Information
Ze Zhang, Email: 1911210691@pku.edu.cn.
Fengpo Sun, Email: sfp19881110@126.com.
Liangyuan Wen, Email: wenliangyuan1964@126.com.
References
- 1.Mazziotta C, Badiale G, Cervellera CF, Tognon M, Martini F, Rotondo JC. Regulatory mechanisms of circular RNAs during human mesenchymal stem cell osteogenic differentiation. Theranostics. 2024;14(1):143–58. [DOI] [PMC free article] [PubMed] [Google Scholar]
- 2.Shi H, Zhou K, Wang M, Wang N, Song Y, Xiong W, Guo S, Yi Z, Wang Q, Yang S. Integrating physicomechanical and biological strategies for BTE: biomaterials-induced osteogenic differentiation of MSCs. Theranostics. 2023;13(10):3245–75. [DOI] [PMC free article] [PubMed] [Google Scholar]
- 3.Chen F, Liang Q, Mao L, Yin Y, Zhang L, Li C, Liu C. Synergy effects of Asperosaponin VI and bioactive factor BMP-2 on osteogenesis and anti-osteoclastogenesis. Bioact Mater. 2022;10:335–44. [DOI] [PMC free article] [PubMed] [Google Scholar]
- 4.Han S, Paeng K-W, Park S, Jung U-W, Cha J-K, Hong J. Programmed BMP-2 release from biphasic calcium phosphates for optimal bone regeneration. Biomaterials. 2021;272:120785. [DOI] [PubMed] [Google Scholar]
- 5.Tian L, Xiao H, Li M, Wu X, Xie Y, Zhou J, Zhang X, Wang B. A novel Sprouty4-ERK1/2-Wnt/β-catenin regulatory loop in marrow stromal progenitor cells controls osteogenic and adipogenic differentiation. Metabolism. 2020;105:154189. [DOI] [PubMed] [Google Scholar]
- 6.Zhou X, Beilter A, Xu Z, Gao R, Xiong S, Paulucci-Holthauzen A, Lozano G, de Crombrugghe B, Gorlick R. Wnt/ß-catenin-mediated p53 suppression is indispensable for osteogenesis of mesenchymal progenitor cells. Cell Death Dis. 2021;12(6):521. [DOI] [PMC free article] [PubMed] [Google Scholar]
- 7.Kay AG, Dale TP, Akram KM, Mohan P, Hampson K, Maffulli N, Spiteri MA, El Haj AJ, Forsyth NR. BMP2 repression and optimized culture conditions promote human bone marrow-derived mesenchymal stem cell isolation. Regen Med. 2015;10(2):109–25. [DOI] [PubMed] [Google Scholar]
- 8.Cai P, Lu S, Yu J, Xiao L, Wang J, Liang H, Huang L, Han G, Bian M, Zhang S, et al. Injectable nanofiber-reinforced bone cement with controlled biodegradability for minimally-invasive bone regeneration. Bioact Mater. 2023;21:267–83. [DOI] [PMC free article] [PubMed] [Google Scholar]
- 9.Lin W, Zhou Z, Chen Z, Xu K, Wu C, Duan X, Dong L, Chen Z, Weng W, Cheng K. Accelerated bone regeneration on the metal surface through controllable surface potential. ACS Appl Mater Interfaces. 2023;15(39):46493–503. [DOI] [PubMed] [Google Scholar]
- 10.Zhou H, Liu H, Lin M, Wang H, Zhou J, Li M, Yang X, Fu G, Liu C. Hyperbaric oxygen promotes bone regeneration by activating the mechanosensitive Piezo1 pathway in osteogenic progenitors. J Orthop Translat. 2024;48:11–24. [DOI] [PMC free article] [PubMed] [Google Scholar]
- 11.Pouikli A, Maleszewska M, Parekh S, Yang M, Nikopoulou C, Bonfiglio JJ, Mylonas C, Sandoval T, Schumacher A-L, Hinze Y, et al. Hypoxia promotes osteogenesis by facilitating acetyl-CoA-mediated mitochondrial-nuclear communication. EMBO J. 2022;41(23):e111239. [DOI] [PMC free article] [PubMed] [Google Scholar]
- 12.Zhang L, Jiao G, You Y, Li X, Liu J, Sun Z, Li Q, Dai Z, Ma J, Zhou H, et al. Arginine methylation of PPP1CA by CARM1 regulates glucose metabolism and affects osteogenic differentiation and osteoclastic differentiation. Clin Transl Med. 2023;13(9):e1369. [DOI] [PMC free article] [PubMed] [Google Scholar]
- 13.Yan R, Guo Y, Wang X, Liang G, Yang A, Li J. Near-Infrared Light-Controlled and Real-Time detection of osteogenic differentiation in mesenchymal stem cells by upconversion nanoparticles for osteoporosis therapy. ACS Nano. 2022;16(5):8399–418. [DOI] [PubMed] [Google Scholar]
- 14.Ma S, Xu S, Li M, Du Y, Tian G, Deng J, Zhang W, Wei P, Zhao B, Zhang X, et al. A bone targeting nanoparticle loaded OGP to restore bone homeostasis for osteoporosis therapy. Adv Healthc Mater. 2023;12(25):e2300560. [DOI] [PubMed] [Google Scholar]
- 15.Barnaba S, Papalia R, Ruzzini L, Sgambato A, Maffulli N, Denaro V. Effect of pulsed electromagnetic fields on human osteoblast cultures. Physiother Res Int. 2013;18(2):109–14. [DOI] [PubMed] [Google Scholar]
- 16.Chen Z, Bordieanu B, Kesavan R, Lesner NP, Venigalla SSK, Shelton SD, DeBerardinis RJ, Mishra P. Lactate metabolism is essential in early-onset mitochondrial myopathy. Sci Adv. 2023;9(1):eadd3216. [DOI] [PMC free article] [PubMed] [Google Scholar]
- 17.Li X, Yang Y, Zhang B, Lin X, Fu X, An Y, Zou Y, Wang J-X, Wang Z, Yu T. Lactate metabolism in human health and disease. Signal Transduct Target Ther. 2022;7(1):305. [DOI] [PMC free article] [PubMed] [Google Scholar]
- 18.Yu X, Yang J, Xu J, Pan H, Wang W, Yu X, Shi S. Histone lactylation: from tumor lactate metabolism to epigenetic regulation. Int J Biol Sci. 2024;20(5):1833–54. [DOI] [PMC free article] [PubMed] [Google Scholar]
- 19.Glancy B, Kane DA, Kavazis AN, Goodwin ML, Willis WT, Gladden LB. Mitochondrial lactate metabolism: history and implications for exercise and disease. J Physiol. 2021;599(3):863–88. [DOI] [PMC free article] [PubMed] [Google Scholar]
- 20.Heuser C, Renner K, Kreutz M, Gattinoni L. Targeting lactate metabolism for cancer immunotherapy - a matter of precision. Semin Cancer Biol. 2023;88:32–45. [DOI] [PubMed] [Google Scholar]
- 21.Zhu W, Guo S, Sun J, Zhao Y, Liu C. Lactate and lactylation in cardiovascular diseases: current progress and future perspectives. Metabolism. 2024;158:155957. [DOI] [PubMed] [Google Scholar]
- 22.Fang Y, Li Z, Yang L, Li W, Wang Y, Kong Z, Miao J, Chen Y, Bian Y, Zeng L. Emerging roles of lactate in acute and chronic inflammation. Cell Commun Signal. 2024;22(1):276. [DOI] [PMC free article] [PubMed] [Google Scholar]
- 23.Apostolova P, Pearce EL. Lactic acid and lactate: revisiting the physiological roles in the tumor microenvironment. Trends Immunol. 2022;43(12):969–77. [DOI] [PMC free article] [PubMed] [Google Scholar]
- 24.Hayes C, Donohoe CL, Davern M, Donlon NE. The oncogenic and clinical implications of lactate induced immunosuppression in the tumour microenvironment. Cancer Lett. 2021;500:75–86. [DOI] [PubMed] [Google Scholar]
- 25.Wenes M, Jaccard A, Wyss T, Maldonado-Pérez N, Teoh ST, Lepez A, Renaud F, Franco F, Waridel P, Yacoub Maroun C et al. The mitochondrial pyruvate carrier regulates memory T cell differentiation and antitumor function. Cell Metab 2022;34(5). [DOI] [PMC free article] [PubMed]
- 26.Li C, Zhou Y, Wei R, Napier DL, Sengoku T, Alstott MC, Liu J, Wang C, Zaytseva YY, Weiss HL, et al. Glycolytic regulation of intestinal stem cell Self-Renewal and differentiation. Cell Mol Gastroenterol Hepatol. 2023;15(4):931–47. [DOI] [PMC free article] [PubMed] [Google Scholar]
- 27.Dong Q, Zhang Q, Yang X, Nai S, Du X, Chen L. Glycolysis-Stimulated Esrrb lactylation promotes the Self-Renewal and extraembryonic endoderm stem cell differentiation of embryonic stem cells. Int J Mol Sci. 2024;25(5). [DOI] [PMC free article] [PubMed]
- 28.Neto NGB, Suku M, Hoey DA, Monaghan MG. 2P-FLIM unveils time-dependent metabolic shifts during osteogenic differentiation with a key role of lactate to fuel osteogenesis via Glutaminolysis identified. Stem Cell Res Ther. 2023;14(1):364. [DOI] [PMC free article] [PubMed] [Google Scholar]
- 29.Subramanian A, Narayan R, Corsello SM, Peck DD, Natoli TE, Lu X, Gould J, Davis JF, Tubelli AA, Asiedu JK et al. A next generation connectivity map: L1000 platform and the first 1,000,000 profiles. Cell. 2017;171(6). [DOI] [PMC free article] [PubMed]
- 30.Zhan W, Deng M, Huang X, Xie D, Gao X, Chen J, Shi Z, Lu J, Lin H, Li P. Pueraria lobata-derived exosome-like nanovesicles alleviate osteoporosis by enhacning autophagy. J Control Release. 2023;364:644–53. [DOI] [PubMed] [Google Scholar]
- 31.Liu H, Song P, Zhang H, Zhou F, Ji N, Wang M, Zhou G, Han R, Liu X, Weng W, et al. Synthetic biology-based bacterial extracellular vesicles displaying BMP-2 and CXCR4 to ameliorate osteoporosis. J Extracell Vesicles. 2024;13(4):e12429. [DOI] [PMC free article] [PubMed] [Google Scholar]
- 32.Giai Via A, McCarthy MB, de Girolamo L, Ragni E, Oliva F, Maffulli N. Making them commit: strategies to influence phenotypic differentiation in mesenchymal stem cells. Sports Med Arthrosc Rev. 2018;26(2):64–9. [DOI] [PubMed] [Google Scholar]
- 33.Han P, Frith JE, Gomez GA, Yap AS, O’Neill GM, Cooper-White JJ. Five piconewtons: the difference between osteogenic and adipogenic fate choice in human mesenchymal stem cells. ACS Nano. 2019;13(10):11129–43. [DOI] [PubMed] [Google Scholar]
- 34.Wei Q, Holle A, Li J, Posa F, Biagioni F, Croci O, Benk AS, Young J, Noureddine F, Deng J, et al. BMP-2 signaling and mechanotransduction synergize to drive osteogenic differentiation via YAP/TAZ. Adv Sci (Weinh). 2020;7(15):1902931. [DOI] [PMC free article] [PubMed] [Google Scholar]
- 35.Mangiavini L, Peretti GM, Canciani B, Maffulli N. Epidermal growth factor signalling pathway in endochondral ossification: an evidence-based narrative review. Ann Med. 2022;54(1):37–50. [DOI] [PMC free article] [PubMed] [Google Scholar]
- 36.Li X, Zhang Y, Xu L, Wang A, Zou Y, Li T, Huang L, Chen W, Liu S, Jiang K et al. Ultrasensitive sensors reveal the Spatiotemporal landscape of lactate metabolism in physiology and disease. Cell Metab. 2023;35(1). [DOI] [PMC free article] [PubMed]
- 37.Gao Y, Zhou H, Liu G, Wu J, Yuan Y, Shang A. Tumor Microenvironment: Lactic Acid Promotes Tumor Development. J Immunol Res. 2022;2022:3119375. [DOI] [PMC free article] [PubMed]
- 38.Cheng Q, Shi X-L, Li Q-L, Wang L, Wang Z. Current advances on nanomaterials interfering with lactate metabolism for tumor therapy. Adv Sci (Weinh). 2024;11(3):e2305662. [DOI] [PMC free article] [PubMed] [Google Scholar]
- 39.Tang X, Mao X, Ling P, Yu M, Pan H, Wang J, Liu M, Pan H, Qiu W, Che N, et al. Glycolysis Inhibition induces anti-tumor central memory CD8 + T cell differentiation upon combination with microwave ablation therapy. Nat Commun. 2024;15(1):4665. [DOI] [PMC free article] [PubMed] [Google Scholar]
- 40.Maity J, Deb M, Greene C, Das H. KLF2 regulates dental pulp-derived stem cell differentiation through the induction of mitophagy and altering mitochondrial metabolism. Redox Biol. 2020;36:101622. [DOI] [PMC free article] [PubMed] [Google Scholar]
- 41.Cai W, Ji Y, Han L, Zhang J, Ni Y, Cheng Y, Zhang Y. METTL3-Dependent Glycolysis regulates dental pulp stem cell differentiation. J Dent Res. 2022;101(5):580–9. [DOI] [PubMed] [Google Scholar]
- 42.Gao L, Xu Q-H, Ma L-N, Luo J, Muyayalo KP, Wang L-L, Huang D-H, Xiao X-J, Cheng S-B, Mor G, et al. Trophoblast-derived lactic acid orchestrates decidual macrophage differentiation via SRC/LDHA signaling in early pregnancy. Int J Biol Sci. 2022;18(2):599–616. [DOI] [PMC free article] [PubMed] [Google Scholar]
- 43.Jiang X, Feng N, Zhou Y, Ye X, Wang R, Zhang J, Cui S, Ji S, Chen Y, Zhu S. Slc2a6 regulates myoblast differentiation by targeting LDHB. Cell Commun Signal. 2022;20(1):107. [DOI] [PMC free article] [PubMed] [Google Scholar]
- 44.Pavel AB, Renert-Yuval Y, Wu J, Del Duca E, Diaz A, Lefferdink R, Fang MM, Canter T, Rangel SM, Zhang N, et al. Tape strips from early-onset pediatric atopic dermatitis highlight disease abnormalities in nonlesional skin. Allergy. 2021;76(1):314–25. [DOI] [PMC free article] [PubMed] [Google Scholar]
- 45.Lau PKH, Feran B, Smith L, Lasocki A, Molania R, Smith K, Weppler A, Angel C, Kee D, Bhave P et al. Melanoma brain metastases that progress on BRAF-MEK inhibitors demonstrate resistance to ipilimumab-nivolumab that is associated with the innate PD-1 resistance signature (IPRES). J Immunother Cancer. 2021;9(10). [DOI] [PMC free article] [PubMed]
- 46.Tsukasaki M, Takayanagi H. Osteoimmunology: evolving concepts in bone-immune interactions in health and disease. Nat Rev Immunol. 2019;19(10):626–42. [DOI] [PubMed] [Google Scholar]
- 47.Zhang F, Lv M, Wang S, Li M, Wang Y, Hu C, Hu W, Wang X, Wang X, Liu Z, et al. Ultrasound-triggered biomimetic ultrashort peptide nanofiber hydrogels promote bone regeneration by modulating macrophage and the osteogenic immune microenvironment. Bioact Mater. 2024;31:231–46. [DOI] [PMC free article] [PubMed] [Google Scholar]
- 48.Miron RJ, Bohner M, Zhang Y, Bosshardt DD. Osteoinduction and osteoimmunology: emerging concepts. Periodontol 2000. 2024;94(1). [DOI] [PubMed]
- 49.Zhao Z, Zhao Q, Gu B, Yin C, Shen K, Tang H, Xia H, Zhang X, Zhao Y, Yang X, et al. Minimally invasive implantation and decreased inflammation reduce osteoinduction of biomaterial. Theranostics. 2020;10(8):3533–45. [DOI] [PMC free article] [PubMed] [Google Scholar]
- 50.Mahon OR, Browe DC, Gonzalez-Fernandez T, Pitacco P, Whelan IT, Von Euw S, Hobbs C, Nicolosi V, Cunningham KT, Mills KHG, et al. Nano-particle mediated M2 macrophage polarization enhances bone formation and MSC osteogenesis in an IL-10 dependent manner. Biomaterials. 2020;239:119833. [DOI] [PubMed] [Google Scholar]
- 51.Inui M, Kikuchi Y, Aoki N, Endo S, Maeda T, Sugahara-Tobinai A, Fujimura S, Nakamura A, Kumanogoh A, Colonna M, et al. Signal adaptor DAP10 associates with MDL-1 and triggers osteoclastogenesis in Cooperation with DAP12. Proc Natl Acad Sci U S A. 2009;106(12):4816–21. [DOI] [PMC free article] [PubMed] [Google Scholar]
- 52.Hamlet SM, Lee RSB, Moon H-J, Alfarsi MA, Ivanovski S. Hydrophilic titanium surface-induced macrophage modulation promotes pro-osteogenic signalling. Clin Oral Implants Res. 2019;30(11):1085–96. [DOI] [PubMed] [Google Scholar]
- 53.Fu R, Liu H, Zhao S, Wang Y, Li L, Gao S, Ruan E, Wang G, Wang H, Song J, et al. Osteoblast Inhibition by chemokine cytokine ligand3 in myeloma-induced bone disease. Cancer Cell Int. 2014;14(1):132. [DOI] [PMC free article] [PubMed] [Google Scholar]
- 54.Kuhn MB, VandenBerg HS, Reynolds AJ, Carson MD, Warner AJ, LaRue AC, Novince CM, Hathaway-Schrader JD. C3a-C3aR signaling is a novel modulator of skeletal homeostasis. Bone Rep. 2023;18:101662. [DOI] [PMC free article] [PubMed] [Google Scholar]
- 55.Lee D, Shin K-J, Kim DW, Yoon K-A, Choi Y-J, Lee BNR, Cho J-Y. CCL4 enhances preosteoclast migration and its receptor CCR5 downregulation by RANKL promotes osteoclastogenesis. Cell Death Dis. 2018;9(5):495. [DOI] [PMC free article] [PubMed] [Google Scholar]
- 56.Miao J, Tu Y, Jiang J, Ren R, Wu Q, Liang H, Wang T, Lin B, Wu J, Pan Y, et al. VSIG4 inhibits RANKL-induced osteoclastogenesis by enhancing Nrf2-dependent antioxidant response against reactive oxygen species production. Int J Biol Macromol. 2024;260(Pt 2):129357. [DOI] [PubMed] [Google Scholar]
- 57.Bhattacharjya A, Islam MM, Uddin MA, Talukder MA, Azad A, Aryal S, Paul BK, Tasnim W, Almoyad MAA, Moni MA. Exploring gene regulatory interaction networks and predicting therapeutic molecules for hypopharyngeal cancer and EGFR-mutated lung adenocarcinoma. FEBS Open Bio. 2024;14(7):1166–91. [DOI] [PMC free article] [PubMed] [Google Scholar]
- 58.Zhao G, Zhao J, Lang J, Sun G. Nrf2 functions as a pyroptosis-related mediator in traumatic brain injury and is correlated with cytokines and disease severity: a bioinformatics analysis and retrospective clinical study. Front Neurol. 2024;15:1341342. [DOI] [PMC free article] [PubMed] [Google Scholar]
- 59.Zhou Y, Tada M, Cai Z, Andhey PS, Swain A, Miller KR, Gilfillan S, Artyomov MN, Takao M, Kakita A, et al. Human early-onset dementia caused by DAP12 deficiency reveals a unique signature of dysregulated microglia. Nat Immunol. 2023;24(3):545–57. [DOI] [PMC free article] [PubMed] [Google Scholar]
- 60.Haure-Mirande J-V, Audrain M, Ehrlich ME, Gandy S. Microglial TYROBP/DAP12 in Alzheimer’s disease: transduction of physiological and pathological signals across TREM2. Mol Neurodegener. 2022;17(1):55. [DOI] [PMC free article] [PubMed] [Google Scholar]
- 61.Yu J, Mu Xe, Guan C, Wang Y, Li H. Tyrobp deficiency blocks NLRP3-mediated inflammation and pyroptosis to alleviate myocardial ischemia-reperfusion injury through regulating Syk. Tissue Cell. 2024;91:102555. [DOI] [PubMed] [Google Scholar]
- 62.Li D, Pan L, Chen M, Zhang X, Jiang Z. TREM2 protects against LPS-induced murine acute lung injury through suppressing macrophage ferroptosis. Int Immunopharmacol. 2025;150:114247. [DOI] [PubMed] [Google Scholar]
- 63.Ham JR, Choi R-Y, Lee H-I, Lee M-K. Methoxsalen and Bergapten prevent Diabetes-Induced osteoporosis by the suppression of osteoclastogenic gene expression in mice. Int J Mol Sci. 2019;20(6). [DOI] [PMC free article] [PubMed]
- 64.Feng M, Zhang R, Zhang M, Chen M, Ji L, Duan D, Qiang H. Administration of necrostatin-1 ameliorates glucocorticoid-induced osteonecrosis of the femoral head in rats. J Mol Histol. 2023;54(3):207–16. [DOI] [PubMed] [Google Scholar]
- 65.Yan B, Zhang H, Dai T, Gu Y, Qiu X, Hu C, Liu Y, Wei K, Li D. Necrostatin-1 promotes ectopic periodontal tissue like structure regeneration in LPS-treated PDLSCs. PLoS ONE. 2018;13(11):e0207760. [DOI] [PMC free article] [PubMed] [Google Scholar]
- 66.Hu P, Overby H, Heal E, Wang S, Chen J, Shen C-L, Zhao L. Methylparaben and Butylparaben alter multipotent mesenchymal stem cell fates towards adipocyte lineage. Toxicol Appl Pharmacol. 2017;329:48–57. [DOI] [PMC free article] [PubMed] [Google Scholar]
Associated Data
This section collects any data citations, data availability statements, or supplementary materials included in this article.
Data Availability Statement
No datasets were generated or analysed during the current study.


