

ABSTRACT
Purpose
This study aimed to investigate COVID‐19's indirect influence on chronic respiratory disease (CRD) patients for two years since the COVID‐19 pandemic began.
Methods
Using population‐based data in Hong Kong, we included CRD patients diagnosed from January 2011 to December 2021. Interrupted Time Series Analysis were applied to assess mortality, complications, and healthcare utilization rates during the “pre‐COVID‐19 pandemic” (January 2012–January 2020), “initial COVID‐19 pandemic” (February 2020–February 2021), and “post‐initial COVID‐19 pandemic” (March 2021–December 2021) periods.
Results
Among 587,049 patients with CRD, all‐cause mortality had an increasing trend during the post‐initial COVID‐19 pandemic period (incidence rate ratio (95% CI): 1.019 (1.005, 1.034); p = 0.007), compared with pre‐COVID‐19 pandemic period. Nonrespiratory mortality had an increasing trend in the initial COVID‐19 pandemic period (1.020 (1.006, 1.033); p = 0.004) and was higher than the pre‐pandemic level in the post‐initial COVID‐19 pandemic. We observed abrupt declines in the incidence rates of asthma exacerbation, acute exacerbation of chronic obstructive pulmonary disease, pneumonia, and acute respiratory failure in the first month of initial COVID‐19 pandemic period, remaining below pre‐COVID‐19 pandemic levels throughout the initial pandemic period.
Conclusion
The disruption of usual healthcare impacts mortality rates among patients with CRD without COVID‐19, particularly nonrespiratory mortality. Contingency plans on continuing follow‐up and monitoring of CRD patients are needed, for example, teleconsultations, shared primary care, and tele‐reminders on red‐flag symptoms for patients with CRD, when healthcare services may be disrupted during public health crises.
Keywords: chronic respiratory disease, COVID‐19, healthcare system, mortality
Abbreviations
- A&E
Accident and Emergency Department
- AECOPD
Acute exacerbations of chronic obstructive pulmonary disease
- ARF
Acute renal failure
- CCI
Charlson Comorbidity Index
- CI
Confidence interval
- COVID‐19
Coronavirus disease 2019
- CRD
Chronic respiratory disease
- HA CMS
Hospital Authority Clinical Management System
- ICD‐10‐CM
International Classification of Diseases, Tenth Revision, Clinical Modification
- ICD‐9‐CM
International Classification of Diseases, Ninth Revision, Clinical Modification
- ICPC‐2
International Classification of Primary Care, Second Edition
- IRR
Incidence rate ratios
- ITSA
Interrupted time series analyses
- SARS‐CoV‐2
Severe acute respiratory syndrome coronavirus 2
- SOPC
Specialist outpatient clinics
- WHO
World Health Organization
1. Introduction
The coronavirus disease 2019 (COVID‐19) pandemic has greatly impacted population health worldwide, not only via the direct effects of SARS‐CoV‐2 infection but also the indirect effects of disrupted use of health services. The unprecedented numbers of COVID‐19 cases overwhelmed healthcare systems, resulting in the disruption of routine medical care among patients with chronic diseases but without COVID‐19. The fear of contracting SARS‐CoV‐2 has also discouraged this patient population from seeking healthcare. Chronic respiratory disease (CRD) is a common noncommunicable disease, with a prevalence of 454.6 million people globally in 2019 [1]. Patients with CRD are more susceptible to pneumonia, which is a common cause of acute respiratory failure (ARF) [2, 3], a life‐threatening condition. International guidelines recommend that patients with CRD have routine follow‐ups to monitor symptoms and exacerbations, have regular check‐ups, and adjust medication [4, 5]. There are concerns that disruptions to usual care may have led to suboptimal disease control and increased symptoms and exacerbations among patients with CRD. Consequently, this is likely to elevate their risk of pneumonia, ARF, and mortality. Therefore, it is vital to examine the changes in exacerbation, pneumonia, and ARF incidence and mortality rates before and after the first COVID‐19 wave among CRD patients.
Despite these concerns, several nationwide studies found significant declines in CRD exacerbations, with a reduction of up to 48% in 2020 reported in Scotland and a sustained decrease over the entire pandemic period reported in France [6, 7, 8, 9, 10, 11]. One study in Denmark with a cohort of 14,007 individuals with CRD and without COVID‐19 reported a significant reduction of 17% in all‐cause mortality during the social distancing period in 2020 [8], but changes in all‐cause mortality after the first months of the COVID‐19 pandemic remain unknown. Another national study showed that the annual non‐COVID mortality rates decreased by 15% among patients with CRD in 2020 [9]. Prior studies on the indirect effect of COVID‐19 on non‐COVID‐19 mortality have focused on the first year of the pandemic, when there were multiple COVID‐19 waves and stringent infection control measures, such as social distancing and lockdowns. However, there is a lack of literature on the impact in the year immediately following the initial COVID‐19 pandemic and in the years between COVID‐19 waves. There is a need for further studies to assess more precisely the temporal effects of COVID‐19 on the incidence of diagnosed complications and mortality among CRD patients without COVID‐19 to inform how healthcare services can be better prepared for future public health crises.
Hong Kong adopted the “zero‐COVID policy” from the beginning of the pandemic until 2022, with strict containment measures including social distancing, universal masking, contact tracing, and quarantines [12]. Consequently, it has successfully controlled four local waves in 2020 [13]. Hong Kong implemented the vaccination program at the end of February 2021 and recorded almost zero COVID‐19 cases until the Omicron wave in January 2022, which was the most significant wave in Hong Kong.
To address these gaps, we aimed to investigate the effect of the COVID‐19 pandemic on mortality, complications, and healthcare utilization among patients with CRD without prior COVID‐19 in Hong Kong in the first two‐year period of the pandemic, using an interrupted time series analysis (ITSA) with a population‐based study.
2. Methods
2.1. Data Source
The data in this study was retrieved from the Hospital Authority Clinical Management System (HA CMS), a comprehensive electronic medical record system used by all public healthcare sectors in Hong Kong. The HA CMS covers nearly 90% of hospitalizations, 50% of specialist outpatient clinics (SOPCs), and 30% of first‐contact outpatient services in public healthcare in Hong Kong [14]. Clinical information, including demographics, diagnoses, drug prescriptions, laboratory tests, and healthcare attendance, was recorded in HA CMS.
2.2. Study Design and Population
We utilized an open cohort design to examine the effect of COVID‐19 on patients with CRD in Hong Kong from January 2011 to December 2021. We included individuals aged 20 years or older with a confirmed CRD diagnosis, identified using the International Classification of Diseases, Ninth Revision, Clinical Modification (ICD‐9‐CM) and International Classification of Primary Care, Second Edition (ICPC‐2). Additionally, the records of death were classified using the International Classification of Diseases, Tenth Revision, Clinical Modification (ICD‐10‐CM) (Table S1). Individuals who have been diagnosed with COVID‐19 were removed from the study from the month of their diagnosis. The index date of patients was defined as the earliest date of medical records of CRD. To minimize the influence of unknown confounders, a one‐year washout period was used to exclude patients who died within one year after the index date of CRD. The participants were followed up from the index date until one of the following: (1) confirmed SARS‐CoV‐2 infection, (2) death, or (3) last follow‐up censored until December 2021, whichever came first. COVID‐19 cases were defined based on a documented diagnosis of COVID‐19 (ICPC‐2, code A77) (Table S1), positive results from polymerase chain reaction (PCR) testing, or administration of antiviral treatments of Paxlovid or Molnupiravir.
2.3. Outcomes
The primary outcomes were the monthly incidence rates (per 100,000 individuals) of mortality (all‐cause mortality, respiratory‐related mortality, and nonrespiratory‐related mortality) and complications (asthma exacerbations, acute exacerbations of chronic obstructive pulmonary disease (AECOPD), pneumonia, and ARF). Respiratory‐related mortality was defined as the deaths due to chronic respiratory diseases (such as COPD and asthma) and respiratory infections. Nonrespiratory mortality is the all‐cause mortality excluding the above respiratory deaths and injury deaths. Detailed definitions of respiratory‐related mortality, nonrespiratory‐related mortality, and complications are shown in Table S1. The secondary outcomes were the monthly healthcare utilization rates for patients with CRDs, including primary care clinic visits, SOPCs, hospital admissions, and Accident & Emergency (A&E) departments. The monthly healthcare utilization rate (per 1000 persons) was calculated by the total number of visits divided by the number of the population with CRD in a given month. Rates were sex‐ and age‐standardized to the CRD cohort in 2019 adjusted for age and sex in different years [15].
2.4. Statistical Analysis
ITSA was computed to estimate the effect of the COVID‐19 pandemic on mortality, complications, and healthcare utilization among CRD patients in Hong Kong from January 2011 to December 2021 in Hong Kong [16). We applied quasi‐Poisson regression models with Newey‐West standard errors to adjust for autocorrelation. Quasi‐Poisson regression is a statistical modeling used to analyze count data or adapted to rates that exhibit overdispersion, a common situation in real‐world scenarios [17]. We divided the time series into three periods, including one pre‐pandemic phase and two pandemic phases. We set two breaking time points based on specific COVID‐19 waves and governmental policy implementation. The first break point was set as February 2020 since the first local COVID‐19 case was confirmed on February 4, 2020 [18]. This date was chosen to mark the onset of confirmed local transmission. The second breakpoint was set in March 2021. The Hong Kong government announced that the COVID‐19 vaccination program would officially launch in February 2021. By March 2021, Hong Kong had experienced four initial waves of COVID‐19 and maintained a low incidence rate, entering a relatively stable period. Therefore, the three periods were (1) the pre‐COVID‐19 pandemic period (January 2012–January 2020), (2) the “initial COVID‐19 pandemic” period (February 2020–February 2021), and (3) the post‐initial COVID‐19 pandemic period (March 2021–December 2021). The models incorporated step and slope variables as regressors to capture both immediate changes (change in level) and progressive changes (change in trend). The model adjusts seasonal fluctuations by using harmonic terms, including sines and cosines with 3‐, 6‐, and 12‐month periods in those rates, using a 1‐month time unit. Then, we calculated expected incidences in initial and post‐initial COVID‐19 pandemic periods [19] based on the model developed using pre‐COVID‐19 pandemic period data, assuming the pandemic had not occurred. The effect of COVID‐19 on outcomes was assessed by comparing actual rates to the counterfactual estimation, as detailed in the Supplementary Methods.
Subgroup analyses were conducted based on sex (female and male), age (<45, 45–64, ≥65 years), and Charlson Comorbidity Index (CCI) groups each year (CCI: 1, 2, 3, ≥4)[20] (Table S2). We conducted multiple sensitivity analyses. First, we adjusted for seasonality over 6‐ and 12‐month periods using a quasi‐Poisson regression model. Second, we used generalized linear models with log‐transformed rates and adjusted 3‐, 6‐ and 12‐month period seasonality. Third, we substituted the 12‐month washout period with a 6‐month washout period to eliminate the washout period. Fourth, as recent literature showed that ICD‐9‐CM codes 480–488 for pneumonia were associated with COVID‐19 cases during the pandemic [21, 22], we excluded all individuals diagnosed with pneumonia in the assessment of the changes in mortality rates. Lastly, since it remains uncertain whether the disease was already circulating in the population before 2020, we redefined the COVID‐19 pandemic to started in December 2019.
Statistical significance was defined as a p‐value less than 0.05. All analyses were conducted using R version 4.2.1.
3. Result
This study included 587,049 individuals with CRD from January 2011 to December 2021. Among those CRD patients, 88,107 (15.01%) deaths were recorded, and 1648 (0.28%) individuals who have documented COVID‐19 were excluded from the analysis. Patient baseline characteristics are presented in Table 1. The median follow‐up was 6.87 ± 3.32 years (mean ± standard deviation). Overall, the mean age was 59.71 ± 16.82 years, with a mean CCI of 1.30 ± 0.94. Additionally, 321,303 (54.73%) individuals were female.
TABLE 1.
Baseline demographics of patients with CRD.
| N = 587,049 | |
|---|---|
| Follow‐up time, years | 6.87 ± 3.32 |
| Age, years | 59.71 ± 16.82 |
| Age group, N (%) | |
| 20–44 | 112,655 (19.19) |
| 45–64 | 232,728 (39.64) |
| ≥65 | 241,666 (41.17) |
| Female, N (%) | 321,303 (54.73) |
| CCI | 1.30 ±0.94 |
| CCI group, N (%) | |
| 0 | 500,611 (85.28) |
| 1 | 43,234 (7.36) |
| 2 | 24,610 (4.19) |
| >=3 | 18,594 (3.17) |
| COVID‐19 infection, N (%) | 1648 (0.28) |
| Death, N (%) | 88,107 (15.01) |
| Comorbidity | |
| Heart failure | 40,277 (6.86) |
| Peripheral vascular disease | 8941 (1.52) |
| Cerebrovascular disease | 60,467 (10.30) |
| Dementia | 29,103 (4.96) |
| Diabetes mellitus | 17,880 (3.05) |
| Cancer | 55,216 (9.41) |
Abbreviation: CCI: Charlson Comorbidity Index.
Note: Continuous variables (follow‐up time, age, and CCI) are presented as mean ± standard deviation (SD).
3.1. Health Outcomes
The relative changes in all mortality rates, respiratory‐related mortality, and nonrespiratory mortality are shown in Table 2 and Figure 1. During the initial COVID‐19 pandemic period, there was an increasing trend in nonrespiratory‐related mortality (incidence rate ratio (IRR):1.020, 95% confidence interval (CI): (1.006, 1. 033); p = 0.004), followed by a level increase (1.137 (1.058, 1.223); p = 0.001) at the beginning of the post‐initial COVID‐19 pandemic period. During the post‐initial COVID‐19 pandemic period, we found an increasing trend in all‐cause mortality (1.019 (1.005, 1.034); p = 0.007). The trend was similar in respiratory‐related mortality (1.032 (1.018, 1.045); p < 0.001) and nonrespiratory mortality (1.009 (1.000, 1.018); p = 0.046) during the post‐initial COVID‐19 pandemic period.
TABLE 2.
Comparison of incidences rate of mortality and morbidity among patients with CRD during COVID‐19 pandemic periods versus pre‐COVID‐19 pandemic period.
| Outcomes a | IRR (95% CI) b | p Value |
|---|---|---|
| All‐cause mortality | ||
| Initial COVID‐19 pandemic period: immediate impact | 0.966 (0.871, 1.071) | 0.510 |
| Initial COVID‐19 pandemic period: progressive impact | 1.005 (0.991, 1.020) | 0.478 |
| Post‐initial COVID‐19 pandemic period: immediate impact | 0.952 (0.870, 1.042) | 0.287 |
| Post‐initial COVID‐19 pandemic period: progressive impact | 1.019 (1.005, 1.034) | 0.007 |
| Respiratory‐related mortality | ||
| Initial COVID‐19 pandemic period: immediate impact | 0.927 (0.789, 1.088) | 0.353 |
| Initial COVID‐19 pandemic period: progressive impact | 1.013 (0.989, 1.037) | 0.280 |
| Post‐initial COVID‐19 pandemic period: immediate impact | 0.947 (0.867, 1.034) | 0.224 |
| Post‐initial COVID‐19 pandemic period: progressive impact | 1.032 (1.018, 1.045) | 0.000 |
| Nonrespiratory‐related mortality | ||
| Initial COVID‐19 pandemic period: immediate impact | 1.004 (0.902, 1.118) | 0.935 |
| Initial COVID‐19 pandemic period: progressive impact | 1.020 (1.006, 1.033) | 0.004 |
| Post‐initial COVID‐19 pandemic period: immediate impact | 1.137 (1.058, 1.223) | 0.001 |
| Post‐initial COVID‐19 pandemic period: progressive impact | 1.009 (1.000, 1.018) | 0.062 |
| Asthma attack | ||
| Initial COVID‐19 pandemic period: immediate impact | 0.594 (0.498, 0.708) | 0.000 |
| Initial COVID‐19 pandemic period: progressive impact | 1.024 (1.001, 1.048) | 0.044 |
| Post‐initial COVID‐19 pandemic period: immediate impact | 0.745 (0.674, 0.823) | 0.000 |
| Post‐initial COVID‐19 pandemic period: progressive impact | 1.059 (1.045, 1.072) | 0.000 |
| AECOPD | ||
| Initial COVID‐19 pandemic period: immediate impact | 0.607 (0.506, 0.728) | 0.000 |
| Initial COVID‐19 pandemic period: progressive impact | 1.013 (0.986, 1.040) | 0.356 |
| Post‐initial COVID‐19 pandemic period: immediate impact | 0.698 (0.630, 0.773) | 0.000 |
| Post‐initial COVID‐19 pandemic period: progressive impact | 1.026 (1.012, 1.041) | 0.000 |
| Pneumonia | ||
| Initial COVID‐19 pandemic period: immediate impact | 0.645 (0.546, 0.762) | 0.000 |
| Initial COVID‐19 pandemic period: progressive impact | 1.003 (0.976, 1.032) | 0.819 |
| Post‐initial COVID‐19 pandemic period: immediate impact | 0.573 (0.505, 0.650) | 0.000 |
| Post‐initial COVID‐19 pandemic period: progressive impact | 1.050 (1.034, 1.066) | 0.000 |
| Acute respiratory failure | ||
| Initial COVID‐19 pandemic period: immediate impact | 0.634 (0.553, 0.726) | 0.000 |
| Initial COVID‐19 pandemic period: progressive impact | 1.032 (1.014, 1.049) | 0.000 |
| Post‐initial COVID‐19 pandemic period: immediate impact | 0.878 (0.761, 1.012) | 0.073 |
| Post‐initial COVID‐19 pandemic period: progressive impact | 1.040 (1.008, 1.073) | 0.014 |
Abbreviations: AECOPD: acute exacerbations of chronic obstructive pulmonary disease; CI: confidence interval; CRD: chronic respiratory disease; IRR: incident rate ratio.
Change was estimated as the immediate or progressive changes compared with the “Pre‐COVID‐19 pandemic period” (January 2012–January 2020), “Initial COVID‐19 pandemic period” (February 2020–January 2021), and “Post‐initial COVID‐19 pandemic period” (February 2021–December 2021).
Unit of incidence rate: per 100,000 people.
FIGURE 1.
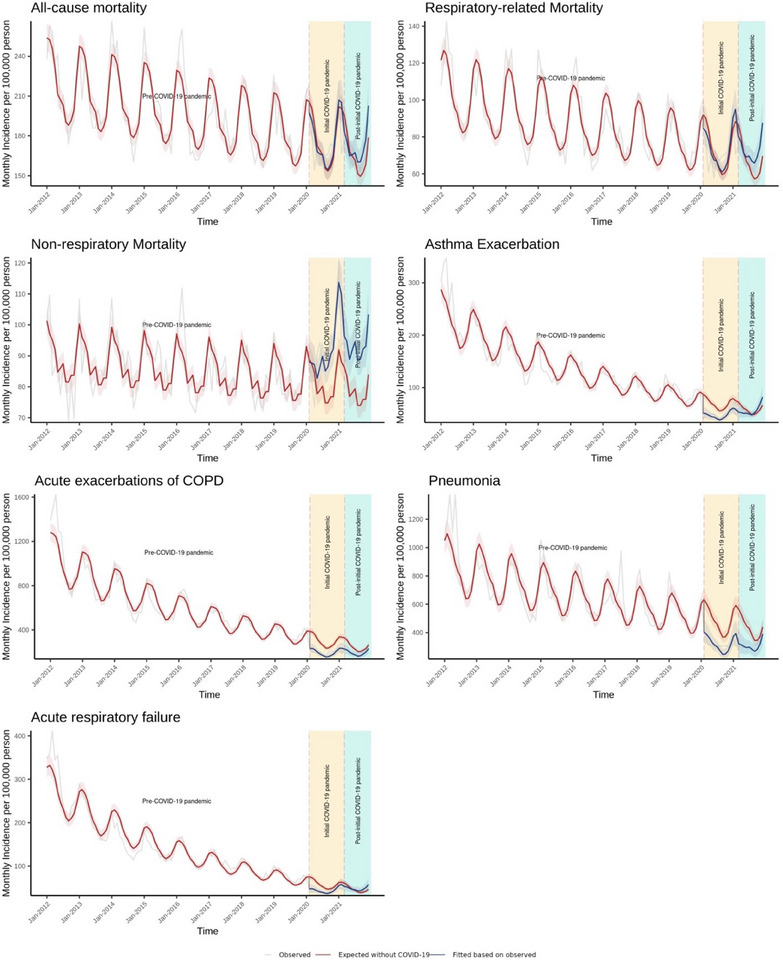
Association of COVID‐19 pandemic with the incidences rate of mortality and morbidity among patients with chronic respiratory diseases in Hong Kong, January 2012 to December 2021
Shaded areas represent 95% CI. COPD: chronic obstructive pulmonary disease.
Table 2 and Figure 1 illustrate the changes in the incidence rate of asthma exacerbation, AECOPD, pneumonia, and ARF. At the beginning of initial COVID‐19 pandemic period, an immediate decrease was observed in asthma exacerbation (0.594 (0.498, 0.708); p < 0.001), AECOPD (0.607 (0.506, 0.728); p < 0.001), pneumonia (0.645 (0.546, 0.762); p < 0.001), and ARF (0.634 (0.553, 0.726); p < 0.001). During the initial and post‐initial COVID‐19 pandemic periods, there were progressive increases in asthma exacerbation, pneumonia, and ARF, with rebounds to pre‐pandemic levels.
3.2. Healthcare Utilization
Table 3 and Figure 2 show changes in healthcare utilization rates over time. When the initial pandemic COVID‐19 period began, we observed immediate decreases in all healthcare services, including primary care clinics (0.832 (0.775, 0.892); p < 0.001), SOPCs (0.901 (0.848, 0.957); p = 0.001), hospital admission (0.739 (0.651, 0.839); p < 0.001), and A&E departments (0.727 (0.621, 0.850); p < 0.001). During the initial and post‐initial COVID‐19 pandemic periods, there were gradual rebounds across all service use, including primary care clinics, SOPCs, hospital admission, and A&E departments.
TABLE 3.
Comparison of healthcare utilization rates among patients with CRD during COVID‐19 pandemic periods versus pre‐COVID‐19 pandemic period.
| Outcomes a | IRR (95% CI) b | p Value |
|---|---|---|
| Primary care clinics | ||
| Initial COVID‐19 pandemic period: immediate impact | 0.832 (0.775, 0.892) | 0.000 |
| Initial COVID‐19 pandemic period: progressive impact | 1.003 (0.991, 1.015) | 0.618 |
| Post‐initial COVID‐19 pandemic period: immediate impact | 0.947 (0.893, 1.003) | 0.063 |
| Post‐initial COVID‐19 pandemic period: progressive impact | 0.994 (0.984, 1.004) | 0.275 |
| SOPC | ||
| Initial COVID‐19 pandemic period: immediate impact | 0.901 (0.848, 0.957) | 0.001 |
| Initial COVID‐19 pandemic period: progressive impact | 1.009 (0.999, 1.020) | 0.077 |
| Post‐initial COVID‐19 pandemic period: immediate impact | 1.055 (0.977, 1.139) | 0.170 |
| Post‐initial COVID‐19 pandemic period: progressive impact | 0.999 (0.985, 1.012) | 0.831 |
| Hospital admission | ||
| Initial COVID‐19 pandemic period: immediate impact | 0.739 (0.651, 0.839) | 0.000 |
| Initial COVID‐19 pandemic period: progressive impact | 1.020 (1.001, 1.040) | 0.041 |
| Post‐initial COVID‐19 pandemic period: immediate impact | 0.970 (0.923, 1.020) | 0.241 |
| Post‐initial COVID‐19 pandemic period: progressive impact | 1.010 (1.001, 1.018) | 0.021 |
| A&E | ||
| Initial COVID‐19 pandemic period: immediate impact | 0.727 (0.621, 0.850) | 0.000 |
| Initial COVID‐19 pandemic period: progressive impact | 1.013 (0.989, 1.038) | 0.282 |
| Post‐initial COVID‐19 pandemic period: immediate impact | 0.915 (0.868, 0.964) | 0.001 |
| Post‐initial COVID‐19 pandemic period: progressive impact | 1.016 (1.004, 1.029) | 0.011 |
Abbreviations: A&E: Accident and Emergency Department; CI: confidence interval; CRD: chronic respiratory disease; IRR: incident rate ratio; SOPC: specialist outpatient clinics; SOPC: specialist outpatient clinics.
Change was estimated as the immediate or progressive changes compared with the “Pre‐COVID‐19 pandemic period” (January 2012–January 2020), “Initial COVID‐19 pandemic period” (February 2020–January 2021), and “Post‐initial COVID‐19 pandemic period” (February 2021–December 2021).
Unit of incidence rate: per 1000 people.
FIGURE 2.
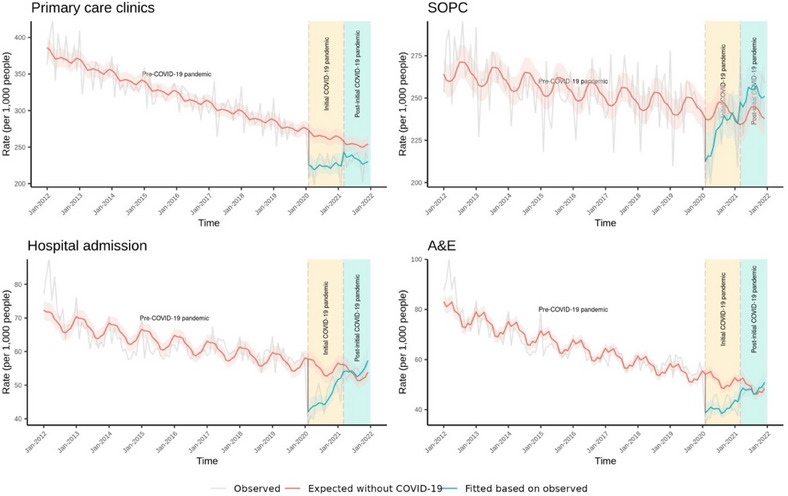
Association of COVID‐19 pandemic with the healthcare utilization rates among patients with chronic respiratory diseases in Hong Kong, January 2012 to December 2021
Shaded areas represent 95% CI. SOPC: specialist outpatient clinics; A&E: Accident and Emergency Department.
Similar results in health outcomes and healthcare utilization were observed in subgroup analyses for sex, age, and CCI groups (Tables S10–S15) and sensitivity analyses (Tables S3–S9).
4. Discussion
To the best of our knowledge, this was the first study to report mortality changes over a year from the onset of the COVID‐19 pandemic among patients with CRD who had no documented COVID‐19. We found an increasing trend in all‐cause mortality during the initial COVID‐19 pandemic period. Nonrespiratory mortality had a rising trend in the initial COVID‐19 pandemic period and was higher than the pre‐pandemic level during the initial COVID‐19 pandemic and post‐initial COVID‐19 pandemic periods. We observed that the respiratory mortality rate increased during the post‐initial COVID‐19 pandemic period when the incidence rate of respiratory complications rebounded. Healthcare utilization rates decreased across all services during the initial period. These findings suggest that the COVID‐19 pandemic had a potential indirect adverse effect on mortality among patients with CRD. A possible cause was the healthcare disruption and delayed access to care among these high‐risk patients, but further studies are required to explore the true mechanism.
During the initial COVID‐19 pandemic period, there were no significant changes in all‐cause mortality among people with CRD without prior confirmed COVID‐19. This contrasts with findings reported in Denmark, where a significant 17% reduction in all‐cause mortality was observed during the first 25 weeks of 2020 compared to the same period of 2019. The differences in the findings between this study and the Danish study may be attributed to several reasons. First, the observation period during the COVID‐19 pandemic was much longer in our study (February 2020 to February 2021) during which Hong Kong experienced four local waves with cyclical implementation and easing of social distancing & other containment measures than that of the Danish study (March 12 to May 20, 2020) when strict social distancing was in place at all times. Second, we used a much longer pre‐pandemic period between 2012 and 2019 to account for the trends prior to the pandemic than that used in the Danish study (March 12 to May 20, 2019). Third, the population in our study included patients with bronchitis (chronic bronchitis, acute bronchitis, and bronchiectasis), COPD, and asthma, while the Danish study only included patients with COPD.
We found the nonrespiratory mortality rate was higher than the pre‐pandemic level throughout the pandemic period. Recent research has shown that patients with CRD had a higher prevalence of comorbidities compared with those without CRD [23, 24, 25]. Comorbidities such as hypertension, diabetes, chronic kidney disease, cerebrovascular disease, cancer, and depression were prevalent among patients with CRDs [23]. These concurrent chronic diseases require routine medical care for monitoring and management to prevent or delay complications or disease progression [26, 27]. During the pandemic, these patients had to postpone or cancel regular doctor consultations and check‐ups due to restricted access to healthcare and fear of infection [28]. The disrupted routine healthcare may have led to suboptimal disease control and/or delayed detection and treatment for complications. Consequently, this may elevate their risk of mortality. Therefore, we recommend the need to maintain continuing healthcare for patients with CRD, particularly those with concurrent morbidities.
This study revealed a noteworthy reduction in asthma exacerbations and AECOPD during the initial COVID‐19 pandemic period in 2020, which was consistent with studies in New Zealand [7], the United Kingdom [6, 29], France [10], and Singapore [30]. In the post‐initial COVID‐19 pandemic period, no significant trend changes in AECOPD incidence rates were observed in this study, with rates remaining lower than those in the pre‐COVID‐19 pandemic period. This finding was largely consistent with recent literature reporting the admission rates for AECOPD in 2021 remained lower than those before the pandemic in France and Korea [31, 32]. Respiratory viruses have been recognized as triggers for pneumonia in patients with CRD [33, 34]. During the COVID‐19 pandemic, Hong Kong has implemented strict measures to control the transmission of SARS‐CoV‐2, including social distancing and universal mask‐wearing [13]. In early 2020, the percentage of people wearing facemasks in Hong Kong was over 90% [35]. Prior studies suggested social distancing was associated with significant declines in various respiratory virus infections, such as influenza [36, 37]. A retrospective study in Hong Kong has reported the incidence of pneumonia decreased among the general population during the first year of the pandemic when the strict public health policy was implemented [38]. The reduction in pneumonia incidences among people with CRD in the current study could partly be associated with these containment measures. Nevertheless, it is possible that while the incidence of respiratory complications decreased, the severity of cases might have been higher. Due to the unavailability of data on disease severity, we were unable to evaluate changes in the severity of respiratory complications before and during the pandemic. Further studies with disease severity are required to investigate the underlying mechanism.
Despite the overall decrease in the incidence rate of complications during the initial COVID‐19 pandemic period, we did not observe significant changes in respiratory‐related mortality rates in this period. This could be explained by the increase in in‐hospital mortality for respiratory diseases during the first year worldwide [10, 39, 40]. A cohort study in the United States including 8,448,758 admissions showed that mortality in the 30 days after admission due to pneumonia, COPD, and respiratory failure increased by 42%, 24%, and 19% throughout the first year of the pandemic, respectively [41]. The rise in in‐hospital mortality could be attributed to more severe disease at admission. Delayed seeking of medical care due to restricted access to healthcare services and fear of infection in hospital settings result in sicker illness and higher risks of mortality at admission [42, 43]. Moreover, we found an increasing trend of respiratory‐related mortality during the vaccination period, which can be attributed to the rebound of incidences of asthma exacerbations, pneumonia, and acute respiratory failure in the same period.
This study has several strengths and limitations. First, this study revealed that the disrupted healthcare from the pandemic may have increased the risk of all‐cause mortality in this population, especially those with comorbidities. The findings of this study can inform policymakers about post‐pandemic recovery and clinical management for future public health crises among patients with CRD. Second, this current study used a territory‐wide dataset with a large sample size of 587,049 individuals, allowing us to present the population‐level effect of the pandemic in patients with CRD and without COVID‐19. However, some limitations should also be acknowledged. First, we might not be able to exclude all COVID‐19 cases since some COVID‐19 cases were undiagnosed or asymptomatic. This could have introduced bias into this study, but the possibility was low during the initial COVID‐19 pandemic in Hong Kong when there was very strict reporting, quarantine, and contact tracing of COVID‐19 cases. Additionally, most of the deaths, asthma attacks, AECOPD, pneumonia, and ARF occurred during hospitalization in Hong Kong (Table S16), and all patients admitted to the hospital were required to undergo at least two PCR tests for SARS‐CoV‐2 infections, maximizing the identification of potential infected cases. Second, as is inherent in ITSA, there are limitations in making firm causal inferences due to the lack of a true control group that did not experience the COVID‐19 pandemic. Factors other than COVID‐19, such as natural fluctuations in healthcare resources, seasonal variations and policy changes, may have contributed to the observed outcomes, making it challenging to attribute observed outcomes solely to the pandemic. To reduce the impact of the aforementioned issue, we have employed a comparable control group using pre‐pandemic data to serve as the counterfactual scenario where the COVID‐19 pandemic did not occur. Future studies with more rigorous study designs, such as multiregional controlled studies, are required to examine the indirect effect of the COVID‐19 pandemic on mortality, complications, and healthcare utilization among patients with CRD. Third, we were unable to stratify the healthcare utilization data by respiratory‐related and nonrespiratory‐related since the specified reasons for health services visits are lacking in the raw data. Fourth, the effects of the post‐initial COVID‐19 pandemic period may continue for a long period, which the short duration of follow‐up in the present study may not have fully captured. Future studies with longer observation are warranted to identify the trend and patterns in mortality, complication, and healthcare utilization effectively, especially considering the varying effects of Omicron variants. Fifth, we were unable to conduct the subgroup analysis stratifying by race and region since these data were unavailable in the raw dataset. According to the Population Census conducted by the Hong Kong government, 92.0% and 91.6% of the population in 2016 and 2021 were Chinese, respectively [44]. Given the high proportion of Chinese in the population in Hong Kong, the race‐related confounding should be minimal. Additionally, Hong Kong is a small city with minimal regional variability. Although public hospitals are divided into seven geographical clusters, residents have access to the services from all clusters. All public hospitals in Hong Kong use a centralized electronic health record system and standardized clinical protocols, guidelines, and diagnosis coding, which has minimized regional variability in care quality or coding practices. Sixth, given that Hong Kong has unique healthcare systems, infection control measures during the COVID‐19 pandemic, healthcare seeking behaviours, and population characteristics, applying the findings of this study to other regions requires caution. Future studies with multiregional designs should be conducted to comprehensively understand the mortality, complications and healthcare utilization changes of patients with CRD during the pandemic worldwide. Seventh, the shifts in clinical attention to respiratory conditions during the COVID‐19 pandemic may have influenced the diagnostic coding for CRD. We analyzed longitudinal trends in CRD diagnoses before and during the COVID‐19 pandemic. The stable increasing trend of CRD diagnoses suggests no abrupt inflation in diagnostic coding for CRD during the COVID‐19 pandemic. The potential influence of heightened attention on respiratory diagnoses is possible but should be minimal. Lastly, since we cannot access actual clinical records, the accuracy of diagnostic coding for CRD cannot be verified in this study. Moreover, there might be potential misclassification bias in differentiating respiratory and nonrespiratory mortality. Nevertheless, previous validation studies reported a high overall positive predictive value of 85.0%–92.7% for CRD diagnostic coding within the electronic health records in the Hospital Authority in Hong Kong, suggesting the diagnostic coding for CRD was reliable for research [45, 46]. Future studies should consider implementing standardized diagnostic coding practices and verifying data by cross‐checking with clinical records, to enhance data accuracy and reliability.
In conclusion, the mortality rates, particularly nonrespiratory mortality, among patients with CRD increased during the first two years of the pandemic, which could have been a result of healthcare disruption and delayed access to care among these high‐risk patients. Assurance of sufficient allocation of healthcare resources to patients with CRD, particularly those with comorbidities, should be a priority during future public health crises. Contingency plans on continuing follow‐up and monitoring of patients with CRD are needed, for example, teleconsultations, shared primary care, and tele‐reminders on red‐flag symptoms for patients with CRD, when healthcare services may be disrupted during public health crises.
Disclosure
EYFW has received research grants from the Health Bureau, the Hong Kong Research Grants Council, Narcotics Division, Security Bureau, Social Welfare Department, Labour and Welfare Bureau of the Government of the Hong Kong SAR and National Natural Science Foundation of China; serves on member of Core Team for Expert Group on Drug Registration of Pharmacy and Poisons Board, and is the director of Advance Data Analytics for Medical Science (ADAMS) Limited (HK). These are outside the submitted work. I.C.K.W. received research grants from Amgen, Janssen, GSK, Novartis, Pfizer, Bayer and Bristol‐Myers Squibb and Takeda, Institute for Health Research in England, European Commission, National Health and Medical Research Council in Australia, The European Union’s Seventh Framework Programme for research, technological development, Research Grants Council Hong Kong and Health and Medical Research Fund Hong Kong; consulting fees from IQVIA and World Health Organization; payment for expert testimony for Appeal Court in Hong Kong; serves on advisory committees for Member of Pharmacy and Poisons Board; is a member of the Expert Committee on Clinical Events Assessment Following COVID‐19 Immunization; is a member of the Advisory Panel on COVID‐19 Vaccines of the Hong Kong Government; is the non‐executive director of Jacobson Pharma Corp. Ltd. in Hong Kong; and is the founder and director of Therakind Limited (UK), Advance Data Analytics for Medical Science (ADAMS) Limited (HK) and OCUS Innovation Limited (HK, Ireland and UK).
Ethics Statement
This study was approved by the Severance Hospital Institutional Review Board (IRB No. 4‐2022‐0248) and the Institutional Review Board of the University of Hong Kong Hospital Authority Hong Kong West Cluster (ref.: UW 21–297).
Conflicts of Interest
The authors declare no conflicts of interest.
Supporting information
Supplementary Table 1. ICD‐9‐CM, ICPC‐2, and ICD‐10‐CM Codes Used to Define Patients With CRD and Complications, Cause of Death.
Supplementary Table 2. ICD‐9‐CM Codes Used to Calculate the Charlson Comorbidity Index.
Supplementary Table 3. Sensitivity Analysis on Comparison of Incidences of Mortality and Morbidity Among Patients with CRD During the COVID‐19 Pandemic Periods Versus Pre‐COVID‐19 Pandemic Period with 6‐ and 12‐month Periods of Seasonality.
Supplementary Table 4. Sensitivity Analysis on Comparison of Healthcare Utilization Rates among Patients with CRD During the COVID‐19 Pandemic Periods Versus Pre‐COVID‐19 Pandemic Period Using 6‐ and 12‐Month Periods of Seasonality.
Supplementary Table 5. Sensitivity Analysis on Comparison of Incidences of Mortality and Morbidity Among Patients with CRD During the COVID‐19 Pandemic Periods Versus Pre‐COVID‐19 Pandemic Period Using Generalized Linear Model.
Supplementary Table 6. Sensitivity Analysis on Comparison of Healthcare Utilization Rates among Patients with CRD During the COVID‐19 Pandemic Periods Versus Pre‐COVID‐19 Pandemic Period Using Generalized Linear Model.
Supplementary Table 7. Sensitivity Analysis on Comparison of Incidences of Mortality Among Patients with CRD During the COVID‐19 Pandemic Periods Versus Pre‐COVID‐19 Pandemic Period with 6‐Month Washout Period or No Washout Period.
Supplementary Table 8. Sensitivity Analysis on Comparison of Incidences of Mortality Among Patients with CRD During the COVID‐19 Pandemic Periods Versus Pre‐COVID‐19 Pandemic Period with Exclusion of CRD Patients with Pneumonia.
Supplementary Table 9. Sensitivity Analysis on Comparison of Incidences of Mortality and Morbidity Among Patients with CRD During the COVID‐19 Pandemic Periods Versus Pre‐COVID‐19 Pandemic Period with Adjustment of the First Breakpoint Time from February 2020 to December 2019.
Supplementary Table 10. Subgroup Analysis on Comparison of Incidences of Mortality and Morbidity Among Patients with CRD During the COVID‐19 Pandemic Periods Versus Pre‐COVID‐19 Pandemic Period Stratified by Sex.
Supplementary Table 11. Subgroup Analysis on Comparison of Healthcare Utilization Rates Among Patients with CRD During the COVID‐19 Pandemic Periods Versus Pre‐COVID‐19 Pandemic Period Stratified by Sex.
Supplementary Table 12. Subgroup Analysis on Comparison of Incidences of Mortality and Morbidity Among Patients with CRD During the COVID‐19 Pandemic Periods Versus Pre‐COVID‐19 Pandemic Period Stratified by Age.
Supplementary Table 13. Subgroup Analysis on Comparison of Healthcare Utilization Rates Among Patients with CRD During the COVID‐19 Pandemic Periods Versus Pre‐COVID‐19 Pandemic Period Stratified by Age.
Supplementary Table 14. Subgroup Analysis on Comparison of Incidences of Mortality and Morbidity Among Patients with CRD During the COVID‐19 Pandemic Periods Versus Pre‐COVID‐19 Pandemic Period Stratified by CCI.
Supplementary Table 15. Subgroup Analysis on Comparison of Healthcare Utilization Rates Among Patients with CRD During the COVID‐19 Pandemic Periods Versus Pre‐COVID‐19 Pandemic Period Stratified by CCI.
Supplementary Table 16. Proportion of Complications and Mortality Diagnosed During Hospitalization Among Patients with CRD Over Time.
Qi Kang and Yuk Kam Yau contributed equally.
Funding: This work was supported by the Commissioned Research on the Novel Coronavirus Disease (COVID‐19), Health and Medical Research Fund, Health Bureau of Hong Kong, Reference No: COVID19F08.
References
- 1. GBD 2019 Chronic Respiratory Diseases Collaborators . “Global Burden of Chronic Respiratory Diseases and Risk Factors, 1990–2019: An Update From the Global Burden of Disease Study 2019.” EClinicalMedicine 59, (2023): 101936. [DOI] [PMC free article] [PubMed] [Google Scholar]
- 2. Janson C., Johansson G., Stallberg B., et al., “Identifying the Associated Risks of Pneumonia in COPD Patients: ARCTIC an Observational Study,” Respiratory Research 19, no. 1 (2018): 172. [DOI] [PMC free article] [PubMed] [Google Scholar]
- 3. Zaidi S. R. and Blakey J. D., “Why Are People With Asthma Susceptible to Pneumonia? A Review of Factors Related to Upper Airway Bacteria,” Respirology (Carlton, Vic.) 24, no. 5 (2019): 423–430. [DOI] [PubMed] [Google Scholar]
- 4.Global Initiative for Chronic Obstructive Lung Disease (GOLD) , Global Strategy for Prevention, Diagnosis and Management of COPD: 2023 Report, https://goldcopd.org/2023‐gold‐report‐2/.
- 5. The British Thoracic Society , BTS/SIGN British Guideline on the Management of Asthma , https://www.brit‐thoracic.org.uk/quality‐improvement/guidelines/asthma/.
- 6. Alsallakh M. A., Sivakumaran S., Kennedy S., et al., “Impact of COVID‐19 Lockdown on the Incidence and Mortality of Acute Exacerbations of Chronic Obstructive Pulmonary Disease: National Interrupted Time Series Analyses for Scotland and Wales,” BMC Medicine [Electronic Resource] 19, no. 1 (2021): 124. [DOI] [PMC free article] [PubMed] [Google Scholar]
- 7. Chan A. H. Y., Tomlin A., Chan E., Harrison J., and Beyene K. A., “Effect of the COVID‐19 Pandemic on Asthma Exacerbations in New Zealand: An Interrupted Time Series Analysis,” Journal of Allergy and Clinical Immunology: Global 2, no. 4 (2023): 100157. [DOI] [PMC free article] [PubMed] [Google Scholar]
- 8. Saeed M. I., Sivapalan P., Eklof J., et al., “Social Distancing in Relation to Severe Exacerbations of Chronic Obstructive Pulmonary Disease: A Nationwide Semi‐Experimental Study During the COVID‐19 Pandemic,” American Journal of Epidemiology 191, no. 5 (2022): 874–885. [DOI] [PMC free article] [PubMed] [Google Scholar]
- 9. Sarc I., Lotric Dolinar A., Morgan T., Sambt J., Ziherl K., Gavric D., et al., “Mortality, Seasonal Variation, and Susceptibility to Acute Exacerbation of COPD in the Pandemic Year: A Nationwide Population Study,” Therapeutic Advances in Respiratory Disease 16 (2022): 17534666221081047. [DOI] [PMC free article] [PubMed] [Google Scholar]
- 10. Poucineau J., Delory T., Lapidus N., et al., “Hospital Admissions and Mortality for Acute Exacerbations of COPD During the COVID‐19 Pandemic: A Nationwide Study in France,” Frontiers in Medicine (Lausanne) 9 (2022): 995016. [DOI] [PMC free article] [PubMed] [Google Scholar]
- 11. Shah S. A., Quint J. K., Nwaru B. I., and Sheikh A., “Impact of COVID‐19 National Lockdown on Asthma Exacerbations: Interrupted Time‐Series Analysis of English Primary Care Data,” Thorax 76, no. 9 (2021): 860–866. [DOI] [PMC free article] [PubMed] [Google Scholar]
- 12. Lam H. Y., Lam T. S., Wong C. H., et al., “The Epidemiology of COVID‐19 Cases and the Successful Containment Strategy in Hong Kong‐January to May 2020,” International Journal of Infectious Diseases 98 (2020): 51–58. [DOI] [PMC free article] [PubMed] [Google Scholar]
- 13. Burki T., “Hong Kong's Fifth COVID‐19 Wave—The Worst yet,” The Lancet Infectious Diseases 22, no. 4 (2022): 455–456. [DOI] [PMC free article] [PubMed] [Google Scholar]
- 14. Health Authority, Introduction: Caring for Our Community's Health (Health Authority, 2024).
- 15. Statistics Canada, Age‐Standardized Rates (Statistics Canada, 2023).
- 16. Chen L. L., Abdullah S. M. U., Chan W. M., et al., “Contribution of Low Population Immunity to the Severe Omicron BA.2 Outbreak in Hong Kong,” Nature Communications 13, no. 1 (2022): 3618. [DOI] [PMC free article] [PubMed] [Google Scholar]
- 17. Ver Hoef J. M. and Boveng P. L., “Quasi‐Poisson vs. Negative Binomial Regression: How Should We Model Overdispersed Count Data?,” Ecology 88, no. 11 (2007): 2766–2772. [DOI] [PubMed] [Google Scholar]
- 18. Zee J. S. T., Chan C. T. L., Leung A. C. P., et al., “Rapid Antigen Test During a COVID‐19 Outbreak in a Private Hospital in Hong Kong,” Hong Kong Medical Journal 28, no. 4 (2022): 300–305. [DOI] [PubMed] [Google Scholar]
- 19. Höfler M., “Causal Inference Based on Counterfactuals,” BioMed Central Medical Research Methodology 5, no. 1 (2005): 28. [DOI] [PMC free article] [PubMed] [Google Scholar]
- 20. Charlson M. E., Pompei P., Ales K. L., and MacKenzie C. R., “A New Method of Classifying Prognostic Comorbidity in Longitudinal Studies: Development and Validation,” Journal of Chronic Diseases 40, no. 5 (1987): 373–383. [DOI] [PubMed] [Google Scholar]
- 21. Degli Esposti L., Perrone V., Sangiorgi D., Andretta M., Bartolini F., Cavaliere A., et al., “The Use of Oral Amino‐Bisphosphonates and Coronavirus Disease 2019 (COVID‐19) Outcomes,” Journal of Bone and Mineral Research 36, no. 11 (2021): 2177–2183. [DOI] [PMC free article] [PubMed] [Google Scholar]
- 22. Giordani B., Burgio A., Grippo F., Barone A., Eugeni E., and Baglio G., “The Use of ICD‐9‐CM Coding to Identify COVID‐19 Diagnoses and Determine Risk Factors for 30‐Day Death Rate in Hospitalized Patients in Italy: Retrospective Study,” Journal of Medical Internet Research Public Health and Surveillance 10 (2024): e44062. [DOI] [PMC free article] [PubMed] [Google Scholar]
- 23. Greulich T., Weist B. J. D., Koczulla A. R., et al., “Prevalence of Comorbidities in COPD Patients by Disease Severity in a German Population,” Respiratory Medicine 132 (2017): 132–138. [DOI] [PubMed] [Google Scholar]
- 24. Smith M. C. and Wrobel J. P., “Epidemiology and Clinical Impact of Major Comorbidities in Patients With COPD,” International Journal of Chronic Obstructive Pulmonary Disease 9 (2014): 871–888. [DOI] [PMC free article] [PubMed] [Google Scholar]
- 25. Gershon A. S., Wang C., Guan J., and To T., “Burden of Comorbidity in Individuals With Asthma,” Thorax 65, no. 7 (2010): 612–618. [DOI] [PubMed] [Google Scholar]
- 26. Stevens P. E., Ahmed S. B., Carrero J. J., et al., “KDIGO 2024 Clinical Practice Guideline for the Evaluation and Management of Chronic Kidney Disease,” Kidney International 105, no. 4 (2024): S117–S314. [DOI] [PubMed] [Google Scholar]
- 27. Whelton Paul K., Carey Robert M., Aronow Wilbert S., et al., “2017 ACC/AHA/AAPA/ABC/ACPM/AGS/APhA/ASH/ASPC/NMA/PCNA Guideline for the Prevention, Detection, Evaluation, and Management of High Blood Pressure in Adults,” Journal of the American College of Cardiology 71, no. 19 (2018): e127–e248. [DOI] [PubMed] [Google Scholar]
- 28. Czeisler M. E., Marynak K., Clarke K. E. N., et al., “Delay or Avoidance of Medical Care Because of COVID‐19‐Related Concerns—United States, June 2020,” Mmwr Morbidity and Mortality Weekly Report 69, no. 36 (2020): 1250–1257. [DOI] [PMC free article] [PubMed] [Google Scholar]
- 29. Shah S. A., Quint J. K., and Sheikh A., “Impact of COVID‐19 Pandemic on Asthma Exacerbations: Retrospective Cohort Study of Over 500,000 Patients in a National English Primary Care Database,” Lancet Regional Health— Europe 19 (2022): 100428. [DOI] [PMC free article] [PubMed] [Google Scholar]
- 30. Wee L. E., Conceicao E. P., Tan J. Y., Sim J. X. Y., and Venkatachalam I., “Reduction in Asthma Admissions During the COVID‐19 Pandemic: Consequence of Public Health Measures in Singapore,” European Respiratory Journal 57, no. 4 (2021): 2004493. [DOI] [PMC free article] [PubMed] [Google Scholar]
- 31. Bourdin A., Ahmed E., Vachier I., et al., “Hospitalizations for Chronic Obstructive Pulmonary Disease Exacerbation during COVID‐19,” JAMA Network Open 7, no. 5 (2024): e2412383. [DOI] [PMC free article] [PubMed] [Google Scholar]
- 32. Kim S. J., Kim T., Choi H., et al., “Respiratory Pathogen and Clinical Features of Hospitalized Patients in Acute Exacerbation of Chronic Obstructive Pulmonary Disease After COVID 19 Pandemic,” Scientific Reports 14, no. 1 (2024): 10462. [DOI] [PMC free article] [PubMed] [Google Scholar]
- 33. Pavia A. T., “What Is the Role of respiratory Viruses in Community‐Acquired Pneumonia?: What Is the Best Therapy for Influenza and Other Viral Causes of Community‐acquired Pneumonia?,” Infectious Disease Clinics of North America 27, no. 1 (2013): 157–175. [DOI] [PMC free article] [PubMed] [Google Scholar]
- 34. Lieberman D., Shimoni A., Shemer‐Avni Y., Keren‐Naos A., Shtainberg R., and Lieberman D., “Respiratory Viruses in Adults With Community‐Acquired Pneumonia,” Chest 138, no. 4 (2010): 811–816. [DOI] [PMC free article] [PubMed] [Google Scholar]
- 35. Cowling B. J., Ali S. T., Ng T. W. Y., et al., “Impact Assessment of Non‐Pharmaceutical Interventions Against Coronavirus Disease 2019 and Influenza in Hong Kong: An Observational Study,” Lancet Public Health 5, no. 5 (2020): e279–e288. [DOI] [PMC free article] [PubMed] [Google Scholar]
- 36. Ahmed F., Zviedrite N., and Uzicanin A., “Effectiveness of Workplace Social Distancing Measures in Reducing Influenza Transmission: A Systematic Review,” BMC Public Health [Electronic Resource] 18, no. 1 (2018): 518. [DOI] [PMC free article] [PubMed] [Google Scholar]
- 37. Kim M. C., Kweon O. J., Lim Y. K., Choi S. H., Chung J. W., and Lee M. K., “Impact of Social Distancing on the Spread of Common respiratory Viruses During the Coronavirus Disease Outbreak,” PLoS ONE 16, no. 6 (2021): e0252963. [DOI] [PMC free article] [PubMed] [Google Scholar]
- 38. Chan K. F., Ma T. F., Ip M. S., and Ho P. L., “Invasive Pneumococcal Disease, Pneumococcal Pneumonia and All‐Cause Pneumonia in Hong Kong During the COVID‐19 Pandemic Compared With the Preceding 5 Years: A Retrospective Observational Study,” British Medical Journal Open 11, no. 10 (2021): e055575. [DOI] [PMC free article] [PubMed] [Google Scholar]
- 39. Farrugia Y., Spiteri Meilak B. P., Grech N., et al., “The Impact of COVID‐19 on Hospitalised COPD Exacerbations in Malta,” Pulmonary Medicine 2021 (2021): 5533123. [DOI] [PMC free article] [PubMed] [Google Scholar]
- 40. Albuquerque D. A. R., Melo M. D. T., Sousa T. L. F., Normando P. G., and Fagundes J. G. M., “Araujo‐Filho JAB. Hospital Admission and Mortality Rates for Non‐COVID‐19 Respiratory Diseases in Brazil's Public Health System During the Covid‐19 Pandemic: A Nationwide Observational Study,” Jornal Brasileiro de Pneumologia 49, no. 1 (2023): e20220093. [DOI] [PMC free article] [PubMed] [Google Scholar]
- 41. Dang A., Thakker R., Li S., Hommel E., Mehta H. B., and Goodwin J. S., “Hospitalizations and Mortality from Non‐SARS‐CoV‐2 Causes Among Medicare Beneficiaries at US Hospitals During the SARS‐CoV‐2 Pandemic,” JAMA Network Open 5, no. 3 (2022): e221754. [DOI] [PMC free article] [PubMed] [Google Scholar]
- 42. Kondilis E., Tarantilis F., and Benos A., “Essential Public Healthcare Services Utilization and Excess Non‐COVID‐19 Mortality in Greece,” Public Health 198 (2021): 85–88. [DOI] [PMC free article] [PubMed] [Google Scholar]
- 43. Nagamine M., Chow D. S., Chang P. D., Boden‐Albala B., Yu W., and Soun J. E., “Impact of COVID‐19 on Acute Stroke Presentation at a Comprehensive Stroke Center,” Frontiers in Neurology 11 (2020): 850. [DOI] [PMC free article] [PubMed] [Google Scholar]
- 44. The Government of the Hong Kong Special Administrative Region , 2021 Population Census. Available from:, https://www.censtatd.gov.hk/en/scode600.html.
- 45. Kwok W. C., Tam T. C. C., Sing C. W., Chan E. W. Y., and Cheung C. L., “Validation of Diagnostic Coding for Bronchiectasis in an Electronic Health Record System in Hong Kong,” Pharmacoepidemiology and Drug Safety 32, no. 10 (2023): 1077–1082. [DOI] [PubMed] [Google Scholar]
- 46. Kwok W. C., Tam T. C. C., Sing C. W., Chan E. W. Y., and Cheung C. L., “Validation of Diagnostic Coding for Asthma in an Electronic Health Record System in Hong Kong,” Journal of Asthma and Allergy 16 (2023): 315–321. [DOI] [PMC free article] [PubMed] [Google Scholar]
Associated Data
This section collects any data citations, data availability statements, or supplementary materials included in this article.
Supplementary Materials
Supplementary Table 1. ICD‐9‐CM, ICPC‐2, and ICD‐10‐CM Codes Used to Define Patients With CRD and Complications, Cause of Death.
Supplementary Table 2. ICD‐9‐CM Codes Used to Calculate the Charlson Comorbidity Index.
Supplementary Table 3. Sensitivity Analysis on Comparison of Incidences of Mortality and Morbidity Among Patients with CRD During the COVID‐19 Pandemic Periods Versus Pre‐COVID‐19 Pandemic Period with 6‐ and 12‐month Periods of Seasonality.
Supplementary Table 4. Sensitivity Analysis on Comparison of Healthcare Utilization Rates among Patients with CRD During the COVID‐19 Pandemic Periods Versus Pre‐COVID‐19 Pandemic Period Using 6‐ and 12‐Month Periods of Seasonality.
Supplementary Table 5. Sensitivity Analysis on Comparison of Incidences of Mortality and Morbidity Among Patients with CRD During the COVID‐19 Pandemic Periods Versus Pre‐COVID‐19 Pandemic Period Using Generalized Linear Model.
Supplementary Table 6. Sensitivity Analysis on Comparison of Healthcare Utilization Rates among Patients with CRD During the COVID‐19 Pandemic Periods Versus Pre‐COVID‐19 Pandemic Period Using Generalized Linear Model.
Supplementary Table 7. Sensitivity Analysis on Comparison of Incidences of Mortality Among Patients with CRD During the COVID‐19 Pandemic Periods Versus Pre‐COVID‐19 Pandemic Period with 6‐Month Washout Period or No Washout Period.
Supplementary Table 8. Sensitivity Analysis on Comparison of Incidences of Mortality Among Patients with CRD During the COVID‐19 Pandemic Periods Versus Pre‐COVID‐19 Pandemic Period with Exclusion of CRD Patients with Pneumonia.
Supplementary Table 9. Sensitivity Analysis on Comparison of Incidences of Mortality and Morbidity Among Patients with CRD During the COVID‐19 Pandemic Periods Versus Pre‐COVID‐19 Pandemic Period with Adjustment of the First Breakpoint Time from February 2020 to December 2019.
Supplementary Table 10. Subgroup Analysis on Comparison of Incidences of Mortality and Morbidity Among Patients with CRD During the COVID‐19 Pandemic Periods Versus Pre‐COVID‐19 Pandemic Period Stratified by Sex.
Supplementary Table 11. Subgroup Analysis on Comparison of Healthcare Utilization Rates Among Patients with CRD During the COVID‐19 Pandemic Periods Versus Pre‐COVID‐19 Pandemic Period Stratified by Sex.
Supplementary Table 12. Subgroup Analysis on Comparison of Incidences of Mortality and Morbidity Among Patients with CRD During the COVID‐19 Pandemic Periods Versus Pre‐COVID‐19 Pandemic Period Stratified by Age.
Supplementary Table 13. Subgroup Analysis on Comparison of Healthcare Utilization Rates Among Patients with CRD During the COVID‐19 Pandemic Periods Versus Pre‐COVID‐19 Pandemic Period Stratified by Age.
Supplementary Table 14. Subgroup Analysis on Comparison of Incidences of Mortality and Morbidity Among Patients with CRD During the COVID‐19 Pandemic Periods Versus Pre‐COVID‐19 Pandemic Period Stratified by CCI.
Supplementary Table 15. Subgroup Analysis on Comparison of Healthcare Utilization Rates Among Patients with CRD During the COVID‐19 Pandemic Periods Versus Pre‐COVID‐19 Pandemic Period Stratified by CCI.
Supplementary Table 16. Proportion of Complications and Mortality Diagnosed During Hospitalization Among Patients with CRD Over Time.