

Abstract
Background
Atherosclerosis (AS) is increasingly recognized as a chronic inflammatory disease that significantly compromises vascular health and serves as a major contributor to cardiovascular diseases. KLRD1 is a gene that encodes a protein involved in the immune system, specifically in the function of natural killer (NK) cells.
Methods
KLRD1 was identified as a focal point through an integrative analysis of DEGs across multiple datasets (GSE43292 and GSE9820) from the GEO database, aligned with immune-related gene sets from the ImmPort database. Advanced analytical tools, including Lasso regression and SVM-RFE, were employed to refine our gene selection. We further applied GSEA and GSVA to these gene sets, revealing significant enrichment in immune-related pathways. The relationship between KLRD1 expression and immune processes was examined using CIBERSORT and ESTIMATE algorithms to assess tumor microenvironment characteristics, suggesting increased immune cell infiltration associated with higher KLRD1 expression. Validation of these findings was conducted using data from the GSE9820 dataset.
Results
Among 340 DEGs linked with KLRD1, 13 were identified as hub genes through LASSO and SVM-RFE analyses. Functional assays highlighted KLRD1's role in mononuclear cell differentiation, regulation of cell–cell adhesion, regulation of T cell activation. A Lollipop was created to display the expression patterns of Correlation Coefficient. T cells CD8, Plasma cells, Dendritic cells activated, T cells CD4 memory resting, T cells CD4 memory activated, T cells gamma delta.
Conclusions
This research elucidates the complex relationship between KLRD1 and AS, underscoring its potential as a novel biomarker for diagnosing and monitoring the disease.
Supplementary Information
The online version contains supplementary material available at 10.1186/s13019-025-03473-z.
Keywords: Coronary Atherosclerosis (AS), KLRD1, Lasso regression, SVM-RFE, Autoimmune inflammatory disorder
Introduction
Coronary artery disease (CAD) remains a leading cause of global mortality, responsible for nearly 18 million deaths in 2017, with projections reaching 23.4 million by 2030 [1]. Its pathogenesis is tightly linked to atherosclerotic plaque formation, culminating in coronary obstruction, myocardial ischemia, and necrosis, thereby escalating the risk of acute cardiovascular syndromes (ACS) [2]. The prevalence of atherosclerosis (AS) has surged in recent years, largely attributed to diets rich in fats and sugars but deficient in fiber, posing significant public health challenges [3]. AS is a chronic inflammatory disease initiated by the infiltration and retention of low-density lipoprotein (LDL) within the arterial intima, fostering plaque formation through complex interactions between LDL deposits and immune cells. Despite extensive research, the genomic regulatory mechanisms underlying AS remain incompletely understood [4]. Metabolism, a fundamental driver of cellular function, is increasingly recognized as a critical determinant in disease pathogenesis, spanning metabolic, oncological, and cardiovascular disorders [5]. Dysregulated metabolic pathways are a hallmark of these conditions, with emerging evidence highlighting intricate links between metabolic perturbations and disease progression [6]. Notably, metabolism plays a pivotal role in immune regulation, shaping immune cell differentiation, activation, and function [7]. Disruptions in immune cell metabolism are now implicated in autoimmune diseases, chronic inflammation, and impaired host defense, underscoring metabolism as both a key modulator and a potential therapeutic target in inflammatory pathologies [8].
KLRD1 (Killer Cell Lectin Like Receptor D1) is a gene that encodes a protein involved in the immune system, specifically in the function of natural killer (NK) cells. NK cells are critical components of the innate immune response, playing a vital role in identifying and eliminating virally infected cells and tumor cells [9]. The KLRD1 gene encodes the CD94 protein, which forms a heterodimer with NKG2 receptors on the surface of NK cells. This heterodimer is essential for the recognition of HLA-E molecules on target cells, a process that modulates the cytotoxic activity of NK cells [10]. Through interactions with HLA-E, KLRD1 contributes to the balance between activating and inhibitory signals that regulate NK cell function. Recent studies have highlighted the significance of KLRD1 expression in various pathological conditions, including infectious diseases, cancer, and autoimmune disorders. Elevated levels of KLRD1 have been associated with enhanced NK cell activity, suggesting a potential role in anti-tumor immunity [11]. Conversely, altered KLRD1 expression or function may contribute to immune evasion by tumors and chronic infections. Furthermore, genetic variations in KLRD1 have been investigated for their potential impact on NK cell-mediated responses [12]. Understanding the molecular mechanisms underlying KLRD1 function and regulation may provide valuable insights into the development of novel immunotherapeutic strategies aimed at harnessing NK cells for clinical applications. In conclusion, KLRD1 is a crucial gene in the regulation of NK cell activity, with significant implications for immune surveillance and potential therapeutic interventions. Continued research into the role of KLRD1 and its interactions with other immune components will further elucidate its contribution to human health and disease.
Recent advances in cancer research have unveiled a distinct metabolic phenotype intrinsic to tumor cells, fundamentally reshaping the immune microenvironment. Characterized by cellular heterogeneity and resource limitations due to inadequate vascularization, this dysregulated milieu has renewed interest in the role of non-neoplastic immune components within the tumor ecosystem [13]. Emerging evidence highlights the profound impact of oncogenic transformation in reprogramming tumor metabolism, thereby exerting extensive influence on immune dynamics. The immune microenvironment constitutes a complex interplay of diverse cellular subsets embedded within a disrupted extracellular matrix, marked by hypoxia, nutrient deprivation, and aberrant vasculature [14]. Notably, the increasing recognition of immune infiltration in non-malignant regions underscores the intricate crosstalk between immune responses and tumor-associated metabolic rewiring. This landscape is shaped by nutrient scarcity, elevated oxygen consumption, and the accumulation of reactive nitrogen and oxygen species, all of which critically modulate immune cell function and proliferation [15]. The metabolic constraints imposed by the microenvironment thus emerge as key determinants of immune efficacy, positioning metabolic pathway modulation as a promising adjunct to immunotherapy. Deciphering the intricate interplay between metabolism and immune regulation is therefore pivotal for advancing cancer immunotherapy [16]. The integration of high-throughput data analytics and bioinformatics is transforming our ability to dissect gene function networks across diverse disease contexts, providing unprecedented insights into molecular mechanisms [17]. The wealth of transcriptomic sequencing data, coupled with clinical findings from large-scale initiatives such as the AS Initiative, offers a powerful framework for interrogating transcriptional perturbations and associated molecular cascades in AS [18, 19]. However, a critical gap persists in leveraging bioinformatics approaches to systematically decode AS within its complex disease landscape. This study aims to address this gap by analyzing AS-related datasets from the GEO repository, with a focus on delineating the intricate molecular architecture of AS. By leveraging advanced computational methodologies, we seek to unravel the underlying molecular networks and signaling pathways that drive AS pathogenesis, paving the way for potential therapeutic strategies (Fig. 1).
Fig. 1.

Framework
Materials and methods
We used the approaches proposed by Zi-Xuan Wu, et al. 2023 [20]. This study harnessed publicly available GEO datasets to elucidate the role of GlnMgs in Alzheimer’s disease (AD). Differential expression analysis and risk model construction were performed using GSE132903 as the primary dataset, with GSE63060 serving for validation and classification refinement. Prognosis-associated GlnMgs were identified, and their biological functions were delineated through GO and KEGG pathway analyses, as well as GSEA. Additionally, immune cell infiltration, functional pathway dynamics, and RNA expression alterations were systematically examined, offering a comprehensive insight into the involvement of GlnMgs in AD pathogenesis.
Transcriptional profiling data and determination of differentially expressed genes (DEGs)
The GEO, established and maintained by the NCBI of the United States, is a comprehensive database dedicated to the collection and storage of high-throughput gene expression data submitted by research institutions worldwide. This database encompasses gene expression results derived from various technologies such as microarray chips and second-generation sequencing, with all data being publicly accessible. Since its inception in 2000, GEO has evolved into an international public repository, serving as an invaluable tool for researchers. We selected datasets from the GEO. Strategy for searching (‘Atherosclerosis’ [MeSH] and miRNA [All Fields] and normal) AND (‘Homo sapiens’ [Organism] AND ‘Non-coding RNA profiling by array’ [Filter]). The following were the inclusion criteria: Plasma miRNA levels in AS patients and No-AS persons.
In cases where multiple probes corresponded to a single gene, the arithmetic mean of these probe values was calculated to represent the gene’s final expression level. The Sva and Limma [21] of R4.1.0 [22] were then employed exclusively for multi-chips data rectification (batch normalize). Subsequent to the standardization of the datasets, batch effect normalization was executed employing the SVA package. The efficacy of batch effect rectification was gauged through PCA (Principal Component Analysis). Differential expression analyses between AS and control groups were conducted utilizing the Linear Models for Microarray Data (limma) package. Criteria for defining DEGs were set at an absolute log fold change (|log FC|) greater than 1 and an adjusted p-value less than 0.05, with the aim of isolating immune infiltration-associated genes in AS cases. The GEO datasets GSE43292 and GSE9820 were utilized in this study. The platform used was GPL6244 and GPL6255. GSE43292 served as the training group, while GSE9820 served as the test group (Table 1). We also identified fatty acid metabolism genes (Table S1).
Table 1.
The clinical characteristics of patients
Immune landscape characterization and predictive modeling and computational learning
To elucidate the interplay between KLRD1 and immune-related processes, we employed CIBERSORT and ESTIMATE algorithms to characterize the immune microenvironment at the individual sample level. The differential abundance of 22 immune cell subsets between AS and control groups was statistically assessed using the Wilcoxon rank-sum test. To construct a predictive model with optimal precision and robustness, we implemented Lasso regression via the glmnet package, integrating rigorous cross-validation to mitigate overfitting and enhance predictive accuracy across complex biological datasets. Further refinement was achieved through the SVM-RFE algorithm (e1071 package), systematically engineering a high-performance machine learning model. Cross-validation was crucial in evaluating model error rates and precision, reinforcing its reliability and generalizability. Additionally, the Random Forest algorithm, renowned for its ensemble learning capabilities, was leveraged to refine feature selection and reduce overfitting. By generating multiple decision trees and integrating their outputs, this approach enhanced model stability and predictive performance. Randomized feature selection and bootstrap sampling further enriched model diversity, improving classification accuracy. Using the randomForest and ggplot2 packages, we identified DEGs, isolating key biomarkers essential for precise disease classification. A comprehensive feature importance analysis, integrating insights from Lasso regression, Random Forest, and SVM models, provided a refined perspective on the mechanistic roles of these genes in disease pathology. The identified biomarkers are now poised for further functional exploration. Model performance was evaluated using the AUC, derived from the ROC curve, which quantifies diagnostic accuracy by plotting the true positive rate against the false positive rate across multiple thresholds. An AUC of 1.0 indicates perfect discrimination, whereas values approaching 0.5 denote no predictive power. This metric serves as a critical benchmark for assessing both diagnostic efficacy and model reliability. To validate our findings, we utilized the pROC package in R to integrate AS-related outcomes with key DEGs, assessing predictive accuracy across multiple datasets. External validation was conducted using GSE9820, reinforcing the robustness of our model. The ROC curve analysis established a rigorous methodological framework for evaluating biomarker diagnostic performance, offering valuable insights into their clinical applicability.
Functional annotation via GO and KEGG pathway analyses
The biological pathways associated with the DEGs were then examined using Gene Ontology (GO). Biological processes (BP), molecular functions (MF), and cellular components (CC) controlled by the differentially expressed ATG genes were further investigated using R software, clusterProfiler, org.Hs.eg.db, enrichplot, and ggplot2 package based on KEGG data.
Integrated enrichment analysis using GSEA and GSVA
Global gene-set enrichment analyses, encompassing GSEA, were utilized to identify functionally coherent gene sets and signaling cascades differentially active across the studied samples. Enrichment scores and accompanying visual representations were generated to discern dynamic activities and pathways across various risk stratifications. R was deployed to investigate the influence of differential KLRD1 expression on BP, MF, CC, and implicated pathways form GSEA database (https://www.gsea-msigdb.org/gsea/index.jsp).
Biomarker-immune infiltrate correlation analyses
The foundational principle of immune infiltration analysis involves meticulously quantifying the prevalence and functional status of various immune cell types, such as T cells, macrophages, and dendritic cells within the tumor microenvironment. This assessment is intricately linked with the expression profiles of specific biomarkers, utilizing advanced statistical techniques and computational simulations. These methodologies allow researchers to establish correlations between immune cells and particular biomarkers, thus shedding light on their contributory roles in the oncogenesis and progression of tumors. In the context of KLRD1, an immune infiltration analysis was conducted using an array of bioinformatics tools including limma for differential expression analysis, GSVA and GSEABase for gene set enrichment analysis, and the ggpub and reshape2 packages for data visualization and restructuring, respectively. Spearman’s rank correlation coefficient was employed to elucidate the associations between diagnostic biomarkers and the patterns of immune cell infiltration, enhancing our understanding of their interactions within the tumor microenvironment.
Dissecting miRNA and lncRNA cross-talk in AS
Non-coding RNAs, particularly miRNAs and lncRNAs, are critical regulators of gene expression. While miRNAs primarily mediate post-transcriptional control by modulating mRNA degradation and translation, lncRNAs exert diverse regulatory functions, including chromatin remodeling, transcriptional activation, and transcriptional interference. Emerging evidence highlights the intricate interplay between miRNAs and lncRNAs, revealing ceRNA networks that orchestrate gene expression. This study aims to identify shared regulatory axes and developmental trajectories involving miRNAs and lncRNAs in the context of AS. Experimentally validated target genes of the identified miRNAs and lncRNAs were retrieved from the miRTarBase and PrognoScan databases. An integrated regulatory network encompassing mRNA-miRNA-lncRNA interactions and their common targets in AS was constructed and visualized using Cytoscape. Additionally, drug-gene interactions were predicted using the DGIdb, providing insights into potential therapeutic interventions informed by comprehensive genomic analyses.
Results
DEG identification and construction of the model
We integrated GSE43292 and GSE9820 and conducted batch match evidence integration. PCA corroborated the successful demarcation of patients into risk-specific cohorts (Fig. 2a-b). Among the 2798 DEGs, some DEGs were found to be significantly different. In addition, Some genes cluster in the treat group and some in the control group. Treat: DPP3, ADCY4, VAV1, CNDP2, RIPK3, ITGAL, PLCB2, PSME1, TAP1, PARP12, STAT1, etc. Control: CALD1, MYLK, MYL9, WASF3, PDE5 A, SPARC, PGRMC1, PROS1, MAOB, CDC14B, etc. (Fig. 2c). Some of these DEGs were significantly up-regulated (C1QB and C1QA). However, some genes were significantly down-regulated (SPARC, PROS1, CTNNAL1, GNG11, MEIS1, FSTL1, SH3BGRL2, C1QB, JAM3). (Fig. 2d). (Table.S1). To construct a robust gene signature for AS, we employed LASSO and Cox regression analyses to optimize gene selection, as demonstrated in Figs. 2e-f. Subsequently, the SVM-RFE technique was utilized to develop a machine learning model, confirming the model’s high accuracy and reliability with an accuracy rate of 0.696 and an error rate of 0.304 (Figs. 2g-h). Further investigation using Random Forest analysis identified several key genes (Figs. 2i). These DEGs were then analyzed through a comprehensive approach using Lasso regression, SVM-RFE, and Random Forest algorithms. This integrated analytical strategy successfully pinpointed 23 critical hub genes,, confirmed by consensus among the outputs from the three methodologies (Fig. 2j; Table S2). Based on these results, KLRD1 was selected for in-depth analysis, underlining its potential significance in the pathophysiology of AS (Table 2).
Fig. 2.

DEG Identification and Construction of the Model. a-b Analysis of PCA. c Heatmap. d Volcano map. e Regression of the AS-related genes using LASSO. f Cross-validation is used in the LASSO regression to fine-tune parameter selection. g-h Accuracy and error of this model. i Random forest analysis. j Venn
Table 2.
The characteristics of model
| Label | LASSO | SVM-RFE | RF |
|---|---|---|---|
| Sensitivity | 0.417 | 0.500 | 0.392 |
| Specificity | 0.800 | 1.000 | 0.918 |
| Pos Pred Value | 0.556 | 1.000 | 0.429 |
| Neg Pred Value | 0.696 | 0.769 | 0.900 |
| Precision | 0.556 | 1.000 | 0.429 |
| Recall | 0.417 | 0.500 | 0.375 |
| F1 | 0.476 | 0.667 | 0.400 |
| Prevalence | 0.375 | 0.375 | 0.140 |
| Detection Rate | 0.156 | 0.188 | 0.053 |
| Detection Prevalence | 0.281 | 0.188 | 0.123 |
| Balanced Accuracy | 0.608 | 0.750 | 0.647 |
DEG identification and visualization
We visualized these 23 hub genes in the AS group and the normal sample group respectively (Figs. 3 and 4). In the confirmation of 23 hub genes, we analyzed the ROC of these genes, showing that the accuracy of these genes is high (AUC). SF3B3-0.665, KLRD1-0.639, ASPA-0.650, LGALS3BP-0.638, RABEP1-0.614, STYK1-0.621, SDK2-0.622, NDFIP1-0.613, IMPA1-0.609, PKD1L3-0.622, OR2 T8-0.608, DAOA-0.596, C10orf111-0.612, WDR77-0.612, UBE2L3-0.613, KCNA10-0.600, KLHL10-0.504, KCTD10-0.586, TAS2R38-0.589, SPANXB1-0.591, OR56B4-0.569, LRRC19-0.583, MT1H-0.545 (Fig. 5).
Fig. 3.

Expression of 23 hub genes in AS group and normal sample group respectively
Fig. 4.

ROC of 23 hub genes
Fig. 5.

Validation of Hub Genes. a Expression of 23 hub genes in GSE9820 analysis. b ROC of 23 hub genes
Validation of hub genes
GSE9820 was used for validation to boost our model’s confidence and prediction accuracy of these hub genes. What’s interesting is that these DEGs are showed significant differences in GSE9820 analysis (Fig. 5a). In the GSE9820 analysis of hub genes, we analyzed the ROC of these genes, showing that the accuracy of these genes is high (AUC). SF3B3-0.831, KLRD1-0.741, ASPA-0.774, LGALS3BP-0.750, STYK1-0.752, SDK2-0.755, NDFIP1-0.794, PKD1L3-0.714, WDR77-0.748, KCTD10-0.820, TAS2R38-0.723. These results also confirmed the high reliability and accuracy of our model (Fig. 5b).
Differential expression analysis and enrichment analysis of KLRD1
KLRD1 was selected as a key investigative gene to determine its unique contributions to AS. Utilizing differential expression analysis focused on this gene, we identified 10 DEGs linked to KLRD1, as illustrated in Fig. 6. These DEGs varied significantly in expression, with certain genes predominating in distinct expression clusters. The ‘high’ expression cluster included notable genes such as GZMB, PRDM1, PSAT1, ZC3HAV1, CD8 A, IL18R1, STAT4, CD69, CCL5, PIM2, P2RY10. Conversely, the ‘low’ expression cluster comprised genes like TTC23, FSTL3, KCTD3, SCRN1, RFX2, ABHD8, NR2 F6, CMTM4, CEACAM3, DLEU7 (Figs. 6a-b). Additionally, we developed a correlation matrix to further explore the relationships between KLRD1 and these DEGs, providing a detailed visualization of these associations (Fig. 6c) and catalogued in Supplementary Table S3. This analysis not only highlights the differential roles of KLRD1 in AS but also maps its potential regulatory network, offering insights into its biological and pathological roles. GO enrichment identified 65 principal targets categorized under MF and BP. The MF category was predominantly associated with receptor ligand activity, cytokine activity, cytokine receptor binding. BPs included response to response to mononuclear cell differentiation, regulation of cell–cell adhesion, regulation of T cell activation. CC was predominantly associated with external side of plasma membrane, membrane raft, membrane microdomain. Additionally, KEGG pathway analysis highlighted significant involvement of overexpressed genes in pathways such as Cytokine-cytokine receptor interaction (hsa04060), JAK-STAT signaling pathway (hsa04630), Viral protein interaction with cytokine and cytokine receptor (hsa04061), T cell receptor signaling pathway (hsa04660). These findings, illustrated in Fig. 6d-e and Table S4a-b, provide insights into the molecular mechanisms through which KLRD1 influences immune and inflammatory responses, potentially impacting AS pathology. We hypothesize that KLRD1 mediates AS pathology through its regulation of these interconnected pathways, with dysregulation potentially amplifying inflammatory and metabolic derangements characteristic of the disease. Future studies focusing on the mechanistic role of KLRD1 in these pathways could uncover novel therapeutic targets to mitigate immune-driven inflammation and lipid dysregulation in AS.
Fig. 6.

DEG Identification of KLRD1. a Heatmap. b Volcano map. c Correlation matrix diagram. d The GO circle illustrates the barplot, chord, circos, and cluster of the selected gene’s logFC. e The KEGG barplot, chord, circos, and cluster illustrates the scatter map of the logFC of the indicated gene
GSEA analysis
To elucidate the biological functions impacted by differential expression of KLRD1, we applied GSEA using an array of computational tools including limma for differential expression analysis, org.Hs.eg.db for gene annotation, clusterProfiler and enrichplot for visualization of enrichment results. GSEA facilitated the identification of significant functional alterations among the DEGs linked to KLRD1. In the analysis of GO categories for the high expression group, enrichment was BP t cell differentiation, BP t cell differentiation in thymus, MF cytokine activity. Conversely, in the low expression group, functional enrichments were noted in CC ficolin 1 rich granule, CC ficolin 1 rich granule lumen, CC mitochondrial matrix (Fig. 7a). KEGG pathway analysis revealed that high KLRD1 expression groups showed significant enrichment in pathways like dilated cytokine cytokine receptor interaction, graft versus host disease, jak stat signaling pathway. Low expression groups exhibited enrichment in pathways associated with lysosome, oxidative phosphorylation, propanoate metabolism (Fig. 7b, Table S4).
Fig. 7.

GSEA of Analysis in KLRD1. a GO. b KEGG
Gene regulatory networks and drug enrichment analysis
To unravel the molecular mechanisms underpinning KLRD1 function, a comprehensive gene regulatory network was constructed, revealing key interactions between KLRD1 and genes such as KLRC1, KLRC2, HLA-E, KLRC3, HLA-B (Fig. 9). These genes are intricately linked to processes of tissue repair and inflammation, suggesting that KLRD1 acts as a central regulator in pathways critical to vascular homeostasis and immune modulation. The regulatory connections highlight KLRD1’s potential role in orchestrating cellular responses that influence the pathogenesis of AS. Specifically, KLRD1 may modulate endothelial repair, inflammatory cascades, and vascular remodeling through these interactions (Fig. 8).
Fig. 9.

Immune Landscape Characterization. a Expression of immune function. b Expression of immune cells (c) Correlation rectangle plot. d Heatmap. e PCA analysis. f The expression patterns of Correlation Coefficient. g Immune infiltration analyses
Fig. 8.
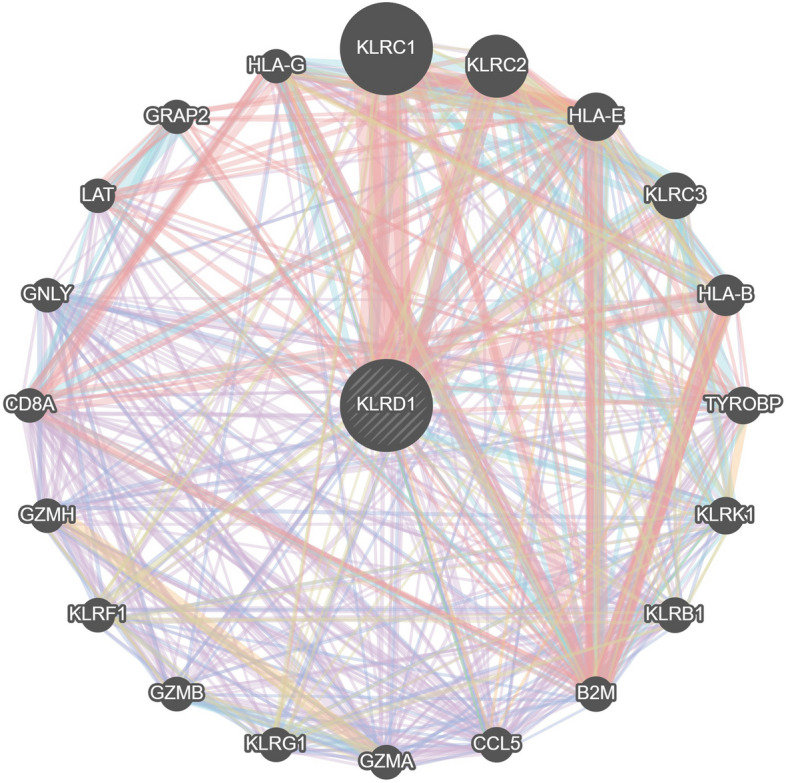
Gene regulatory networks of KLRD1
Immune landscape characterization
Figures 9 explore the immune landscape of AS, with a particular focus on KLRD1 as a pivotal gene for investigating its role within the immune contexture of the disease. This analysis provides vital insights into patterns of immune infiltration, underscoring the immunological factors critical to the initiation and progression of AS. The analysis revealed significant disparities in immune cell infiltration linked to risk profiles associated with KLRD1 expression. In the KLRD1-defined cohorts, marked differences were observed in the infiltration levels of T helper cells between the low and high-risk groups. These variances highlight a complex immune modulation in different risk strata. Conversely, APC co inhibition, DCs, HLA, Macrophages, Mast cells, Neutrophils, Parainflammation, T helper cells, Type I IFN Reponse did not exhibit significant differences in infiltration between the risk groups, indicating a consistent involvement across the spectrum (P > 0.05) as detailed in Fig. 9a. This dichotomy in immune cell behavior underscores the nuanced role of KLRD1 in modulating the immune environment in AS. B cells naive, Plasma cells, T cells CD4 memory resting, T cells CD4 memory activated, Macrophages M2, Dendritic cells activated, Neutrophils were highly expressed in the treat group. While, Dendritic cells resting, T cells follicular helper, T cells regulatory (Tregs), T cells gamma delta, NK cells resting, B cells memory did not exhibit significant differences in infiltration between the risk groups (Fig. 9b). In addition, we also constructed an immune infiltration correlation rectangle plot and heatmap (Fig. 9c-d). Through PCA analysis, immune-based patient categorization was again successfully executed (Fig. 9e). A Lollipop was created to display the expression patterns of Correlation Coefficient. T cells CD8, Plasma cells, Dendritic cells activated, T cells CD4 memory resting, T cells CD4 memory activated, T cells gamma delta (Fig. 9f).
Identification of common RNAs and construction of miRNAs-LncRNAs shared genes network
Figure 10 uses KLRD1 as a hub gene to investigate its expression dynamics within AS-associated miRNAs and lncRNAs, aiming to delineate its regulatory network. Three databases were searched for 39 miRNAs and 61 lncRNAs linked with AS (Table.S7a-b). The network of miRNAs-lncRNAs-genes was constructed by taking the intersection of them and shared genes (obtained by Lasso regression and SVM-RFE). Finally, the miRNAs-genes network included 61 lncRNAs (RP11-326 C3.10, RP11-210M15.1, RP1-34P24.3, CITF22-1 A6.3, RP11-326 C3.14, FAM230B, etc.), 10 miRNAs (hsa-miR-186-5p, hsa-miR-106a-3p, hsa-miR-513a-3p, hsa-miR-590-3p, hsa-miR-93-3p, hsa-miR-612, hsa-miR-127-5p, hsa-miR-299-3p, hsa-miR-223-3p, hsa-miR-1228-3p) (Fig. 10).(Table.S6).
Fig. 10.

miRNAs-LncRNAs shared Genes Network. Note: Red circles are mrnas, blue quadrangles are miRNAs, and green triangles are lncRNAs
Discussions
AS, a silent yet decisive driver of vascular pathology, remains a leading cause of cardiovascular morbidity and mortality. This underscores the urgent need for refined diagnostic strategies to accurately assess atherosclerotic risk [23]. The evolution of atherosclerotic plaques follows a complex immunological trajectory, mirroring key aspects of tumorigenesis. A deeper understanding of immune-associated gene regulation in plaque progression is thus imperative. In oncology, metabolic reprogramming—particularly the shift toward glycolysis—is a hallmark of malignancy [24]. Similarly, immune regulation in cardiovascular disease is increasingly recognized as a pivotal factor in disease progression. KLRD1, a key regulator of immune function, has drawn attention for its potential role in cardiovascular pathology. Encoding the CD94 protein, KLRD1 is crucial for natural killer (NK) cell function, mediating inflammatory responses through its interaction with NKG2 receptors and HLA-E molecules [25]. This dynamic modulates NK cell activation and inhibition, directly influencing immune homeostasis. Recent studies implicate KLRD1 in AS, with elevated expression observed in affected individuals, suggesting a role in plaque inflammation and stability—critical determinants of acute cardiovascular events [26]. NK cell activity, governed by KLRD1, may thus represent a key mechanism linking immune modulation to atherosclerotic progression [27]. This study integrates advanced bioinformatics approaches with computational modeling to dissect the molecular landscape of AS. By leveraging these methodologies, we aim to elucidate key regulatory networks, bridging fundamental insights with translational potential to inform novel therapeutic strategies and clinically relevant interventions.
In our comprehensive investigation into AS, we have identified 10 DEGs that are intricately linked with KLRD1. Through a synergistic approach combining Lasso regression with SVM-RFE, we have refined this extensive list to isolate a critical subset of genes directly relevant to the pathogenesis of AS. A subsequent crossover analysis has highlighted 23 central hub genes: CYBB, SRSF5, CDC7, ARPC5L, RUNX3, SMARCD1, FBXW4, ZNF212, SLC39 A7, GPRC5D, DNAJC24, and notably, KLRD1 itself. Validation using external datasets has confirmed the diagnostic significance of these genes, firmly integrating them into the complex molecular landscape that orchestrates AS. While our findings are substantial, it is important to clarify that they do not establish direct causative relationships between these identified genes and specific transcriptional regulators essential for AS modulation. Nevertheless, within this constellation of hub genes, KLRD1 stands out due to its established role in modulating inflammatory processes and immune responses. The identification and characterization of these hub genes not only pave the way for further studies but also emphasize the need for deeper understanding of their regulatory mechanisms. This enhanced understanding is crucial for decoding the intricate molecular basis of AS and could lead to the development of more effective therapeutic interventions, ultimately aiming to mitigate the impact of this debilitating condition.
KLRD1 has emerged as a gene of interest in the context of coronary atherosclerosis, a leading cause of morbidity and mortality worldwide. The KLRD1 gene encodes the CD94 protein, which plays a critical role in the function of natural killer (NK) cells within the immune system. In the context of coronary atherosclerosis, KLRD1 has been implicated in modulating the inflammatory processes that contribute to the development and progression of atherosclerotic plaques [28]. Elevated expression of KLRD1 has been observed in atherosclerotic lesions, suggesting an active role for NK cells in this disease. The presence of NK cells within atherosclerotic plaques, regulated by KLRD1, indicates their potential involvement in plaque stability and the inflammatory milieu [29]. Moreover, genetic studies have identified polymorphisms in KLRD1 that may influence susceptibility to coronary atherosclerosis. Variations in KLRD1 could affect NK cell function, thereby altering the immune response within the vascular environment [30]. This genetic predisposition underscores the importance of KLRD1 in the pathophysiology of coronary atherosclerosis. The role of KLRD1 in coronary atherosclerosis extends to its impact on plaque stability. NK cells, through interactions mediated by KLRD1, may contribute to the destabilization of atherosclerotic plaques, leading to acute cardiovascular events such as myocardial infarction [31]. Understanding the mechanisms by which KLRD1 regulates NK cell activity in atherosclerotic plaques could provide novel insights into therapeutic strategies aimed at stabilizing plaques and preventing adverse cardiovascular outcomes. In conclusion, KLRD1 is a key regulator of NK cell function with significant implications for coronary atherosclerosis. Its role in modulating immune responses and inflammation within atherosclerotic plaques highlights its potential as a biomarker and therapeutic target. Further investigation into the molecular underpinnings of KLRD1 in coronary atherosclerosis could unlock novel strategies for managing this prevalent cardiovascular disease. Our findings highlight the pivotal role of KLRD1, alongside other differentially expressed genes, in the pathophysiology of AS. Analysis of GSE9820 data reinforces the prognostic significance of KLRD1-associated traits. However, research into the genomic alterations governing KLRD1 remains in its early stages, revealing a critical gap in our understanding. Bridging this gap is essential for deciphering the complex genomic interactions involving KLRD1, which may ultimately drive the development of transformative therapies for AS.
AS epitomizes chronic inflammatory diseases, deeply entwined with immune mechanisms, where the gradual development of arterial intimal plaques signals the advent of cardiovascular diseases. This pathophysiological progression begins with early inflammation, advancing through the complex evolution and eventual rupture of atherosclerotic plaques [32]. A myriad of immune cells, including monocytes/macrophages, T lymphocytes, dendritic cells, and mast cells, play a critical role in the development of AS, interacting dynamically and complexly. In the arterial environment, monocytes differentiate into macrophages, instigating lipid uptake and foam cell formation, hallmarks of atherosclerotic lesions [33]. CD4 + T cells amplify the inflammatory milieu, contributing to the proliferation of pro-inflammatory cytokines. Dendritic cells, positioned at the juncture of innate and adaptive immunity, regulate the immune response within the atherosclerotic lesion [33]. Mast cells exacerbate this process by discharging inflammatory mediators, intensifying inflammation and promoting plaque instability. The interplay between immune and vascular cells in AS is orchestrated by a complex network of cytokines, chemokines, and inflammatory mediators. Crucial pro-inflammatory cytokines like IL-1β, IL-6, and TNF-α play essential roles in endothelial activation and plaque progression [34]. Concurrently, chemokines direct the migration of immune cells to sites of inflammation, augmenting the inflammatory response. Toll-like receptors (TLRs) and NOD-like receptors (NLRs), recognizing PAMPs and DAMPs, initiate the inflammatory cascade characteristic of AS [35]. Deciphering these intricate immunological interactions has greatly advanced our understanding of AS, uncovering novel therapeutic avenues. Immuno-modulatory strategies, targeting specific immune cells or inflammatory pathways, offer groundbreaking approaches to preventing and stabilizing atherosclerotic plaques, potentially reducing cardiovascular events [35]. B cells naive, Plasma cells, T cells CD4 memory resting, T cells CD4 memory activated, Macrophages M2, Dendritic cells activated, Neutrophils were highly expressed in the treat group. While, Dendritic cells resting, T cells follicular helper, T cells regulatory (Tregs), T cells gamma delta, NK cells resting, B cells memory did not exhibit significant differences in infiltration between the risk groups. A Lollipop was created to display the expression patterns of Correlation Coefficient. Macrophages M1, T cells CD4 memory activated, Dendritic cells activated, Eosinophils, Plasma cells (Fig. 9f). Eosinophils and Plasma cells were shown to be positively associated with KLRD1, While, T cells CD4 naive was shown to be negatively associated with KLRD1. By examining the immunological subtleties of AS, our research establishes the basis for groundbreaking treatments aimed at significantly improving clinical outcomes for this challenging condition.
The intricate interplay between AS and metabolic dynamics represents a burgeoning frontier in contemporary scientific inquiry. Recent strides, facilitated by the application of bioinformatics methodologies, have begun to unravel this multifaceted relationship [36–38]. A pivotal contribution to this field is Zemin Tian’s seminal investigation, which elucidates the role of immunogenic cell death within endothelial cells in perpetuating the chronic inflammatory environment characteristic of AS. Complementing Tian’s findings, Shuangyang Mo’s scholarly work highlights the molecular and immunological parallels between NAFLD and AS, identifying PLCXD3, CCL19, and PKD2 as key biomarkers bridging these conditions. Concurrently, Chi Ma’s pioneering efforts in developing a model based on autophagy-related genes, identifying 19 significant genes, represent a substantial advancement in diagnostic and therapeutic research in AS. Despite significant advancements, the interplay between KLRD1 and AS remains largely uncharted, with a conspicuous absence of predictive models in this domain. This study seeks to bridge this critical gap, offering novel insights into an underexplored aspect of AS pathophysiology. Acknowledging inherent limitations in fully delineating mechanistic pathways, we employ a synergistic in vivo and in vitro approach to generate essential empirical data. While these methodologies remain underutilized, they hold promise for broader, more integrative investigations crucial for elucidating KLRD1’s role in AS. Such efforts are poised to inform future therapeutic strategies, potentially enhancing treatment precision and efficacy.
Conclusions
This study elucidates the intricate mechanisms driving disease pathogenesis, underscoring the pivotal role of KLRD1 in tissue repair and inflammation with direct implications for AS prognosis. Leveraging advanced predictive modeling, we map the transcriptional landscape of KLRD1, uncovering significant expression disparities between AS-affected and healthy tissues. These findings establish a critical foundation for future research, offering potential avenues for targeted therapeutic intervention.
Supplementary Information
Abbreviations
- AS
Coronary Atherosclerosis
- GO
Gene Ontology
- TCM
Traditional Chinese medicine
- MF
Molecular functions
- KEGG
Kyoto Encyclopedia of Genes and Genomes
- GEO
Gene Expression Omnibus
- KLRD1
Killer Cell Lectin Like Receptor D1
- BP
Biological processes
- CC
Cellular components
- DEGs
Differentially Expressed Genes
Authors’ contributions
Huan Liang and Xiao Liang drafted and revised the manuscript. Huan Liang and Man Zheng were in charge of data collection. Huan Liang and Man Zheng was in charge of design of frame. Shoudong Wang conceived and designed this article, in charge of syntax modification and revised of the manuscript. All the authors have read and agreed to the final version manuscript.
Funding
Qingdao Science and Technology Project (25–1-5-smjk-9-nsh), and Hospital-Level Key Fund Project of Qilu Hospital of Shandong University, Qingdao (QDKY2023ZD03).
Data availability
The datasets generated during and/or analyzed during the current study are available in the appendix.
Declarations
Ethics approval and consent to participation
This manuscript is not a clinical trial, hence the ethics approval and consent to participation are not applicable.
Consent for publication
All authors have read and approved this manuscript to be considered for publication.
Competing interests
The authors declare no competing interests.
Footnotes
Publisher’s Note
Springer Nature remains neutral with regard to jurisdictional claims in published maps and institutional affiliations.
References
- 1.De Bosscher R, Dausin C, Claus P, Bogaert J, Dymarkowski S, Goetschalckx K, Ghekiere O, Van De Heyning CM, Van Herck P, Paelinck B, et al. Lifelong endurance exercise and its relation with coronary atherosclerosis. EUR HEART J. 2023;44(26):2388–99. [DOI] [PMC free article] [PubMed] [Google Scholar]
- 2.Gallino A, Aboyans V, Diehm C, Cosentino F, Stricker H, Falk E, Schouten O, Lekakis J, Amann-Vesti B, Siclari F, et al. Non-coronary atherosclerosis. Eur Heart J. 2014;35(17):1112–9. [DOI] [PubMed] [Google Scholar]
- 3.Sato Y, Kawakami R, Sakamoto A, Cornelissen A, Mori M, Kawai K, Ghosh S, Romero ME, Kolodgie FD, Finn AV, et al. Sex Differences in Coronary Atherosclerosis. Curr Atheroscler Rep. 2022;24(1):23–32. [DOI] [PubMed] [Google Scholar]
- 4.Al RM, Ahmed AI, Al-Mallah MH. Evaluating coronary atherosclerosis progression among South Asians. Atherosclerosis. 2022;353:30–2. [DOI] [PubMed] [Google Scholar]
- 5.Zhou F, Zhu X, Liu Y, Sun Y, Zhang Y, Cheng D, Wang W. Coronary atherosclerosis and chemotherapy: From bench to bedside. Front Cardiovasc Med. 2023;10:1118002. [DOI] [PMC free article] [PubMed] [Google Scholar]
- 6.Honigberg MC, Jowell AR. Accelerated Coronary Atherosclerosis After Preeclampsia: Seeing Is Believing. J Am Coll Cardiol. 2022;79(23):2322–4. [DOI] [PMC free article] [PubMed] [Google Scholar]
- 7.Ohmura H. Contribution of Remnant Cholesterol to Coronary Atherosclerosis. J Atheroscler Thromb. 2022;29(12):1706–8. [DOI] [PMC free article] [PubMed] [Google Scholar]
- 8.Aengevaeren VL, Mosterd A, Sharma S, Prakken N, Mohlenkamp S, Thompson PD, Velthuis BK, Eijsvogels T. Exercise and Coronary Atherosclerosis: Observations, Explanations, Relevance, and Clinical Management. Circulation. 2020;141(16):1338–50. [DOI] [PMC free article] [PubMed] [Google Scholar]
- 9.Graves SS, Gyurkocza B, Stone DM, Parker MH, Abrams K, Jochum C, Gallo S, Saad M, Johnson MM, Rosinski SL, et al. Development and characterization of a canine-specific anti-CD94 (KLRD-1) monoclonal antibody. Vet Immunol Immunopathol. 2019;211:10–8. [DOI] [PMC free article] [PubMed] [Google Scholar]
- 10.Bongen E, Vallania F, Utz PJ, Khatri P. KLRD1-expressing natural killer cells predict influenza susceptibility. Genome Med. 2018;10(1):45. [DOI] [PMC free article] [PubMed] [Google Scholar]
- 11.Shin DL, Pandey AK, Ziebarth JD, Mulligan MK, Williams RW, Geffers R, Hatesuer B, Schughart K, Wilk E. Segregation of a spontaneous Klrd1 (CD94) mutation in DBA/2 mouse substrains. G3 (Bethesda) 2014;5(2):235–239. [DOI] [PMC free article] [PubMed]
- 12.Zhang Q, Zheng Y, Ning M, Li T. KLRD1, FOSL2 and LILRB3 as potential biomarkers for plaques progression in acute myocardial infarction and stable coronary artery disease. BMC Cardiovasc Disord. 2021;21(1):344. [DOI] [PMC free article] [PubMed] [Google Scholar]
- 13.Jo DH, Kim JH, Kim JH. Tumor environment of retinoblastoma, intraocular cancer. [Journal Article]. Adv Exp Med Biol. 2020;1296:349–58. 10.1007/978-3-030-59038-3_21. [DOI] [PubMed] [Google Scholar]
- 14.Jo DH, Kim JH, Kim JH. Tumor Environment of Retinoblastoma Intraocular Cancer. Adv Exp Med Biol. 2020;1296:349–58. [DOI] [PubMed] [Google Scholar]
- 15.Xia L, Oyang L, Lin J, Tan S, Han Y, Wu N, Yi P, Tang L, Pan Q, Rao S, et al. The cancer metabolic reprogramming and immune response. MOL Cancer. 2021;20(1):28. [DOI] [PMC free article] [PubMed] [Google Scholar]
- 16.Zhang Y, Zhang Z. The history and advances in cancer immunotherapy: understanding the characteristics of tumor-infiltrating immune cells and their therapeutic implications. Cell Mol Immunol. 2020;17(8):807–21. [DOI] [PMC free article] [PubMed] [Google Scholar]
- 17.Peng CD, Wang L, Jiang DM, et al. Establishing and validating a spotted tongue recognition and extraction model based on multiscale convolutional neural network. Digital Chin Med. 2022;5(1):49–58. [Google Scholar]
- 18.Wu Z, Gao Y, Cao L, Peng Q, Yao X. Purine metabolism-related genes and immunization in thyroid eye disease were validated using bioinformatics and machine learning [Journal Article; Research Support, Non-U.S. Gov’t]. Sci Rep. 2023;13(1):18391. 10.1038/s41598-023-45048-9. [DOI] [PMC free article] [PubMed] [Google Scholar]
- 19.Wu Z, Fang C, Hu Y, Peng X, Zhang Z, Yao X, Peng Q. Bioinformatic validation and machine learning-based exploration of purine metabolism-related gene signatures in the context of immunotherapeutic strategies for nonspecific orbital inflammation. Front Immunol. 2024;15:1318316. [DOI] [PMC free article] [PubMed] [Google Scholar]
- 20.Wu Z, Liu P, Huang B, Deng S, Song Z, Huang X, Yang J, Cheng S. A novel Alzheimer’s disease prognostic signature: identification and analysis of glutamine metabolism genes in immunogenicity and immunotherapy efficacy. Sci Rep. 2023;13(1):6895. [DOI] [PMC free article] [PubMed] [Google Scholar]
- 21.Ritchie ME, Phipson B, Wu D, Hu Y, Law CW, Shi W, Smyth GK. limma powers differential expression analyses for RNA-sequencing and microarray studies. Nucleic Acids Res. 2015;43(7):e47. [DOI] [PMC free article] [PubMed] [Google Scholar]
- 22.Hackenberger BK. R software: unfriendly but probably the best. Croat Med J. 2020;61(1):66–68.1 [DOI] [PMC free article] [PubMed]
- 23.Adkar SS, Leeper NJ. Efferocytosis in atherosclerosis. Nat Rev Cardiol. 2024;21(11):762–79. [DOI] [PubMed] [Google Scholar]
- 24.Erol C. Atherosclerosis Reviewed. Anatol. J Cardiol. 2024;28(8):374. [DOI] [PMC free article] [PubMed] [Google Scholar]
- 25.Ram DR, Lucar O, Hueber B, Reeves RK. Simian Immunodeficiency Virus Infection Modulates CD94(+) (KLRD1(+)) NK Cells in Rhesus Macaques. J Virol. 2019;93(16):e00731-19. [DOI] [PMC free article] [PubMed] [Google Scholar]
- 26.Dou X, Peng M, Jiang R, Li W, Zhang X. Upregulated CD8(+) MAIT cell differentiation and KLRD1 gene expression after inactivated SARS-CoV-2 vaccination identified by single-cell sequencing. Front Immunol. 2023;14:1174406. [DOI] [PMC free article] [PubMed] [Google Scholar]
- 27.Dong C, Lin Z, Hu Y, Lu Q. KLRD1 (CD94): A Prognostic Biomarker and Therapeutic Candidate in Head and Neck Squamous Cell Carcinoma. J Cancer. 2025;16(3):982–95. [DOI] [PMC free article] [PubMed] [Google Scholar]
- 28.Kaminski J, Fleming RA, Alvarez-Calderon F, Winschel MB, McGuckin C, Ho EE, Eng F, Rui X, Keskula P, Cagnin L, et al. B-cell-directed CAR T-cell therapy activates CD8+ cytotoxic CARneg bystander T cells in patients and nonhuman primates. Blood. 2024;144(1):46–60. [DOI] [PMC free article] [PubMed] [Google Scholar]
- 29.Shreeve N, Depierreux D, Hawkes D, Traherne JA, Sovio U, Huhn O, Jayaraman J, Horowitz A, Ghadially H, Perry J, et al. The CD94/NKG2A inhibitory receptor educates uterine NK cells to optimize pregnancy outcomes in humans and mice. Immunity. 2021;54(6):1231–44. [DOI] [PMC free article] [PubMed] [Google Scholar]
- 30.Kamiya T, Seow SV, Wong D, Robinson M, Campana D. Blocking expression of inhibitory receptor NKG2A overcomes tumor resistance to NK cells. J Clin Invest. 2019;129(5):2094–106. [DOI] [PMC free article] [PubMed] [Google Scholar]
- 31.Lu H, Yang HL, Zhou WJ, Lai ZZ, Qiu XM, Fu Q, Zhao JY, Wang J, Li DJ, Li MQ. Rapamycin prevents spontaneous abortion by triggering decidual stromal cell autophagy-mediated NK cell residence. Autophagy. 2021;17(9):2511–27. [DOI] [PMC free article] [PubMed] [Google Scholar]
- 32.Fan L, Liu J, Zhang Y, Zhang C, Shi B, Hu X, Chen W, Yin W, Wang J. High-dimensional Single-cell Analysis Delineates Peripheral Immune Signature of Coronary Atherosclerosis in Human Blood. Theranostics. 2022;12(15):6809–25. [DOI] [PMC free article] [PubMed] [Google Scholar]
- 33.Boccara F, Cohen A. Immune activation and coronary atherosclerosis in HIV-infected women: where are we now, and where will we go next? J Infect Dis. 2013;208(11):1729–31. [DOI] [PubMed] [Google Scholar]
- 34.Song K, Li L, Sun G, Wei Y. MicroRNA-381 regulates the occurrence and immune responses of coronary atherosclerosis via cyclooxygenase-2. Exp Ther Med. 2018;15(5):4557–63. [DOI] [PMC free article] [PubMed] [Google Scholar]
- 35.Pereyra F, Lo J, Triant VA, Wei J, Buzon MJ, Fitch KV, Hwang J, Campbell JH, Burdo TH, Williams KC, et al. Increased coronary atherosclerosis and immune activation in HIV-1 elite controllers. AIDS. 2012;26(18):2409–12. [DOI] [PMC free article] [PubMed] [Google Scholar]
- 36.Liao Y, Dong Z, Liao H, Chen Y, Hu L, Yu Z, Xia Y, Zhao Y, Fan K, Ding J, et al. Lipid metabolism patterns and relevant clinical and molecular features of coronary artery disease patients: an integrated bioinformatic analysis. Lipids Health Dis. 2022;21(1):87. [DOI] [PMC free article] [PubMed] [Google Scholar]
- 37.Chen H, Wang Y, Sun B, Bao X, Tang Y, Huang F, Zhu S, Xu J. Negative correlation between endoglin levels and coronary atherosclerosis. Lipids Health Dis. 2021;20(1):127. [DOI] [PMC free article] [PubMed] [Google Scholar]
- 38.Zhang X, Sun R, Liu L. Potentially critical roles of TNPO1, RAP1B, ZDHHC17, and PPM1B in the progression of coronary atherosclerosis through microarray data analysis. J Cell Biochem. 2019;120(3):4301–11. [DOI] [PubMed] [Google Scholar]
Associated Data
This section collects any data citations, data availability statements, or supplementary materials included in this article.
Supplementary Materials
Data Availability Statement
The datasets generated during and/or analyzed during the current study are available in the appendix.