

Abstract
BACKGROUND: Lung cancer is the leading cause of cancer death in the United States. Non-small cell lung cancer (NSCLC) accounts for 80% to 85% of all lung cancers. Thyroid cancer, while generally not as lethal as lung cancer, has a large prevalent population and a rapidly increasing incidence in the United States. Pralsetinib is a highly potent, selective rearranged during transfection (RET) inhibitor indicated for the treatment of RET-positive NSCLC and thyroid cancer tumors.
OBJECTIVE: To estimate the budget impact of adding pralsetinib to a 1 million-member US health plan formulary for the treatment of patients with metastatic RET fusion-positive NSCLC, advanced or metastatic RET-mutant medullary thyroid cancer (MTC), or advanced or metastatic RET fusion-positive thyroid cancer (non-MTC).
METHODS: A budget impact model with a 3-year time horizon was developed in Microsoft Excel to estimate the number of eligible RET-positive NSCLC and thyroid cancer patients in a plan and quantify associated treatment costs (2020 USD). Comparators in the analyses included pralsetinib, selpercatinib, and cabozantinib, as well as indication-specific use of pembrolizumab, pemetrexed/carboplatin combination, vandetanib, lenvatinib, and sorafenib. Drug acquisition, molecular testing, treatment monitoring, and adverse event management costs were included to estimate total annual costs and per-member per-month (PMPM) costs in current (without pralsetinib) and potential future market scenarios, where pralsetinib is assumed to split the projected RET inhibitor market share with selpercatinib. The number of treated patients was based on age- and sex-adjusted incidence of disease, the proportion of patients diagnosed with advanced or metastatic disease, and projected RET testing rates. Treatment duration was based on progression-free survival or duration of response data from clinical trials. Medical resources were monetized using standardized sources such as Medicare reimbursement and wholesale acquisition cost (WAC).
RESULTS: The model estimated that there would be approximately 6 new treatment-eligible patients in a 1 million-member plan annually. Monthly WAC is $19,243 for pralsetinib and $20,600 for selpercatinib at the recommended starting dose. Adoption of pralsetinib, with corresponding increases in pralsetinib market share, would be slightly cost saving to a payer, decreasing the overall budget impact to the health plan by $49,985 in year 3 (−$0.0042 PMPM; −$0.0030, −$0.0006, and −$0.0005 for NSCLC, MTC, and thyroid cancer [non-MTC], respectively). In year 3, drug costs were the key driver of total costs (~80%-98%) and cost savings. All other medical resource categories were cost-neutral or nominally cost saving or additive in the budget impact analysis.
CONCLUSIONS: Quantifying the budget impact associated with the adoption of new targeted precision therapies is an important consideration for payers. For eligible NSCLC and thyroid cancer patients, our analysis suggests that adoption of pralsetinib is expected to result in modest cost savings for US payers.
DISCLOSURES: Support for this study was provided by Blueprint Medicines Corporation. This study was conducted by Veritas Health Economics Consulting, Inc., in collaboration with Blueprint Medicines, which was involved in the design of the study; collection, analysis, and interpretation of the data; writing of the report; and the decision to submit the report for publication. Duff is an employee of Veritas Health Economics Consulting, which received research funding from Blueprint Medicines to develop the budget impact model. Norregaard and Sullivan are employees of Blueprint Medicines. Bargiacchi and Brener were employees of Blueprint Medicines at the time of the research study.
This study was presented as a poster at the AMCP Virtual Learning Event, April 2021.
What is already known about this subject
Advancements in genetic testing allow oncogenic drivers to be identified when patients are diagnosed with cancer to better predict response to therapy.
In conjunction with improved genetic testing, new cancer treatments targeting specific biomarkers are becoming increasingly available.
Pralsetinib, a tyrosine kinase inhibitor designed to treat rearranged during transfection (RET)-positive tumors, received accelerated approval from the FDA in September 2020 and December 2020 based on overall response rate and duration of response and is currently indicated for the treatment of 3 cancer types with RET alterations.
What this study adds
This is the first budget impact analysis of a cancer therapy specifically targeting RET-positive tumors in a hypothetical health plan with multiple payer types.
Informed by published epidemiologic evidence, the budget impact model estimates that approximately 6 patients (year 3) would be eligible annually for treatment in a 1 million-member health plan.
The model projects a modest overall cost reduction after the introduction of pralsetinib, with greater pralsetinib adoption associated with increasing cost savings.
Lung cancer is the most common cause of cancer-related mortality globally, accounting for 1.8 million deaths annually or about 18% of all cancer deaths.1 Non-small cell lung cancer (NSCLC) accounts for approximately 80% to 85% of lung cancer cases2-4 and usually presents as unresectable or metastatic disease at diagnosis. In 2020, an estimated 135,720 deaths were attributable to this disease in the United States.5
In recent years, thyroid cancer incidence increased at a faster rate than any other cancer type.6 A 2015 study by Shah et al estimated that 52,890 new cases of thyroid cancer would be diagnosed in the United States in 2020, representing 2.9% of all new cancer cases.7 Because mortality rates from thyroid cancer are relatively low, the population of patients living with thyroid cancer is large—over 630,000 in the United States in 2013, according to the American Thyroid Association.8
Both lung and thyroid cancers pose a major economic burden to society. In a 2008 study, lung cancer had the highest net cost of care to Medicare (difference in the medical costs of cancer patients and control subjects) of all cancers studied, equivalent to $4.2 billion in 2004 US dollars (USD).9 Due to its rapidly growing incidence, thyroid cancer costs have been projected to pose an increasingly substantial economic burden to the US health care system. The 10-year cumulative cost (2010-2019) of thyroid cancer care was estimated to be $18 to $21 billion across all histologic subtypes in an economic analysis by Aschebrook-Kilfoy et al.10
With new developments in genetic testing over the last 2 decades, clinicians can now identify alterations that are oncogenic drivers and predictors of response to cancer therapy. Multikinase inhibitors (MKIs) have been utilized to treat both NSCLC and thyroid cancer with mixed results, largely owing to the lack of selectivity for specific drivers.11,12 A recent advancement in oncology has been the development of therapies targeting the rearranged during transfection (RET) alteration, an actionable biomarker present in a broad number of solid tumors, including NSCLC and thyroid cancer.13-19 Pralsetinib is a selective RET inhibitor with activity against wild-type, fusion, and mutant kinases including V804 gatekeeper mutations associated with resistance to MKIs. Pralsetinib has shown robust, durable responses in both RET fusion-positive NSCLC and thyroid cancer patients20-22 and an improvement in response compared to published outcomes for MKIs.23-25
The broad mix of therapies prescribed to treat NSCLC and thyroid cancer varies in terms of safety, efficacy, and cost. In order to estimate the incremental budget impact of adding pralsetinib to a US health plan formulary, a budget impact analysis was conducted that included patients with metastatic RET fusion-positive NSCLC; advanced or metastatic RET-mutant medullary thyroid cancer (MTC) who require systemic therapy; or advanced or metastatic RET fusion-positive thyroid cancer who require systemic therapy and are radioactive iodine-refractory (if radioactive iodine is appropriate).
Methods
MODEL STRUCTURE
The budget impact model (BIM) was developed in Microsoft Excel to estimate the budget impact of adding pralsetinib to a US health plan formulary as a treatment of patients with 1 of 3 specific indications: metastatic RET fusionpositive NSCLC; advanced or metastatic RET-mutant MTC who require systemic therapy; or advanced or metastatic RET fusion-positive thyroid cancer who require systemic therapy and are radioactive iodine-refractory (if radioactive iodine is appropriate). The time horizon of the budget impact analysis is 3 years and accounts for the shift in treatment mix from current standard of care treatments (current market scenario) for the 3 indications to a mix that includes pralsetinib (future market scenario). Costs in the BIM include those for drug acquisition, drug administration for non-oral therapies, testing, monitoring, and adverse event (AE) management. The modeling approach was developed in accordance with the recommended best practices described in the International Society for Pharmacoeconomics and Outcomes Research (ISPOR) Principles of Good Practice for Budget Impact Analysis.26
The model structure used to estimate the budget impact of pralsetinib in the treatment of RET-positive tumors is illustrated in Figure 1. Three incident disease cohorts, one for each of the 3 years, are tracked through the analysis. The eligible patient population is calculated for the health plan type selected, based on overall disease incidence and RET fusion/mutation and testing rates. Patients can receive either pralsetinib or one of the comparator treatments. The model estimates the drug-related costs associated with each comparator regimen and calculates the total costs in the current and future scenarios. Incremental spending is projected each year in the aggregate for the health plan and on a per-member per-month (PMPM) basis.
FIGURE 1.
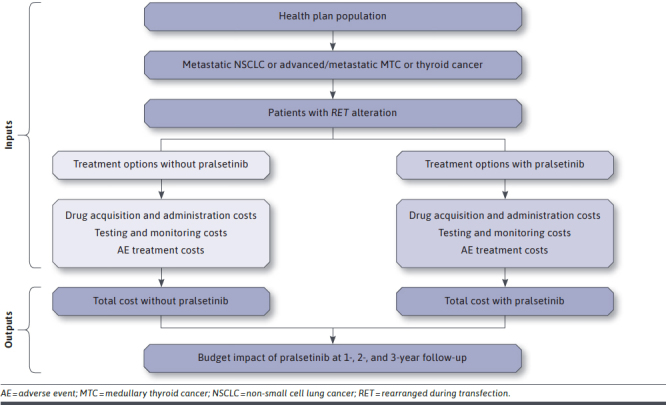
Model Schematic
PATIENT POPULATIONS
The BIM assumes a hypothetical health plan of 1 million members with demographic characteristics reflective of the overall US population (Supplementary Table 1, available in online article).27 The number of treated patients is calculated from the age and sex distribution of covered lives, the age- and sex-adjusted incidence of disease, and the proportion of patients diagnosed with advanced or metastatic disease (as applicable). The epidemiologic and disease-related parameters for these calculations (Table 1) were based on data from the National Cancer Institute’s Surveillance, Epidemiology, and End Results (SEER) Program28,29; published literature3,30-36; and Blueprint Medicines internal analyses of medical claims and other data.
TABLE 1.
Epidemiology Parameters
| NSCLC | References | |||
|---|---|---|---|---|
| Lung cancer incidence by age (per 100,000)a, n | Male | Female | Age-/sex-adjusted | |
| 18-64 years | 23.2 | 23.9 | 23.0 | Census Bureau27; NIH SEER28 |
| ≥ 65 years | 343.3 | 270.7 | 303.3 | |
| Age- and sex-adjusted | 113.3 | 100.2 | 106.4 | |
| Other cancer-specific parameters, % | ||||
| NSCLC | 85.0 | Herbst 20183 | ||
| Metastaticb | 46.4 | NIH SEER28 | ||
| RET-related parameters, % | Year 1 | Year 2 | Year 3 | |
| RET mutation rate | 2 | 2 | 2 | Hirsch 201732 |
| MTC | References | |||
| Thyroid cancer incidence by age (per 100,000)a, n | Male | Female | Age-/sex-adjusted | |
| 12-17 years | 2.6 | 10.2 | 6.4 | Census Bureau27; NIH SEER29 |
| 18-64 years | 9.0 | 28.9 | 19.2 | |
| ≥ 65 years | 17.6 | 26.1 | 22.3 | |
| Age- and sex-adjusted | 10.6 | 26.5 | 18.9 | |
| Other cancer-specific parameters, % | ||||
| MTC | 4.0 | Pietrowska 201734 | ||
| Advanced/metastaticc | 25.6 | Randle 201736 | ||
| Requiring systemic therapy | 53.0 | Clinical expert assumption | ||
| RET-related parameters, % | Year 1 | Year 2 | Year 3 | |
| RET mutation rate | 75 | 75 | 75 | Drilon 201830; Elisei 201931 |
| Thyroid cancer (non-MTC) | References | |||
| Thyroid cancer incidence by age (per 100,000)a, n | Male | Female | Age-/sex-adjusted | |
| 12-17 years | 2.6 | 10.2 | 6.4 | Census Bureau27; NIH SEER29 |
| 18-64 years | 9.0 | 28.9 | 19.2 | |
| ≥ 65 years | 17.6 | 26.1 | 22.3 | |
| Age- and sex-adjusted | 10.6 | 26.5 | 18.9 | |
| Other cancer-specific parameters, % | ||||
| PTC, FTC, ATC (non-MTC) | 96.0 | Pietrowska 201734 | ||
| Advanced/metastaticc | 14.0 | NIH SEER29 | ||
| Requiring systemic therapy | 90.0 | Clinical expert assumption | ||
| RAI-refractory | 30.0 | Clinical expert assumption | ||
| RET-related parameters, % | Year 1 | Year 2 | Year 3 | |
| RET mutation rate | 17 | 17 | 17 | Lee 201733; Prescott 201535 |
aTo update the latest (2019) US population estimates to more accurately reflect the 2020 population size, a 1% growth factor was applied to the 2019 estimate.
bCalculated as: (Incidence of distant)/(incidence of all stages).
cCalculated as: [(1/3 × incidence of regional) + (incidence of distant)]/(incidence of all stages).
ATC = anaplastic thyroid cancer; FTC = follicular thyroid cancer; MTC = medullary thyroid cancer; NIH = National Institutes of Health; NSCLC = non-small cell lung cancer; PTC = papillary thyroid cancer; RAI = radioactive iodine-refractory; RET = rearranged during transfection; SEER = Surveillance, Epidemiology, and End Results.
TREATMENTS
Treatment comparators in the BIM vary by indication. Pralsetinib is included in the future scenario only; therapies in both current and future scenarios are (1) NSCLC: selpercatinib, cabozantinib, pembrolizumab, and pemetrexed/carboplatin combination therapy; (2) MTC: selpercatinib, cabozantinib, and vandetanib; and (3) non-MTC thyroid cancer: selpercatinib, cabozantinib, vandetanib, lenvatinib, and sorafenib.
The market share estimates for each treatment in the current (without pralsetinib) and future (with pralsetinib) scenarios are shown in Table 2. The market shares of the 2 selective RET inhibitors (pralsetinib and selpercatinib) were the only treatments assumed to increase in use over time, with relatively negligible use (10%-15%) of the remaining treatments by year 3. The market share estimates and trajectories are not intended to simulate therapy sequences or treatment algorithms.
TABLE 2.
Market Share and RET Testing Parameters
| NSCLC | References | ||||||
|---|---|---|---|---|---|---|---|
| Comparators | Without pralsetinib available, % | With pralsetinib available, % | |||||
| Year 1 | Year 2 | Year 3 | Year 1 | Year 2 | Year 3 | ||
| RET fusion test ratea | 30 | 50 | 70 | 30 | 50 | 70 | Blueprint Medicines internal analysis of claims data; assumptions |
| Market share | |||||||
| Pralsetinib | 0 | 0 | 0 | 12 | 27 | 43 | |
| Selpercatinib | 24 | 54 | 86 | 12 | 27 | 43 | |
| Cabozantinib | 15 | 5 | 1 | 15 | 5 | 1 | |
| Pembrolizumab | 50 | 36 | 12 | 50 | 36 | 12 | |
| Pemetrexed + carboplatin | 11 | 5 | 1 | 11 | 5 | 1 | |
| Total | 100 | 100 | 100 | 100 | 100 | 100 | |
| MTC | References | ||||||
| Comparators | Without pralsetinib available, % | With pralsetinib available, % | |||||
| Year 1 | Year 2 | Year 3 | Year 1 | Year 2 | Year 3 | ||
| RET mutation test ratea | 100 | 100 | 100 | 100 | 100 | 100 | Blueprint Medicines internal analysis of claims data; assumptions |
| Market share | |||||||
| Pralsetinib | 0 | 0 | 0 | 12 | 27 | 45 | |
| Selpercatinib | 24 | 54 | 90 | 12 | 27 | 45 | |
| Cabozantinib | 50 | 31 | 7 | 50 | 31 | 7 | |
| Vandetanib | 26 | 15 | 3 | 26 | 15 | 3 | |
| Total | 100 | 100 | 100 | 100 | 100 | 100 | |
| Thyroid cancer (non-MTC) | References | ||||||
| Comparators | Without pralsetinib available, % | With pralsetinib available, % | |||||
| Year 1 | Year 2 | Year 3 | Year 1 | Year 2 | Year 3 | ||
| RET fusion test ratea | 50 | 70 | 70 | 50 | 70 | 70 | Blueprint Medicines internal analysis of claims data; assumptions |
| Market share | |||||||
| Pralsetinib | 0 | 0 | 0 | 12 | 27 | 45 | |
| Selpercatinib | 24 | 54 | 90 | 12 | 27 | 45 | |
| Cabozantinib | 40 | 23 | 4 | 40 | 23 | 4 | |
| Vandetanib | 20 | 13 | 2 | 20 | 13 | 2 | |
| Lenvatinib | 8 | 5 | 2 | 8 | 5 | 2 | |
| Sorafenib | 8 | 5 | 2 | 8 | 5 | 2 | |
| Total | 100 | 100 | 100 | 100 | 100 | 100 | |
aGiven the availability of selpercatinib in both scenarios, it was assumed that the RET testing trajectory does not change after the introduction of pralsetinib; this assumption was varied in sensitivity analyses.
MTC = medullary thyroid cancer; NSCLC = non-small cell lung cancer; RET = rearranged during transfection.
COSTS
A comprehensive set of medical resources was used to estimate the costs of each treatment regimen in the model. Costs were estimated and reported in 2020 USD. The resource costs included drug acquisition and administration, monitoring, and AE management (Table 3). The cost of RET testing for each indication was also included.
TABLE 3.
Cost Parameters
| NSCLC | References | ||||||
|---|---|---|---|---|---|---|---|
| Parameter | All comparators | Pralsetinib | Selpercatinib | Cabozantinib | Pembrolizumab | Pemetrexed + carboplatin | |
| RET testing costa | $1,220 | – | – | – | – | – | CMS Clinical Diagnostic Laboratory Fee Schedule48 |
| Treatment duration (months)b | – | 17.5 | 17.5 | 11.2 | 5.2 | 8.9/2.8 | USPIs20,37-43 |
| Drug acquisition cost (monthly)c | – | $19,243 | $20,600 | $19,285 | $13,892 | $10,412/$79 | Red Book44 |
| Drug administration cost (monthly) | – | $0 | $0 | $0 | $204 | $204/$99 | CMS Physician Fee Schedule45 |
| Adverse event cost (1-time) | – | $2,172 | $1,042 | $1,371 | $754 | $207 | USPIs20,37-43; CMS Physician Fee Schedule45; CMS Clinical Diagnostic Laboratory Fee Schedule48; HCUP49; BLS50 |
| Monitoring cost (monthly) | – | $170 | $178 | $172 | $176 | $178 | CMS Physician Fee Schedule45; CMS Clinical Diagnostic Laboratory Fee Schedule48 |
| MTC | References | ||||||
| Parameter | All comparators | Pralsetinib | Selpercatinib | Cabozantinib | Vandetanib | ||
| RET testing costa | $1,845 | – | – | – | – | CMS Clinical Diagnostic Laboratory Fee Schedule48 | |
| Treatment duration (months)b | – | 22.0 | 22.0 | 11.2 | 22.6 | USPIs20,37-43 | |
| Drug acquisition cost (monthly)c | – | $19,243 | $20,600 | $19,285 | $14,680 | Red Book44 | |
| Drug administration cost (monthly) | – | $0 | $0 | $0 | $0 | ||
| Adverse event cost (1-time) | – | $1,881 | $1,050 | $1,382 | $633 | USPIs20,37-43; CMS Physician Fee Schedule45; CMS Clinical Diagnostic Laboratory Fee Schedule48; HCUP49; BLS50 | |
| Monitoring cost (monthly) | – | $170 | $178 | $172 | $179 | CMS Physician Fee Schedule45; CMS Clinical Diagnostic Laboratory Fee Schedule48 | |
| Thyroid cancer (non-MTC) | References | |||||||
| Parameter | All comparators | Pralsetinib | Selpercatinib | Cabozantinib | Vandetanib | Lenvatinib | Sorafenib | |
| RET testing costa | $1,587 | – | – | – | – | – | – | CMS Clinical Diagnostic Laboratory Fee Schedule48 |
| Treatment duration (months)b | – | 18.4 | 18.4 | 11.2 | 22.6 | 18.3 | 10.8 | USPIs20,37-43 |
| Drug acquisition cost (monthly)c | – | $19,243 | $20,600 | $19,285 | $14,680 | $19,021 | $19,981 | Red Book44 |
| Drug administration cost (monthly) | – | $0 | $0 | $0 | $0 | $0 | $0 | |
| Adverse event cost (one-time) | – | $1,885 | $1,050 | $1,388 | $633 | $2,006 | $701 | USPIs20,37-43; CMS Physician Fee Schedule45; CMS Clinical Diagnostic Laboratory Fee Schedule48; HCUP49; BLS50 |
| Monitoring cost (monthly) | – | $170 | $178 | $172 | $179 | $185 | $170 | CMS Physician Fee Schedule45; CMS Clinical Diagnostic Laboratory Fee Schedule48 |
aTesting assumptions: NSCLC: Assumes 30% of testing is conducted with a targeted genomic sequence analysis panel of 5-50 genes (CPT 81445), 30% of testing is conducted with a targeted genomic sequence analysis panel of > 50 genes (CPT 81455), and 40% of testing is conducted with a FISH test (CPT 88377). MTC: Assumes 35% of testing is conducted with a targeted genomic sequence analysis panel of 5-50 genes (CPT 81445), 55% of testing is conducted with a targeted genomic sequence analysis panel of > 50 genes (CPT 81455), and 10% of testing is conducted with a tier 2, level 6 molecular pathology test (CPT 81405). Thyroid cancer: Assumes 25% of testing is conducted with a targeted genomic sequence analysis panel of 5-50 genes (CPT 81445), 45% of testing is conducted with a targeted genomic sequence analysis panel of > 50 genes (CPT 81455), and 30% of testing is conducted with a FISH test (CPT 88337).
bTreatment durations are based on median PFS for all therapies with the exception of pralsetinib and selpercatinib (both informed by shorter-term [6-19 months] DOR and PFS) and vandetanib (median PFS not reached so conservative assumption uses lower 95% confidence interval). Publicly available response and PFS data are similar for pralsetinib and selpercatinib patient cohorts across all indications; therefore, the analysis assumes pralsetinib DOR is equivalent to selpercatinib DOR and addresses this assumption in sensitivity analyses.
cThe starting dose of selpercatinib can be achieved with 2 different combinations of bottle count and dosage strength; to be conservative, the lower-cost approach (1 bottle × 120 count × 80 mg capsules) was used in the analysis rather than the higher-cost approach (4 bottles × 60 count × 40 mg capsules).
BLS = Bureau of Labor Statistics; CMS = Centers for Medicare & Medicaid Services; CPT = Current Procedural Terminology; DOR = duration of response; FISH = fluorescence in situ hybridization; HCUP = Healthcare Cost and Utilization Project; MTC = medullary thyroid cancer; NSCLC = non-small cell lung cancer; PFS = progression-free survival; RET = rearranged during transfection; USPI = United States prescribing information.
Drug acquisition costs were based on dosing and administration regimens described in US prescribing information (USPI) documents and WAC sourced from the Micromedex Red Book.20,37-44 Infused products also incurred an administration cost based on infusion duration and Medicare reimbursement rates.45
The duration of treatment is an additional parameter required to calculate the cost of each treatment regimen. Duration of treatment in the model was based on median progression-free survival (PFS), with the exception of vandetanib, selpercatinib, and pralsetinib. For vandetanib, the median PFS had not been reached after a median exposure of 607 days; therefore, the lower limit of the 95% confidence interval for PFS was used, a conservative assumption that biases against RET inhibitors. Selpercatinib and pralsetinib were both US Food and Drug Administration (FDA)-approved based on tumor response rate and duration of response (DOR); long-term PFS and response data are not yet available for these comparators, although studies remain ongoing. Therefore, other shorter-term (6-19 months) PFS and response rate data reported in the USPI and in published literature for selpercatinib and pralsetinib informed DOR estimations and an equivalency assumption (tested in sensitivity analyses) in which pralsetinib DOR values were set equal to the selpercatinib estimates.20-22,43,46,47 For example, across all 3 indications and subgroups, the range of patients responding at 6 months for pralsetinib and selpercatinib was similar (58%-100% and 58%-87%, respectively).20,43
Treatment-specific monthly monitoring procedures and rates are based on monitoring recommendations reported in each therapy’s USPI and clinical expert opinion related to specific warnings and precautions listed in each product’s label (Supplementary Table 2, available in online article).20,37-43 Costs based on 2020 Medicare fee schedules (physician and diagnostics) were applied to each monitoring resource to estimate the monthly monitoring costs for each treatment option.45,48
Unit costs of RET fusion/mutation testing used in the model varied by indication given different distributions of testing modalities. A mix of genomic sequence panel tests (Current Procedural Terminology [CPT] codes 81445 and 81455; tests for 5-50 genes and 51 or more genes, respectively), fluorescence in situ hybridization (FISH) tests (CPT code 88377), and molecular pathology tests (CPT code 81405) was assigned to each indication using clinical expert opinion and monetized based on Medicare reimbursement.48 The RET testing cost varied from $1,220 to $1,845 depending on the mix of tests per indication. All potentially eligible patients incur the RET fusion/mutation test cost in the budget impact analysis, although only those with a positive RET fusion/mutation test result receive treatment and incur costs associated with each regimen. Because selpercatinib, a RET-specific agent, is included as a treatment comparator in the current and future scenarios, it was assumed that an increasing RET testing trajectory over time would not be further altered by the addition of pralsetinib (Table 2).
Finally, costs of managing treatment-related AEs were quantified for inclusion in the model (Supplementary Table 3, available in online article). Two criteria were considered for AE inclusion in the analysis based on data in the USPIs: (1) AEs of grade 3+ with an incidence of at least 5% for any one of the comparators in an indication or (2) events listed in the warnings and precautions for the primary treatment comparators (pralsetinib and selpercatinib), regardless of incidence. Then, the incidences for each of the included AEs for each comparator were abstracted from USPIs; if not reported, the AE incidence was considered to be 0%. Because time dependency of the AEs cannot be accurately estimated with USPIs, AEs were assumed to occur early in the treatment period, with costs characterized as one-time rather than ongoing.
AE costs were assumed to be represented primarily by costs of hospitalizations. The probability of hospitalization, as estimated by clinical expert opinion and data in the USPIs, was multiplied by the median hospitalization cost for each AE as extracted from the Agency for Healthcare Research and Quality’s (AHRQ) HCUPnet tool to derive the expected cost of hospitalization for each AE.49 The latest cost data reported by the AHRQ HCUP database at the time of the analysis was from 2016; therefore, hospitalization costs were inflated to 2020 USD using the Hospital Services Consumer Price Index for inclusion in the model.50
To more fully characterize the potential costs of AE management, other relevant resources (ie, clinician visits, electrocardiograms, complete blood counts, liver function tests, and urinalysis) were estimated based on clinical expert opinion for each event. Costs of these resources were based on the same sources as for ongoing patient monitoring.45,48 An overall unit cost for each AE was, therefore, the sum of the expected hospitalization cost and the costs of any of the other relevant health care resources considered.
ANALYSES
The BIM calculates the total budget impact and PMPM budget impact for a hypothetical health plan of 1 million members over a 3-year period. The direct economic impact to a health plan budget of pralsetinib adoption depends on the estimated number of patients with NSCLC, MTC, or non-MTC thyroid cancer who are tested for RET fusion/mutation and treated, if positive, as well as the costs associated with treatment.
The base-case payer mix in the BIM reflects the distribution of commercial, Medicare, and Medicaid lines of business in the US insured population (Supplementary Table 1).27 Based on the age and sex distribution in these types of plans and epidemiologic parameters for each indication, the number of patients in the hypothetical plan was calculated. This estimate was further refined using the estimated RET testing rate and prevalence of RET fusion/mutation to determine the number of patients who would be treated and incur costs relevant to the budget impact analysis.
In the base-case analyses, the model quantifies total treatment-related costs for each indication and costs stratified by type (drug acquisition, etc). Therefore, the incremental budget impact is calculated for each indication and as a total of all 3 indications. Sensitivity analyses of key variables were conducted to determine the impact of parameter uncertainty on the results and conclusions. Both one-way sensitivity analyses and multi-way scenario analyses were performed.
All cost parameters and analysis results are reported in 2020 USD. To be consistent with ISPOR guidelines,26 costs incurred in the future were not discounted to net present value.
Results
BASE-CASE ANALYSIS
The results of the budget impact analyses are summarized in Table 4 by indication. In a 1 million-member plan with commercial, Medicare, and Medicaid patients, it was estimated that up to 6 new RET-positive patients would initiate treatment annually by year 3, with most (77%) of the patients being treated for metastatic RET fusion-positive NSCLC. Fewer than 1 patient (on average) for each of the MTC and non-MTC thyroid cancer indications were estimated to initiate treatment annually in the plan.
TABLE 4.
Base-Case Results
| Result | NSCLC | MTC | Thyroid cancer (non-MTC) | ||||||
|---|---|---|---|---|---|---|---|---|---|
| Year 1 | Year 2 | Year 3 | Year 1 | Year 2 | Year 3 | Year 1 | Year 2 | Year 3 | |
| Patient count | |||||||||
| Number of new patients treated | 2.0 | 3.3 | 4.6 | 0.7 | 0.7 | 0.7 | 0.5 | 0.7 | 0.7 |
| With pralsetinib available, $ | |||||||||
| Drug cost | 265,910 | 606,671 | 1,183,436 | 138,197 | 203,359 | 239,832 | 106,387 | 190,793 | 229,992 |
| Administration cost | 1,486 | 1,584 | 676 | 0 | 0 | 0 | 0 | 0 | 0 |
| Monitoring cost | 2,778 | 5,768 | 10,540 | 1,324 | 1,937 | 2,163 | 1,005 | 1,793 | 2,076 |
| Adverse event cost | 1,937 | 3,967 | 6,785 | 790 | 860 | 939 | 620 | 923 | 1,002 |
| RET testing cost | 119,169 | 198,616 | 278,062 | 1,610 | 1,610 | 1,610 | 4,629 | 6,481 | 6,481 |
| Total | 391,281 | 816,606 | 1,479,499 | 141,921 | 207,767 | 244,544 | 112,641 | 199,990 | 239,550 |
| Without pralsetinib available, $ | |||||||||
| Drug cost | 269,727 | 622,734 | 1,221,911 | 139,475 | 207,302 | 247,024 | 107,356 | 194,362 | 236,707 |
| Administration cost | 1,486 | 1,584 | 676 | 0 | 0 | 0 | 0 | 0 | 0 |
| Monitoring cost | 2,802 | 5,868 | 10,779 | 1,332 | 1,961 | 2,208 | 1,011 | 1,815 | 2,117 |
| Adverse event cost | 1,672 | 2,973 | 4,569 | 725 | 714 | 694 | 570 | 766 | 741 |
| RET testing cost | 119,169 | 198,616 | 278,062 | 1,610 | 1,610 | 1,610 | 4,629 | 6,481 | 6,481 |
| Total | 394,856 | 831,775 | 1,515,997 | 143,143 | 211,586 | 251,536 | 113,566 | 203,425 | 246,045 |
| Incremental results, $ | |||||||||
| Drug cost | −3,817 | −16,063 | −38,475 | −1,279 | −3,942 | −7,192 | −969 | −3,569 | −6,715 |
| Administration cost | 0 | 0 | 0 | 0 | 0 | 0 | 0 | 0 | 0 |
| Monitoring cost | −24 | −100 | −239 | −8 | −24 | −45 | −6 | −22 | −42 |
| Adverse event cost | 265 | 994 | 2,215 | 65 | 147 | 245 | 50 | 157 | 261 |
| RET testing cost | 0 | 0 | 0 | 0 | 0 | 0 | 0 | 0 | 0 |
| Total | −3,576 | −15,169 | −36,498 | −1,221 | −3,820 | −6,992 | −925 | −3,434 | −6,495 |
| Total (PMPM) | −0.0003 | −0.0013 | −0.0030 | −0.0001 | −0.0003 | −0.0006 | −0.0001 | −0.0003 | −0.0005 |
MTC = medullary thyroid cancer; NSCLC = non-small cell lung cancer; PMPM = per member per month; RET = rearranged during transfection.
Overall, the total costs were slightly lower when pralsetinib was available compared to a market without pralsetinib for all 3 indications. This cost reduction was primarily due to lower drug acquisition and monitoring costs and was slightly offset by a small increase in AE costs.
In year 1 of pralsetinib availability, average total annual health plan expenditures for treating eligible NSCLC patients were $391,281 vs $394,856 without pralsetinib, for an incremental annual budget reduction of $3,576, which is equivalent to a PMPM impact of −$0.0003. The PMPM costs in the second and third years of pralsetinib availability were estimated to be −$0.0013, and −$0.003, respectively.
Given the fewer MTC and non-MTC thyroid cancer patients treated relative to NSCLC, total annual costs were substantially lower for these 2 populations. In year 3 of pralsetinib availability, expenditures for advanced or metastatic RET-mutant MTC patients were $244,544 and $251,536 (with and without pralsetinib available, respectively), representing a cost reduction of $6,992 ($0.0006 PMPM). Similar results were observed in year 3 for metastatic RET fusion-positive thyroid cancer: $239,550 and $246,045 (with and without pralsetinib available, respectively), for a cost reduction of $6,495 ($0.0005 PMPM).
Although presentation of the budget impact results by indication illustrates the importance of disease epidemiology on the magnitude of the budget impact, it does not demonstrate the total costs to a plan if pralsetinib is on formulary for all 3 indications. Totaling the costs in year 3 of pralsetinib availability for eligible patients with any of the 3 indicated cancer types, the annual expenditures were $1,963,593 for the future scenario and $2,013,579 for the current scenario. This represents cost savings of approximately $50,000 (−$0.0042 PMPM) annually if pralsetinib is included on formulary for the 3 approved indications.
The key cost drivers in the analysis vary by indication (Table 4). Drug acquisition costs make up 68% to 81% of total costs in NSCLC (varies by year) but 94% to 98% for MTC and non-MTC thyroid cancer. RET testing costs play a larger role in NSCLC due to disease and RET epidemiology. For example, in the 1 million-member plan, approximately 326 NSCLC patients are estimated to receive a RET test per year compared to 6 non-MTC thyroid cancer patients or 1 MTC patient. These substantial differences in patient counts drive the higher testing cost for NSCLC.
AE management was projected to result in an incremental cost after the introduction of pralsetinib (Table 4). However, due to a relatively similar safety profile across most of the comparators, the total added cost of AE management in year 3 of pralsetinib availability was less than $3,000 for the entire treated patient cohort ($2,215 for NSCLC, $245 for MTC, and $261 for non-MTC thyroid cancer).
SENSITIVITY AND SCENARIO ANALYSES
One-way deterministic sensitivity analyses were conducted by varying key parameter values within credible ranges. Results of the sensitivity analyses of the model are illustrated in tornado diagrams that (1) combine all 3 indications (Supplementary Figure 1, available in online article) or (2) present indication-specific results (Supplementary Figures 2-4, available in online article). Overall, for the combined indications, uncertainty in the duration of RET inhibitor treatment had the most influence on the potential incremental budget impact. When the selpercatinib duration of treatment was varied over plausible ranges, the base case PMPM budget impact in year 3 of −$0.0042 could increase by up to $0.0117 PMPM (to $0.0075) or decrease by up to −$0.0133 PMPM (to −$0.0175). Results were similar when pralsetinib duration of treatment was varied. Increasing the monthly pralsetinib or selpercatinib drug cost (eg, to reflect future possible price increases) or decreasing the monthly cost (using a best estimate of possible price reductions or rebates in the oncology field) also led to PMPM increases up to $0.0111 PMPM (at the highest selpercatinib cost) or decreases to −$0.0184 (at the lowest pralsetinib cost). Changes to the estimated RET inhibitor market shares had the smallest change of key parameters tested; in this case, decreasing or increasing those parameters only changed the budget impact by ±$0.0006. The key drivers in indication-specific sensitivity analysis were similar across all 3 indications and to the aggregate results.
Although analyses demonstrated little budget impact sensitivity to modifications in the RET inhibitor market share with tradeoffs between the 2 products and no market share change to the remaining comparators, it is conceivable that the availability of 2 RET inhibitors in the future market may have greater impact on the comparator market share than forecast. Similarly, the degree to which health care providers may increase RET testing in response to a new market condition with 2 such products is uncertain. These 2 situations were evaluated in scenario analyses.
First, when non-RET inhibitor market share was projected to decrease more substantially than in the base case after introduction of pralsetinib, a minor increase in the year 3 aggregate budget impact was observed (PMPM increased from −$0.0042 to $0.0029; Supplementary Table 4, available in online article). Market share trajectories for non-RET inhibitor products in the base case already assumed a substantial replacement effect (Table 2), which limits the budget impact of even greater replacement by RET inhibitors.
In the second scenario, a shift to higher RET testing rates after pralsetinib introduction results in approximately 0.7 additional patients being treated in year 3 than in the base case, a 12% increase (Supplementary Table 4). This results in a budget impact increase of approximately $0.0214 PMPM (from −$0.0042 PMPM to $0.0172 PMPM), largely due to the cost increase in NSCLC patients given their larger cohort size.
Finally, because the model evaluates a hypothetical health plan with a mixed line of business (~65% commercial), additional analyses were conducted to evaluate the budget impact by payer type (Supplementary Table 5, available in online article). The results highlight the importance of disease epidemiology and demographic differences by payer in our analyses. With a much older population, a Medicare-based plan was estimated to treat approximately 5 times more NSCLC patients than a commercial plan and 9 times more than a Medicaid plan. The number of thyroid cancer patients varied to a much lesser extent due to a much smaller gradient in age-related incidence compared to NSCLC.
As expected, the budget impact results by payer type were correlated with the number of patients treated. A higher number of patients treated (ie, Medicare) yielded greater cost reductions for a plan when pralsetinib was available. Conversely, when fewer patients were treated, relatively smaller cost reductions were achieved. However, in all scenarios, the introduction of pralsetinib yielded cost savings.
Discussion
As is increasingly customary in the United States, a budget impact analysis is expected by payers to better inform the potential financial impact of product adoption on the plan, especially in oncology, as numerous new treatment options become available. This analysis considered the budget impact of pralsetinib for the treatment of 3 types of cancer and is, to our knowledge, the first published economic analysis of an agent targeting RET-altered tumors.
The BIM estimates that the eligible patient population with metastatic RET-positive NSCLC, advanced or metastatic RET-mutant MTC, or advanced or metastatic RET fusion-positive thyroid cancer is likely to be relatively small—ranging from approximately 0.7 to 4.6 patients per million members, depending on indication. This is due to an assumption of a relatively high level of testing for RET alterations (70%-100% in year 3), assuming cancer treatment guidelines and compendia will increasingly endorse molecular testing; lower testing rates would yield fewer treatment-eligible patients in a health plan.
Given the lower wholesale acquisition cost of pralsetinib compared with the only other FDA-approved product for RET-altered cancers, selpercatinib, the model results suggest that the addition of pralsetinib would result in a modest overall cost reduction to a health plan for all 3 indications, despite a small increase in AE costs. Savings to a 1 million-member plan in year 3 after pralsetinib adoption would range from ~$6,500 to ~$36,500 (−$0.0005 to −$0.003 PMPM), depending on indication.
Key economic drivers in the analysis were drug costs and, for NSCLC, the cost of RET testing. Therefore, the budget impact results were most sensitive to RET inhibitor WAC and treatment duration and, as demonstrated in scenario analyses, assumptions about the trajectory of RET testing after the introduction of pralsetinib. The similar safety profile of most of the comparators resulted in only a small incremental cost of AE management associated with pralsetinib use.
One strength of our budget impact analysis is the detailed methodology for estimating the number of eligible patients in a health plan. In addition, our BIM includes several lines of business and, therefore, was able to demonstrate the potential variability in the economic impact of product adoption by payer type. Further, model findings were robust to sensitivity and scenario analyses, which showed that even with large changes to individual input values or alternative assumptions about the impact of pralsetinib availability on physician practice, the PMPM budget impact remains quite modest (maximum of $0.0015-$0.0155 PMPM across all 3 indications or up to $0.0172 PMPM in the aggregate) in the third year following availability.
The field of oncology is rapidly evolving as advancements in diagnostic testing and targeted drug development drive new treatment options for cancer patients. Biomarker tests to identify actionable driver mutations and the use of appropriate targeted therapies can improve clinical outcomes.51,52 However, over half of patients with genetic alterations do not receive guideline-recommended targeted therapy.52 Patients may also receive therapies with suboptimal selectivity, leading to high rates of dose reduction and discontinuation.30 The financial impact of inefficient therapy use, while harder to measure than clinical outcomes, should be considered in future studies.
LIMITATIONS
There are several notable limitations with this analysis. Data on epidemiology for patients with RET-altered tumors tend to be based on observational studies or studies with small sample sizes. Therefore, our model assumed that the age and sex distribution observed in the general NSCLC and thyroid cancer populations applies equally to patients with advanced or metastatic RET-altered tumors.
Comparator market share and the impact of pralsetinib adoption on the use of other treatments are based on assumptions and are therefore uncertain. However, varying these assumptions demonstrated that much lower or higher rates of pralsetinib uptake yield only nominal changes in the base-case incremental budget impact results.
The use of specific molecular tests also varies by indication. This model assumed a mix of FISH, molecular pathology, and more expensive next-generation sequencing (NGS) panel tests. Because the default model assumption is that the adoption of pralsetinib does not affect the RET testing trajectory, the actual mix of tests and test costs does not affect the budget impact results. Higher reliance on NGS panel testing could increase testing-related costs to the health plan. However, based on scenario analyses of increased RET testing after pralsetinib introduction, it appears reasonable to conclude that the budget impact would remain modest with higher NGS testing.
Estimating the duration of treatment for all comparators in the model required the use of different proxy measures, which results in some uncertainty. Given the lack of long-term PFS and DOR data for the targeted RET therapies, an assumption of equivalency was made. However, this assumption was evaluated in sensitivity analyses and demonstrated only a modest effect on the results.
Although the budget impact model includes 3 payer types, not all parameters are adjusted for each payer (eg, medical resource use costs or drug costs are not varied by payer). While this may bias sensitivity analyses by payer type, we judged the magnitude of this bias to be minimal given that payer-specific cost parameters would be applied in both the with and without pralsetinib scenarios.
Finally, the model does not evaluate sequential lines of therapy and treatment algorithms, nor does it directly compare incremental costs and outcomes of treatment with RET inhibitors to nontargeted therapy, all of which would be hallmarks of a cost-effectiveness analysis. As longer-term clinical data become available for pralsetinib and selpercatinib, this type of economic evaluation may be feasible.
Conclusions
Pralsetinib activity and potency in RET-altered tumors have led to the accelerated US approval of pralsetinib for treating certain patients with metastatic NSCLC or advanced/metastatic thyroid cancer. Given the rarity of RET-altered cancers in this budget impact analysis and the lower monthly cost of pralsetinib compared with selpercatinib, pralsetinib is projected to incur a manageable budget impact to a US health plan, with a modest overall cost reduction compared to existing treatment options, across all 3 approved indications.
REFERENCES
- 1.World Health Organization, International Agency for Research on Cancer. All cancers fact sheet. Accessed October 4, 2021. https://gco.iarc.fr/today/data/factsheets/cancers/39-All-cancers-fact-sheet.pdf
- 2.Duma N, Santana-Davila R, Molina JR. Non-small cell lung cancer: epidemiology, screening, diagnosis, and treatment. Mayo Clin Proc. 2019;94(8):1623-40. [DOI] [PubMed] [Google Scholar]
- 3.Herbst RS, Morgensztern D, Boshoff C. The biology and management of non-small cell lung cancer. Nature. 2018;553(7689):446-54. [DOI] [PubMed] [Google Scholar]
- 4.Zappa C, Mousa SA. Non-small cell lung cancer: current treatment and future advances. Transl Lung Cancer Res. 2016;5(3):288-300. [DOI] [PMC free article] [PubMed] [Google Scholar]
- 5.Siegel RL, Miller KD, Jemal A. Cancer statistics, 2020. CA Cancer J Clin. 2020;70(1):7-30. [DOI] [PubMed] [Google Scholar]
- 6.Jung CK, Little MP, Lubin JH, et al. The increase in thyroid cancer incidence during the last four decades is accompanied by a high frequency of BRAF mutations and a sharp increase in RAS mutations. J Clin Endocrinol Metab. 2014;99(2): E276-85. [DOI] [PMC free article] [PubMed] [Google Scholar]
- 7.Shah JP. Thyroid carcinoma: epidemiology, histology, and diagnosis. Clin Adv Hematol Oncol. 2015;13(4 Suppl 4):3-6. [PMC free article] [PubMed] [Google Scholar]
- 8.American Thyroid Association. Cancer of the thyroid. Accessed October 4, 2021. https://www.thyroid.org/medullary-thyroid-cancer/
- 9.Yabroff KR, Lamont EB, Mariotto A, et al. Cost of care for elderly cancer patients in the United States. J Natl Cancer Inst. 2008;100(9):630-41. [DOI] [PubMed] [Google Scholar]
- 10.Aschebrook-Kilfoy B, Schechter RB, Shih YC, et al. The clinical and economic burden of a sustained increase in thyroid cancer incidence. Cancer Epidemiol Biomarkers Prev. 2013;22(7):1252-59. [DOI] [PubMed] [Google Scholar]
- 11.Salvatore D, Santoro M, Schlumberger M. The importance of the RET gene in thyroid cancer and therapeutic implications. Nat Rev Endocrinol. 2021;17(5):296-306. [DOI] [PubMed] [Google Scholar]
- 12.Subbiah V, Yang D, Velcheti V, Drilon A, Meric-Bernstam F. State-of-the-art strategies for targeting RET-dependent cancers. J Clin Oncol. 2020;38(11):1209-21. [DOI] [PMC free article] [PubMed] [Google Scholar]
- 13.Ciampi R, Nikiforov YE. RET/PTC rearrangements and BRAF mutations in thyroid tumorigenesis. Endocrinology. 2007;148(3):936-41. [DOI] [PubMed] [Google Scholar]
- 14.Kato S, Subbiah V, Marchlik E, Elkin SK, Carter JL, Kurzrock R. RET aberrations in diverse cancers: next-generation sequencing of 4,871 patients. Clin Cancer Res. 2017;23(8):1988-97. [DOI] [PubMed] [Google Scholar]
- 15.Kohno T, Ichikawa H, Totoki Y, et al. KIF5B-RET fusions in lung adenocarcinoma. Nat Med. 2012;18(3):375-77. [DOI] [PMC free article] [PubMed] [Google Scholar]
- 16.Lipson D, Capelletti M, Yelensky R, et al. Identification of new ALK and RET gene fusions from colorectal and lung cancer biopsies. Nat Med. 2012;18(3):382-84. [DOI] [PMC free article] [PubMed] [Google Scholar]
- 17.Mulligan LM. RET revisited: expanding the oncogenic portfolio. Nat Rev Cancer. 2014;14(3):173-86. [DOI] [PubMed] [Google Scholar]
- 18.Paratala BS, Chung JH, Williams CB, et al. RET rearrangements are actionable alterations in breast cancer. Nat Comm. 2018;9(1):4821. [DOI] [PMC free article] [PubMed] [Google Scholar]
- 19.Subbiah V, Cote GJ. Advances in targeting RET-dependent cancers. Cancer Discov. 2020;10(4):498-505. [DOI] [PMC free article] [PubMed] [Google Scholar]
- 20.Gavreto prescribing information. Blueprint Medicines; April 2021.
- 21.Gainor JF, Curigliano G, Kim DW, et al. Pralsetinib for RET fusion-positive non-small-cell lung cancer (ARROW): a multi-cohort, open-label, phase 1/2 study. Lancet Oncol. 2021;22(7):959-69. [DOI] [PubMed] [Google Scholar]
- 22.Subbiah V, Hu MI, Wirth LJ, et al. Pralsetinib for patients with advanced or metastatic RET-altered thyroid cancer (ARROW): a multi-cohort, open-label, registrational, phase 1/2 study. Lancet Diabetes Endocrinol. 2021;9(8):491-501. [DOI] [PubMed] [Google Scholar]
- 23.Hu M, Subbiah V, Wirth LJ, et al. Results from the registrational phase I/II ARROW trial of pralsetinib (BLU-667) in patients (pts) with advanced RET mutation-positive medullary thyroid cancer (RET + MTC). Ann Oncol. 2020;31(suppl_4):S1026-S1033. [Google Scholar]
- 24.Elisei R, Schlumberger MJ, Müller SP, et al. Cabozantinib in progressive medullary thyroid cancer. J Clin Oncol. 2013;31(29):3639-46. [DOI] [PMC free article] [PubMed] [Google Scholar]
- 25.Wells SA Jr, Robinson BG, Gagel RF, et al. Vandetanib in patients with locally advanced or metastatic medullary thyroid cancer: a randomized, double-blind phase III trial. J Clin Oncol. 2012;30(2):134-41. [DOI] [PMC free article] [PubMed] [Google Scholar]
- 26.Sullivan SD, Mauskopf JA, Augustovski F, et al. Budget impact analysis—principles of good practice: report of the ISPOR 2012 Budget Impact Analysis Good Practice II Task Force. Value Health. 2014;17(1):5-14. [DOI] [PubMed] [Google Scholar]
- 27.Census Bureau. Current population survey, annual social and economic supplement, 2019. Table 1. Population by age and sex: 2019. April 2020. Accessed October 4, 2021. https://www.census.gov/data/tables/2019/demo/age-and-sex/2019-age-sex-composition.html
- 28.National Institutes of Health. SEER 21 data for recent trends in SEER age-adjusted incidence rates 2000-2017, lung and bronchus cancer; by sex, all races (includes Hispanic), all ages, all stages, observed and delay-adjusted rates. Accessed October 4, 2021. https://seer.cancer.gov/explorer/application.html?site=47&data_type=1&graph_type=2&compareBy=sex&chk_sex_3=3&chk_sex_2=2&race=1&age_range=160&stage=101&rate_type=2&advopt_precision=1&advopt_display=1
- 29.National Institutes of Health. SEER 21 data for recent trends in SEER age-adjusted incidence rates 2000-2017, thyroid cancer; by sex, all races (includes Hispanic), all ages, all stages, observed and delay-adjusted rates. Accessed October 4, 2021. https://seer.cancer.gov/explorer/application.html?site=80&data_type=1&graph_type=2&compareBy=sex&chk_sex_3=3&chk_sex_2=2&race=1&age_range=1&stage=101&rate_type=1&advopt_precision=1&advopt_display=2
- 30.Drilon A, Hu ZI, Lai GGY, Tan DSW. Targeting RET-driven cancers: lessons from evolving preclinical and clinical landscapes. Nat Rev Clin Oncol. 2018;15(3):151-67. [DOI] [PMC free article] [PubMed] [Google Scholar]
- 31.Elisei R, Tacito A, Ramone T, et al. Twenty-five years experience on RET genetic screening in hereditary MTC: an update on the prevalence of germline RET mutations. Genes (Basel). 2019;10(9):698. [DOI] [PMC free article] [PubMed] [Google Scholar]
- 32.Hirsch FR, Scagliotti GV, Mulshine JL, et al. Lung cancer: current therapies and new targeted treatments. Lancet. 2017;389(10066):299-311. [DOI] [PubMed] [Google Scholar]
- 33.Lee MY, Ku BM, Kim HS, et al. Genetic alterations and their clinical implications in high-recurrence risk papillary thyroid cancer. Cancer Res Treat. 2017;49(4):906-14. [DOI] [PMC free article] [PubMed] [Google Scholar]
- 34.Pietrowska M, Diehl HC, Mrukwa G, et al. Molecular profiles of thyroid cancer subtypes: classification based on features of tissue revealed by mass spectrometry imaging. Biochim Biophys Acta Proteins Proteom. 2017;1865(7):837-45. [DOI] [PubMed] [Google Scholar]
- 35.Prescott JD, Zeiger MA. The RET oncogene in papillary thyroid carcin oma. Cancer. 2015;121(13):2137-46. [DOI] [PubMed] [Google Scholar]
- 36.Randle RW, Balentine CJ, Leverson GE, et al. Trends in the presentation, treatment, and survival of patients with medullary thyroid cancer over the past 30 years. Surgery. 2017;161(1):137-46. [DOI] [PMC free article] [PubMed] [Google Scholar]
- 37.Alimta. Prescribing information. Eli Lilly; June 2018. [Google Scholar]
- 38.Caprelsa. Prescribing information. Genzyme Corporation; June 2020. [Google Scholar]
- 39.Cometriq. Prescribing information. Exelixis; January 2020. [Google Scholar]
- 40.Keytruda. Prescribing information. Merck & Co.; April 2020. [Google Scholar]
- 41.Lenvima. Prescribing information. Eisai; August 2018. [Google Scholar]
- 42.Nexavar. Prescribing information. Bayer HealthCare Pharmaceuticals; December 2018. [Google Scholar]
- 43.Retevmo. Prescribing information. Eli Lilly; May 2020. [Google Scholar]
- 44.IBM. Micromedex RED BOOK. Database. Accessed May 26, 2020. https://www.ibm.com/products/micromedex-red-book
- 45.Centers for Medicare & Medicaid Services. 2020. Medicare Physician Fee Schedule. Accessed May/June 2020. https://www.cms.gov/apps/physician-fee-schedule/search/search-criteria.aspx
- 46.Drilon A, Oxnard GR, Tan DSW, et al. Efficacy of selpercatinib in RET fusionpositive non-small-cell lung cancer. N Engl J Med. 2020;383(9):813-24. [DOI] [PMC free article] [PubMed] [Google Scholar]
- 47.Wirth LJ, Sherman E, Robinson B, et al. Efficacy of selpercatinib in RET-altered thyroid cancers. N Engl J Med. 2020;383(9):825-35. [DOI] [PMC free article] [PubMed] [Google Scholar]
- 48.Centers for Medicare & Medicaid Services. 2020. Medicare Clinical Diagnostic Laboratory Fee Schedule. Accessed June 2020. https://www.cms.gov/medicaremedicare-fee-service-paymentclinicallabfeeschedclinical-laboratory-fee-schedule-files/20clabq2
- 49.Healthcare Cost and Utilization Project (HCUP). 2016. Accessed June 9, 2020. http://hcupnet.ahrq.gov/
- 50.Bureau of Labor Statistics. Hospital Services Consumer Price Index. 2020. Accessed June 9, 2020. https://www.bls.gov/cpi/data.htm
- 51.Kris MG, Johnson BE, Berry LD, et al. Using multiplex assays of oncogenic drivers in lung cancers to select targeted drugs. JAMA. 2014;311(19):1998-2006. [DOI] [PMC free article] [PubMed] [Google Scholar]
- 52.Singal G, Miller PG, Agarwala V, et al. Association of patient characteristics and tumor genomics with clinical outcomes among patients with non-small cell lung cancer using a clinicogenomic database. JAMA. 2019;321(14):1391-99. [DOI] [PMC free article] [PubMed] [Google Scholar]