

Abstract
Although the programmed cell death protein 1 (PD-1) blockade has been authorized for the treatment of recurrent and metastatic cervical cancer (CC) patients, a significant proportion of CC patients show low objective response rates (ORR) to immune checkpoint blockades (ICBs). Therefore, identifying novel combination treatment strategies to enhance ICBs therapeutic efficacy for CC patients is urgently needed. Here, we discovered that CD39 was highly expressed in exhausted CD8 + T cells from 10 CC patients in our center via single-cell RNA sequencing (scRNA-seq). Furthermore, we validated that CC patients with CD39 highly expressed in CD8 + T cells associated with poor prognosis and immunoevasive subtype of CC both in cohort from our center and the Cancer Genome Atlas (TCGA) database. Moreover, it was also confirmed that CD39-inhibiting not only enhanced the cytotoxicity of CD8 + tumor-infiltrating lymphocytes (TILs) but also promoted the infiltration of B cells through increasing CXCL13 secretion both in vitro experiments and subcutaneous tumor models, thereby amplifying anti-tumor immunity of PD-1 blockade. What was more, we have developed a liposome containing POM-1, which effectively enhanced the anti-tumor effect of POM-1. Our findings provide compelling evidence that targeting CD39 represents a promising “two birds with one stone” strategy for cervical cancer treatment.
Supplementary Information
The online version contains supplementary material available at 10.1186/s12951-025-03500-0.
Keywords: Cervical cancer (CC), Tumor microenvironment, Immune checkpoint blockage (ICB), αCD39, B cells, Exhausted T cells
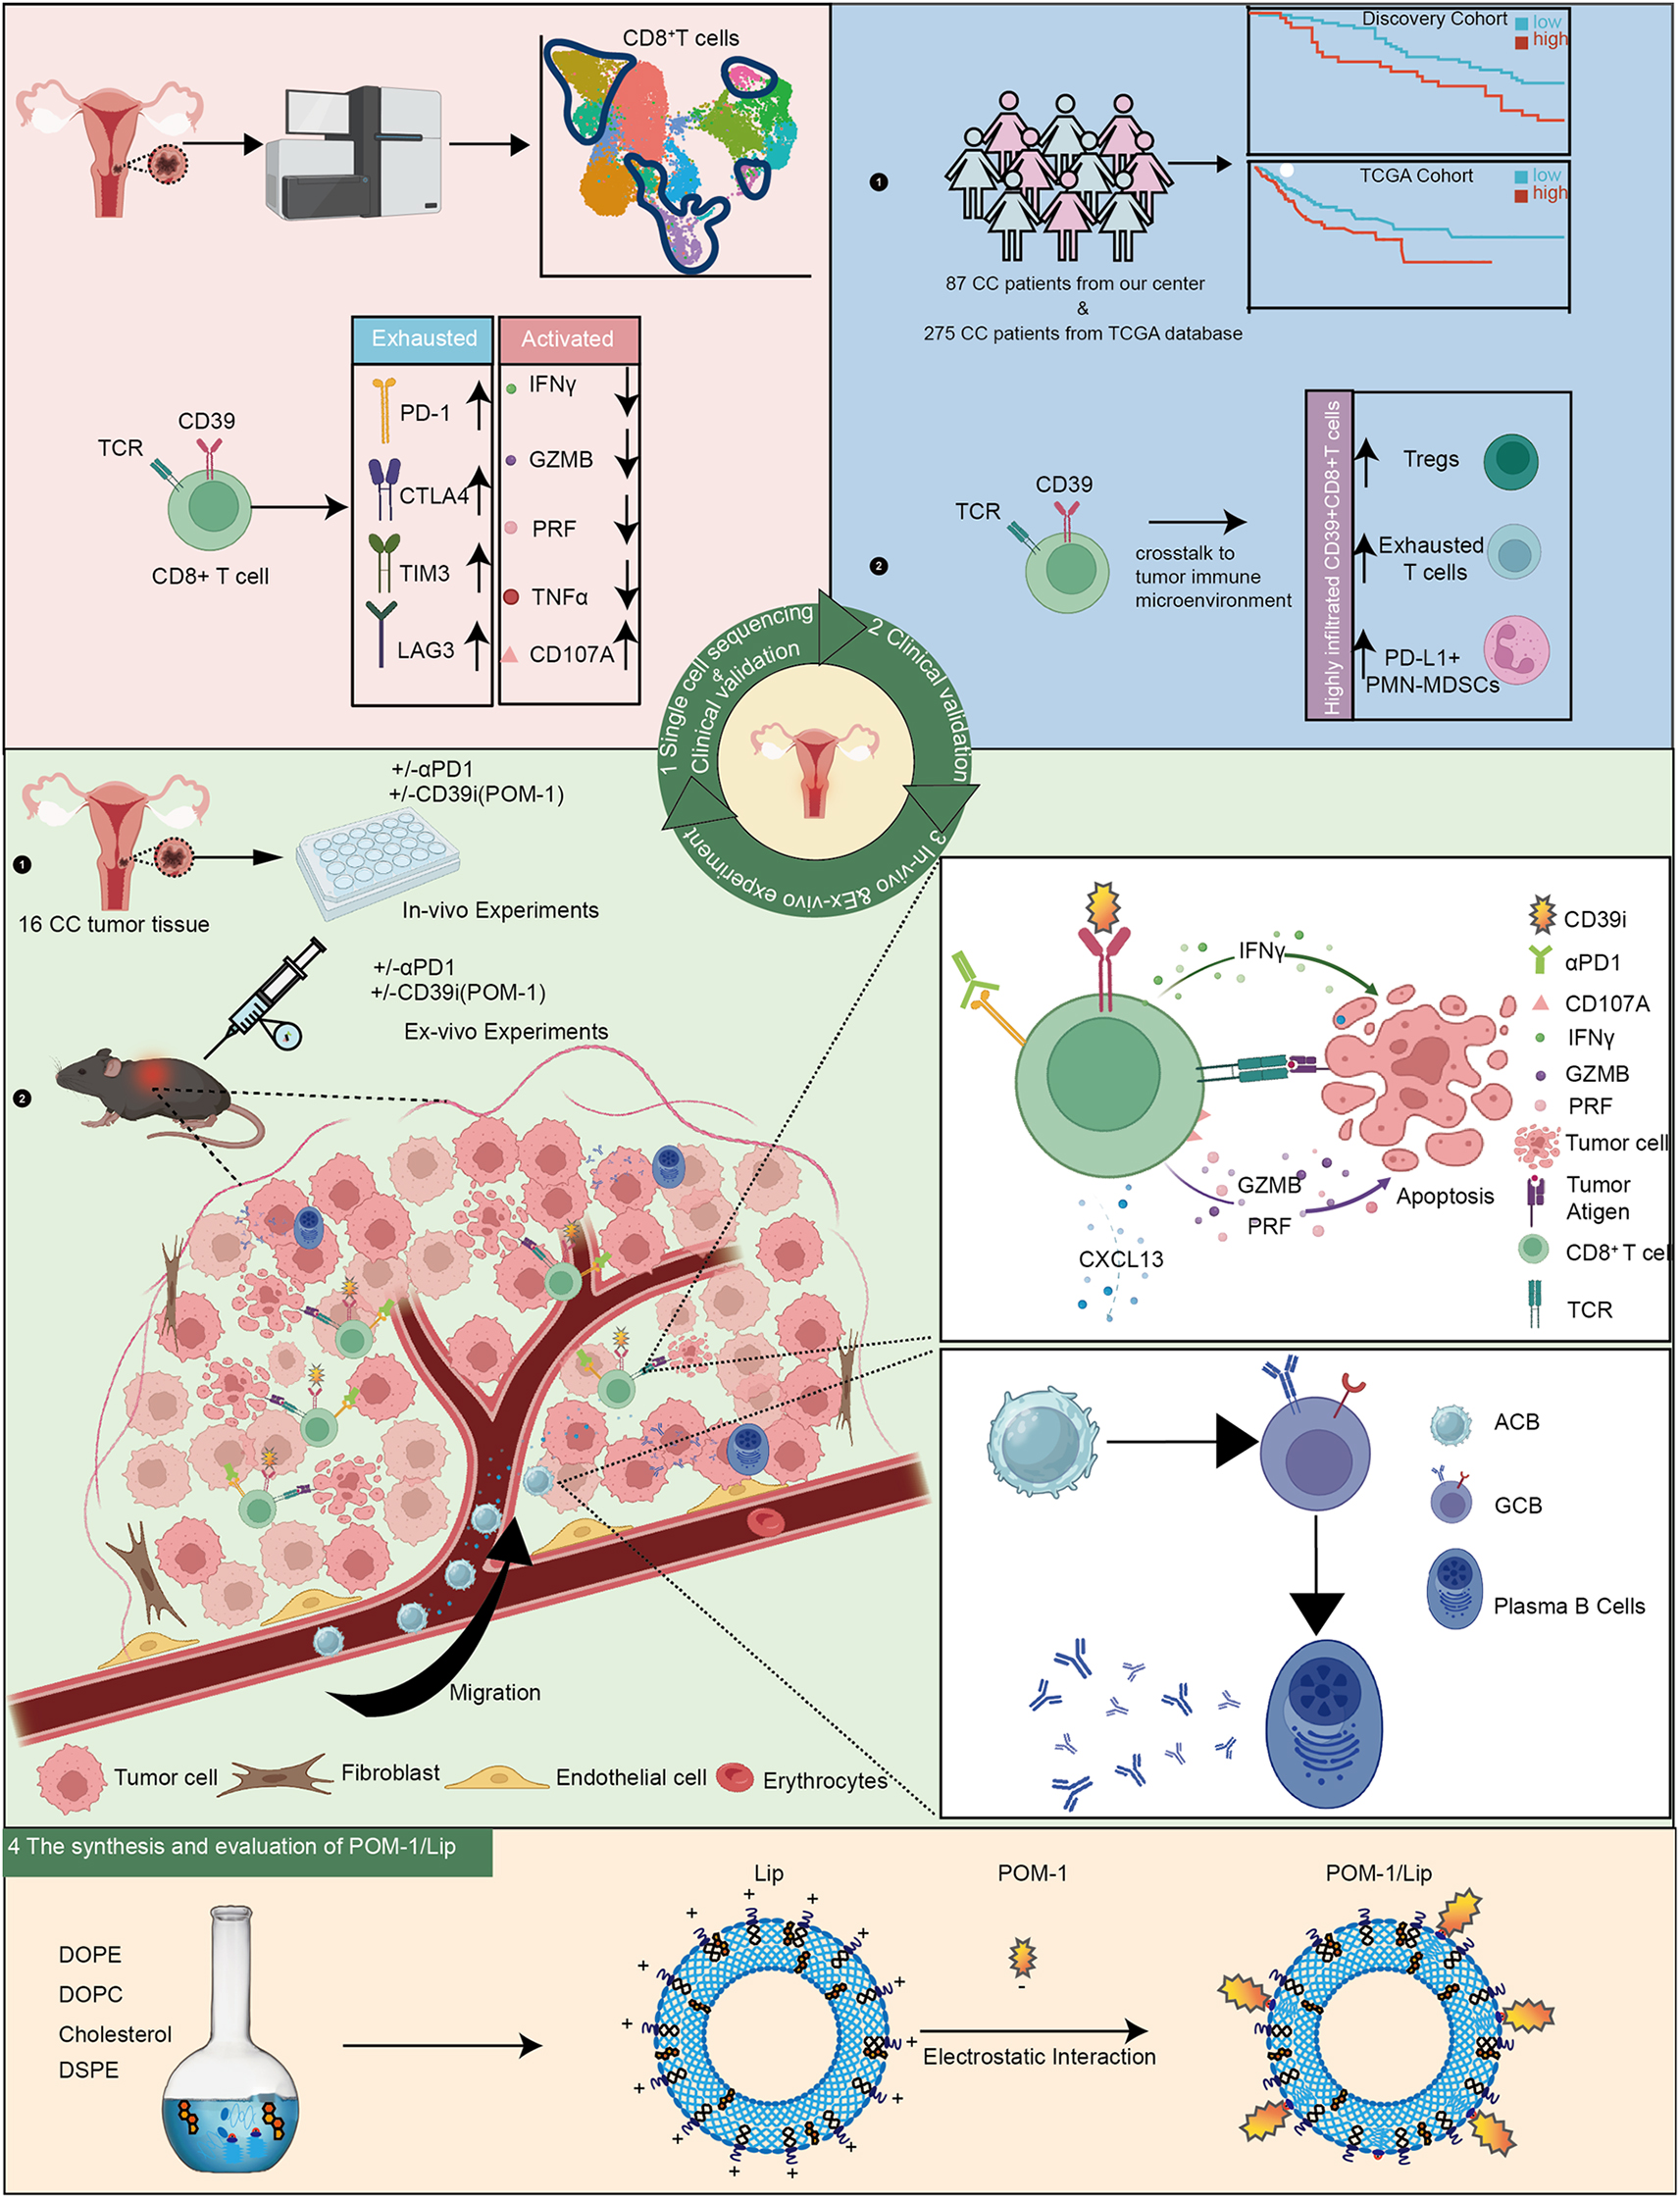
Graphical abstract
Introduction
Although the highly effective primary (HPV vaccine) and secondary (screening) prevention measures have been taken [1], cervical cancer (CC) is the fourth leading cause of death in women, even the leading cause of cancer death in some developing countries, with 342,000 deaths in 2020 [2]. Currently, surgery, radiotherapy and platinum-based chemotherapy combined with bevacizumab are the first-line strategy for advanced CC patients [3]. However, the prognosis is barely satisfactory, the 5-year survival rate for patients with regional lymph nodes metastasis was 60.8% and for distant- metastatic patients was only 19.4% [4]. Therefore, superior therapies are needed for CC patients.
The application of immune checkpoints blockade (ICBs) provides a new treatment strategy for the CC patients. In recent decades, ICBs therapies have achieved huge effectiveness in certain solid tumors [5–7]. Nevertheless, landmark clinical trials of pembrolizumab of recurrence and metastasis CC patients showed limited objective response rate (ORR), only 14.6-17% [8, 9], which is far from reaching its potential effectiveness. A considerable number of CC patients suffer from tumor cell-intrinsic and tumor-extrinsic ICBs resistance [10, 11]. Combinational therapies show attractive prospects to overcome ICBs resistance and improve the efficacy [10]. Interestingly, we discovered CD39 was significantly elevated in CD8 + exhausted T cells from single-cell atlas of 10 CC patients in our center. CD39 (ectonucleoside triphosphate diphosphohydrolase 1; encoded by ENTPD1), converts adenosine triphosphate (ATP) and adenosine diphosphate (ADP) into immunosuppressive adenosine (ADO) in tumor microenvironment synergizing with CD73 [12–14]. These findings position CD39 as a promising therapeutic target to potentially reverse T cell exhaustion and improve ICB efficacy.
The CD39 inhibitor POM-1, despite its therapeutic potential in modulating adenosine-mediated immunosuppression, exhibits significant vascular toxicity in preclinical models. Studies have demonstrated that POM-1 administration in mice may induce adverse effects including thrombosis and hepatopancreatic damage [15, 16]. To address these limitations, nanoscale liposomes emerge as a promising drug delivery platform due to their intrinsic advantages: (1) reduced systemic toxicity by encapsulating toxic agents, (2) sustained drug release to prolong therapeutic duration, and (3) decreased dosing frequency through optimized pharmacokinetics [17]. Therefore, developing a liposome-based POM-1 delivery system could synergistically enhance drug safety by minimizing off-target toxicity while potentiating antitumor efficacy via controlled release mechanisms.
Herein, we revealed that CD39 + CD8 + T cells illustrated exhaustion in CC patients. Furthermore, we verified the expression of CD39 was significantly increased in advanced CC patients and tightly associated with the poor prognosis both in our center cohort and The Cancer Genome Atlas (TCGA) cohort. Moreover, we also found that the combined blockade of CD39 and PD-1 could significantly improve the ability of CD8 + TILs and effectively curb tumor growth. Meanwhile, we also discovered that targeting CD39 could promote CXCL13 secretion from CD39 + CD8 + T cells to attract CXCR5 + B cell infiltration in tumor with a subcutaneous model. To optimize therapeutic potential, we engineered a liposome-encapsulated POM-1 (POM-1/Lip) delivery system that potentiates CD39 inhibition via controlled release. Collectively, CD39 + CD8 + T cells show depletion in CC patients and targeting CD39 boosts PD-1 blockade antitumor therapeutic efficacy via enhancing CD8 + TILs function and recruiting B cells in cervical cancer.
Results
CD39 + CD8 + T cells showed immune exhaustion and clonal proliferation in the CC microenvironment
To investigate the specific features and function of CD39 + CD8 + T cells in the CC microenvironment, we conducted scRNA-seq on 10 CC tissues in cohort 3. We identified 12 CD8 + T cell clusters (Fig. 1A, Fig. S1 A-C). Of note, the CD8 + T cells in subclusters 2, 5, 9, 10, and 11 were characterized by high and specific expression of CD39 and were thus identified as CD39 + CD8 + T cells. On the other hand, CD8 + T cells with low CD39 expression were defined as CD39 − CD8 + T cells (Fig. 1A). Based on differential gene expression (DEG) analysis, CD39 + CD8 + T cells, compared with CD39 − CD8 + T cells, showed higher expression of exhaustion markers (PDCD1, CTLA4, HAVCR2, and LAG3) and a proliferation marker (MKI67), but lower expression of activation markers (IFNG, GZMB, and PRF1) (Fig. 1B). Additionally, we found that CD39 + CD8 + T cells exhibited less developmental diversity and a higher differentiation state than CD39 − CD8 + T cells through pseudotime analysis (Fig. 1C). Kyoto Encyclopedia of Genes and Genomes (KEGG) enrichment analysis of DEGs revealed that pathways in cancer, PD-L1 expression, PD-1 checkpoint pathways, and B cell receptor pathways were highly upregulated in CD39 + CD8 + T cells (Fig. 1D), indicating immune dysfunction and potential B cell activation under the influence of CD39 + CD8 + T cells.
Fig. 1.

CD39 + CD8 + T cells showed immune exhaustion and clonal proliferation in the CC microenvironment. (A) Uniform Manifold Approximation and Projection (UMAP) plots showed CD8 + T cell subsets (cohort 3, n = 10) in CC, of which subsets 2, 5, 9, 10 and 11 represent CD39 + groups. (B) Violin plots illustrated differences in the expression of genes related to exhaustion, activation, and proliferation between CD39 + CD8 + T and CD39 − CD8 + T cells. (C) Monocle predicted the developmental trajectories of CD39 + CD8 + T and CD39 − CD8 + T cells. (D) Kyoto Encyclopedia of Genes and Genomes plots displayed CD39 + CD8 + T cell enriched pathways. (E-G) Flow cytometry verified the expression of exhaustion-related, activation-related, and proliferation-related molecules in CD39 + CD8 + T and CD39 − CD8 + T cells (cohort 2, P1–P30) in patients with CC. (B) and (E-G) plots passed the Wilcoxon test. *, P < 0.05; **, P < 0.01; ***, P < 0.001; ns, no statistical difference. Abbreviations: PDCD1, programmed cell death protein 1; CTLA4, cytotoxic T lymphocyte-associated antigen-4; HACVR2, hepatitis a virus cellular receptor 2; LAG3, lymphocyte activation gene-3; TNF, tumor necrosis factor; IFNG, interferon gamma; LAMP1, lysosomal associated membrane protein 1; GZMB, granzyme B; PRF1, perforin 1; Th17 cell, T helper cell 17; Th1 cell, T helper 1 cell; Th2 cell, T helper 2 cell; PD-L1, programmed cell death ligand 1;PD-1, programmed Death Receptor 1; IL, Interleukin
To further validate the immune dysregulation of CD39 + CD8 + T cells in the CC microenvironment, we performed flow cytometry in 30 CC tissues (cohort 2, P1–P30). Remarkably, the expression level of immune checkpoints in CD39 + CD8 + T cells, including PD-1, TIM-3, LAG3, and CTLA4, was much higher (Fig. 1E). Interestingly, we also observed that proliferation rate was higher in CD39 + CD8 + T cells than in CD39 − CD8 + T cells (Fig. 1F). Moreover, the expression of CD107A, an activated immune reaction marker, was higher in CD39 + CD8 + T cells, while that of other immune reaction markers such as TNF-α, IFN-γ, GZMB, and perforin did not differ significantly between the two cell subsets (Fig. 1G). Collectively, these results further verify that CD39 + CD8 + T cells present exhaustion in CC.
CD39 increased in CD8 + TILs and CD39hi in CD8 + TILs were closely associated with CC progression and poor prognosis
To investigate the distribution and role of CD39 + CD8 + T cells in CC, we performed immunofluorescence (IF) staining of 87 surgically resected CC tissues (cohort 1, P1–P87; n = 87) and discovered that CD39 increased in CD8 + TILs (Fig. 2A, B and C). Meanwhile, we evaluated the correlation between CD39 expression in CD8 + TILs and the infiltration of CD39 + CD8 + T cells in tumors using Pearson’s test, but found no correlation between them (Fig. S2). Next, we compared the expression levels of CD39 in CD8 + T cells in normal cervix, CC patients paired peripheral blood and tumor lesion. We found that compared to normal cervix and CC patients paired peripheral blood, CD39 was significantly increased in CD8 + T cells in cancer lesions. However, no difference was observed between the peripheral blood of CC patients and normal cervix (cohort 2, P1–P10; n = 10) (Fig. 2D and E). These results indicated that a significant increase in CD39 expression in CD8 + TILs. We analyzed the relationship between CD39 expression in tumor CD8 + T cells and FIGO staging of cervical cancer. Using the minimum P-value method, we divided cervical cancer patients in cohort 1 into high expression group (CD39 high, CD39hi) and low expression group (CD39low) based on the expression level of CD39 in CD8 + T cells (cut-off value of 8.6%, with 31 patients in the high expression group and 56 patients in the low expression group). We observed that the expression of CD39 in CD8 + T cells was higher in tumor tissues of advanced (FIGO III and IV) cervical cancer patients than in early patients (FIGO I and II) (p = 0.042) (Fig. 2F), indicating a potential relationship between CD39 expression in CD8 + TILs and disease progression (cohort 1, n = 87).
Fig. 2.

CD39 increased in CD8 + TILs and CD39hi CD8 + TILs were closely associated with CC progression and poor prognosis. (A-C) Immunofluorescence staining was performed on tissue samples from patients with cervical cancer (CC) in our center between 2016 and 2018 (cohort 1, n = 87). (A) showed high CD39 expression in tumor-infiltrating CD8 + T cells, while (B) displayed low CD39 expression in these cells. (D) Representative flow cytometry dot plots illustrated the expression of CD39 in CD45 + CD8 + T cells in normal cervix, CC patients paired peripheral blood and tumor lesion. (E) Ratio of CD39 expression in CD45 + CD8 + T cells of normal cervix, CC patients paired peripheral blood and tumor (cohort 2, P1–P10). (F) The proportion of CD39 expression levels in CD8 + T cells across different International Federation of Gynecology and Obstetrics (FIGO) stages was displayed, with the numbers in each box representing the corresponding patient count (cohort 1). (G) Cohort 1 was divided into high and low expression groups based on the ratio of CD39 expression in tumor-infiltrating CD8 + T cells, and overall survival (OS) was compared between these groups. (H) Based on TCGA data, the patients were categorized into high and low expression groups according to the ratio of CD39 expression in tumor-infiltrating CD8 + T cells, and Kaplan–Meier curves were generated to compare OS between these groups (n = 275). (I) Univariate and multivariate Cox regression analysis of clinical pathological variables in cohort 1 (n = 87) and The Cancer Genome Atlas (TCGA) validation cohort (n = 275). The values were obtained using the Mann–Whitney U test (E), Fisher’s exact test (F), the log-rank test (G-H), and Cox regression (I). *, P < 0.05; **, P < 0.01; ***, P < 0.001; significant P values (P < 0.05) were bolded. Abbreviations: TCGA, The Cancer Genome Atlas; FIGO, International Federation of Gynecology and Obstetrics; LN, lymph node
Further, we explored the association between CD39 expression in CD8 + TILs and CC prognosis. We compared OS in CC patients with high and low CD39 expression in CD8 + T cells using Kaplan–Meier curves and the log-rank test. In cohort 1 from our center, we found poorer OS for the patients with CD39hi subgroup (Fig. 2G). Based on the analysis using the TCGA-CESC dataset, a higher abundance of CD39 expression in CD8 + T cells in CC also predicted a worse OS (p < 0.05) (Fig. 2H). Remarkably, CD39hi in CD8 + TILs was an independent high-risk factor for CC OS, as evidenced in the multivariate Cox proportional hazards regression analysis based on our clinical cohort and TCGA (Fig. 2I). These findings manifest that CD39 is increased in CD8 + TILs and are intimately associated with CC progression and prognosis.
CD39 + CD8 + T cells played a vital role in shaping the immunosuppressive microenvironment in CC
To further explore the specific impact of CD39 + CD8 + T cells on the CC immune microenvironment, we focused on the intercellular interaction network of CD39 + CD8 + T cells in CC TIME (Fig. 3A, B and C) (Cohort 3). (1) CD39 + CD8 + T cells were predicted to interact with B cells via the CXCL13–CXCR5, MIF–(CD74 + CD44), MIF–(CD74 + CXCR4), and TNFSF14–TNFRSF14 axes, illustrating likely associations with chemotaxis and differentiation of B cells. (2) The interaction between CD39 + CD8 + T and myeloid cells via the MIF–(CD74 + CXCR4), MIF–(CD74 + CD44) and IFNG-(IFNGR1 + IFNGR2) axes was also inferred, suggesting the potent role of CD39 + CD8 + T cells in myeloid-cell chemotaxis. (3) The MIF–(CD74 + CD44), MIF–(CD74 + CXCR4) and CXCL13-CXCR3 axes were speculated to mediate CD39 + CD8 + T and regulatory T cell (Treg) interactions, which suggested that CD39 + CD8 + T cells might play a significant role in attracting Tregs, thereby contributing to the formation of an immunosuppressive tumor microenvironment in CC.
Fig. 3.

CD39 + CD8 + T cells played a vital role in shaping the immunosuppressive microenvironment in CC. (A-B) Chord diagram showed the strength of the receptor–ligand interaction network for all cell clusters. (C) Bubble plots showed the receptor–ligand pathway strength of interaction between CD39 + CD8 + T cells with each cell cluster. Red and blue indicated high and low communication intensity, respectively, and the size of the dots indicates the range of p-values. (D-E) Flow cytometry was used to distinguish CD39-high (red) and CD39-low (blue) groups in cohort 1 (n = 20) according to CD39 expression in CD8 T cells, and to examine the proportion of lymphocytes (D) and myeloid cells (E) in different groups. (F) Flow cytometry analysis of PD-1, CTLA4, LAG3, and TIM3 expression in CD8 + T cells and PD-L1 expression in PMN-MDSCs in different groups. The values were obtained using the Mann–Whitney U test. *, P < 0.05; **, P < 0.01; ***, P < 0.001; ns, no statistical difference. Tregs, regulatory T cell; PMN-MDSCS, polymorphonuclear myeloid-derived suppressor cells; PD-1, programmed death receptor 1; TIM3, T cell immunoglobulin and mucin domain-containing protein 3; CTLA4, cytotoxic T lymphocyte-associated antigen-4; LAG3, lymphocyte activation gene-3; PD-L1, programmed cell death ligand 1
To further confirm the role of CD39 + CD8 + T cells in shaping the immunosuppressive microenvironment, we conducted flow cytometry using 20 surgically resected CC samples (cohort 2, P1–P20) and divided patients into high and low CD39 + CD8 + T cell infiltration subgroups based on the median expression of CD39 in CD8 + T cell. We found that Tregs were more abundantly enriched in TIME (p < 0.05) (Fig. 3D) and PD-1 was more highly expressed (p < 0.05) (Fig. 3F) in the high CD39 expression CD8 + T cell subgroup. Moreover, although no differences in the infiltration of myeloid cells, including macrophages and polymorphonuclear myeloid-derived suppressor cells (PMN-MDSCs), was found between the two subgroups (Fig. 3E), PD-L1 expression in PMN-MDSCs was significantly elevated in the high CD39 + CD8 + T cell infiltration subgroup (p < 0.05) (Fig. 3F). Taken together, our findings propose that CD39 + CD8 + T cells play a vital role in shaping the immunosuppressive microenvironment in CC.
Combination of CD39 inhibitor and PD-1 blockade enhanced CD8+ TILs function ex vivo
Based on the above findings, we hypothesized that CD39 + CD8 + T cells, which exhibited immune exhaustion and played a vital role in the formation of an immunosuppressive tumor microenvironment, might be an attractive immunotherapeutic target for CC. To evaluate whether CD39 inhibitor (CD39i) could promote the anti-tumor response of CD8 + T cells and further sensitize the therapeutic efficacy of PD-1 blockade in patients with CC, we established a short-term ex vivo culture system using another 16 CC tissues (cohort 2, P15–P30) (Fig. 4A). First, we found that combined treatment of CD39i and αPD-1 increased the apoptosis of tumor cells, especially late apoptosis, compared with the control and single-treatment groups (either the Group CD39i or Group αPD-1 ) (p < 0.0001) (Fig. 4B), indicating that combining CD39i and αPD-1 significantly enhanced tumor cell apoptosis. Furthermore, combined treatment led to a notably elevated expression of markers of cytotoxic markers (IFN-γ, TNF-α, CD107A, PRF and GZMB) in CD8 + T cells compared to single treatment (Fig. 4C-G, Fig. S4 A-E), indicating that combined treatment could stimulate greater cytotoxicity and immune reaction in CD8 + T cells than single treatment. However, in these samples, there was no significant difference in CD39 expression on CD8 + T cells between the pembrolizumab-sensitive and pembrolizumab-resistant groups (Fig. S3). Collectively, our findings demonstrate that CD39i combined with αPD-1 facilitates the apoptosis of tumor cells and enhances the cytotoxicity of CD8 + T cells ex vivo in CC compared with control and single treatment, providing a rationale for the application of a combined blockade of PD-1 and CD39 in patients with CC.
Fig. 4.

Combination of CD39i and αPD-1 enhanced CD8 + TILs function ex vivo. (A) As shown, primary cells were extracted from 16 CC tissues and cultured. (B) Representative flow cytometry data (left) and summary plots (right) showed apoptosis of CD45 − cells from a CC specimen after treatment with αPD-1 and/or CD39i or IgG control for 24 h (cohort 2, P15–P30; n = 16). (C-G) Dot plots showed the percentage of effector cytokines (C, D) and cytolytic markers (E-G) expressed by CD8 + T cells after 24 h of treatment with αPD-1 and/or CD39i or IgG control (n = 16). The values were obtained using the Friedman test (B-G). *, P < 0.05; **, P < 0.01; ***, P < 0.001; ns, not significant. Abbreviations: CC, cervical cancer; IT, intratumor; CTL, cytotoxic T lymphocyte; TNF, tumor necrosis factor; IFN, eukaryotic interferon; GZMB, granzyme B
CD39 inhibitor combined with PD-1 blockade improved the anti-tumor effect and CD8 + T cell restoration in vivo
To further explore the effect of CD39i on restoring CD8 + T cell function and suppressing tumor progression alone and in combination with αPD-1 in vivo, we applied TC-1 tumor-bearing C57BL/6 mouse model (Fig. 5A). Intraperitoneal infusion of either CD39i (200 µg/mouse) or αPD-1 (200 µg/mouse) for two weeks significantly inhibited tumor growth, whereas the combined treatment strategy further enhanced the control effect on tumor growth in terms of both tumor weight (p < 0.0001) and volume (p < 0.001) compared with either single treatment or the control group (Fig. 5B, C and D). These findings illustrate the greatest anti-tumor effect of CD39i combined with αPD-1. Additionally, we observed a more remarkable downregulation of Ki67 + expression in tumor cells in mice treated with combined treatment compared to mice in the control and single treatment groups (p < 0.0001) (Fig. 5E), revealing that combined treatment could significantly reduce the proliferation of tumor cells. Moreover, a greater abundance of CD8 + T cells was observed in the combined treatment group than in either the control or single treatment group (p < 0.01) (Fig. 5F), and the expression of CD107A, GZMB, and PRF was significantly higher in the combined treatment group than in either the control or single treatment group (Fig. 5G, H, I, J and K), revealing increased cytotoxicity and immune reaction of CD8 + T cells upon combined treatment. Taken together, these results further validate that the combination of CD39i and αPD-1 achieves a larger anti-tumor effect and more effective functional restoration of CD8 + T cells, providing essential clues for the development of combined immune therapy for CC.
Fig. 5.

CD39 inhibitor combined with PD-1 blockade improved the anti-tumor effect and CD8 + T cell restoration in vivo. (A) C57BL/6 mice were subcutaneously injected with 3×10⁵ TC-1 tumor cells on d 0. αPD-1 (clone RMP1-14) and isotype (n = 8 mice per group) were injected intraperitoneally on d 8, 12, 16, and 21. CD39i (POM-1) were injected intraperitoneally every day (d 8-d 21). (B) Representative photographs of tumors in each group at d 24. (C) Tumor size in mice at different time points after injection treatment (n = 8 mice per group). (D) Comparison of tumor weight in mice in each group on d 24(n = 8 mice per group). (E) Percentage of Ki67 + cells in CD45 - cells in the tumors from each group of mice on d 24 (n = 8 mice per group). (F) Percentage of CD8 + T cells in CD3 + T cells in the tumors from each group of mice on d 24 (n = 8 mice per group). (G-K) Fold change in the percentage of effector cytokines (G, H) and cytolytic markers (I-K) expressed by CD8 + T cells from the tumor of each group of mice on d 24 (n = 8 mice per group). (C) was obtained using two-way Anova and (D-K) were obtained from Kruskal-Wallis test. *, p < 0.05; **, p < 0.01; ***, p < 0.001; ns, not significant. Abbrebiations: TNF, tumor necrosis factor; IFN, eukaryotic interferon; GZMB, granzyme B
CD39 inhibition combined with PD-1 blockade improved therapeutic efficacy by promoting CXCL13 release and B cell recruit
Given that scRNA-seq results showed that CD39 + CD8 + T cells were actively involved in B cell receptor pathways and interacted closely with B cells, we further explored the effect of targeting CD39 on B cell infiltration. (Fig. 3A, B and C). First, we investigated variations in B cell infiltration in murine tumors (Fig. S6 A) in the different treatment groups and discovered a greater abundance of B cells in the combined treatment group than in the control or single treatment group. Given that CXCL13, a chemokine responsible for B cell migration and differentiation, was highly expressed in CD39 + CD8 + T cells compared with CD39 − CD8 + T cells based on our previous scRNA-seq results (Fig. S1 D), we detected CXCL13 levels in mouse models. The concentration of serum CXCL13 (p < 0.05) and tissue CXCL13 (p < 0.01) in vivo in the combined treatment group was the highest among all groups (Fig. 6A and B), implying that migration and differentiation of B cells occurred in the combined treatment group. Notably, in both mouse tumor (p < 0.001) and peripheral blood (p < 0.01), the infiltration level of CXCR5 + B220 + B cells, which can be attracted and activated by CXCL13 [18], was higher in the combined treatment group than in the control or single treatment group (Fig. 6C and S6 C), indicating that combined treatment induced higher infiltration of CXCR5 + B220 + B cells through CXCL13 release. In addition, considering the potential role of CXCL13 in promoting B cell differentiation, we explored the level of infiltration of main subtypes of B cells in the murine tumor tissues. As for the differentiation trajectory of B cells, it is known that activated B cells (ACBs) can differentiate into germinal center B cells (GCBs) upon tumor infiltration, whereas BCL6 play a crucial role in maintaining the state of GCBs. Further, GCBs can differentiate into plasma cells (PB) and memory B cells (MB) [19]. Surprisingly, we found a much higher infiltration of ACBs in the combined treatment group than in the control or single treatment group (p < 0.01) (Fig. 6D, E). Although neither the proportion of GCBs, nor the proportion of GCBs within the dark and light zones showed differences between the distinct groups (Fig. 6F, G and H), BCL6 expression in GCBs was significantly downregulated in the combined treatment group (p < 0.001) (Fig. 6I, J). Moreover, the proportion of PB, the key player in protective immunity, increased significantly in the treatment groups, especially in the combined treatment group (p < 0.01) (Fig. 6K). In contrast, the proportion of MB tended to decrease in the combined treatment group in comparison with the single treatment groups and the control group (p < 0.05) (Fig. 6L). However, it was no difference in murine peripheral blood B cells (Fig. S6 D-F).
Fig. 6.

CD39 inhibitor combined with PD-1 blockade improved therapeutic efficacy by promoting CXCL13 release and B cell activation. (A) Enzyme-linked immunosorbent assay (ELISA) was used to detect the content of CXCL13 in the serum samples of isotype, αPD-1, CD39i, and combined treatment groups of mice. (B) The content of CXCL13 in murine tumors was detected using ELISA. (C) Flow cytometry allowed detection of the proportion of CXCR5 + B cells in murine tumors. (D-E) Flow cytometry (D) and dot plots (E) showed the proportion of activated B cell infiltration in murine tumors. (F) The dot plot displayed the proportion of GCB cells in tumor B220 + B cells. (G, H) Dot plots showed the proportion of dark zone (DZ) (G) and light zone (LZ) (H) in GCB cells in mouse tumors. (I, J) Representative histograms (I) and summarized Mean Fluorescence Intensity (MFI) diagram (J) showed the expression of BCL6 in GCB cells. (K) The dot plot showed the proportion of plasma cells among CD19 + B cells of mouse tumors. (L) The dot plot displayed the proportion of memory B cells in mouse tumor B220 + B cells. The values were obtained using the Kruskal–Wallis test. *, P < 0.05; **, P < 0.01; ***; P < 0.001; ns, not significant. Abbreviations: GCB, geminal center B cells; DZ, dark zone; LZ, light zone
Meanwhile, we further detected the activation of B cells in the tissues of CC patients. Along with the murine tumor, we found the highest CXCL13 concentration in cell cultural supernatant in combined treatment group (p < 0.001) (Fig. S5 A). We also observed significant increased expression level of CXCR5 in CD20 + B cells in combined treatment group (Fig. S5 C). Furthermore, higher infiltration of ACBs was observed in the combined treatment group than in the control or single treatment group (Fig. S5 E). The above results further indicate that migration and differentiation of B cells via releasing CXCL13 occurred in the combined treatment group in the tumor tissues of CC patients.
Taken together, these results suggest that the combination of CD39i and αPD-1 achieves enhanced therapeutic effects in vivo through B cell activation and differentiation with CXCL13 release.
Preparation and characterization of the POM-1/Lip
As shown in Fig. 7A, nanoliposomes for delivery of POM-1 were developed. The mean particle size of Lip was 139.18 nm (Fig. 7B) with a Zeta potential of +9.67mV (Fig. 7F). Meanwhile, POM-1/Lip exhibited a slightly larger mean particle size of 148.55 nm (Fig. 7C) and the mean Zeta potential was − 0.5956 mV(Fig. 7F). Transmission electron microscopy (TEM) images (Fig. 7D) further confirmed the spherical morphology of the nanoliposomes. During preparation, the cationic surface charge of POM-1/Lip was progressively neutralized with increasing POM-1 mass, resulting in stabilized particle size. (Fig. 7E). Additionally, POM-1/Lip exhibited a distinct Tyndall effect (Fig. 7G). Hemolysis assays further validated the biocompatibility of POM-1/Lip, demonstrating minimal erythrocyte damage (Fig. 7H, I).
Fig. 7.

Preparation and characterization of POM-1/Lip. (A) Synthesis of POM-1/Lip. (B) Hydrodynamic size distribution profiles of Lip and (C) POM-1/Lip nanoliposomes. (D) Representative transmission electron microscopy (TEM) image of POM-1/Lip. Scale bar, 50 nm.(E) Hydrodynamic size distribution of Lip and POM-1/Lip nanoparticles. (F) Zeta potential analysis of Lip and POM-1/Lip formulations. (G) Colloidal stability assessment: visual appearance and Tyndall effect of POM-1/Lip dispersion. (H-I) In vitro hemocompatibility evaluation: hemolytic activity of POM-1/Lip at varying concentrations. The values were obtained using the One-way ANOVA test. *, P < 0.05; **, P < 0.01; ***; P < 0.001; ns, not significant. Abbreviations: Lip, liposome
Comprehensive evaluation of POM-1/Lip in vivo: biodistribution, antitumor efficacy, and systemic safety assessment
To evaluate the therapeutic potential and safety of POM-1/Lip, we established TC-1 tumor-bearing C57BL/6 mouse model (Fig. 8A). Biodistribution studies were performed using the lipophilic fluorescent probe Did for in vivo tracking (Fig. 8B). Whole-body fluorescence imaging revealed distinct pharmacokinetic profiles: free Did demonstrated rapid systemic clearance, with predominant hepatic and splenic accumulation at 24 h post-injection and negligible tumor retention. In contrast, both Did-POM-1/Lip and Did-Lip formulations showed enhanced accumulation in the reticuloendothelial system (liver, spleen, and lungs), with Did-POM-1/Lip exhibiting significantly improved tumor retention compared to free Did or Did-Lip (Fig. 8C-D).
Fig. 8.

In vivo evaluation of POM-1/Lip in biodistribution, anti tumor efficacy, and systemic safety assessment. (A) Schematic diagram of the experimental design and therapeutic regimen of the in vivo model. C57BL/6 mice were subcutaneously injected with TC-1 cells on d 0. Lip, POM-1/Lip, and POM-1 were administered intravenously every day (d 8-d 21). Isotype and αPD-1 were administered intraperitoncally on d 8, 12, 16 and 21. (n = 6 mice per group). (B) Biodistribution of Did, Did-Lip, and Did-POM-1/Lip in tumor-bearing mice after 1, 3, 6, 12, and 24 h. (C) Fluorescence images of major organs and tumor of tumor-bearing mice. (D) Quantitative biodistribution analysis of Did fluorescence intensity in tumors and major organs at 24 h post-injection (n = 6). (E) Representitive tumor growth kinetics and (F) corresponding growth curves following various treatments (n=6 mice per group) 6. (G) Body weight monitoring throughout the treatment period (n = 6). (H) Representative tumor section images showing: TUNEL staining (apoptotic cells in brown), Ki67 immunostaining (proliferating cells in brown), and H&E staining. Scale bar, 100 μm. (I) Quantitative analysis of apoptotic index (TUNEL +) and proliferation index (Ki67+) in different groups. The values were obtained using the One-way ANOVA test. *, P < 0.05; **, P < 0.01; ***; P < 0.001; ns, not significant. Abbreviations: Lip, liposome; s.c., subcutaneous injection. i.p., intraperitoneal injection. i.v., intravenous injection
Antitumor efficacy assessment demonstrated that POM-1/Lip monotherapy significantly suppressed tumor growth compared to free POM-1 (p < 0.05). Notably, the combination of POM-1/Lip with anti-PD-1 showed superior therapeutic efficacy versus POM-1 plus anti-PD-1 (Fig. 8E-F), while all treatment maintained good safety profiles as evidenced by stable body weights (Fig. 8G).
Mechanistic evaluation through TUNEL and Ki67 staining revealed that POM-1/Lip treatment significantly enhanced tumor cell apoptosis (p = 0.011) and reduced proliferation (p = 0.04) compared to free POM-1. The combination therapy group (POM-1/Lip + anti-PD-1) showed the most pronounced effects, with markedly increased apoptosis (p < 0.001) and decreased proliferation (p = 0.02) campared to either control or single treatment group (Fig. 8H-J). Histopathological analysis comfirmed treatment safety, with no significant abnormalities in major organs and comparable organ-to-body weight ratios across all groups (Fig. S7).
In vitro efficacy assessment of POM-1/Lip
To assess the cellular uptake and pharmacological activity of POM-1/Lip, we first evaluated its uptake kinetics in CD8 + T cells using Did-labeled formulations in short-term ex vivo culture. Quantitative analysis revealed significantly enhanced cellular internalization of Did-POM-1/Lip compared to Did-Lip after 6 h incubation (p < 0.001) (Fig. 9A-B). Time-course experiments demonstrated progressive, time-dependent accumulation of Did-POM-1/Lip in CD8 + T cells (Fig. 9C-D).
Fig. 9.

In vitro efficacy assessment of POM-1/Lip. (A-B) Comparative cellular uptake of Did-labeled Lip versus POM-1/Lip by CD8 + T cells after 6 h incubation, quantified by flow cytometry. (C-D) Time-dependent uptake kinetics of Did-POM-1/Lip in CD8 + T cells assessed at 3, 6, 12, and 24 h. (E-F) CD39 expression on CD8 + T cells following treatment with POM-1 or POM-1/Lip at indicated timepoints. (G-I) CD39 enzymatic activity analysis after 48 h treatment: (G) extracellular ATP accumulation, (H) Adenosine (Ade) production, and (I) inorganic phosphate release from ATP hydrolysis. The values were obtained using the One-way ANOVA test. *, P < 0.05; **, P < 0.01; ***;P < 0.001; ns, not significant. Abbreviations: Lip, liposome; ATP, adenosine triphosphate; Ade, Adenosine
We next investigated the CD39-inhibiting effects of POM-1/Lip. Flow cytometric analysis of CD39 expressing showed comparable levels between POM-1 and POM-1/Lip treatments at early timepoints (6h, 12h, and 24h). However, by 48 h, POM-1/Lip treatment resulted in significantly lower CD39 expression compared to free POM-1 (p < 0.001) (Fig. 9E-F). Functional assessment of CD39 enzymatic activity at 48 h revealed that POM-1/Lip: (1) increased extracellular ATP levels (p = 0.027)(Fig. 9G); (2) reduced adenosine (Ade) production (p = 0.042) (Fig. 9H); (3) decreased inorganic phosphate release from ATP hydrolysis (p = 0.044) (Fig. 9I). These data collectively demonstrates that POM-1/Lip exhibits superior cellular uptake and more sustained CD39 inhibition compared to free POM-1 in vitro.
Discussion
It has been achieved huge success in PD-1/PD-L1 pathway of ICBs therapies [20]. However, a considerable number of patients do not benefit from this treatment, facing resistance and dismal prognosis [21, 22]. Combination strategies offer a promising solution to overcome resistance associated with single-pronged approaches and provide greater clinical benefit [23, 24]. In our study, we aimed to identify novel therapeutic targets and investigate the mechanisms in potentiating the efficacy of PD-1 blockade. Our findings reveal that targeting CD39 improves anti-tumor immunity by enhancing CD8 + T cell cytotoxicity and promoting CXCL13 secretion which increased CXCR5 + B cells infiltration in tumor.
We observed that CD39 + CD8 + T cells exhibit exhaustion in CC patients. Validation using cohorts from our center and the TCGA database consistently showed that increased CD39 expression in CD8 + T cells is associated with poor prognosis in CC patients and advanced CC patients illustrated higher CD39 expression. These findings align with previous reports in other solid tumors, such as clear cell renal carcinoma [25, 26], non-small cell lung cancer and gastric cancer [27–29], where sustained stimulation leads to exhaustion in CD8 + T cells characterized by elevated CD39 expression, which correlates with poor clinical outcomes. CD39 synergizes with CD73 to produce ADO and upregulate the proportion of immunosuppressive cells [14]. We discovered that high expression of CD39 in CD8 + T cells is associated with a heterogeneous immunosuppressive TME, marked by an increased proportion of FOXP3 + Tregs and PD-L1 + PMN-MDSCs.
It is controversial whether the combination of CD39i will improve the efficacy of αPD-1. In MB49 bladder cancer murine model, combined treatment showed no advantage over single-agent treatment [30]. In contrast, it was reported that combined treatment have been shown to synergistically reverse CD8 + T cell exhaustion and boost the efficiency of αPD-1 via adenosine-related pathways in MC38 colon cancer and MCA1956 sarcoma murine models [31]. In this research, it was demonstrated that CD39i enhanced the efficiency of αPD-1 by improving the cytotoxic function of CD8 + T cells both in vitro tissue of CC and in TC-1 CC murine models. The efficacy of ICBs heavily depends on the degree of immune cells infiltration and there are differences of immune infiltrates between cancer subtypes. The ICBs efficiency in cold tumors are always worse than that in hot tumors [32]. Building on these mechanistic insights, we further developed POM-1/Lip as an optimized therapeutic formulation. Both in vivo and in vitro studies demonstrated superior efficacy of POM-1/Lip compared to free POM-1, corroborating previous findings by Lin et al. in melanoma models [33]. This enhanced performance likely stems from the liposomal formulation’s ability to: (1) maintain sustained drug release kinetics, (2) prolong therapeutic exposure duration, and (3) achieve higher intratumoral drug accumulation. Together with our mechanistic findings, these results position POM-1/Lip as a promising candidate for combination immunotherapy regimens.
Targeting CD39 reduces the production of ADO, thereby relieving immunosuppression and increasing immune cell infiltration [30, 31]. Tumor-infiltrating lymphocyte-B cells (TIL-Bs) play an important role in anti-tumor immunity. They can not only take part in lympho-myeloid aggregates and tertiary lymphoid structures but serve as professional antigen-presenting cells. Meanwhile, TIL-Bs also can produce antibodies or by activating innate immunity to kill tumor cells directly [34]. It is also reported patients charactered with high TIL- Bs infiltration have a better prognosis in a wide range of cancer types [19]. We confirmed that combined treatment of CD39 and PD-1 promotes CXCL13 secretion to recruit CXCR5 + B cell in TC-1 murine subcutaneous tumor model, while also promoting the differentiation of TLS-Bs into anti-tumor plasma cells. Thereby, targeting CD39 can increase the infiltration of immune cells, transform “cold tumors ” into “ hot tumors”, and improve the response effect of ICBs.
Although CD39 + CD8 + T cells are widely reported as an exhaustion subset and tightly associated with poor prognosis [24–28], there are studies suggest that this subset represent tumor-associated neoantigen-specific T cells with immune responsiveness [35]. In condition of continuous stimulation, CD8 + T cells gradually acquire an exhausted phenotype to prevent excessive immune responses [36, 37]. Similarly, CD39 cooperates with CD73 to generate immunosuppressive ADO, preventing immune cell overactivation [38]. However, in the context of anti-tumor immunity, this mechanism is detrimental [39]. Based on our findings, we proposed that dual targeting of CD39 and PD-1 enhances anti-tumor immunity, particularly in CC patients with high CD39 expression in CD8 + T cells, offering a potential therapeutic option for patients resistant to anti-PD-1 therapy.
Our study has certain limitations. Both of in-vivo and ex-vivo experiments we applied POM-1 which targets NTPDases, including NTPDase 1 (CD39), NTPDase 2, and NTPDase 3, although previous studies suggest it primarily affects NTPDase 1 [40, 41].
In summary, we revealed that CD39 + CD8 + T cells exhibit exhausted phenotype in CC patients. High CD39 expression in CD8 + T cells is strongly associated with poor prognosis. We demonstrated that targeting CD39 enhances anti-tumor immunity by improving CD8 + T cell cytotoxicity and promoting CXCL13-mediated recruitment of CXCR5 + B cells. These findings provide novel insights for optimizing immunotherapy strategies for improving the therapeutic effect of ICBs.
Methods
Study population
Cohort 1 included 87 CC patients who underwent primary surgery at our hospital between January 2017 and August 2018. In cohort 2, tumor tissues (T1–T30) and corresponding blood samples (P1–P10) were collected from 30 CC patients who underwent primary surgery at our hospital from February 2023 to April 2024. Cohort 3 consisted of 10 patients with CC who underwent primary surgery at our hospital in 2020. Pathological staging was performed according to the FIGO (International Federation of Gynecology and Obstetrics) classification (2018), and the histological type was determined based on the current WHO classification. Overall survival (OS) was defined as the time from the date of surgery to death or last follow-up. None of the patients received neoadjuvant chemotherapy, radiotherapy, or any other anti-tumor agents prior to surgery. The characteristics of all the participants are detailed in Supplementary Table 1, Supplementary Tables 2 and Supplementary Table 3.
Cell line culture
The HPV16 +-transformed mouse xenograft tumor cell line TC-1 was purchased from the Chinese Academy of Sciences Shanghai (CAS) and tested for mycoplasma once a month. The cells were cultured in RPMI 1640 (RPMI-1640; Gibco) medium containing 10% fetal bovine serum (Gibco, Australia).
Flow cytometry
Single cell suspensions of patient tissue/blood and mouse tissue were subjected to Fc receptor blocking (BD Biosciences) at 4 °C for 30 min and surface antibody (Supplementary Table 5) staining for 30 min after viable cells were identified using the Zombie Aqua Fixable Viability Kit (BioLegend). After using the fixation solution (BD Biosciences), the cytoplasm and nucleus were stained. To detect apoptosis, staining was performed using the Lianke Apoptosis kit. Before flow cytometry analysis, single cell suspensions received Leukocyte activation cocktail (BD Biosciences) at a concentration of 1:500 and incubated for 4 h. All samples were run on a CytoFLEX platform (Beckman Coulter) and analyzed applying the FlowJo version 10.8 software (BD Biosciences).
Murine tissue homogenate
Mouse tumor tissue (0.1 g) was weighed, and 500 µl of pre-cooled PBS containing 1% PMSF were added. After shortening the tissue to 1 mm2 fragments with scissors, the tissue was sonicated for 2 s with an interval of 3 s and a power of 25%, for a total time of 5 min. After ultrasonic crushing, the samples were centrifuged at 12,000 rpm for 10 min at 4 °C, and the supernatant was aspirated for subsequent experiments.
Enzyme-linked immunosorbent assay (ELISA)
After equilibration of mouse serum/tissue homogenates and cell culture supernatant to room temperature, CXCL13 protein concentration was determined according to the reagent manufacturer’s instructions (Weiao, Shanghai, China). The standard curve of CXCL13 concentration was determined using recombinant proteins, and the CXCL13 protein concentration of the corresponding samples was calculated from the OD values.
Short-Term ex vivo culture and in vitro experiments
After collecting the samples under sterile conditions, the tissues were washed twice with DPBS containing 10% antibiotics, cut into small fragments of approximately 1 mm2 with sterile scissors, re-sorted into RPMI 1640 medium supplemented with type IV collagenase, 0.01% hyaluronidase, and 0.002% DNase I, and digested for 30 min. The digests were filtered through a 100 µm strainer and centrifuged. The cells were precipitated in RPMI 1640 medium containing 10% inactivated fetal bovine serum and 30 ng/ml IL-2 (PeproTech, U.S.A.) to a cell density of 1 × 10⁶ cells /ml. The cells were plated in low-adsorption 24-well plates (Thermo Fisher Scientific, U.S.A) with pembrolizumab (20 µg/ml, MedChemExpress, China) and/or POM-1 (20 µg/ml, SantaCruz, USA) and cultured for 24 h in a chamber containing 5% carbon dioxide at 37 °C. Leukocyte activation cocktail (BD Biosciences) was added to the culture media at a concentration of 1:500 and incubated for 4 h before being harvested for flow cytometry analysis.
In vivo experiments
Female C57/BL6J mice (6–8 w old) were purchased from SPF BIOTECH (Suzhou). TC-1 cells (3 × 10⁵) resuspended in 100 µl PBS were inoculated under the right armpit (recorded as d 0). When the tumor volume reached 100 mm3, the mice received an intraperitoneal injection (d 8). The mice in the control group were injected with isotypic IgG (BioXCell, U.S.A.) twice a week (d 8, 12, 16, and 21) at a dose of 200 µg. For PD-1 blockade, tumor-bearing mice received 200 µg of αPD-1 (BioXCell; clone RMP1-14) twice weekly (d 8, 12, 16, and 21). For CD39 blockade, the mice were intraperitoneally injected with 200 µg POM-1 (SantaCruz) daily (d 8–21). In the combination group, the mice received 200 µg αPD-1 twice weekly and 200 µg POM-1 injections daily. For the analysis of immunoreactivity, mouse tumors were excised after carbon dioxide asphyxia on d 24 and digested in RPMI 1640 medium supplemented with 0.2% type IV collagenase, 0.01% hyaluronidase, and 0.002% DNase I for one hour in a 37 °C incubator for flow cytometry analysis.
Immunohistochemistry (IHC) and immunofluorescence(IF)
Human and mouse tumor tissue were cut cut into 5 µm thick slices after fixed in paraformaldehyde and embedded in paraffin. After deparaffinization, the sections were subjected to antigen retrieval using a sodium citrate antigen retrieval solution. Endogenous peroxidase was blocked, and the sections were then blocked with 5% bovine serum. The sections were stained with a CD19 antibody (27949-1-AP; Proteintech; 1:500), Ki67 antibody(ab16667;Abcam;1:200), TUNEL antibody(G1507; Servicebio; 1:200) followed by a secondary antibody (GB23303; Servicebio; 1:200). The staining procedure was carried out using a 3,3’-diaminobenzidine (DAB) kit (DAB-1031; Mxb Bio). A negative control was also included in the experiment. Immunofluorescence staining was performed using a CD8 antibody (ab17147; Abcam; 1:100) and CD39 antibody (ab300065; Abcam; 1:50), followed by staining with conjugated secondary antibodies (GB25301 and GB25303; Servicebio; 1:300).
The analysis of immunohistochemistry (IHC) and immunofluorescence(IF)
Immunofluorescence sections were scanned using the 3DHISTECH scanner, and co-localization analysis of CD39 and CD8 was performed using the HALO platform based on Indica labs (U.S.A). Immunohistochemical images were taken on a Nikon Eclipse 80i microscope (Nikon Instruments, NY). Two investigators blinded to the clinical information independently reviewed it.Mouse tumor-infiltrated B cells were evaluated using the number of positive cells from three representative section views in a high power field (HPF) at a magnification of 400 times (area: 0.5 mm2) and averaged.For the evaluation of Ki67 and Tunel in mouse tumor tissues, when the magnification was 400 times (area: 0.5 mm2), FIJI ImageJwas used to calculate the proportion of positive cells to all cells in the field of view from three representative section views, and the average value was adopted.
Single cell sequencing analysis
We used the Cell Ranger (v.8.0.0) software on the 10x Genomics website (https://support.10xgenomics.com/singlecell-geneexpression/software/pipelines/latest/advanced/references) to convert FASTQ files into BAM files. Raw gene expression count matrices were then obtained using the “cellrangercount” function with the reference human genome (GRCh38 GENCODE v44/Ensembl110 annotations) and used for downstream analysis. After quality control and data processing, 6797 CD39 − CD8 + T cells and 1104 CD39 + CD8 + T cells were included. The gene set of CD39 − CD8 + T cells and CD39 + CD8 + T cells was in Supplementary Table 4.
Bioinformatics analysis using TCGA
We obtained gene expression and corresponding survival data for cervical cancer from TCGA Data Portal and normalized gene expression values using the formula log2 (FPKM + 1). The fraction of CD39 + CD8 + T cells was calculated by BayesPrism. And the abundance of total CD8 + T cells were equal to the sum of CD39 + CD8 + T cells and CD39- CD8+ T cells.
Definition of cut-off value
The optimal cut-off value of CD39 + CD8 + T cells in the proportion of total CD8 + T cells was calculated by X-tile (version 3.6.1), with the minimum p value. The cut-off value of cohort1 was 8.6%. And the cut-off value of CD39 + CD8 + T cells in total CD8 + T cells in TCGA was 9.5%.
The synthesis of liposome
First, cationic liposomes were prepared. 1,2-Dioleoyl-sn-glycero-3-phosphoethanolamine (DOPE): 1,2-Dioleoyl-sn-glycero-3-phosphocholine (DOPC): Cholesterol: 1,2-Distearoyl-sn-glycero-3-phosphorylethanolamine (DSPE) were dissolved in chloroform in a ratio of 25:50:3:1 (w: w), with the concentration of DSPE being 5 ug/ml. A lipid film was formed in a rotary vacuum evaporation instrument. The mixture was then mixed with PBS solution and extruded through a 220 nm polycarbonate filter to obtain the Lip suspension. 20 mg POM-1 (100 mg/ml) was added and incubated at room temperature for 4 h, and then dialyzed through a 14000 da dialysis bag for 2 days to obtain POM-1 Lip. The particle size, zeta potential and stability of the structure were determined. The morphology was observed by transmission electron microscopy. The ICP quantitative data in Supplementary Table 6 shows a calculated drug loading rate of 47.5%. For the preparation of Did-Lip and Did-POM-1/Lip, the obtained liposomes were incubated with Did in the dark for 12 h, and then dialyzed in a dialysis bag in the dark for 2 days to obtain Did-Lip and Did-POM-1/Lip.
In vivo biological distribution
Did (Yeasen, China) is a commonly used lipophilic far-infrared fluorescent dye for in vivo imaging. On the 21st day, intravenous injection of free Did, Did-Lip, Did-POM-1/Lip. Real time optical images were obtained using a small animal in vivo imaging system (IVIS spectroscopy, PerkinElmer) at 1 h, 3 h, 6 h, 12 h, and 24 h after administration. After 24 h, animals were euthanized (n = 6 per group), and their hearts, livers, spleens, lungs, kidneys, and tumors were collected, weighed, and imaged. Use in vivo imaging software (IVIS imaging system) to calculate the total fluorescence intensity of Did in the tumor area in vivo and all tissues in vitro.
In vitro uptake
Establish a short-term in vitro culture model of patient tumor tissue, co incubate with PBS, Did-Lip, Did-POM-1/Lip, and detect the uptake of Did-Lip and Did-POM-1/Lip by CD8 + T cells at 0 h, 3 h, 6 h, 12 h, and 24 h using flow cytometry.
In vitro measurement of CD39 enzyme activity
Extract the supernatant of tumor cells and use the Malachite Green Phosphate Detection Kit (12776s, CST.) to measure the enzymatic activity of CD39 by measuring the release of phosphate (Pi) during ATP conversion to AMP. Add 50 µl of buffer solution containing different processing conditions and 50 µl of malachite green reagent. Incubate at room temperature for 15 min. Measure the absorbance at wavelengths between 620 and 660 nm. And calculate the concentration of Pi.
ATP and Ade content determination
Tumor tissue samples were mixed with the appropriate amount of lysate and centrifuged to obtain the supernatant. ATP levels were determined using an ATP assay kit (Biyuntian) according to the manufacturer’s instructions. Ade levels were determined using an Ade assay kit (MET-5090, CELL BIOLABS, INC.).
Statistical analyses
The statistical analyses were performed using the IBM SPSS Statistics V24.0 and GraphPad Prism 9. The Mann–Whitney U test or unpaired t-test or paired t-test was used to compare differences between two groups. And the one-way analysis of varaince (ANOVA) or two-way ANOVA or Kruskal–Wallis test was used for multiple group comparisons. Additionally, the Wilcoxon test and the Friedman test were used for paired comparisons between two or multiple groups. Pearson’s chi-square test and Fisher’s exact test were used to compare variables. For OS analysis, Kaplan–Meier estimates and the log-rank test were used. DeLong test was used to compare ROC curve. Simple correlations were summarized using the Pearson’s correlation coefficient. Differences were considered statistically significant at p values < 0.05.
Electronic supplementary material
Below is the link to the electronic supplementary material.
Acknowledgements
We would like to appreciate Dr Hongbo Zhao (Bank of Tumor Resources, Obstetrics and Gynecology Hospital of Fudan University, Shanghai, China) for her help.
Abbreviations
- CC
Cervical cancer
- sc-RNA seq
Single cell sequencing
- PD-1
Programmed cell death protein 1
- ORR
Objective response rates
- ICBs
Immune checkpoint blockades
- TCGA
The Cancer Genome Atlas
- TILs
Tumor-infiltrating lymphocytes
- ATP
Adenosine triphosphate
- ADP
Adenosine diphosphate
- ADO
Adenosine
- Ade
Adenosine
- PDCD1
Programmed cell death protein 1
- CTLA4
Cytotoxic T lymphocyte-associated antigen-4
- HACVR2
Hepatitis a virus cellular receptor 2
- LAG3
Lymphocyte activation gene-3
- TIM3
T cell immunoglobulin and mucin domain-containing protein 3
- TNF
Tumor necrosis factor
- IFNG
Interferon gamma
- LAMP1
Lysosomal associated membrane protein 1
- GZMB
Granzyme B
- PRF1
Perforin 1
- Th17
Cell T helper cell 17
- Th1
Cell T helper 1 cell
- Th2
Cell T helper 2 cell
- PD-L1
Programmed cell death ligand 1
- IL
Interleukin
- FIGO
International Federation of Gynecology and Obstetrics
- LN
Lymph node
- Lip
Liposome
- ACBs
Activated B cells
- GCBs
Germinal center B cells
- PBs
Plasma cells
- DZ
Dark zone
- LZ
Light zone
- MB
Memory B cells
- ROC
Receiver operating characteristic curve
- TIL-Bs
Tumor-infiltrating lymphocyte-B cells
Author contributions
J.Q. and Z.T. proposed the concept and provided fundings. L.J. and T.W. analyzed data and contributed to Visualization. L.J., T.W., Q.J.and S.L. conducted experiment. L.J., T.W. and X.Q. conducted bioinformatics analysis and Q.J., T.R. and J.L. verified the bioinformatics analysis. T.W., L.J., Y.D., X.Q. and J.Q. wrote and edited the manuscript writing. J.Q., K.H. and Z.T. supervised this work. All authors read and approved the final manuscript.
Funding
This study was supported by funding from National Natural Science Foundation of China (82472993), Fundamental Research Funds for the Central Universities, Medical Innovation Research of Shanghai Science and Technology(21Y11906900) and Program for Medical industrial intersection of Fudan University (IDH2310121), Shanghai Oriental talent youth project and Huangpu youth talent project.
Data availability
No datasets were generated or analysed during the current study. The data supporting the findings of this study are available from the corresponding authors upon request. The Gene Expression Omnibus (GEO) accession numbers for the single-cell RNA sequencing (scRNA-seq) data reported in this study are GSE197461 and GSE208653, respectively. All computational code used in this study is publicly available.
Declarations
Ethical approval and informed consent
This study received ethical approval from the Ethics Committee of the Fudan University Obstetrics and Gynecology Hospital (2023 − 107) and the Animal Ethics Committee of Fudan University (202312014 S). The study was conducted in accordance with the principles of the Declaration of Helsinki. All the patients involved in this study provided written informed consent for sample collection and data analysis.
Consent for publication
All authors of this study agreed to publish.
Competing interests
The authors declare no competing interests.
Footnotes
Publisher’s note
Springer Nature remains neutral with regard to jurisdictional claims in published maps and institutional affiliations.
Lili Jiang, Tong Wu, Xinyu Qu and Shuqi Li contributed equally to this work.
Contributor Information
Yan Ding, Email: rokki_ting@163.com.
Keqin Hua, Email: huakeqin@fudan.edu.cn.
Zhongmin Tang, Email: zhongmintang@tongji.edu.cn.
Junjun Qiu, Email: qiu_junjun@fudan.edu.cn.
References
- 1.Sung H, et al. Global Cancer statistics 2020: GLOBOCAN estimates of incidence and mortality worldwide for 36 cancers in 185 countries. CA Cancer J Clin. 2021;71(3):209–49. [DOI] [PubMed] [Google Scholar]
- 2.Canfell K, et al. Mortality impact of achieving WHO cervical cancer elimination targets: a comparative modelling analysis in 78 low-income and lower-middle-income countries. Lancet. 2020;395(10224):591–603. [DOI] [PMC free article] [PubMed] [Google Scholar]
- 3.NCCN Clinical Practice Guidelines in Oncology (NCCN Guidelines) Cervical Cancer Version 1.2025.
- 4.Institute NC. Cancer STAT facts: cervix uteri cancer. Available from: https://seer.cancer.gov/statfacts/html/cervix.html
- 5.Balar AV, et al. Pembrolizumab monotherapy for the treatment of high-risk non-muscle-invasive bladder cancer unresponsive to BCG (KEYNOTE-057): an open-label, single-arm, multicentre, phase 2 study. Lancet Oncol. 2021;22(7):919–30. [DOI] [PubMed] [Google Scholar]
- 6.Reck M, Remon J, Hellmann MD. First-Line immunotherapy for Non-Small-Cell lung Cancer. J Clin Oncol. 2022;40(6):586–97. [DOI] [PubMed] [Google Scholar]
- 7.Tumeh PC, et al. PD-1 Blockade induces responses by inhibiting adaptive immune resistance. Nature. 2014;515(7528):568–71. [DOI] [PMC free article] [PubMed] [Google Scholar]
- 8.Chung HC, et al. Efficacy and safety of pembrolizumab in previously treated advanced cervical cancer: results from the phase II KEYNOTE-158 study. J Clin Oncol. 2019;37(17):1470–8. [DOI] [PubMed] [Google Scholar]
- 9.Frenel JS, et al. Safety and efficacy of pembrolizumab in advanced, programmed death ligand 1-Positive cervical cancer: results from the phase Ib KEYNOTE-028 trial. J Clin Oncol. 2017;35(36):4035–41. [DOI] [PubMed] [Google Scholar]
- 10.Morad G, et al. Hallmarks of response, resistance, and toxicity to immune checkpoint Blockade. Cell. 2021;184(21):5309–37. [DOI] [PMC free article] [PubMed] [Google Scholar]
- 11.Naimi A, et al. Tumor immunotherapies by immune checkpoint inhibitors (ICIs); the pros and cons. Cell Commun Signal. 2022;20(1):44. [DOI] [PMC free article] [PubMed] [Google Scholar]
- 12.Nagate Y, et al. Ectonucleotidase CD39 is highly expressed on ATLL cells and is responsible for their immunosuppressive function. Leukemia. 2021;35(1):107–18. [DOI] [PMC free article] [PubMed] [Google Scholar]
- 13.Vignali PDA, et al. Hypoxia drives CD39-dependent suppressor function in exhausted T cells to limit antitumor immunity. Nat Immunol. 2023;24(2):267–79. [DOI] [PMC free article] [PubMed] [Google Scholar]
- 14.Xia C, et al. CD39/CD73/A2AR pathway and cancer immunotherapy. Mol Cancer. 2023;22(1):44. [DOI] [PMC free article] [PubMed] [Google Scholar]
- 15.Wan P, et al. Extracellular ATP mediates inflammatory responses in colitis via P2 x 7 receptor signaling. Sci Rep. 2016;6:19108. [DOI] [PMC free article] [PubMed] [Google Scholar]
- 16.Allard D, Allard B, Stagg J. On the mechanism of anti-CD39 immune checkpoint therapy. J Immunother Cancer, 2020; 8(1). [DOI] [PMC free article] [PubMed]
- 17.Allen TM, Cullis PR. Liposomal drug delivery systems: from concept to clinical applications. Adv Drug Deliv Rev. 2013;65(1):36–48. [DOI] [PubMed] [Google Scholar]
- 18.Jiang BC, et al. CXCL13 drives spinal astrocyte activation and neuropathic pain via CXCR5. J Clin Invest. 2016;126(2):745–61. [DOI] [PMC free article] [PubMed] [Google Scholar]
- 19.Laumont CM, et al. Tumour-infiltrating B cells: immunological mechanisms, clinical impact and therapeutic opportunities. Nat Rev Cancer. 2022;22(7):414–30. [DOI] [PMC free article] [PubMed] [Google Scholar]
- 20.Pang K, et al. Research progress of therapeutic effects and drug resistance of immunotherapy based on PD-1/PD-L1 Blockade. Drug Resist Updat. 2023;66:100907. [DOI] [PubMed] [Google Scholar]
- 21.Colombo N, et al. Pembrolizumab for persistent, recurrent, or metastatic cervical Cancer. N Engl J Med. 2021;385(20):1856–67. [DOI] [PubMed] [Google Scholar]
- 22.Lorusso D, et al. Pembrolizumab or placebo with chemoradiotherapy followed by pembrolizumab or placebo for newly diagnosed, high-risk, locally advanced cervical cancer (ENGOT-cx11/GOG-3047/KEYNOTE-A18): a randomised, double-blind, phase 3 clinical trial. Lancet. 2024;403(10434):1341–50. [DOI] [PubMed] [Google Scholar]
- 23.Aldea M, et al. Overcoming resistance to Tumor-Targeted and Immune-Targeted therapies. Cancer Discov. 2021;11(4):874–99. [DOI] [PubMed] [Google Scholar]
- 24.Sharma P, et al. Primary, adaptive, and acquired resistance to Cancer immunotherapy. Cell. 2017;168(4):707–23. [DOI] [PMC free article] [PubMed] [Google Scholar]
- 25.Qi Y, et al. Tumor-infiltrating CD39(+)CD8(+) T cells determine poor prognosis and immune evasion in clear cell renal cell carcinoma patients. Cancer Immunol Immunother. 2020;69(8):1565–76. [DOI] [PMC free article] [PubMed] [Google Scholar]
- 26.Wu J, et al. High expression of CD39 is associated with poor prognosis and immune infiltrates in clear cell renal cell carcinoma. Onco Targets Ther. 2020;13:10453–64. [DOI] [PMC free article] [PubMed] [Google Scholar]
- 27.Koppensteiner L et al. Location of CD39(+) T cell subpopulations within tumors predict differential outcomes in non-small cell lung cancer. J Immunother Cancer, 2023; 11(8). [DOI] [PMC free article] [PubMed]
- 28.Shen Y, et al. CD39(hi) identifies an exhausted tumor-reactive CD8(+) T cell population associated with tumor progression in human gastric cancer. Pharmacol Res. 2024;202:107122. [DOI] [PubMed] [Google Scholar]
- 29.Zhang Y, et al. CD39 Inhibition and VISTA Blockade May overcome radiotherapy resistance by targeting exhausted CD8 + T cells and immunosuppressive myeloid cells. Cell Rep Med. 2023;4(8):101151. [DOI] [PMC free article] [PubMed] [Google Scholar]
- 30.Liu L, et al. Single cell sequencing reveals that CD39 Inhibition mediates changes to the tumor microenvironment. Nat Commun. 2022;13(1):6740. [DOI] [PMC free article] [PubMed] [Google Scholar]
- 31.Li XY, et al. Targeting CD39 in Cancer reveals an extracellular ATP- and Inflammasome-Driven tumor immunity. Cancer Discov. 2019;9(12):1754–73. [DOI] [PMC free article] [PubMed] [Google Scholar]
- 32.Zhang J, et al. Turning cold tumors hot: from molecular mechanisms to clinical applications. Trends Immunol. 2022;43(7):523–45. [DOI] [PubMed] [Google Scholar]
- 33.Fu XL, et al. Combination of oxaliplatin and POM-1 by nanoliposomes to reprogram the tumor immune microenvironment. J Controlled Release. 2022;347:1–13. [DOI] [PubMed] [Google Scholar]
- 34.Laumont CM, Nelson BH. B cells in the tumor microenvironment: Multi-faceted organizers, regulators, and effectors of anti-tumor immunity. Cancer Cell. 2023;41(3):466–89. [DOI] [PubMed] [Google Scholar]
- 35.Hanada KI, et al. A phenotypic signature that identifies neoantigen-reactive T cells in fresh human lung cancers. Cancer Cell. 2022;40(5):479–e4936. [DOI] [PMC free article] [PubMed] [Google Scholar]
- 36.Blank CU, et al. Defining ‘T cell exhaustion’. Nat Rev Immunol. 2019;19(11):665–74. [DOI] [PMC free article] [PubMed] [Google Scholar]
- 37.Collier JL, et al. Not-so-opposite ends of the spectrum: CD8(+) T cell dysfunction across chronic infection, cancer and autoimmunity. Nat Immunol. 2021;22(7):809–19. [DOI] [PMC free article] [PubMed] [Google Scholar]
- 38.Antonioli L, et al. CD39 and CD73 in immunity and inflammation. Trends Mol Med. 2013;19(6):355–67. [DOI] [PMC free article] [PubMed] [Google Scholar]
- 39.Moesta AK, Li XY, Smyth MJ. Targeting CD39 in cancer. Nat Rev Immunol. 2020;20(12):739–55. [DOI] [PubMed] [Google Scholar]
- 40.Muller CE, et al. Polyoxometalates–a new class of potent ecto-nucleoside triphosphate diphosphohydrolase (NTPDase) inhibitors. Bioorg Med Chem Lett. 2006;16(23):5943–7. [DOI] [PubMed] [Google Scholar]
- 41.Wall MJ, et al. The novel NTPDase inhibitor sodium polyoxotungstate (POM-1) inhibits ATP breakdown but also blocks central synaptic transmission, an action independent of NTPDase Inhibition. Neuropharmacology. 2008;55(7):1251–8. [DOI] [PubMed] [Google Scholar]
Associated Data
This section collects any data citations, data availability statements, or supplementary materials included in this article.
Supplementary Materials
Data Availability Statement
No datasets were generated or analysed during the current study. The data supporting the findings of this study are available from the corresponding authors upon request. The Gene Expression Omnibus (GEO) accession numbers for the single-cell RNA sequencing (scRNA-seq) data reported in this study are GSE197461 and GSE208653, respectively. All computational code used in this study is publicly available.