

Abstract
The complete assignment of the proton chemical shifts obtained by nuclear magnetic resonance (NMR) spectroscopy of de-O-acetylated glucuronoxylomannans (GXMs) from Cryptococcus neoformans permitted the high-resolution determination of the total structure of any GXM. Six structural motifs based on an α-(1→3)-mannotriose substituted with variable quantities of 2-O-β- and 4-O-β-xylopyranosyl and 2-O-β-glucopyranosyluronic acid were identified. The chemical shifts of only the anomeric protons of the mannosyl residues served as structure reporter groups (SRG) for the identification and quantitation of the six triads present in any GXM. The assigned protons for the mannosyl residues resonated at clearly distinguishable positions in the spectrum and supplied all the information essential for the assignment of the complete GXM structure. This technique for assigning structure is referred to as the SRG concept. The SRG concept was used to analyze the distribution of the six mannosyl triads of GXMs obtained from 106 isolates of C. neoformans. The six mannosyl triads occurred singularly or in combination with one or more of the other triads. The identification and quantitation of the SRG were simplified by using a computer-simulated artificial neural network (ANN) to automatically analyze the SRG region of the one-dimensional proton NMR spectra. The occurrence and relative distribution of the six mannosyl triads were used to chemotype C. neoformans on the basis of subtle variations in GXM structure determined by analysis of the SRG region of the proton NMR spectrum by the ANN. The data for the distribution of the six SRGs from GXMs of 106 isolates of C. neoformans yielded eight chemotypes, Chem1 through Chem8.
Cryptococcus neoformans is an opportunistic pathogenic yeast. In most healthy individuals the organism does not progress beyond the lungs, its normal portal of entry. Hematogenous dissemination occurs in patients who are immunosuppressed due to immunotherapy or some form of immunodeficiency (38, 44, 52). AIDS patients are vulnerable to opportunistic infections due to the precipitous decline in the competency of the immune system (35). Consequently, the occurrence of cryptococcosis has increased dramatically, concomitantly with the emergence of AIDS (24, 41, 67). Despite antifungal therapy, AIDS patients with cryptococcosis are extremely susceptible to relapse. With the exception of Pneumocystis carinii, cryptococcosis is the most common invasive life-threatening fungal infection associated with AIDS (27); it is a leading cause of death in these patients (25). The yeast has a propensity to involve the central nervous system, where it causes meningoencephalitis (26, 48). Other frequent sites of infection are the liver and spleen. Diagnosis of cryptococcosis in an AIDS patient may portend the progression to further immunosuppression and to a more severe phase of the disease (47). The insidious association of cryptococcosis with AIDS has resulted in increased attempts to define the virulence factors associated with the yeast and the host at the molecular level.
C. neoformans is atypical of pathogenic fungi in that it produces a well-developed polysaccharide capsule (18, 60). The major capsular polysaccharide is glucuronoxylomannan (GXM), which is an important contributor to the virulence of C. neoformans (60). GXM is antiphagocytic (20, 36) and poorly immunogenic (37, 45), and acapsular strains have diminished virulence (32). In vitro, GXM inhibits leukocyte migration (28), enhances human immunodeficiency virus (HIV) infection in human lymphocytes (46, 47), induces the release of tumor necrosis factor alpha by peripheral-blood mononuclear cells (21, 42), and promotes l-selectin shedding from neutrophils (28).
Two distinct varieties of C. neoformans have been described: C. neoformans var. neoformans and C. neoformans var. gattii (39). The two varieties were subdivided serologically into four serotypes based on the reactivities of whole yeast cells to polyclonal sera that were prepared by selective absorption with whole yeast cells (31, 33, 68). The variety neoformans consists of serotypes A, D, and A/D, and the variety gattii consists of serotypes B and C. Most cryptococcal infections in AIDS patients are due to C. neoformans var. neoformans, with serotype A comprising the majority of isolates (19, 40, 51, 57). Monoclonal antibodies and factor sera react specifically with GXMs. These observations substantiate the role GXMs play in conferring serotypes on C. neoformans.
The presence of at least eight antigenic factors, distributed among the serotypes of C. neoformans, has been proposed based on the reactivities of factor sera in yeast cell agglutination reactions (33). No structure corresponding to any one of the eight antigenic factors has been delineated.
The typical GXM consists of a linear (1→3)-α-d-mannopyranan bearing β-d-xylopyranosyl (Xylp), β-d-glucopyranosyluronic acid (GlcpA), and 6-O-acetyl substituents (18, 60, 63). The disposition of the O-acetyl substituents is the major determinant of the antigenic activity observed among GXMs obtained from all serotypes (A, B, C, D, and A/D) (15). Generally, the serological activity observed with type-specific antibody is lost after de-O-acetylation (15, 36). Despite considerable structural and antigenic diversity, a simple structural relationship exists between GXMs of reference isolates for the four serotypes. They are all comprised of a core repeating unit (Fig. 1) to which (1→2)-linked and (1→4)-linked β-d-Xylp units are added in increments of one to four residues. In this way, explicit molar ratios of Xyl/Man/GlcA in serotypes D, A, B, and C have been assigned as 1:3:1, 2:3:1, 3:3:1, and 4:3:1, respectively (Fig. 2, M1 through M4) (18). GXM from serotypes A and D are mainly substituted with Xylp at O-2, whereas GXM from serotypes B and C are substituted at O-2 and at O-4. Additional analytical data show that the precise molar ratios and typical substitution patterns, as proposed in the original models of GXM structure, are an oversimplification. In addition, substituent dispositions previously thought to be characteristic of one serotype have been identified in heterologous isolates (23, 24, 62, 63).
FIG. 1.

The core repeating structure of GXM.
FIG. 2.

The six mannosyl triads found in GXMs of C. neoformans.
The primary sequences of de-O-acetylated GXMs from serotypes A, B, C, and D were determined previously by two-dimensional (2D) nuclear magnetic resonance (NMR) spectroscopy (11, 56, 58, 59), and the assignments of the 1H and 13C chemical shifts were reported. These data, in conjunction with earlier chemical and NMR analyses of GXMs, document the existence of antigenic multiplicity among the serotypes, particularly in serotypes A and C (11, 24, 62). GXMs within a particular serotype cannot be subdivided serologically because factor sera and monoclonal antibodies have low discriminatory power for determining structural heterogeneity (15, 17). Consequently, the variation in GXM structure, as determined serologically, cannot be correlated to the range of virulence observed among C. neoformans isolates.
The complete assignment of the proton chemical shifts for the structural elements present in various GXMs permits the high-resolution determination of the total structure of any GXM. In addition, the primary structural assignment of GXM can be made by using only the anomeric protons of the mannose residues. This is based on the fact that the assigned proton chemical shifts for the mannose residues resonate at clearly distinguishable positions in the spectrum and supply all the information essential for the assignment of the complete structure. This technique is referred to as the structural reporter group concept (SRG) (65, 66).
The identification and quantitation of the SRG can be simplified by using a computer-simulated artificial neural network (ANN) (53) to automatically analyze 1D proton NMR spectra as illustrated in Fig. 3. The 1D proton NMR spectrum serves as the input data for the ANN, and the ANN produces an output that represents the relative ratio of each SRG. The selection of an ANN to predict the chemotype of C. neoformans is not arbitrary. ANNs are extremely flexible in design, size, and method of training. The ANN is trained with data (1D proton NMR spectra) that define the structure of the polysaccharides obtained by conventional analytical methods.
FIG. 3.

ANN configuration for the analysis of the GXM NMR data for determining the chemotype of C. neoformans.
ANN is a network that consists of simple processing elements (PEs) and connecting elements that provide communication between the PEs (53). The PEs are also referred to as “artificial neurons” or simply “neurons,” and the connecting elements are referred to as “synaptic pathways” or “synaptic connections” (53).
ANNs are ideal for extracting distinguishing features from complex data patterns. ANNs have been used for a variety of classification and identification tasks, including the identification of NMR spectra of polysaccharides and other spectral data (43, 49, 50, 54, 61), the diagnosis of diseases (1–8, 14, 15), and other classification problems (8–10, 13, 29, 55, 64). This article describes the development of a computer-simulated ANN for the quantitative analysis of GXM fine structure by using the proton NMR SRG concept. The data were used to develop a chemotyping system based on the quantitation of the subtle variations in GXM structure that occur in C. neoformans isolates. The ANN is potentially a powerful tool for investigating the impact that the variation in the fine structure of GXM from any particular isolate has on the effects observed with in vitro and in vivo biological systems.
MATERIALS AND METHODS
GXM.
C. neoformans isolates used in this study are listed in Table 1. Many GXMs were available from earlier studies (11, 15, 23, 24, 58, 59, 62). GXMs from C. neoformans isolates not studied previously were prepared as described elsewhere (56). A streamlined method for the isolation of GXM from selected isolates was used also. C. neoformans isolates were expanded in 50 ml of the chemically defined liquid medium (22). After 5 days, the culture was autoclaved for 25 min at 121°C and the cells were removed by centrifugation (at 18,000 × g) for 1 h. The culture supernatant (∼50 ml) was adjusted to 0.2 M NaCl, and 0.15 g of cetyltrimethyl ammonium bromide (CTAB) was added to the stirred solution at 23°C. A 0.05% solution of CTAB (100 ml) was added slowly, with stirring. The precipitate was recovered by centrifugation (at 5,000 × g) for 15 min at 23°C. The pellet was triturated with 10% ethanol, and the suspension was centrifuged as described above. The pellet was dissolved in 1 M NaCl (25 ml) by stirring overnight. GXM was precipitated by the slow addition of 3 volumes of 95% ethanol, and the flask was placed at 4°C. The GXM was recovered by centrifugation (at 5,000 × g) for 15 min at 4°C. All preparations of GXM were dissolved in 1 M NaCl (∼25 ml), treated by ultrasonic irradiation (with a Branson Sonifier, model 450) for 2 h at 80% power and 40% pulse at a temperature below 20°C, dialyzed, and recovered by lyophilization. A portion of each GXM was de-O-acetylated at pH 11 (NH4OH) for 24 h at 23°C (24), dialyzed, and lyophilized. De-O-acetylated GXMs previously treated by ultrasonic irradiation were used in all subsequent NMR experiments. The apparent average molecular mass of the GXMs used for NMR analysis was 1.2 × 10⁵ Da.
TABLE 1.
C. neoformans isolates used in this study
| Isolate | Serotype | Source |
|---|---|---|
| 6 | A | T. G. Mitchell (Duke University) |
| 18 | B/C | K. J. Kwon-Chung (National Institutes of Health) |
| 34 | C | K. J. Kwon-Chung |
| 98 | A | T. G. Mitchell |
| 110 | A/D | T. G. Mitchell |
| 118 | A | T. G. Mitchell |
| 127 | D | E. Jacobson (Medical College of Virginia) |
| 132 | A/D | T. Shinoda (Meiji College of Pharmacy, Tokyo, Japan) |
| 150 | A | T. G. Mitchell |
| 184 | B | K. J. Kwon-Chung |
| 194 | A | T. G. Mitchell |
| 196 | A | K. J. Kwon-Chung |
| 201 | A | K. J. Kwon-Chung |
| 298 | C | K. J. Kwon-Chung |
| 298 Warty | B>Ca | R. Cherniak (Georgia State University); derived from 298 |
| 371 | A | K. J. Kwon-Chung |
| 401 | C | K. J. Kwon-Chung |
| 409 | B | E. Reiss (Centers for Disease Control and Prevention) |
| 430 | D | K. J. Kwon-Chung |
| 1254 | D | E. Reiss |
| 3168b | D | E. Reiss |
| 3183 | C | E. Reiss |
| 3939 | B | E. Reiss |
| 9375 | D | H. J. Shadomy (Medical College of Virginia) |
| 9759 | A | E. Reiss |
| 9759a | A | R. Cherniak; subculture of 9759 |
| 24067 a | D | A. Casadevall (Albert Einstein College of Medicine) |
| 24067 b | D | A. Casadevall |
| 24067 c | D | A. Casadevall |
| 24067 d1 | D | A. Casadevall |
| 24067 d2 | D | A. Casadevall |
| 24067 e | D | A. Casadevall |
| 24067 f1 | D | A. Casadevall |
| 24067 f2 | D | A. Casadevall |
| 24067 g | D | A. Casadevall |
| A104 | A | T. R. Kozel (University of Nevada, Reno) |
| A271 | A | T. R. Kozel |
| A288 | A | T. R. Kozel |
| A289 | A | T. R. Kozel |
| A24064 | A | T. R. Kozel |
| ATCC 6352 | A | F. I. Molina (American Type Culture Collection) |
| ATCC 24065 | B | F. I. Molina |
| ATCC 24066 | B/C | F. I. Molina |
| ATCC 28958 | D | F. I. Molina |
| ATCC 32269 | B | F. I. Molina |
| ATCC 32608 | C | F. I. Molina |
| ATCC 34875 | D | F. I. Molina |
| ATCC 34878 | B | F. I. Molina |
| ATCC 34880 | C | F. I. Molina |
| ATCC 48184 | A/D | F. I. Molina |
| ATCC 62066 | A | F. I. Molina |
| ATCC 90126 | A/D | F. I. Molina |
| AW | A | S. Levitz (Boston University Medical Center) |
| B3502 | D | K. J. Kwon-Chung |
| B4538 | A | K. J. Kwon-Chung |
| C917 | C | T. R. Kozel |
| C24066 | C | T. R. Kozel |
| C24066T | C | R. Cherniak; derived from C24066 |
| C24066W | B/C | R. Cherniak; derived from C24066 |
| CDC92-64 | A/B/D | M. E. Brandt (Centers for Disease Control and Prevention) |
| CDC92-159 | D | M. E. Brandt |
| CDC92-162 | A/B/D | M. E. Brandt |
| CDC92-187 | A/B/D | M. E. Brandt |
| CDC92-232 | D | M. E. Brandt |
| D52 | D | T. R. Kozel |
| D529 | D | T. R. Kozel |
| D24067 | D | T. R. Kozel |
| F12 | D | E. Jacobson |
| F27 | A | J. Murphy (University of Oklahoma) |
| F113 | A | J. Murphy |
| F117 | A | J. Murphy |
| Houpt 24066 | B/C | T. R. Kozel |
| J9a | D | A. Casadevall |
| J9b | D | A. Casadevall |
| J9c | D | A. Casadevall |
| J9d | D | A. Casadevall |
| J11a | A | A. Casadevall |
| J11b | A | A. Casadevall |
| J22a | A | A. Casadevall |
| J22b | A | A. Casadevall |
| Kuhl 94-8069 | B | J. Murphy |
| M0010 | A | T. G. Mitchell |
| M0013 | A | T. G. Mitchell |
| M0024 | A/D | T. G. Mitchell |
| M0025 | A | T. G. Mitchell |
| M0027 | A | T. G. Mitchell |
| M0029 | A | T. G. Mitchell |
| M0046 | A | T. G. Mitchell |
| M0048 | A | T. G. Mitchell |
| M0050 | D | T. G. Mitchell |
| M0051 | A | T. G. Mitchell |
| M0053 | A | T. G. Mitchell |
| M0062 | A | T. G. Mitchell |
| M0095 | A | T. G. Mitchell |
| MU-1 | A | R. Cherniak; derived from 9759 |
| NCPF 3168 | A | A. Verheul (University Hospital, Utrecht, The Netherlands) |
| NIH 37 | A | A. Verheul |
| NU-2 | A | J. Murphy |
| P0 | NDc | A. Casadevall |
| R1064 | A | K. J. Kwon-Chung |
| SB4a | A>D | A. Casadevall |
| SB4b | A>D | A. Casadevall |
| SB4c | D | A. Casadevall |
| SB6a | D | A. Casadevall |
| SB6b | A/D | A. Casadevall |
| TYCC 38-602 | A | K. J. Kwon-Chung |
B>C, activity with B greater than activity with C.
Submitted to us as serotype A but chemically and serologically identical to serotype D.
ND, not determined.
GXMs isolated in prior studies and those specifically selected for use in this investigation are referenced in Table 1. The serotype of each GXM, whether determined previously or by dot enzyme assay (16) as part of this study, is given in Table 1.
NMR spectroscopy.
De-O-acetylated GXMs (∼10 mg) were exchanged in 99.9% D2O and lyophilized. Each sample was dissolved in 0.80 ml of 99.96% D2O, then filtered through a Millipore MILLEX-GS 0.22-μm-pore-size filter, and the filtrate was transferred into a 5-mm-diameter NMR tube (Wilmad 528-PP). All 1H NMR experiments were performed at 80°C on a Varian VXR-400 or on a Varian Unity+500 spectrometer equipped with a 5-mm 1H/19F probe. 1H chemical shifts were measured relative to internal sodium 4,4-dimethyl-4-silapentane-1-sulfonate taken as 0.00 ppm. The data were processed off-line by using a FELIX 2.30 software package (Biosym/Molecular Simulations, San Diego, Calif.) on a Silicon Graphics Indy workstation. Each spectrum was resolution enhanced by applying a sine bell window function over all real data points. The portion of each proton spectrum between 5.00 and 5.40 ppm, where only the mannosyl residues resonate, was analyzed separately. This is the SRG that was used to identify the specific saccharide sequences present in a particular GXM.
Quantitation of each proton NMR signal in the SRG region required the analysis of the NMR spectrum prior to resolution enhancement. The proton NMR data were processed without a window function, and the full spectrum was saved as a FELIX ASCII file. The FELIX ASCII file was transferred to a desktop computer, where it was converted to ordered-pair data (chemical shift, intensity). The ordered-pair data (x, y) were imported into PeakFit 4.0 (Jandel Scientific, Inc., San Rafael, Calif.). Data in the SRG region (5.0 to 5.4 ppm) were selected, and the remaining data were discarded. The data in the SRG region were analyzed with the Autofit Peaks I selection (by using Lorentzian functions). The peaks designated by PeakFit were processed manually based on the assignment of the chemical shifts of the SRG regions, determined previously from the resolution-enhanced spectra (see above). Rough fitting was done visually after all the peaks were selected. Final data analysis was done with the Marquardt-Levenberg fitting algorithm. The chemical shifts of the resolved peaks and their corresponding areas for GXM were saved as an ASCII file. The data were used to quantitate the presence of particular SRGs in GXM.
ANN.
In this study we used a universal ANN design that consisted of a two-stage feed-forward neural-network topology and the standard, backpropagation training algorithm (53), as well as a modified version. Some parameters, such as hidden layer size, step size, etc. (53) were optimized experimentally. The final step was to train the ANN by using the optimum parameters.
FELIX ASCII files representing the 1H NMR spectra for GXMs obtained from 106 individual C. neoformans isolates were divided into a training set (69 spectra) and a testing set (37 spectra). The SRG region of the NMR data was used for the training set. The results of the PeakFit analysis (percent each SRG) were used as the desired output data. Each file was submitted individually, via the Complex Carbohydrate Research Center’s web site (http://www.ccrc.uga.edu) by using a web browser (such as Netscape Navigator), for analysis by the trained neural network. A report page containing the percentage of each SRG in the sample data was generated by the neural network. The output of the trained neural network was compared to the data obtained independently by PeakFit.
The initial experiments used the standard backpropagation training algorithm described by Rumelhart and McClelland (53). However, a modification to the definition of the error function improved the performance of the ANN. This modification included an additional mathematical term that required that the sum of the SRG ratios add up to 100%. The final ANN was trained with this modification. The trained ANN was cross-validated (53) with 1H NMR data which were not part of the training set. The purpose of cross-validation was to determine when to terminate training.
RESULTS
SRGs.
The complete assignment of the proton NMR chemical shifts for all the sugar residues present in GXMs selected from a broad range of C. neoformans isolates has been described previously (11, 12, 56, 58, 59). Based on the analysis of these data, we identified six recurring triad structures. The first mannosyl residue from the nonreducing end of a triad substituted at O-2 with β-d-glucuronic acid was always labeled Ma (see Fig. 1). For the development of the C. neoformans chemotyping system, the six structural triads were designated M1 through M6 (Fig. 2). The proton chemical shifts of the mannosyl residues characteristic of the six triads were obtained from our previous studies. The six triads, M1 through M6, and their characteristic chemical shifts (Table 2), constitute the SRG region of GXM. The development of the chemotyping system for C. neoformans was predicated on our ability to identify and quantify the SRGs for GXM by using high-field proton NMR.
TABLE 2.
Proton NMR chemical shifts of the SRG triads of C. neoformans GXMs
| SRG | No.a | Chemical shift (ppm)
|
||
|---|---|---|---|---|
| Mab | Mb | Mc | ||
| M1 | 32 | 5.241 ± 0.002 | 5.193 ± 0.003c | 5.193 ± 0.002c |
| M2 | 56 | 5.244 ± 0.002 | 5.306 ± 0.004 | 5.175 ± 0.003 |
| M3 | 45 | 5.208 ± 0.003 | 5.325 ± 0.005 | 5.138 ± 0.004 |
| M4 | 7 | 5.243 ± 0.003 | 5.301 ± 0.005 | 5.075 ± 0.002 |
| M5 | 26 | 5.217 ± 0.002 | 5.192 ± 0.003d | 5.192 ± 0.003d |
| M6 | 47 | 5.260 ± 0.002 | 5.192 ± 0.002e | 5.117 ± 0.002 |
Number of GXMs analyzed to determine the chemical shifts of the SRG.
Nomenclature is as presented in Fig. 1.
In the M1 SRG, Ma and Mb are degenerate.
In the M5 SRG, Mb and Mc are degenerate and overlap with Mb and Mc of the M1 SRG.
In the M6 SRG, Mb is degenerate with Mb and Mc of the M1 and M5 SRGs.
Identification of SRGs by using proton NMR.
The 1D proton spectrum of each GXM was recorded as illustrated for C. neoformans isolate 150 in Fig. 4a (1D full spectrum with SRG region marked). The SRG region of the proton spectrum was selected; resolution enhancement and expansion of the data were done to simplify the identification process (Fig. 4b). The presence of SRGs M1 through M6 in the GXM proton spectrum was determined by using the chemical-shift assignments listed in Table 2. Two SRGs, M2 and M3 were identified by using the data for the GXM of C. neoformans isolate 150 (Fig. 4b) and the data in Table 2. Similarly, 106 isolates were investigated and the SRG distributions in individual GXMs were determined (Table 3).
FIG. 4.
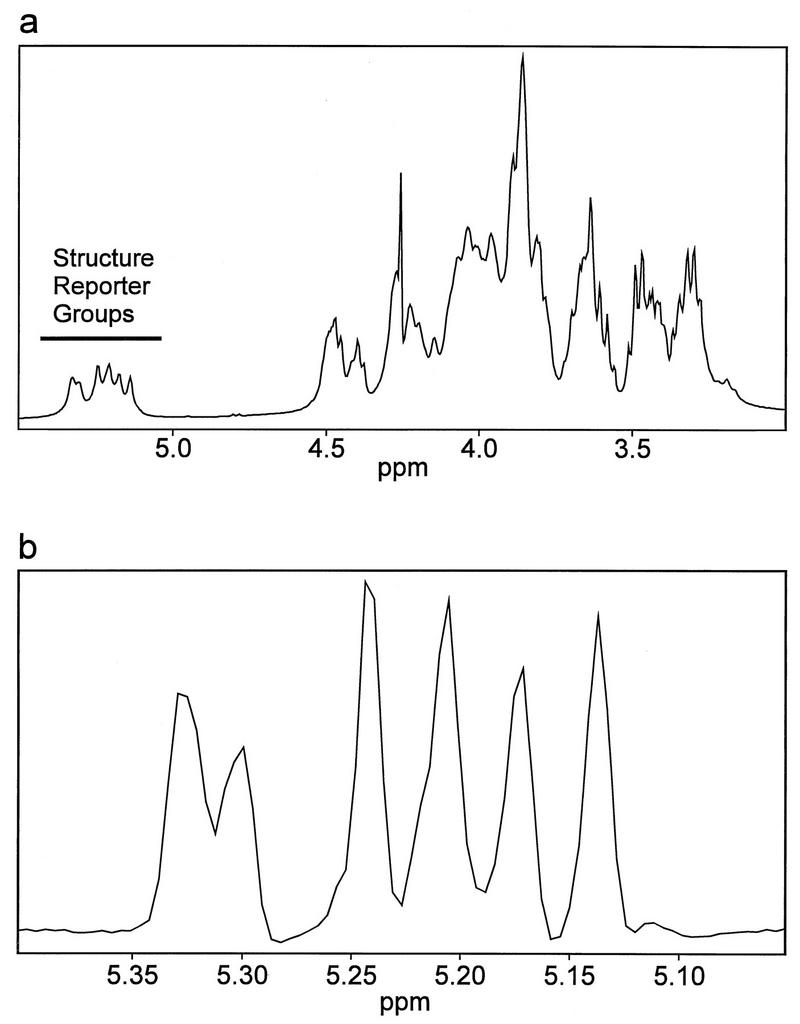
Full (a) and resolution-enhanced (b) 1D proton NMR spectrum of C. neoformans isolate 150.
TABLE 3.
Assignment of SRGs M1 through M6 to chemotypes 1 through 8 by using PeakFit and the ANN for the isolates described in Table 1a
| Isolate | M1 | M2 | M3 | M4 | M5 | M6 | SRG | Total |
|---|---|---|---|---|---|---|---|---|
| Chem1 | ||||||||
| P0 | 100 | M1 | ||||||
| [72] | [11] | [16] | [99] | |||||
| 24067 d1 | 100 | M1 | ||||||
| [75] | [8] | [22] | [105] | |||||
| 24067 d2 | 100 | M1 | ||||||
| [73] | [8] | [20] | [101] | |||||
| 24067 e | 100 | M1 | ||||||
| [71] | [6] | [9] | [17] | [103] | ||||
| 24067 g | 100 | M1 | ||||||
| [75] | [9] | [18] | [104] | |||||
| 24067 f1 | 100 | M1 | ||||||
| [62] | [8] | [14] | [10] | [14] | [108] | |||
| 24067 f2 | 100 | M1 | ||||||
| [71] | [23] | [7] | [101] | |||||
| 24067 c | 100 | M1 | ||||||
| [76] | [10] | [18] | [104] | |||||
| 24067 a | 100 | M1 | ||||||
| [71] | [5] | [13] | [16] | [105] | ||||
| 24067 b | 100 | M1 | ||||||
| [74] | [8] | [20] | [102] | |||||
| D529 | 79 | 21 | M1 | |||||
| [72] | [8] | [22] | [102] | |||||
| 1254 | 79 | 21 | M1 | |||||
| [72] | [20] | [92] | ||||||
| 9375 | 74 | 10 | 16 | M1 | ||||
| [71] | [10] | [21] | [102] | |||||
| M0050 | 70 | 30 | M1 | |||||
| [67] | [18] | [32] | [117] | |||||
| D52 | 65 | 35 | M1 | |||||
| [66] | [35] | [101] | ||||||
| 3168 | 68 | 8 | 24 | M1 | ||||
| [72] | [8] | [21] | [101] | |||||
| 127 | 64 | 14 | 22 | M1 | ||||
| [72] | [8] | [22] | [102] | |||||
| J9a | 59 | 41 | M1 | |||||
| [59] | [42] | [101] | ||||||
| F12 | 57 | 11 | 32 | M1 | ||||
| [66] | [8] | [24] | [98] | |||||
| NIH 37 | 56 | 11 | 33 | M1 | ||||
| [35] | [19] | [4] | [49] | [107] | ||||
| J9b | 53 | 27 | 20 | M1 | ||||
| [46] | [30] | [14] | [90] | |||||
| B3502 | 52 | 48 | M1 | |||||
| [53] | [45] | [98] | ||||||
| J9c | 50 | 29 | 21 | M1 | ||||
| [46] | [26] | [15] | [87] | |||||
| J22b | 49 | 22 | 29 | M1 | ||||
| [47] | [8] | [4] | [48] | [107] | ||||
| J22a | 39 | 18 | 43 | M1 | ||||
| [33] | [18] | [3] | [53] | [107] | ||||
| 430 | 38 | 44 | 18 | M1 | ||||
| [49] | [36] | [12] | [97] | |||||
| CDC92-159 | 38 | 28 | 34 | M1 | ||||
| [39] | [10] | [8] | [30] | [77] | ||||
| ATCC 28958 | 34 | 19 | 47 | M1 | ||||
| [34] | [16] | [3] | [54] | [107] | ||||
| ATCC 48184 | 32 | 16 | 52 | M1 | ||||
| [20] | [46] | [3] | [47] | [116] | ||||
| CDC92-232 | 31 | 69 | M1 | |||||
| [30] | [65] | [95] | ||||||
| M0024 | 30 | 70 | M1 | |||||
| [32] | [64] | [96] | ||||||
| 98 | 27 | 20 | 53 | M1 | ||||
| [32] | [2] | [54] | [89] | |||||
| ATCC 34875 | 27 | 25 | 48 | M1 | ||||
| [25] | [32] | [3] | [55] | [115] | ||||
| Chem2 | ||||||||
| J9d | 63 | 18 | 19 | M1>M2b | ||||
| [66] | [1] | [22] | [89] | |||||
| SB4a | 47 | 28 | 25 | M1>M2 | ||||
| [24] | [16] | [40] | [80] | |||||
| M0025 | 46 | 29 | 25 | M1>M2 | ||||
| [5] | [40] | [9] | [16] | [70] | ||||
| SB6a | 32 | 24 | 14 | 30 | M1>M2 | |||
| [29] | [20] | [7] | [34] | [90] | ||||
| 132 | 31 | 23 | 2 | 44 | M1>M2 | |||
| [19] | [27] | [2] | [47] | [95] | ||||
| 110 | 31 | 21 | 6 | 42 | M1>M2 | |||
| [23] | [30] | [3] | [53] | [112] | ||||
| SB4c | 28 | 28 | 12 | 36 | M1>M2 | |||
| [27] | [23] | [6] | [34] | [90] | ||||
| M0095 | 19 | 59 | 22 | M2>M1 | ||||
| [10] | [54] | [24] | [88] | |||||
| Chem3 | ||||||||
| M0051 | 32 | 29 | 18 | 21 | M1>M2>M3 | |||
| [16] | [37] | [3] | [34] | [90] | ||||
| M0010 | 28 | 25 | 6 | 17 | 24 | M1>M2>M3 | ||
| [12] | [63] | [3] | [4] | [30] | [112] | |||
| M0062 | 25 | 17 | 8 | 20 | 30 | M1>M2>M3 | ||
| [18] | [39] | [2] | [3] | [38] | [100] | |||
| SB6b | 23 | 34 | 15 | 28 | M2>M1>M3 | |||
| [18] | [33] | [3] | [42] | [96] | ||||
| M0046 | 23 | 18 | 4 | 30 | 25 | M1>M2>M3 | ||
| [12] | [56] | [3] | [3] | [29] | [103] | |||
| M0027 | 23 | 46 | 31 | M2>M3>M1 | ||||
| [2] | [49] | [17] | [68] | |||||
| M0013 | 19 | 38 | 15 | 6 | 22 | M2>M1>M3 | ||
| [2] | [80] | [15] | [1] | [7] | [105] | |||
| AW | 8 | 47 | 9 | 12 | 24 | M2>M1>M3 | ||
| [14] | [37] | [2] | [5] | [25] | [83] | |||
| Chem4 | ||||||||
| MU-1 | 100 | M2 | ||||||
| [89] | [14] | [103] | ||||||
| 201 | 100 | M2 | ||||||
| [5] | [25] | [85] | [6] | [10] | [5] | [136] | ||
| A24064 | 100 | M2 | ||||||
| [92] | [92] | |||||||
| 118 | 100 | M2 | ||||||
| [87] | [87] | |||||||
| SB4b | 77 | 23 | M2 | |||||
| [72] | [8] | [80] | ||||||
| 9759a | 76 | 24 | M2 | |||||
| [63] | [16] | [79] | ||||||
| 9759 | 75 | 25 | M2 | |||||
| [68] | [12] | [80] | ||||||
| M0029 | 74 | 26 | M2 | |||||
| [76] | [8] | [84] | ||||||
| J11b | 63 | 17 | 22 | M2 | ||||
| [76] | [12] | [1] | [8] | [97] | ||||
| A104 | 58 | 42 | M2 | |||||
| [57] | [35] | [92] | ||||||
| Chem5 | ||||||||
| R1064 | 91 | 9 | M2>M3 | |||||
| [83] | [16] | [99] | ||||||
| M0053 | 85 | 15 | M2>M3 | |||||
| [84] | [13] | [97] | ||||||
| ATCC 62066 | 82 | 18 | M2>M3 | |||||
| [86] | [13] | [99] | ||||||
| F113 | 81 | 19 | M2>M3 | |||||
| [86] | [17] | [103] | ||||||
| B4538 | 76 | 11 | 13 | M2>M3 | ||||
| [81] | [15] | [6] | [102] | |||||
| TYCC 38-602 | 75 | 25 | M2>M3 | |||||
| [76] | [22] | [98] | ||||||
| 194 | 75 | 25 | M2>M3 | |||||
| [75] | [19] | [94] | ||||||
| F27 | 75 | 25 | M2>M3 | |||||
| [89] | [14] | [103] | ||||||
| F117 | 73 | 27 | M2>M3 | |||||
| [86] | [8] | [94] | ||||||
| ATCC 6352 | 71 | 29 | M2>M3 | |||||
| [84] | [25] | [109] | ||||||
| 196 | 70 | 30 | M2>M3 | |||||
| [76] | [12] | [88] | ||||||
| NU-2 | 69 | 31 | M2>M3 | |||||
| [78] | [20] | [98] | ||||||
| A289 | 69 | 31 | M2>M3 | |||||
| [69] | [26] | [95] | ||||||
| CDC92-64 | 67 | 33 | M2>M3 | |||||
| [56] | [35] | [91] | ||||||
| ATCC 90126 | 65 | 35 | M2>M3 | |||||
| [66] | [35] | [101] | ||||||
| 6 | 65 | 14 | 21 | M2>M3 | ||||
| [69] | [21] | [8] | [98] | |||||
| J11a | 64 | 12 | 24 | M2>M3 | ||||
| [78] | [7] | [10] | [95] | |||||
| M0048 | 63 | 37 | M2>M3 | |||||
| [72] | [31] | [103] | ||||||
| 371 | 60 | 40 | M2>M3 | |||||
| [62] | [37] | [99] | ||||||
| CDC92-162 | 59 | 41 | M2>M3 | |||||
| [55] | [45] | [100] | ||||||
| A288 | 58 | 20 | 11 | 11 | M2>M3 | |||
| [32] | [8] | [3] | [8] | [53] | ||||
| NCPF 3168 | 52 | 48 | M2>M3 | |||||
| [86] | [14] | [100] | ||||||
| CDC92-187 | 49 | 44 | 7 | M2>M3 | ||||
| [56] | [42] | [2] | [100] | |||||
| 150 | 45 | 55 | M3>M2 | |||||
| [62] | [41] | [103] | ||||||
| A271 | 43 | 57 | M3>M2 | |||||
| [39] | [50] | [7] | [96] | |||||
| ATCC 32608 | 39 | 46 | 15 | M3>M2 | ||||
| [18] | [70] | [10] | [2] | [100] | ||||
| Chem6 | ||||||||
| 401 | 24 | 60 | 16 | M3>M2>M4 | ||||
| [4] | [55] | [30] | [89] | |||||
| C917 | 13 | 74 | 13 | M3>M2=M4 | ||||
| [21] | [72] | [13] | [106] | |||||
| Chem7 | ||||||||
| C24066 | 100 | M3 | ||||||
| [93] | [6] | [99] | ||||||
| Houpt 24066 | 100 | M3 | ||||||
| [93] | [5] | [98] | ||||||
| C24066W | 100 | M3 | ||||||
| [16] | [86] | [5] | [107] | |||||
| Kuhl 94-8069 | 100 | M3 | ||||||
| [96] | [96] | |||||||
| 3939 | 100 | M3 | ||||||
| [93] | [93] | |||||||
| 3183 | 100 | M3 | ||||||
| [94] | [94] | |||||||
| ATCC 24065 | 100 | M3 | ||||||
| [96] | [96] | |||||||
| ATCC 24066 | 100 | M3 | ||||||
| [95] | [95] | |||||||
| ATCC 32269 | 100 | M3 | ||||||
| [92] | [92] | |||||||
| ATCC 34878 | 100 | M3 | ||||||
| [90] | [90] | |||||||
| 409 | 100 | M3 | ||||||
| [94] | [94] | |||||||
| 184 | 100 | M3 | ||||||
| [96] | [96] | |||||||
| 18 | 100 | M3 | ||||||
| [94] | [94] | |||||||
| Chem8 | ||||||||
| D24067 | 79 | 21 | M3>M4 | |||||
| [79] | [17] | [96] | ||||||
| 298Warty | 72 | 28 | M3>M4 | |||||
| [87] | [14] | [101] | ||||||
| ATCC 34880 | 65 | 35 | M3>M4 | |||||
| [69] | [35] | [104] | ||||||
| 298 | 48 | 52 | M3>M4 | |||||
| [49] | [55] | [104] | ||||||
| 34 | 33 | 67 | M3>M4 | |||||
| [32] | [60] | [92] | ||||||
| C24066T | 100 | M4 | ||||||
| [60] | [30] | [90] |
Values are percentages. For each GXM file, values on the first line are the PeakFit results normalized to 100%; values on the second line are obtained directly from the neural network analysis of the SRG region of the proton NMR spectrum and are enclosed in brackets.
M1>M2, the area of M1 is greater than the area of M2. See Results, “Order of preference for entering SRG data in Table 3.”
Quantitation of SRGs: PeakFit.
The original proton NMR data for the SRG region were analyzed by using PeakFit as described in Materials and Methods. The PeakFit analysis using the FELIX ASCII file generated from the primary proton NMR data for the SRG region recorded for the GXM from C. neoformans isolate 150 is given in Fig. 5. The area for each identifiable resonance appearing in the proton NMR spectrum (Fig. 4) was assigned to a particular SRG based on its characteristic proton chemical shifts, identified as described above (Table 2). The area data depicted in Fig. 5 were used to calculate the percent occurrence of the SRGs present in the GXM from C. neoformans isolate 150 (Table 3). The analysis was repeated for all the GXMs available, and the results were tabulated (Table 3). The PeakFit data were normalized to 100%.
FIG. 5.

PeakFit analysis of the SRG region of the 1D proton NMR spectrum of C. neoformans isolate 150.
Order of preferences for entering SRG data in Table 3.
The PeakFit data were used to determine the order of preference for entering the quantitative distribution of the SRGs in Table 3. The first order of preference was the identification of SRG M1. The data were entered in descending order of area assigned to SRG M1. When SRGs M5 and M6 were also present, they were listed without regard to their quantitative appearance in the GXM. M5 and M6 were not used in determining the order of preference here or in later entries, even in those few cases where one of them was present as the primary component, and this data set was defined as chemotype 1 (Chem1) (Table 3). The data for the ensuing set of entries were selected based on the concurrent appearance of M1 and M2, with the relative area of M1 determining the order of preference (Table 3). This data set was defined as Chem2 (Table 3). The third order of preference was based on the concurrent appearance of M1, M2, and M3, with the relative area of M1 determining the order of entry. This data set was defined as Chem3 (Table 3). The fourth order of preference was based on the sole appearance of M2, and this data set was defined as Chem4 (Table 3). The fifth order of preference was based on the appearance of M2 and M3, with the relative area of M2 determining the order of entry, and this data set was defined as Chem5 (Table 3). The sixth order of preference was based on the appearance of M2, M3, and M4, with the relative area of M2 determining the order of entry. Only two GXMs met these criteria, and this data set was defined as Chem6 (Table 3). The seventh order of preference was based on the appearance of M3, and this data set was defined as Chem7 (Table 3). The eighth, and final, order of preference was based on the appearance of M3 and M4, and this set of data was defined as Chem8 (Table 3). The one archetypal isolate containing M4 only was included in this group.
Quantitation of SRGs: ANN model.
Several specific ANN models of the feed-forward multistaged backpropagation type were considered (53). The architectures of these models differ in the number of hidden neurons, the complexity of input patterns, and the formulation of the output. The performances of several models were investigated to determine the one most suited for our study. Parameters such as hidden layer size, step size, etc. (53) were optimized experimentally. Fifty different networks were trained in order to determine the optimum parameters. The optimum network consisted of 1,000 input neurons, 5 hidden neurons, and 6 output neurons. A step size of 0.01 was used without a momentum term (53). The 1,000 input neurons covered a small portion of the 1D proton spectrum between 5.0 and 5.5 ppm, representing the mannose anomeric region (SRG). The results of the ANN analysis were tabulated and appear in Table 3 in brackets.
Chemotype distribution.
The distribution of the eight suggested chemotypes (Chem1 through Chem8) in the 106 isolates of C. neoformans investigated in this study is summarized in Table 4.
TABLE 4.
Suggested chemotypes of C. neoformans based on the SRG concept
| SRG class | Other SRGs | No. | Chemotype |
|---|---|---|---|
| M1 | M6 or M5 and M6 | 33 | Chem1 |
| M1/M2 | M6 or M5 and M6 | 8 | Chem2 |
| M1/M2/M3 | M6 or M5 and M6 or none | 8 | Chem3 |
| M2 | M6 | 10 | Chem4 |
| M2/M3 | None or few M6 | 26 | Chem5 |
| M2/M3/M4 | None | 2 | Chem6 |
| M3 | None | 13 | Chem7 |
| M3/M4 or M4 | None | 6 | Chem8 |
DISCUSSION
Latex agglutination tests and enzyme immunoassays for the detection of GXM in cerebral spinal fluid and serum, and polyclonal and monoclonal antibodies for serotyping, have been used for diagnostic and epidemiological studies (44). The detection of antigen is diagnostic for infection by C. neoformans. The continued presence of high antigen levels indicates a poor prognosis for the patient, whereas antigen clearance is indicative of a successful course of treatment (34). The complete eradication of the organism by current treatment regimens is unlikely, and relapse usually occurs. Comparative investigations of the immunochemistry, immunology, and genetics of C. neoformans are intimately linked to GXM. In turn, the results of these investigations are intrinsically related to the chemical structure of GXM at the residue level. The correlation between virulence, the course of the disease, the severity of the disease, and the chemical structure of GXM has not been studied. The recognition of the importance of GXM structure served as the driving force for this study.
Currently, C. neoformans serotypes cannot be further subdivided because the available serological reagents do not have the discriminating power required to recognize structural variation in GXMs (38). This phenomenon is due to the fact that although O-acetyl is only a minor contributor to the epitope structure, it is a major determinant of the observed serological activity; de-O-acetylated GXMs do not react with serotype-specific factor sera (15, 16, 18). Therefore, the principal variations in structure, which are based on the disposition of the sugar residues in GXM, are not detected. This lack of a strain-typing method has prevented the demonstration of point sources of infection that is required for epidemiological investigations of cryptococcosis (38). Bhattacharjee et al. (18) suggested the occurrence of four discrete model structures, one for each of the serologically defined types shown in Fig. 2 as M1 through M4, and implied that heterogeneity may exist between isolates. Heterogeneity, real or perceived, may be due to the usual pitfalls encountered in the study of complex polysaccharides by classical methods of structural analysis used in earlier studies (such as incomplete acid hydrolysis, differential loss of certain residues over others, low yields by partial acid hydrolysis, and incomplete methylation).
NMR spectroscopy, a nondestructive, highly discriminating analytical method, was used by us to probe the fine structure of de-O-acetylated polysaccharides. No secondary chemical reactions, hydrolysis, or derivatization was required. In a series of in-depth studies, we demonstrated that heterogeneity in GXM structure is the norm. NMR analysis identified sequences originally relegated to one serotype in other types. Structures thought to occur in only one variety were commonly found in the other variety. In addition, two other triads, M5 and M6, were identified, and their structures were characterized by NMR spectroscopy. The six triads, M1 through M6 (Fig. 2), were used as a set of SRGs to develop the chemotyping system. The proton NMR spectra obtained for de-O-acetylated GXMs were resolution enhanced in order to determine precisely the chemical shifts present in a GXM. The chemical-shift data were used to identify which SRGs were present in a particular GXM by comparison to the assignments found in Table 2. Analysis of the SRG region of the original proton NMR spectrum was repeated by using PeakFit. The PeakFit analysis was used to quantify the distribution of SRGs present in a particular GXM. A large selection of GXMs was used to create a database for 106 GXMs (Table 3).
The SRG data formed a pattern of eight clusters based on the preferences used to generate Table 3. Chem1 (33 isolates [Table 4]) was determined by the presence of the SRG M1. M1 in Chem1 was almost always found associated with M6 or with M6 and M5. M5 never occurred alone or without M1 in any GXM. Chem2 (eight isolates [Table 4]) was determined by the concurrent presence of SRGs M1 and M2. Chem2 isolates were always associated with M6 or with M5 and M6. Chem3 (eight isolates [Table 4]) was determined by the concurrent presence of SRGs M1, M2, and M3. Chem3 isolates were associated with M6 in two cases and with M5 and M6 in one case; in one instance, M5 and M6 were absent. Chem4 (10 isolates [Table 4]) was determined solely by the presence of M2. In the Chem4 isolates, M6 was found associated with half the isolates and M5 was never detected. Chem5 (26 isolates [Table 4]) was determined by the presence of M2 and M3. Only four isolates in Chem5 were found associated with M6; M5 was never found. Chem6 (two isolates [Table 4]) was characterized by the concurrent presence of M2, M3, and M4; M5 and M6 were absent. Chem7 (13 isolates [Table 4]) was determined by the presence of M3; M5 and M6 were absent. This chemotype consisted of the largest structurally homogeneous set of isolates. Chem8 (6 isolates [Table 4]) was determined by the presence of M3 and M4; M5 and M6 were absent. One of the isolates was an M4 archetype isolate but was included in this chemotype. The data in Table 3 demonstrated that a continuum of SRGs characterized the GXMs of C. neoformans. A blurred demarcation between the structural elements previously assigned specifically to one or the other of the two varieties of C. neoformans (varieties neoformans and gattii) is apparent. As the degree of substitution of the core structure with Xyl increased, a concomitant decrease in the occurrence of SRGs M5 and M6 was observed. The identification of GXM archetype isolates was the exception rather than the rule. The 10 isolates in Chem7 that consisted of SRG M3 only were exceptional. However, M3 was frequently associated with Chem3, Chem5, Chem6, and Chem7.
Both the test set and the learning set of NMR data files, which were analyzed previously by PeakFit, were used to evaluate the trained neural network. The quantitative distribution of the SRGs obtained by the neural network (data in brackets) was compared to the data obtained by PeakFit (Table 3). At present there is not an absolute correspondence between the data obtained by PeakFit and those obtained by the neural network. In fact, a comparatively large percentage of M6 triad was retrieved when we performed a validation test of the ANN with a series of GXMs that essentially comprised only M1 triads (24067 isolates) (Tables 1 and 3). This phenomenon may be due to the overlap of M6b resonance with the degenerate M2b,c resonances (Table 2). Therefore, we know that training needs to be modified in order to remove any remaining ambiguity in the output data obtained by the present ANN.
The results of the standard backpropagation model for the ANN are not shown in Table 3 because of the large deviation of the sum of the ratios for the SRGs from the target of 100%. The sum of the ratios reported by the modified backpropagation model also diverged from the desired 100% value. But this divergence was much less than that observed for the standard backpropagation model. Although the ratios listed in Table 3 for the PeakFit analyses sum to 100%, this was accomplished by the manual scaling of the initial results. We believe that the small amount of residual chemical noise and resonance overlap present in the spectra affects the results of all mathematical analyses of the data.
An advantage of the ANN’s analysis of this type of data is that it can be shown mathematically that the further the sums of the ratios diverge from 100%, the less confidence one should place in the results (30). Therefore, a confidence index can be computed for each output. We did not scale the ANN output data algebraically to give a sum of the ratios equal to 100% because we believe that the observed divergence carries important information that could indicate the presence of contaminants and other possible artifacts.
In the future, we will refine the neural network by increasing the size of the learning set and by using NMR data from several archetypal isolates of C. neoformans that produce GXMs with a single mannosyl triad in the SRG region of the spectra. We will also conduct experiments using larger segments of the spectrum as input data for the ANN in an attempt to increase the accuracy of the results. We plan to test the accuracy of the trained ANN by using archetype GXMs to prepare synthetic mixtures that contain predetermined ratios of the various SRGs.
The correlation of chemotype, based on the distribution of SRGs, with serotype was not possible because the O-acetyl substituent is instrumental in determining the structure of the epitope reactive with serological reagents. The GXM of 24066Tan is composed of M4 only and has no detectable acetyl substitution. Therefore, we can conclude that M3 acetylation fixed the conformation of M3 to produce the same epitope structure created by O-4 substitution in M4.
The chemotyping system and the identification of subtypes within each chemotype, based on the quantitative distribution of the SRGs, could lead to (i) a better understanding of how the polysaccharide antigens influence type 1 and type 2 T-cell responses, (ii) a better understanding of how the polysaccharides potentiate opportunistic infections in HIV-infected patients, (iii) the design of effective haptens for the preparation of neoglycoconjugate vaccines, (iv) a better understanding of how virulence is related to molecular structure, (v) the development of a computer-assisted automated system for the chemotyping of C. neoformans isolates and for the monitoring of phenotype switching, (vi) the development of a new epidemiological tool for the surveillance of cryptococcosis, and (vii) a possible explanation of the variation in antigen titer determined by common diagnostic tests.
ACKNOWLEDGMENTS
This research was supported in part by Public Health Service grant AI-31769 from the National Institutes of Health. The NMR spectrometers were purchased with the help of the National Science Foundation and the Georgia Research Alliance.
REFERENCES
- 1.Akay M. Noninvasive diagnosis of coronary artery disease using a neural network algorithm. Biol Cybern. 1992;67:361–367. doi: 10.1007/BF02414891. [DOI] [PubMed] [Google Scholar]
- 2.Alpsan D. Proceedings of IEEE International Conference on Neural Networks, Orlando, Fla. New York, N.Y: IEEE Neural Network Council; 1994. Auditory evoked potential classification by unsupervised ART 2-A and supervised fuzzy ARTMAP networks; pp. 3512–3515. [Google Scholar]
- 3.Andrea T A, Kalayeh H. Applications of neural networks: quantitative structure-activity relationships of dihydrofolate reductase inhibitors. J Med Chem. 1991;34:2824–2836. doi: 10.1021/jm00113a022. [DOI] [PubMed] [Google Scholar]
- 4.Andreassen H, Bohr H, Bohr J, Brunak S, Bugge T, Cotterill R M J, Jacobsen C, Kusk P, Lautrap B. Analysis of secondary structure of the human immunodeficiency virus proteins by computer modelling based on neural network methods. J Acquired Immune Defic Syndr. 1990;3:615–622. [PubMed] [Google Scholar]
- 5.Apolloni B, Avanzini G, Cesa-Bianchi N, Ronchini G. Proceedings of the 1990 International Joint Conference on Neural Networks. Vol. 2. 1990. Diagnosis of epilepsy via backpropagation; pp. 571–574. [Google Scholar]
- 6.Armentrout S L, Reggia J A, Weinrich M. A neural model of cortical map reorganization following a focal lesion. Artif Intellig Med. 1994;6:383–400. doi: 10.1016/0933-3657(94)90003-5. [DOI] [PubMed] [Google Scholar]
- 7.Asada N, Doi K, MacMahon H, Montner S M, Giger M L, Abe C, Wu Y Z. Potential usefulness of an artificial neural network for differential diagnosis of interstitial lung disease: pilot study. Radiology. 1990;177:857–860. doi: 10.1148/radiology.177.3.2244001. [DOI] [PubMed] [Google Scholar]
- 8.Astion M L, Wilding P. The application of backpropagation neural networks to problems in pathology and laboratory medicine. Arch Pathol Lab Med. 1992;116:995–1001. [PubMed] [Google Scholar]
- 9.Astion M L, Wilding P. Application of neural networks to the interpretation of laboratory data in cancer diagnosis. Clin Chem. 1992;38:34–38. [PubMed] [Google Scholar]
- 10.Avanzolini G, Barbini P, Gnudi G. Unsupervised learning and discriminant analysis applied to identification of high risk postoperative cardiac patients. Int J Bio-Med Comput. 1990;25:207–221. doi: 10.1016/0020-7101(90)90010-r. [DOI] [PubMed] [Google Scholar]
- 11.Bacon B E, Cherniak R. Structure of the O-deacetylated glucuronoxylomannan from Cryptococcus neoformans serotype C as determined by 2D 1H NMR spectroscopy. Carbohydr Res. 1995;276:365–386. doi: 10.1016/0008-6215(95)00167-r. [DOI] [PubMed] [Google Scholar]
- 12.Bacon B E, Cherniak R, Kwon-Chung K J, Jacobson E S. Structure of the O-deacetylated glucuronoxylomannan from Cryptococcus neoformans Cap70 as determined by 2D 1H NMR spectroscopy. Carbohydr Res. 1996;283:95–110. doi: 10.1016/0008-6215(95)00397-5. [DOI] [PubMed] [Google Scholar]
- 13.Barski L L, Gaborski R S, Anderson P G. A neural network approach to the histogram segmentation of digital radiographic images. In: Dagli C H, Burke L I, Fernandez B R, Ghosh J, editors. Intelligent engineering systems through artificial neural networks. Proceedings of the Artificial Neural Networks in Engineering Conference. Vol. 3. New York, N.Y: ASME Press; 1993. pp. 375–380. [Google Scholar]
- 14.Baxt W G. Use of an artificial neural network for data analysis in clinical decision-making: the diagnosis of acute coronary occlusion. Neural Comput. 1990;2:480–489. [Google Scholar]
- 15.Belay T, Cherniak R. Determination of antigen binding specificities of Cryptococcus neoformans factor sera by enzyme-linked immunosorbent assay. Infect Immun. 1995;63:1810–1819. doi: 10.1128/iai.63.5.1810-1819.1995. [DOI] [PMC free article] [PubMed] [Google Scholar]
- 16.Belay T, Cherniak R, O’Neill E B, Kozel T R. Serotyping of Cryptococcus neoformans by dot enzyme assay. J Clin Microbiol. 1996;34:466–470. doi: 10.1128/jcm.34.2.466-470.1996. [DOI] [PMC free article] [PubMed] [Google Scholar]
- 17.Belay T, Cherniak R, Kozel T R, Casadevall A. Reactivity patterns and epitope specificities of anti-Cryptococcus neoformans monoclonal antibodies by enzyme-linked immunosorbent assay and by dot enzyme assay. Infect Immun. 1997;65:718–728. doi: 10.1128/iai.65.2.718-728.1997. [DOI] [PMC free article] [PubMed] [Google Scholar]
- 18.Bhattacharjee A K, Bennett J E, Glaudemans C P J. Capsular polysaccharides of Cryptococcus neoformans. Rev Infect Dis. 1984;6:619–624. doi: 10.1093/clinids/6.5.619. [DOI] [PubMed] [Google Scholar]
- 19.Bottone E J, Salkin I F, Hurd N J, Wormser G P. Serogroup distribution of Cryptococcus neoformans in patients with AIDS. J Infect Dis. 1987;156:242. doi: 10.1093/infdis/156.1.242. [DOI] [PubMed] [Google Scholar]
- 20.Bulmer G S, Sans M D. Cryptococcus neoformans. III. Inhibition of phagocytosis. J Bacteriol. 1968;95:5–8. doi: 10.1128/jb.95.1.5-8.1968. [DOI] [PMC free article] [PubMed] [Google Scholar]
- 21.Chaka W, Verheul A F M, Vaishnav V V, Cherniak R, Scharringa J, Verhoef J, Snippe H, Hoepelman I M. Cryptococcus neoformans and cryptococcal glucuronoxylomannan, galactoxylomannan, and mannoprotein induce different levels of tumor necrosis factor alpha in human peripheral blood mononuclear cells. Infect Immun. 1997;65:272–278. doi: 10.1128/iai.65.1.272-278.1997. [DOI] [PMC free article] [PubMed] [Google Scholar]
- 22.Cherniak R, Morris L C, Anderson B C, Meyer S A. Facilitated isolation, purification, and analysis of glucuronoxylomannan of Cryptococcus neoformans. Infect Immun. 1991;59:59–64. doi: 10.1128/iai.59.1.59-64.1991. [DOI] [PMC free article] [PubMed] [Google Scholar]
- 23.Cherniak R, Morris L C, Meyer S A, Mitchell T B. Glucuronoxylomannan of Cryptococcus neoformans obtained from patients with AIDS. Carbohydr Res. 1992;249:405–413. doi: 10.1016/0008-6215(93)84104-e. [DOI] [PubMed] [Google Scholar]
- 24.Cherniak R, Morris L C, Meyer S A. Glucuronoxylomannan of Cryptococcus neoformans serotype C: structural analysis by gas-liquid chromatography-mass spectrometry and by 13C nuclear magnetic resonance spectroscopy. Carbohydr Res. 1992;225:331–337. doi: 10.1016/s0008-6215(00)90505-6. [DOI] [PubMed] [Google Scholar]
- 25.Coker R J. Cryptococcal infection in AIDS. Int J Sex Transm Dis AIDS. 1992;3:168–172. doi: 10.1177/095646249200300303. [DOI] [PubMed] [Google Scholar]
- 26.Diamond R D. Cryptococcus neoformans. In: Mandell G L, Bennett J E, Douglas R G Jr, editors. Principles and practice of infectious diseases. New York, N.Y: Churchill Livingstone; 1995. pp. 2331–2340. [Google Scholar]
- 27.Dismukes W E. Cryptococcal meningitis in patients with AIDS. J Infect Dis. 1988;157:624–628. doi: 10.1093/infdis/157.4.624. [DOI] [PubMed] [Google Scholar]
- 28.Dong Z M, Murphy J W. Intravascular cryptococcal culture filtrate (CneF) and its major component, glucuronoxylomannan, are potent inhibitors of leukocyte accumulation. Infect Immun. 1995;63:770–778. doi: 10.1128/iai.63.3.770-778.1995. [DOI] [PMC free article] [PubMed] [Google Scholar]
- 29.Echauz J, Vachtsevanos G. Proceedings of the IEEE Electro/94 International Conference. 1994. Neural network detection of antiepileptic drugs from a single EEG trace; pp. 346–351. [Google Scholar]
- 30.Ersoy O K, Hong D. Parallel, self-organizing, hierarchical neural networks. IEEE Trans Neural Netw. 1990;1:167–178. doi: 10.1109/72.80229. [DOI] [PubMed] [Google Scholar]
- 31.Evans E E. The antigenic composition of Cryptococcus neoformans. 1. A serologic classification by means of the capsular and agglutination reactions. J Immunol. 1950;64:423–430. [PubMed] [Google Scholar]
- 32.Fromtling R A, Shadomy H J, Jacobson E S. Decreased virulence in stable, acapsular mutants of Cryptococcus neoformans. Mycopathologia. 1982;79:23–29. doi: 10.1007/BF00636177. [DOI] [PubMed] [Google Scholar]
- 33.Ikeda R, Shinoda T, Fukazawa Y, Kaufman L. Antigenic characterization of Cryptococcus neoformans serotypes and its application to serotyping of clinical isolates. J Clin Microbiol. 1982;16:22–29. doi: 10.1128/jcm.16.1.22-29.1982. [DOI] [PMC free article] [PubMed] [Google Scholar]
- 34.Kaufman L, Reiss E. Serodiagnosis of fungal diseases. In: Rose N R, de Macario E C, Fahey J L, Friedman H, Penn G M, editors. Manual of clinical laboratory immunology. 4th ed. Washington, D.C: American Society for Microbiology; 1992. pp. 507–528. [Google Scholar]
- 35.Kovacs J A, Kovacs A A, Polis M, Wright W C, Gill V J, Tuazon C U, Gelmann E P, Lane H C, Longfield R, Overturf G, Macher A M, Fauci A S, Parrillo J E, Bennett J E, Masur H. Cryptococcosis in the acquired immunodeficiency syndrome. Ann Intern Med. 1985;103:533–538. doi: 10.7326/0003-4819-103-4-533. [DOI] [PubMed] [Google Scholar]
- 36.Kozel T R, Gotschlich E C. The capsule of Cryptococcus neoformans passively inhibits phagocytosis of the yeast macrophages. J Immunol. 1982;129:1675–1680. [PubMed] [Google Scholar]
- 37.Kozel T R, Gulley W F, Cazin J., Jr Immune response to Cryptococcus neoformans soluble polysaccharide: immunological unresponsiveness. Infect Immun. 1977;18:701–707. doi: 10.1128/iai.18.3.701-707.1977. [DOI] [PMC free article] [PubMed] [Google Scholar]
- 38.Kwon-Chung K-J, Bennett J E. Medical mycology. Malvern, Pa: Lea and Febiger; 1992. pp. 397–446. [Google Scholar]
- 39.Kwon-Chung K J, Polacheck I, Bennett J E. Improved diagnostic medium for separation of Cryptococcus neoformans var. neoformans (serotypes A and D) and Cryptococcus neoformans var. gattii (serotypes B and C) J Clin Microbiol. 1982;15:535–537. doi: 10.1128/jcm.15.3.535-537.1982. [DOI] [PMC free article] [PubMed] [Google Scholar]
- 40.Kwong-Chung K J, Varma A, Howard D H. Ecology of Cryptococcus neoformans and prevalence of its two varieties in AIDS and non-AIDS associated cryptococcosis. In: Bossche H V, Mackenzie D W R, editors. Mycoses in AIDS patients. New York, N.Y: Plenum Press; 1990. pp. 103–113. [Google Scholar]
- 41.Levitz S M. The ecology of Cryptococcus neoformans and the epidemiology of cryptococcosis. Rev Infect Dis. 1991;13:1163–1169. doi: 10.1093/clinids/13.6.1163. [DOI] [PubMed] [Google Scholar]
- 42.Levitz S M, Tabuni A, Kornfeld H, Reardon C C, Golenbock D T. Production of tumor necrosis factor alpha in human leukocytes stimulated by Cryptococcus neoformans. Infect Immun. 1994;62:1975–1981. doi: 10.1128/iai.62.5.1975-1981.1994. [DOI] [PMC free article] [PubMed] [Google Scholar]
- 43.Meyer B, Hansen T, Nute D, Albersheim P, Darvill A, York W, Sellers J. Identification of the 1H-NMR spectra of complex oligosaccharides with artificial neural networks. Science. 1991;251:542–544. doi: 10.1126/science.1990429. [DOI] [PubMed] [Google Scholar]
- 44.Mitchell T G, Perfect J R. Cryptococcosis in the era of AIDS—100 years after the discovery of Cryptococcus neoformans. Clin Microbiol Rev. 1995;8:515–548. doi: 10.1128/cmr.8.4.515. [DOI] [PMC free article] [PubMed] [Google Scholar]
- 45.Murphy J W. Immunoregulation in cryptococcosis. In: Kurstak E, editor. Immunology of fungal infections. New York, N.Y: Marcel Dekker, Inc.; 1989. pp. 319–344. [Google Scholar]
- 46.Orendi J M, Nottet H S L M, Visser M, Verheul A F M, Snippe H, Verhoef J. Enhancement of HIV-1 replication in peripheral blood mononuclear cells by Cryptococcus neoformans is monocyte-dependent but tumor necrosis factor-independent. AIDS. 1994;8:423–429. doi: 10.1097/00002030-199404000-00003. [DOI] [PubMed] [Google Scholar]
- 47.Pettoello-Mantovani M, Casadevall A, Kollmann T R, Rubinstein A, Goldstein H. Enhancement of HIV-1 infection by the capsular polysaccharide of Cryptococcus neoformans. Lancet. 1992;339:21–23. doi: 10.1016/0140-6736(92)90142-p. [DOI] [PubMed] [Google Scholar]
- 48.Pinner R W, Hajjeh R A, Powderly W G. Prospects for preventing cryptococcosis in persons infected with human immunodeficiency virus. Clin Infect Dis. 1995;21:S103–S107. doi: 10.1093/clinids/21.supplement_1.s103. [DOI] [PubMed] [Google Scholar]
- 49.Powell D A, Turula V, de Haseth J A, van Halbeek H, Meyer B. Sulfate detection in glycoprotein-derived oligosaccharides by artificial neural network analysis of Fourier-transform infrared spectra. Anal Biochem. 1994;220:20–27. doi: 10.1006/abio.1994.1293. [DOI] [PubMed] [Google Scholar]
- 50.Radomski J P, van Halbeek H, Meyer B. Neural network-based recognition of oligosaccharide 1H-NMR spectra. Nat Struct Biol. 1994;1:217–218. doi: 10.1038/nsb0494-217. [DOI] [PubMed] [Google Scholar]
- 51.Rinaldi M G, Drutz D J, Howell A, Sande M A, Wofsy C B, Hadley W K. Serotypes of Cryptococcus neoformans in patients with AIDS. J Infect Dis. 1986;153:642. doi: 10.1093/infdis/153.3.642. [DOI] [PubMed] [Google Scholar]
- 52.Rippon J W. Medical mycology: the pathogenic fungi and the pathogenic actinomycetes. 3rd ed. Philadelphia, Pa: W. B. Saunders Co.; 1988. pp. 582–609. [Google Scholar]
- 53.Rumelhart D E, McClelland J L. Parallel distributed processing: explorations in the microstructure of cognition. 1 and 2. Cambridge, Mass: MIT Press; 1987. [DOI] [PubMed] [Google Scholar]
- 54.Sellers J, York W, Albersheim P, Darvill A, Meyer B. Identification of the mass spectra of partially methylated alditol acetates by artificial neural networks. Carbohydr Res. 1990;207:C1–C5. [Google Scholar]
- 55.Shadmehr R, D’Argenio D Z. A neural network for nonlinear Bayesian estimation in drug therapy. Neural Comput. 1990;2:216–225. [Google Scholar]
- 56.Sheng S, Cherniak R. Structure of the 13C-enriched O-deacetylated glucuronoxylomannan of Cryptococcus neoformans serotype A determined by NMR spectroscopy. Carbohydr Res. 1997;301:33–40. doi: 10.1016/s0008-6215(97)00084-0. [DOI] [PubMed] [Google Scholar]
- 57.Shimizu R Y, Howard D H, Clancy M N. The variety of Cryptococcus neoformans in patients with AIDS. J Infect Dis. 1986;154:1042. doi: 10.1093/infdis/154.6.1042. [DOI] [PubMed] [Google Scholar]
- 58.Skelton M A, van Halbeek H, Cherniak R. Complete assignment of the 1H and 13C-NMR spectra of the de-O-acetylated glucuronoxylomannan from Cryptococcus neoformans serotype B. Carbohydr Res. 1991;221:259–268. doi: 10.1016/0008-6215(91)80062-r. [DOI] [PubMed] [Google Scholar]
- 59.Skelton M A, Cherniak R, Poppe L, van Halbeek H. Structure of the de-O-acetylated glucuronoxylomannan from Cryptococcus neoformans serotype D, as determined by 2D NMR spectroscopy. Magn Reson Chem. 1991;29:786–793. [Google Scholar]
- 60.Sundstrom J B, Cherniak R. Polysaccharide antigens of the capsule of Cryptococcus neoformans. Infect Immun. 1994;62:1507–1512. doi: 10.1128/iai.62.5.1507-1512.1994. [DOI] [PMC free article] [PubMed] [Google Scholar]
- 61.Thomsen J, Meyer B. Pattern recognition of 1H NMR spectra of sugar alditols using a neural network. J Magn Reson. 1989;84:212–217. [Google Scholar]
- 62.Turner S H, Cherniak R, Reiss E, Kwon-Chung K J. Structural variability in the glucuronoxylomannan of Cryptococcus neoformans serotype A isolates determined by 13C NMR spectroscopy. Carbohydr Res. 1992;233:205–218. doi: 10.1016/s0008-6215(00)90932-7. [DOI] [PubMed] [Google Scholar]
- 63.Turner S H, Cherniak R. Multiplicity in the structure of the glucuronoxylomannan of Cryptococcus neoformans. NATO ASI (Adv Sci Inst) Ser Ser H. 1991;53:123–142. [Google Scholar]
- 64.Valafar F, Valafar H, Ersoy O K, Schwartz R J. Proceedings of the International Conference on Neural Networks. Vol. 4. 1995. Comparative studies of two neural network architectures for modeling of human speech production; pp. 2056–2059. [Google Scholar]
- 65.van Halbeek H. Structural analysis of the carbohydrate chains of mucin-type glycoproteins by high-resolution 1H-NMR spectroscopy. Biochem Soc Trans. 1984;12:601–605. doi: 10.1042/bst0120601. [DOI] [PubMed] [Google Scholar]
- 66.Vliegenthart J F G, Dorland L, van Halbeek H. High-resolution 1H-nuclear magnetic resonance spectroscopy as a tool in the structural analysis of carbohydrates related to glycoproteins. Adv Carbohydr Chem Biochem. 1983;41:209–374. [Google Scholar]
- 67.Welisk R M, Starcher E T, Curran J W. Opportunistic disease reported in AIDS patients: frequencies, associations and trends. AIDS. 1987;1:175–182. [PubMed] [Google Scholar]
- 68.Wilson D E, Bennett J E, Bailey J W. Serologic grouping of Cryptococcus neoformans. Proc Soc Exp Biol Med. 1968;127:820–823. doi: 10.3181/00379727-127-32812. [DOI] [PubMed] [Google Scholar]