

Abstract
Objective:
To determine whether the risks of infectious mononucleosis (IM) and serious IM outcomes are changing over time.
Patients and Methods:
Individuals with a diagnosis of IM and hospitalizations due to IM were identified among persons residing in an Upper Midwest region between January 1, 2010, and December 31, 2021, using the Rochester Epidemiology Project. Infectious mononucleosis rates were calculated assuming the entire population between 2010 and 2021 was at risk, and IM-associated hospitalization rates were calculated among everyone with a diagnosis of IM. Poisson regression was used to test trends and estimate incidence and hospitalization rate ratios.
Results:
We identified 5334 individuals with IM; the overall IM rate was 60.60 per 100,000 person-years (95% CI, 58.98 to 62.25). Rates were highest in females, individuals of White race, those with non-Hispanic ethnicity, and individuals 15 to 19 years old (all P<.05). Infectious mononucleosis rates decreased significantly over time among all age groups (all tests for trend, P<.05). Overall, 234 individuals (4.3%) were hospitalized with IM (43.87 per 1000 persons with IM; 95% CI, 38.43 to 49.87), and hospitalization rates among those with IM increased over time (test for trend, P<.05). Individuals younger than 10 years, those 20 years or older, and individuals of Hispanic ethnicity had increased risk for IM-associated hospitalization (all adjusted P<.05).
Conclusion:
Although rates of IM diagnosis have decreased over time, risk of hospitalization in individuals with IM has increased. Age and ethnicity increase the risk of hospitalization due to IM.
Infectious mononucleosis (IM) is an infectious disease most commonly caused by Epstein-Barr virus (EBV).1 In children younger than 10 years, EBV infection may result in a transient, subclinical illness with mild, nonspecific symptoms that resolve undiagnosed.2 By contrast, IM typically presents in adolescents with acute symptoms, including transient sore throat and other upper respiratory tract symptoms, as well as fatigue and cervical lymphadenopathy, which might persist for months after the initial infection.3,4 These symptoms may cause a substantial amount of time lost from work and school. For example, persons diagnosed with IM in Germany required an average of 20 days of sick leave around the time of their IM diagnosis.5 Infectious mononucleosis has also been associated with serious short-term outcomes, such as splenic rupture and meningoencephalitis.6
It is estimated that the incidence of IM ranges from 42 to 104 per 100,000 persons, with the highest rates observed in adolescents and young adults.7–12 Data on the seroprevalence of EBV infection suggest that the age at primary infection is increasing, at least in industrialized countries, which may increase both the incidence of IM and the risk of serious IM outcomes.3,13–15 In support of this observation, results of studies in Israel and Scotland suggest that overall rates of IM are decreasing over time.8,10 However, recent data in US populations, including from the era of the SARS-CoV-2 pandemic, are not available.
Contemporary, population-based data are needed to understand whether the risks and serious outcomes of IM are changing over time. To address these questions, we studied the incidence of IM and hospitalizations because of IM between 2010 and 2021 in a population-based sample of persons who resided in a 27-county Upper Midwest region of the United States.
PATIENTS AND METHODS
Data Source
We used the resources of the Rochester Epidemiology Project (REP) to identify cases of IM in persons who resided in an Upper Midwest region between January 1, 2010, and December 31, 2021. The REP has been described previously.16,17 Briefly, the REP includes linked medical records from local health care facilities for persons who have lived in a 27-county region of southeastern Minnesota and west central Wisconsin since 2010. Health care data from all visits to each health care facility are coded and indexed electronically, and data are captured for 66% of the population residing in this region. Characteristics of the population are similar to the underlying population and to persons residing in the Upper Midwest in terms of age, sex, and race.16 Briefly, the median age of the REP population is 39.4 years, compared with 38.2 years in the 5-state Upper Midwest region. Similarly, 48.6% of the REP population is male, compared with 49.8% in the Upper Midwest, and 87.6% of the REP population is White, compared with 87.8% in the Upper Midwest region. Overall, 93.5% of the REP population aged 25 years and older have completed high school, and 34.1% hold a bachelor’s degree compared with 91.6% and 29.6%, respectively, of persons residing in the Upper Midwest. This study was approved by the Mayo Clinic Institutional Review Board.
Study Population
We searched the REP electronic indices to identify all persons who had a diagnosis code for IM (International Classification of Diseases [ICD], Ninth Revision [ICD-9] code 075 or ICD, Tenth Revision [ICD-10] code B27) at any time between January 1, 2010, and December 31, 2021. Among this population, we also identified everyone who underwent a monospot test, other EBV antibody test, or genomic test for EBV infection within 30 days before and 30 days after the diagnosis of the IM diagnosis using laboratory test codes specific to the REP health care professionals.
Hospitalizations
The REP indices were searched for all inpatient hospitalizations that occurred within 30 days before to 90 days after the IM diagnosis date. If multiple hospitalizations occurred during that time, the hospitalization with the admission date closest to the date of IM was used for analysis. Hospitalizations with a primary or secondary diagnosis code of IM (ICD-9 075 or ICD-10 B27) were considered associated with the IM episode. Additionally, the primary hospitalization diagnoses were reviewed for all persons who did not have a primary or secondary diagnosis of IM and the medical records were reviewed for cases in which the primary diagnosis could have been related to IM (eg, splenic laceration). These hospitalizations were then classified as IM-related if medical record notes indicated that the health care professionals believed the diagnosis was due to IM or EBV infection.
Statistical Analyses
Infectious mononucleosis cases were defined as the first occurrence of an IM diagnostic code during the study period. Rates of IM were calculated assuming that the entire population residing in the region was at risk for IM. Briefly, the REP includes personal timelines for every person in the REP system based on dates of contact with health care professionals and addresses at the time of the health care contacts (REP Census Personal Timelines).18 The denominators for REP incidence studies use the population counts (people in the REP population on a specific date) as a surrogate for person-years in age-specific groups. Rates of IM were calculated overall, by age group, sex, race (White, Black, Asian, other/mixed), ethnicity (Hispanic, non-Hispanic), county of residence, and year of diagnosis. Calendar-year age-specific population counts were used as the rate denominators. Correlations between county-level incidence rates and percentage of the county considered rural and the percentage of the county below poverty level were assessed using Pearson correlation coefficients. Epstein-Barr virus testing rates increased over time; therefore, rates of EBV-positive IM were calculated by applying rates of positive EBV test results among those tested for each year and level of patient characteristic to the corresponding strata from the overall IM cohort. Trends were tested using Poisson regression, with year modeled continuously; nonlinear trends were tested by including a year2 term. If year2 was significant (with year in the model) or if year was significant (without year2 in the model), we noted in the results that there was a significant trend over time. The year2 term was significant for age groups 0 to 9 years, 30 to 39 years, and 40 years or older (all P<.05).
Possible overdispersion in the Poisson model was addressed by estimating the dispersion parameter as the deviance divided by its degrees of freedom. The standard errors were then multiplied by the dispersion parameter to adjust for any overdispersion in the model. Because the distribution of age was skewed, the Jonckheere-Terpstra test19,20 was used to test for a trend in median age over the study period. Infectious mononucleosis—related hospitalization rates were calculated using the total number of hospitalizations within 90 days after the IM diagnosis as the numerator and the number of IM cases as the denominator. Rate ratios adjusted for age, sex, race, ethnicity, and year of IM diagnosis were estimated using Poisson regression. Analyses were completed using SAS software, version 9.4 (SAS Institute), and P<.05 was considered statistically significant.
RESULTS
Overall, 5337 persons were identified as having at least 1 diagnosis code for IM between January 1, 2010, and December 31, 2021; however, 3 persons were excluded because they lacked address information on the date of the IM diagnosis code. Therefore, the final cohort was 5334 persons. In addition, 3324 (62.3%) persons with an IM diagnosis code had an EBV test within 30 days of the diagnosis date; 3183 results (95.8% among those tested) were positive. Testing for EBV increased over time (43.9% of IM cases were tested in 2010 [257 of 586 patients] and 82.1% in 2021 [224 of 273 patients]; Supplemental Table 1, available online at http://www.mayoclinicproceedings.org), and monospot was the most commonly used test (81.5% [2708 of 3324]; Table 1). Among those tested, positivity was high in all years (90.6% [230 of 254] to 98.1% [365 of 372]; Supplemental Table 1).
TABLE 1.
| Variable | Clinical diagnosis code (N=5334) | Tested for EBV (N=3324) | Results positive for EBV (N=3183) |
|---|---|---|---|
| Sex | |||
| Male | 2338 (43.8) | 1485 (44.7) | 1418 (44.6) |
| Female | 2996 (56.2) | 1839 (55.3) | 1765 (55.5) |
| Median age (y), (IQR) | 18 (16-21) | 18 (16-21) | 18 (16-21) |
| Age group (y) | |||
| 0-9 | 311 (5.8) | 218 (6.6) | 199 (6.3) |
| 10-14 | 512 (9.6) | 325 (9.8) | 302 (9.5) |
| 15-19 | 2607 (48.9) | 1636 (49.2) | 1584 (49.8) |
| 20-24 | 1023 (19.2) | 584 (17.6) | 572 (18.0) |
| 25-29 | 317 (5.9) | 204 (6.1) | 190 (6.0) |
| 30-39 | 271 (5.1) | 173 (5.2) | 164 (5.2) |
| ≥40 | 293 (5.5) | 184 (5.5) | 172 (5.4) |
| Race | |||
| White | 5022 (94.2) | 3116 (93.7) | 2990 (93.9) |
| Black | 96 (1.8) | 59 (1.8) | 55 (1.7) |
| Asian | 37 (0.7) | 25 (0.8) | 22 (0.7) |
| Other/mixed | 129 (2.4) | 100 (3.0) | 92 (2.9) |
| Unknown | 50 (0.9) | 24 (0.7) | 24 (0.8) |
| Ethnicity | |||
| Hispanic | 196 (3.7) | 140 (4.2) | 133 (4.2) |
| Non-Hispanic | 5138 (96.3) | 3184 (95.8) | 3050 (95.8) |
| Type of EBV testc | |||
| Monospot | NA | 2708 (81.5) | 2540 (79.8) |
| EBV antibody test (IgM, IgG, and IgA) | NA | 732 (22.0) | 682 (21.4) |
| EBV genomic test | NA | 189 (5.7) | 125 (3.9) |
EBV, Epstein-Barr virus; IM, infectious mononucleosis; IQR, interquartile range; NA, not applicable.
Data are presented as No. (percentage) of patients unless specified otherwise.
Some patients underwent more than one test.
Characteristics of persons with an IM diagnosis, an EBV test, and an EBV-positive test result are shown in Table 1. More than half the patients with IM were female (2996 of 5334 [56.2%]), and most individuals were White (5022 of 5334 [94.2%]) and non-Hispanic (5138 of 5334 [96.3%]). Characteristics of patients who were tested for EBV and had positive results were similar to those of persons who received a clinical IM diagnosis. The median age of those with IM was 18 years (IQR, 16 to 21 years), and approximately half the cases of IM occurred in persons 15 to 19 years old (2607 of 5334 [48.9%]; Table 1). Across study years, the median age of those with IM increased from 17.0 in 2010 to 19.0 in 2021 (P<.001), with 11.9% (70 of 586) and 20.5% (56 of 273) aged 25 years or older in 2010 and 2021, respectively (data not shown). After excluding the 2020-2021 pandemic years, there was no longer a significant increase in median age during 2010 to 2019 (P=.13).
The overall IM rate based on diagnostic code was 60.60 cases per 100,000 person-years (95% CI, 58.98 to 62.25; Table 2). Infectious mononucleosis rates were significantly higher for females than for males and for the White and non-Hispanic populations than for persons of other races or of Hispanic ethnicity (both P<.001). Rates of IM were lowest in persons aged 40 years or older (6.35 per 100,000 person-years) and highest in persons 15 to 19 years old (481.06 per 100,000 person-years). Incidence rates varied by county of residence (Supplemental Table 2, available online at http://www.mayoclinicproceedings.org), but the correlation between incidence rates and percentage of the county considered rural was not statistically significant (correlation coefficient, 0.25; P=.23). The correlation between incidence rates and the percentage of the county below poverty level was also not statistically significant (correlation coefficient, 0.07; P=.72). The IM rates decreased significantly over time for males and females and among all age groups, races, and ethnicities (all tests for trend, P<.05; Figure). Patients with IM who were also EBV-positive by monospot test followed similar patterns, but declines over time were statistically significant only in persons 0 to 19 years, persons 30 years or older, and in Hispanic persons (tests for trend, P<.05; Supplemental Figure, available online at http://www.mayoclinicproceedings.org).
TABLE 2.
Incidence Rates of IM According to Diagnosis Code, Stratified by Patient Characteristicsa
| Variable | No. of patients | Denominator (person-years) | Incidence rate (95% CI) per 100,000 person-years | Incidence rate ratio (95% CI) | Adjusted incidence rate ratio (95% CI)b |
|---|---|---|---|---|---|
| Overall | 5334 | 8,802,197 | 60.60 (58.98-62.25) | NA | NA |
| Sex | |||||
| Male | 2338 | 4,225,668 | 55.33 (53.11-57.62) | Referent | Referent |
| Female | 2996 | 4,576,529 | 65.46 (63.14-67.85) | 1.18 (1.12-1.25) | 1.22 (1.14-1.30) |
| Age group (y) | |||||
| 0-9 | 311 | 1,031,485 | 30.15 (26.89-33.69) | 4.53 (3.87-5.32) | 5.02 (4.14-6.07) |
| 10-14 | 512 | 527,959 | 96.98 (88.76-105.75) | 14.58 (12.63-16.83) | 6.03 (13.50-19.05) |
| 15-19 | 2607 | 541,927 | 481.06 (464.77-499.89) | 72.34 (64.11-81.62) | 77.12 (66.72-89.14) |
| 20-24 | 1023 | 593,283 | 172.43 (162.02-183.33) | 25.93 (22.77-29.52) | 27.25 (23.32-31.84) |
| 25-29 | 317 | 579,893 | 54.67 (48.81-61.03) | 8.22 (7.01-9.64) | 8.68 (7.18-10.51) |
| 30-39 | 271 | 1,121,743 | 21.71 (21.37-27.21) | 3.63 (3.08-4.29) | 3.89 (3.19-4.74) |
| ≥40 | 293 | 4,405,907 | 6.35 (5.91-7.46) | Referent | Referent |
| Race | |||||
| White | 5022 | 7,753,903 | 64.77 (62.99-66.58) | Referent | Referent |
| Black | 96 | 275,754 | 34.81 (28.20-42.51) | 0.54 (0.44-0.66) | 0.36 (0.29-0.46) |
| Asian | 37 | 216,210 | 17.11 (12.05-23.59) | 0.26 (0.19-0.37) | 0.22 (0.15-0.33) |
| Other/mixed | 129 | 338,121 | 38.15 (31.85-45.33) | 0.59 (0.49-0.70) | 0.44 (0.36-0.55) |
| Unknown | 50 | 218,209 | 22.91 (17.01-30.21) | 0.35 (0.27-0.47) | 0.25 (0.18-0.34) |
| Ethnicity | |||||
| Hispanic | 196 | 448,641 | 43.69 (37.79-50.25) | 0.71 (0.62-0.82) | 0.54 (0.45-0.66) |
| Non-Hispanic | 5138 | 8,353,556 | 61.51 (59.84-63.21) | Referent | Referent |
| Year | |||||
| 2010-2012 | 1830 | 201,806 | 90.68 (86.58-94.93) | Referent | Referent |
| 2013-2015 | 1439 | 2,227,352 | 64.61 (61.31-68.03) | 0.71 (0.66-0.76) | 0.73 (0.67-0.79) |
| 2016-2018 | 1232 | 2,264,797 | 54.40 (51.40-57.52) | 0.60 (0.56-0.64) | 0.63 (0.57-0.68) |
| 2019-2021 | 833 | 2,292,022 | 36.34 (33.92-38.90) | 0.40 (0.37-0.43) | 0.43 (0.39-0.47) |
IM, infectious mononucleosis; NA, not applicable.
Adjusted for sex, age group, race, and year. All P<.001.
FIGURE.
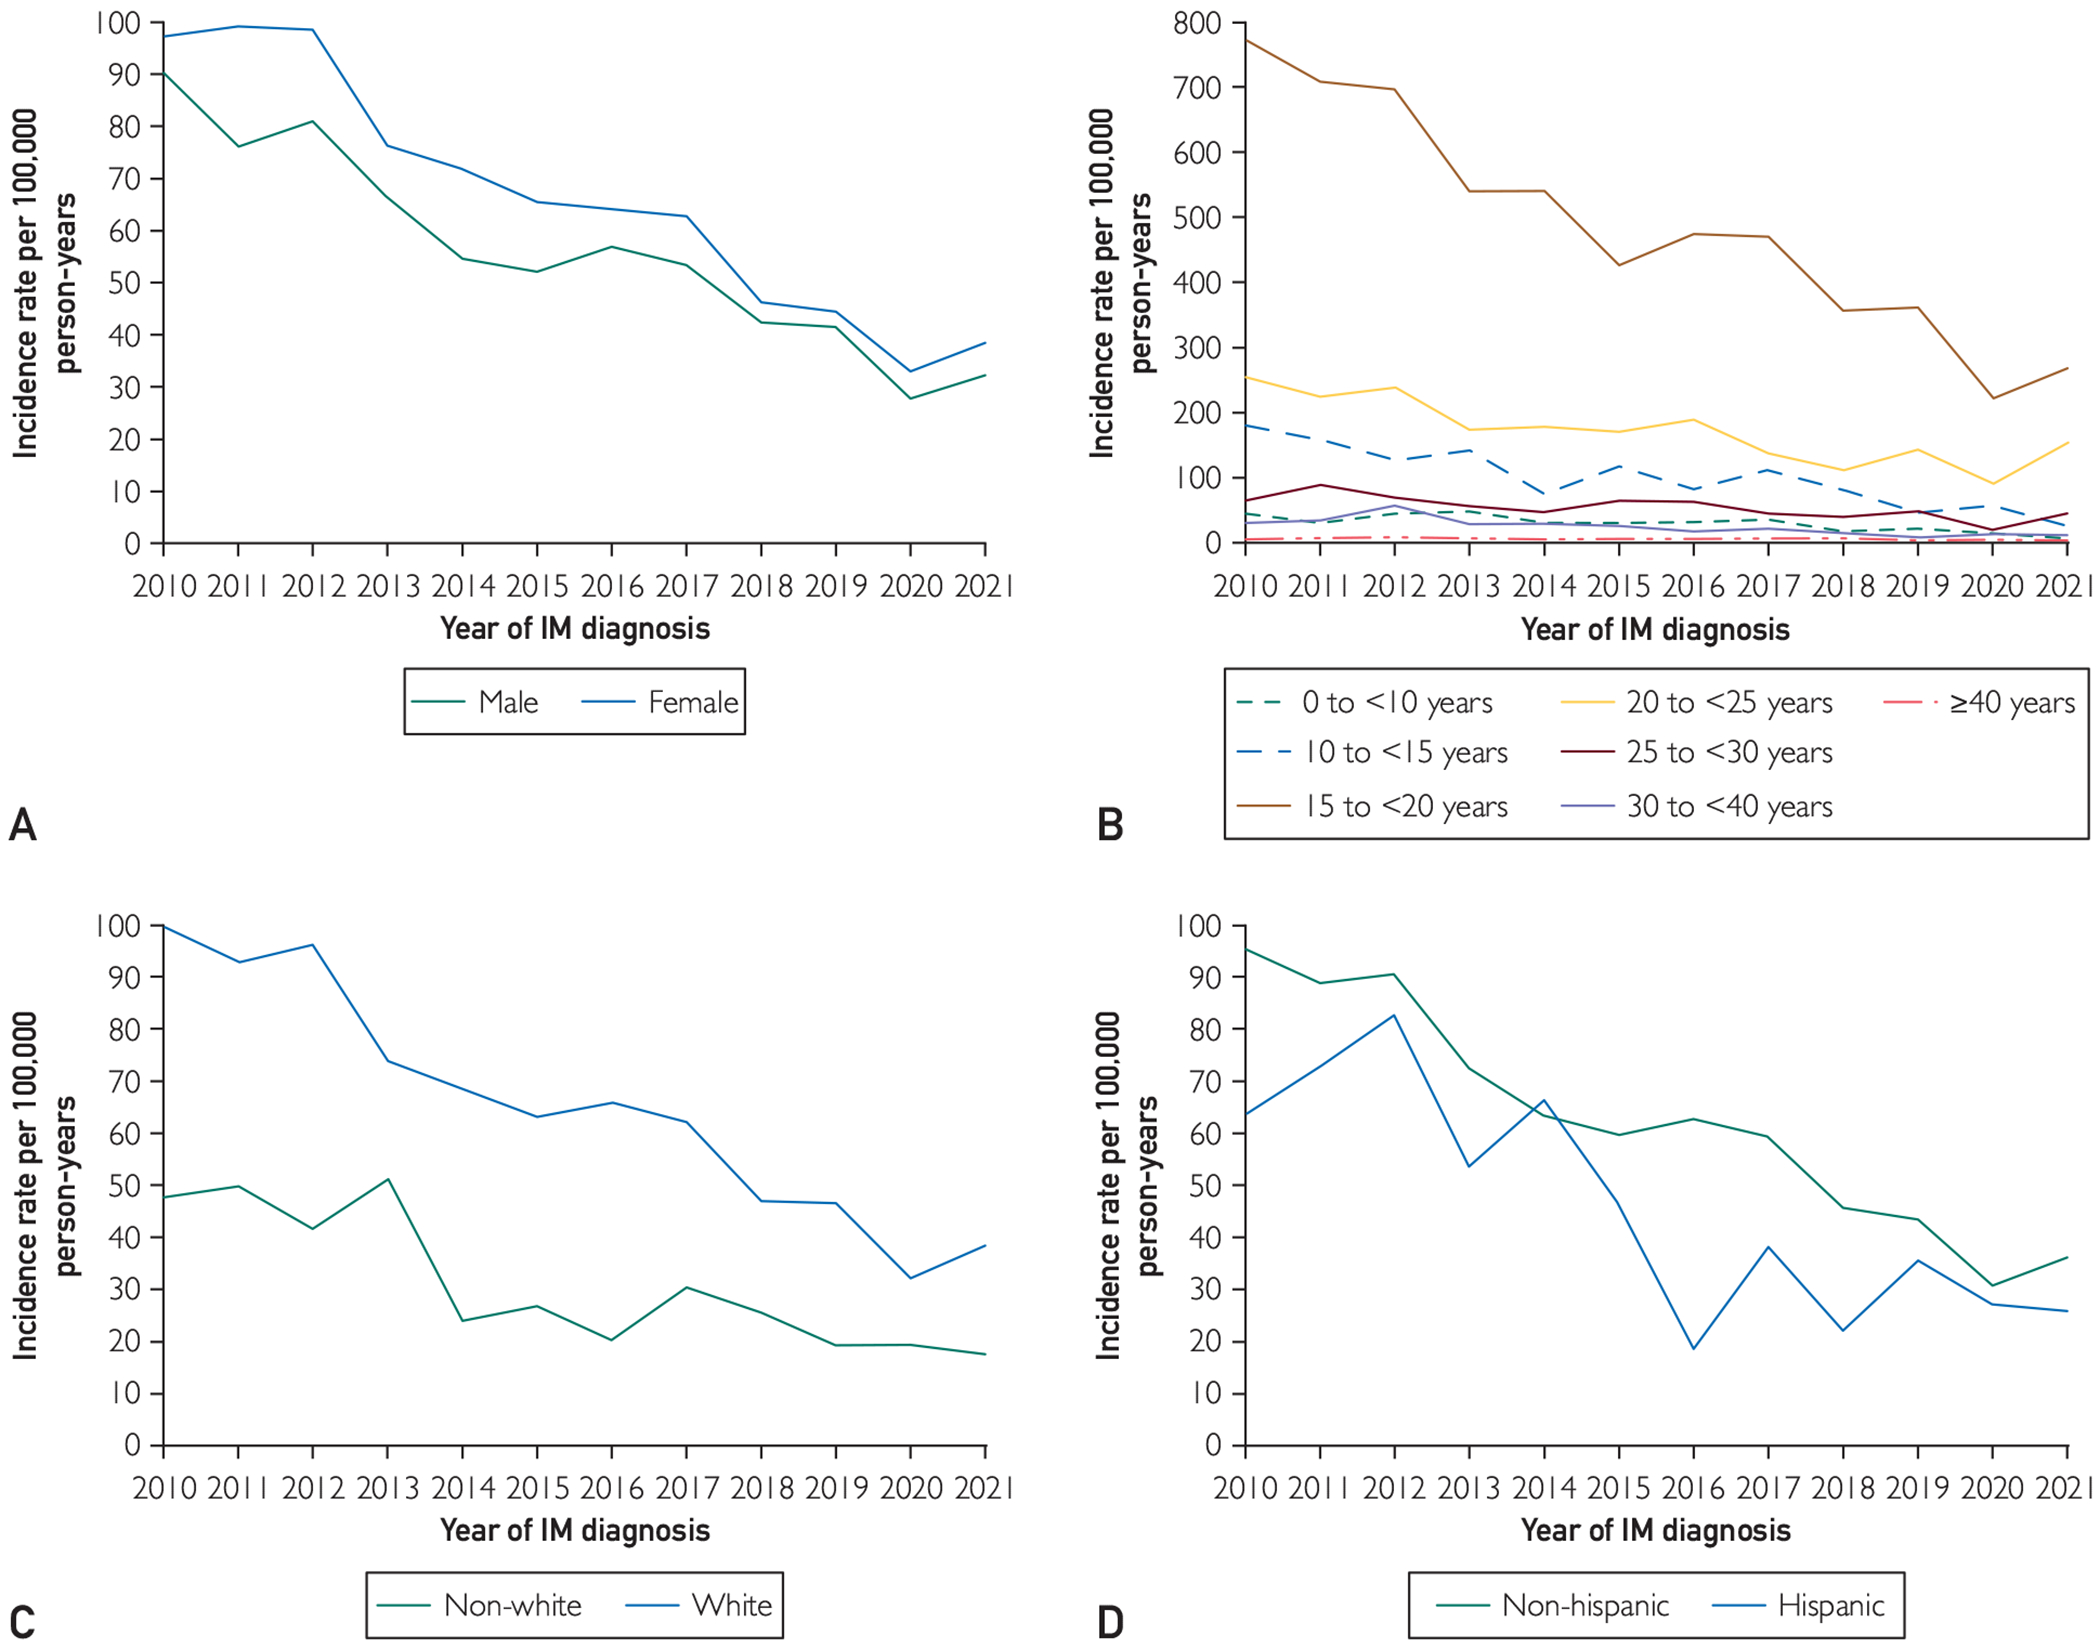
Trends in rates of infectious mononucleosis (IM) diagnosis over time by sex (A), age (B), race (C), and ethnicity (D).
Overall, 234 persons in the cohort (4.4%) were hospitalized with IM as a primary or secondary cause of the hospitalization (rate, 43.87 per 1000 persons with IM; 95% CI, 38.43 to 49.87). Characteristics of persons hospitalized and hospitalization rates among those with IM are shown in Table 3. After adjusting for other demographic characteristics and year, persons aged 0 to 9 years, those aged 20 years or older, and persons who were Hispanic were at increased risk of hospitalization (Table 3). In addition, hospitalization rates among those with IM increased over time; specifically, persons who had IM in 2016 or later were more likely to be hospitalized than persons who had IM between 2010 and 2012 (Table 3).
TABLE 3.
| Variable | No. of patients | Denominator (persons with IM) | Incidence rate (95% CI) per 1000 persons with IM | Incidence rate ratio (95% CI) | Adjustedc incidence rate ratio (95% CI) |
|---|---|---|---|---|---|
| Overall | 234 | 5334 | 43.87 (38.43-49.87) | NA | NA |
| Sex | |||||
| Male | 118 | 2338 | 50.47 (41.78-60.44) | 1.30 (0.97-1.75) | 1.22 (0.99-1.50) |
| Female | 116 | 2996 | 38.72 (32.00-46.44) | Referent | Referent |
| Age group (y) | |||||
| 0-9 | 31 | 311 | 99.68 (67.73-141.49) | 4.33 (3.01-6.24) | 4.03 (2.82-5.74) |
| 10-14 | 15 | 512 | 29.30 (16.40-48.32) | 1.27 (0.79-2.05) | 1.26 (0.79-1.99) |
| 15-19 | 60 | 2607 | 23.01 (17.56-29.62) | Referent | Referent |
| 20-24 | 40 | 1023 | 39.10 (27.93-53.24) | 1.70 (1.21-2.38) | 1.69 (1.22-2.34) |
| 25-29 | 12 | 317 | 37.85 (19.56-66.12) | 1.64 (0.98-2.77) | 1.65 (1.00-2.72) |
| 30-39 | 16 | 271 | 59.04 (33.75-95.88) | 2.57 (1.61-4.08) | 2.56 (1.63-4.00) |
| ≥40 | 60 | 293 | 204.78 (156.27-263.59) | 8.90 (6.58-12.03) | 8.67 (6.48-11.60) |
| Race | |||||
| White | 212 | 5022 | 42.21 (36.72-48.30) | Referent | Referent |
| Non-White | 22 | 312 | 70.51 (44.19-106.76) | 1.67 (1.01-2.76) | 1.39 (0.95-2.04) |
| Ethnicity | |||||
| Hispanic | 16 | 196 | 81.63 (46.66-132.57) | 1.92 (1.08-3.44) | 1.70 (1.10-2.64) |
| Non-Hispanic | 218 | 5138 | 42.43 (36.98-48.45) | Referent | Referent |
| Year | |||||
| 2010-2012 | 68 | 1830 | 37.16 (28.86-47.11) | Referent | Referent |
| 2013-2015 | 53 | 1439 | 36.83 (27.59-48.18) | 0.99 (0.66-1.49) | 0.93 (0.69-1.24) |
| 2016-2018 | 66 | 1232 | 53.57 (41.43-68.16) | 1.44 (0.98-2.12) | 1.32 (1.00-1.74) |
| 2019-2021 | 47 | 833 | 56.42 (41.46-75.03) | 1.52 (0.99-2.32) | 1.36 (1.00-1.84) |
IM, infectious mononucleosis; NA, not applicable.
Hospital admission date within 1 month before to 3 months after IM diagnosis.
Adjusted for all variables in the table.
DISCUSSION
We found an overall IM rate of approximately 61 per 100,000 person-years. Rates were higher for women, for adolescents and young adults, and for persons who were White or non-Hispanic; all rates decreased significantly during the study period. We also found that the rate of hospitalization due to IM was approximately 44 per 1000 IM cases, was greatest in the youngest and oldest populations, and increased over time. Together, these data indicate that although IM diagnosis rates are decreasing over time, a significant fraction of IM cases is likely to require hospitalization because of infection, and the rate of hospitalizations among those with IM has increased over time. These data may be useful in planning for future EBV vaccine trials.
Our results are consistent with those from previous studies that reported IM incidence rates ranging from 42 to 104 per 100,000 and that reported a higher incidence for females than for males and for adolescents and young adults than for other age groups.3,10,21,22 We also observed a statistically significant decrease in the incidence of IM overall and by every demographic characteristic during the time we studied. These decreases mirror decreases in IM incidence seen in Scotland and Israel.10 Similarly, Balfour et al13,23 found that EBV antibody prevalence declined in more recent classes of freshman college students compared with previous years and in children participating in the National Health and Nutrition Examination Surveys in more recent years compared with past years. Similar declines in EBV seroprevalence have also been observed in Japanese children, and age at primary infection has increased.15 Our analysis also found that across the 11-year period, a significant increase in age at IM diagnosis occurred. However, it is unclear what is driving these changes. The current study interval is more recent than previous studies and included 2020 and 2021. Significant decreases in other infectious diseases (including cytomegalovirus) during this time period have been observed because of social distancing, remote learning, and masking policies designed to prevent transmission of COVID-19.24–28 The 2 years that overlapped with the COVID-19 pandemic had the lowest IM rates, and it is not clear whether IM diagnoses will increase with the ending of COVID mitigation efforts. However, we still observed a significant linear decrease in IM cases from 2010 through 2019 (P<.001, adjusted for age, sex, and race), suggesting that pandemic policies cannot completely account for declines in IM rates over time.
We also found that the proportion of patients who had IM and a corresponding EBV test increased over time, such that for 77.7% of the IM cases in 2019 (254 of 327) there was a corresponding EBV test, whereas in 2010, there was a corresponding EBV test for only 43.9% of the IM cases (257 of 586), most of which were monospot tests. Among the persons tested for EBV, the positivity rate was greater than 90% for all cases. These data suggest that more than half of the earliest cases of IM may have been diagnosed based on symptoms alone, without receiving confirmatory testing. In more recent years, most IM cases had an associated EBV test. Therefore, health care professionals in recent years may have been less likely to diagnose a case of IM without a confirmatory test, which could also account for some of the observed decrease in the number of IM cases via this apparent change in clinical practice. Another possibility for the decrease is related to the changing sociodemographic characteristics of the REP population over the study years, especially among children. The REP is increasingly more diverse with respect to Black and Asian race, especially among the youngest age groups.29 Studies in the United States have estimated a markedly higher EBV seroprevalence at younger ages among minority and Hispanic groups compared with White individuals.13 If this were also true in the REP population, the seronegative population at risk for IM would have been reduced over time. However, incidence rates decreased in all race/ethnic groups over the study period, suggesting that the changing demographic characteristics of this population do not account for the decreases in incidence rates.
Our results are consistent with those of other studies that reported lower IM rates in persons of a minority race or ethnicity. Specifically, Health and Brodsky11 found higher IM rates in the White population than in the Black population of Atlanta, Georgia, in the early 1970s. The author speculated that the lower rates observed in that study could be a result of underdiagnosis because of lesser access to health care in the Black population. Alternatively, Condon et al30 found striking differences in EBV antibody positivity rates by race, in which children of a minority race or ethnicity became EBV positive at significantly younger ages than White children. Earlier age at infection may lead to infections that are more asymptomatic, with less likelihood of classic IM symptoms, resulting in a lower diagnosis rate.1 However, we observed higher hospitalization rates in the Black, other/mixed, and Hispanic populations in the current study than in White and non-Hispanic persons. These results suggest that less severe cases of IM may be underdiagnosed in persons of a racial or ethnic minority population. Lack of diagnosis may result from lesser access to care, from delayed diagnosis and undertreatment, and for those with Hispanic ethnicity, language barriers to timely and appropriate care.31
Finally, we observed an overall rate of hospitalization of 44 per 1000 persons in those with an IM diagnosis, and risk of hospitalization was highest in the youngest and oldest age groups and in the non-White and the Hispanic populations. In contrast with the decreases in IM incidence rates over time, risk of hospitalization in persons with an IM diagnosis increased over time. These data suggest that either these groups are at an increased risk of hospitalization because of underlying causes or that milder IM cases may be missed in these populations. We note that we were only able to identify cases of IM that came to medical attention. Therefore, we missed cases that were not identified by a health care professional in the REP consortium. We are most likely to miss milder cases with less severe symptoms, and our rates of IM, particularly in these populations, may be conservative. However, older age at primary EBV infection is associated with an increased risk of disease severity.32,33 Our data showing an increased risk of hospitalization over time are consistent with our observed increase in age at primary infection in the same time frame. As noted by Balfour et al,23 the risk of more severe disease also suggests a need for EBV vaccines that could help to reduce the incidence and possibly the severity of IM.
The strengths of our study were the ability to study IM cases and associated hospitalizations in a large, well-characterized, population-based sample over more than a decade. We also had access to the full text of the medical records for this population and were able to classify hospitalizations as related to IM even in patients who did not have a primary or secondary diagnosis of IM. However, our study was limited to an Upper Midwest population of the United States, and additional studies are necessary in other areas of the country to determine whether similar patterns are seen in populations with other demographic or health care utilization characteristics.
We also note that we did not capture data for all persons residing in this region. Overall capture is 66% in persons living in the 27 counties, and we may have missed cases of IM that were diagnosed in persons not captured by the REP or cases that were diagnosed outside this region. However, the REP captures virtually 100% of the population living in a single county (Olmsted County, Minnesota) in this region, and approximately 90% of persons living in a 9-county region around Olmsted County. We conducted a sensitivity analysis to determine if IM incidence rates varied among Olmsted County, the 9-county region, and the 27-county region. Resulting incidence rates were slightly higher in the 2 regions outside Olmsted County (Olmsted County, 49.7 per 100,000 [95% CI, 46.6 to 53.0; 9-county region, 55.2 per 100,000 [95% CI, 53.1 to 57.5; 27-county region, 58.2 per 100,000 [95% CI, 56.6 to 59.8). Assuming the incidence of IM was equal across subregions, these data suggest that we did not miss large numbers of IM cases due to incomplete capture. We also note that young adults who spend part of the year away for college and older adults who spend part of their time in another state (“snowbirds”) are still considered residents of this region. If these persons have a mild case of IM that is treated by a school health care site or a non-REP health care professional in a different state, this information may not be captured in the REP. We note that the rate of IM in 20- to 24-year-olds in this population was less than 1%, which is lower than most annual IM rates observed in other college-aged populations (0.5% to 9.3% per year).9 Therefore, IM cases in young adults, and possibly in older retired adults in this region, may be underestimates of true cases in these groups.
Finally, we note that IM has consistently been associated with a later risk for development of multiple sclerosis.34,35 However, EBV infection is virtually ubiquitous, with EBV seroprevalence rates of greater than 80% by age 19 in the general population36; thus, many infections with EBV are asymptomatic. Goldacre35 has suggested that symptomatic IM may be a marker of the size of the virus-specific CD8+ T-cell response in a given individual and potentially an important factor in the pathogenesis leading to multiple sclerosis. If IM cases are truly declining over time, a decline in multiple sclerosis cases may eventually be observed as well. Such changes have not consistently been observed around the world, but most studies of multiple sclerosis incidence do not include data after 2018.37,38 Further studies using more current data are therefore necessary to determine whether recent changes in IM incidence are paralleled by declines in the incidence of multiple sclerosis.
CONCLUSION
In this study, we found that diagnosis rates of IM decreased whereas hospitalizations among those with IM increased between 2010 and 2021. In addition, children younger than 10 years, adults older than 40 years, and Hispanic populations had an elevated risk of hospitalization due to IM. Therefore, the current study provides recent data on the changing epidemiology of IM and is helpful for understanding the impact of IM at the population level.
Supplementary Material
ACKNOWLEDGMENTS
We thank Roderick A. McPhee of Moderna, Inc, for assistance with this project. Editorial assistance, under the direction of the authors, was provided by Melissa Vetten, PhD, of MEDiSTRAVA in accordance with Good Publication Practice (GPP 2022) guidelines and funded by Moderna, Inc.
The content of this article is solely the responsibility of the authors and does not necessarily represent the official views of the National Institutes of Health or the Mayo Clinic. Moderna, Inc, had no role in gathering or preparing the data on which this work is based. Moderna, Inc, the authors, and the reviewers contributed to the preparation of the submitted manuscript.
POTENTIAL COMPETING INTERESTS
Drs St. Sauver and Jacobson, Ms Weston, and Ms Fan received grant funding from Moderna, Inc, to conduct the study. Dr Buck is an employee of Moderna, Inc, and has equity interest in Moderna, Inc. Dr Hall was an employee of Moderna, Inc at the time this study was conducted.
Grant Support:
This work was supported by Moderna, Inc, and used the resources of the Rochester Epidemiology Project medical records—linkage system, which is supported by grant AG058738 from the National Institute on Aging and by the Mayo Clinic Research Committee.
Abbreviations and Acronyms:
- EBV
Epstein-Barr virus
- ICD
International Classification of Diseases
- IM
infectious mononucleosis
- REP
Rochester Epidemiology Project
Footnotes
SUPPLEMENTAL ONLINE MATERIAL
Supplemental material can be found online at http://www.mayoclinicproceedings.org. Supplemental material attached to journal articles has not been edited, and the authors take responsibility for the accuracy of all data.
Data Availability:
The data sets used for this study contain identifiable patient data. Limited data sets may be shared with appropriate data use agreements. Please contact Dr St. Sauver for further information.
REFERENCES
- 1.Dunmire SK, Verghese PS, Balfour HH Jr. Primary Epstein-Barr virus infection. J Clin Virol. 2018;102:84–92. [DOI] [PubMed] [Google Scholar]
- 2.Odumade OA, Hogquist KA, Balfour HH Jr. Progress and problems in understanding and managing primary Epstein-Barr virus infections. Clin Microbiol Rev. 2011;24(1):193–209. [DOI] [PMC free article] [PubMed] [Google Scholar]
- 3.Rostgaard K, Balfour HH Jr, Jarrett R, et al. Primary Epstein-Barr virus infection with and without infectious mononucleosis. PLoS One. 2019;14(12):e0226436. [DOI] [PMC free article] [PubMed] [Google Scholar]
- 4.Rea TD, Russo JE, Katon W, Ashley RL, Buchwald DS. Prospective study of the natural history of infectious mononucleosis caused by Epstein-Barr virus. J Am Board Fam Pract. 2001;14(4):234–242. [PubMed] [Google Scholar]
- 5.Kap EJ, Konrad M, Kostev K. Clinical characteristics and sick leave associated with infectious mononucleosis in a real-world setting in Germany. Int J Clin Pract. 2021;75(10):e14690. [DOI] [PubMed] [Google Scholar]
- 6.Jenson HB. Acute complications of Epstein-Barr virus infectious mononucleosis. Curr Opin Pediatr. 2000;12(3):263–268. [DOI] [PubMed] [Google Scholar]
- 7.Henke CE, Kurland LT, Elveback LR. Infectious mononucleosis in Rochester, Minnesota, 1950 through 1969. Am J Epidemiol. 1973:98(6)483–490. [DOI] [PubMed] [Google Scholar]
- 8.Levine H, Mimouni D, Grotto I, Zahavi A, Ankol O, Huerta-Hartal M. Secular and seasonal trends of infectious mononucleosis among young adults in Israel: 1978-2009. Eur J Clin Microbiol Infect Dis. 2012;31(5)757–760. [DOI] [PubMed] [Google Scholar]
- 9.Stahlman S, Williams VF, Ying S. Infectious mononucleosis, active component, U.S. Armed Forces, 2002-2018. MSMR. 2019;26(7):28–33. [PubMed] [Google Scholar]
- 10.Visser E, Milne D, Collacott I, McLernon D, Counsell C, Vickers M. The epidemiology of infectious mononucleosis in Northern Scotland: a decreasing incidence and winter peak. BMC Infect Dis. 2014;14:151. [DOI] [PMC free article] [PubMed] [Google Scholar]
- 11.Heath CW Jr, Brodsky AL, Potolsky Al. Infectious mononucleosis in a general population. Am J Epidemiol. 1972:95(1):46–52. [DOI] [PubMed] [Google Scholar]
- 12.Williams-Harmon YJ, Jason LA, Katz BZ. Incidence of infectious mononucleosis in universities and U.S. military settings. J Diagn Tech Biomed Anal. 2016;5(1). 10.4172/2469-5653.1000113 [DOI] [PMC free article] [PubMed] [Google Scholar]
- 13.Balfour HH Jr, Sifakis F, Sliman JA, Knight JA, Schmeling DO, Thomas W. Age-specific prevalence of Epstein-Barr virus infection among individuals aged 6-19 years in the United States and factors affecting its acquisition. J Infect Dis. 2013;208(8):1286–1293. [DOI] [PubMed] [Google Scholar]
- 14.Fourcade G, Germi R, Guerber F, et al. Evolution of EBV seroprevalence and primary infection age in a French hospital and a city laboratory network, 2000-2016. PLoS One. 2017;12(4):e0175574. [DOI] [PMC free article] [PubMed] [Google Scholar]
- 15.Takeuchi K, Tanaka-Taya K, Kazuyama Y, et al. Prevalence of Epstein-Barr virus in Japan: trends and future prediction. Pathol Int. 2006;56(3):112–116. [DOI] [PubMed] [Google Scholar]
- 16.Rocca WA, Grossardt BR, Brue SM, et al. Data resource profile: expansion of the Rochester Epidemiology Project medical records-linkage system (E-REP). Int J Epidemiol. 2018;47(2). 368–368j. [DOI] [PMC free article] [PubMed] [Google Scholar]
- 17.Sauver JL, Grossardt BR, Finney Rutten LJ, et al. Rochester Epidemiology Project Data Exploration Portal. Prev Chronic Dis. 2018;15:E42. [DOI] [PMC free article] [PubMed] [Google Scholar]
- 18.St Sauver JL, Grossardt BR, Yawn BP, Melton LJ III, Rocca WA. Use of a medical records linkage system to enumerate a dynamic population over time: the Rochester Epidemiology Project. Am J Epidemiol. 2011;173(9):1059–1068. [DOI] [PMC free article] [PubMed] [Google Scholar]
- 19.Jonckheere AR. A distribution-free k-sample test against ordered alternatives. Biometrika. 1954;41(1/2):133–145. [Google Scholar]
- 20.Terpstra TJ. The asymptotic normality and consistency of Kendall’s test against trend, when ties are present in one ranking. Indagationes Mathematicae. 1952;14:327–333. [Google Scholar]
- 21.Evans AS. Infectious mononucleosis and related syndromes. Am J Med Sci. 1978:276(3):325–339. [DOI] [PubMed] [Google Scholar]
- 22.Kuri A, Jacobs BM, Vickaryous N, et al. Epidemiology of Epstein-Barr virus infection and infectious mononucleosis in the United Kingdom. BMC Public Health. 2020;20(1):912. [DOI] [PMC free article] [PubMed] [Google Scholar]
- 23.Balfour HH Jr, Meirhaeghe MR, Stancari AL, Geris JM, Condon LM, Cederberg LE. Declining Epstein-Barr virus antibody prevalence in college freshmen strengthens the rationale for a prophylactic EBV vaccine. Vaccines (Basel). 2022;10(9):1399. [DOI] [PMC free article] [PubMed] [Google Scholar]
- 24.Schleiss MR, Rosendahl S, McCann M, Dollard SC, Lanzieri TM. Assessment of congenital cytomegalovirus prevalence among newborns in Minnesota during the COVID-19 pandemic. JAMA Netw Open. 2022;5(9):e2230020. [DOI] [PMC free article] [PubMed] [Google Scholar]
- 25.Jain P, Basnet S, Syed S, et al. Testing for cytomegalovirus among individuals who were immunocompromised, 2018-2022. JAMA Netw Open. 2023:6(11):e2345126. [DOI] [PMC free article] [PubMed] [Google Scholar]
- 26.Nielsen RT, Dalby T, Emborg H-D, et al. COVID-19 preventive measures coincided with a marked decline in other infectious diseases in Denmark, spring 2020. Epidemiol Infect. 2022;150:e138. [DOI] [PMC free article] [PubMed] [Google Scholar]
- 27.Hayes LJ, Uri H, Bojkova D, Cmatl J Jr, Wass MN, Michaelis M. Impact of the COVID-19 pandemic on the circulation of other pathogens in England. J Med Virol. 2023;95(1):e28401. [DOI] [PMC free article] [PubMed] [Google Scholar]
- 28.Hatoun J, Correa ET, Donahue SMA, Vernacchio L. Social distancing for COVID-19 and diagnoses of other infectious diseases in children. Pediatrics. 2020;146(4):e2020006460. [DOI] [PubMed] [Google Scholar]
- 29.Rochester Epidemiology Project. REP population overview. Rochester Epidemiology Project website. Accessed March 7, 2023. https://rochesterproject.org/for-researchers/population-overview/ [Google Scholar]
- 30.Condon LM, Cederberg LE, Rabinovitch MD, et al. Age-specific prevalence of Epstein-Barr virus infection among Minnesota children: effects of race/ethnicity and family environment. Clin Infect Dis. 2014;59(4):501–508. [DOI] [PubMed] [Google Scholar]
- 31.Caraballo C, Ndumele CD, Roy B, et al. Trends in racial and ethnic disparities in barriers to timely medical care among adults in the US, 1999 to 2018. JAMA Health Forum. 2022;3(10):e223856. [DOI] [PMC free article] [PubMed] [Google Scholar]
- 32.Axelrod P, Finestone AJ. Infectious mononucleosis in older adults. Am Fam Physician. 1990;42(6):1599–1606. [PubMed] [Google Scholar]
- 33.Halevy J, Ash S. Infectious mononucleosis in hospitalized patients over forty years of age. Am J Med Sci. 1988;295(2):122–124. [DOI] [PubMed] [Google Scholar]
- 34.Bjornevik K, Cortese M, Healy BC, et al. Longitudinal analysis reveals high prevalence of Epstein-Barr virus associated with multiple sclerosis. Science. 2022;375(6578):296–301. [DOI] [PubMed] [Google Scholar]
- 35.Goldacre R Risk of multiple sclerosis in individuals with infectious mononucleosis: a national population-based cohort study using hospital records in England, 2003-2023. Mult Scler. 2024;30(4-5):489–495. [DOI] [PMC free article] [PubMed] [Google Scholar]
- 36.Dowd JB, Palermo T, Brite J, McDade TW, Aiello A. Seroprevalence of Epstein-Barr virus infection in U.S. children ages 6-19, 2003-2010. PLoS One. 2013;8(5):e64921. [DOI] [PMC free article] [PubMed] [Google Scholar]
- 37.Lane J, Ng HS, Poyser C, Lucas RM, Tremlett H. Multiple sclerosis incidence: a systematic review of change over time by geographical region. Mult Scler Relat Disord. 2022;63:103932. [DOI] [PubMed] [Google Scholar]
- 38.Koch-Henriksen N, Magyari M. Apparent changes in the epidemiology and severity of multiple sclerosis. Nat Rev Neurol. 2021;17(11):676–688. [DOI] [PubMed] [Google Scholar]
Associated Data
This section collects any data citations, data availability statements, or supplementary materials included in this article.
Supplementary Materials
Data Availability Statement
The data sets used for this study contain identifiable patient data. Limited data sets may be shared with appropriate data use agreements. Please contact Dr St. Sauver for further information.