

ABSTRACT
Despite advancements in treatment for B‐cell non‐Hodgkin lymphoma (B‐NHL) in recent decades, many patients still relapse or are refractory to treatment, which represents a high unmet medical need. Novel CD20 × CD3 T‐cell–engaging bispecific antibodies (bsAbs) have created a new paradigm for the treatment of B‐NHL. Pivotal studies of four CD20 × CD3 bsAbs, mosunetuzumab, glofitamab, epcoritamab, and odronextamab, as monotherapy, have demonstrated robust responses with generally manageable safety profiles in patients with relapsed or refractory follicular lymphoma and diffuse large B‐cell lymphoma after ≥ 2 lines of systemic therapy. These agents have presented unique challenges (e.g., cytokine release syndrome [CRS]), which have required different strategies to overcome. This review provides a comprehensive overview of the clinical development of these four CD20 × CD3 bsAbs that have been investigated for the treatment of B‐NHL, with a specific focus on translational assessments to select starting doses in first‐in‐human studies, management of CRS, application of modeling and simulation approaches to aid dose escalation and optimization/selection, and strategies used in the design of phase I–III clinical trials. By highlighting learnings and experiences from these four bsAbs assessed, which have not been summarized collectively elsewhere, we aim to promote more efficient study design for novel bsAbs in B‐NHL in the future.
Keywords: clinical trials, dose, drug development, exposure response, hematology, model‐based drug development, monoclonal antibodies, oncology, pharmacodynamics, pharmacokinetics
1. Introduction
Non‐Hodgkin lymphoma (NHL) comprises a diverse group of lymphomas and is one of the most common cancer types, with nearly 544,000 new cases diagnosed and 260,000 NHL‐related deaths reported globally in 2020 [1]. B‐cell lymphomas comprise approximately 85% of NHL cases, with diffuse large B‐cell lymphoma (DLBCL, aggressive) and follicular lymphoma (FL, indolent) being the most common subtypes [2]. Although therapeutics for B‐cell NHL (B‐NHL) have advanced over recent decades, a notable proportion of patients still relapse after or are refractory to treatment, leading to high mortality (especially in patients with aggressive disease) and representing a high unmet medical need [3, 4, 5].
Knowledge of immunotherapies for the treatment of lymphoma has improved tremendously in recent years. Among those available for B‐NHL are T‐cell–engaging bispecific antibodies (bsAbs), which bind to two different antigens on B cells and T cells simultaneously and redirect patients' effector T cells to target tumor cells for killing [6].
Several CD20 × CD3 bsAbs are in development for the treatment of B‐NHL [6]. Four leading treatments are mosunetuzumab, glofitamab, epcoritamab, and odronextamab, which have shown encouraging activity and generally manageable safety in patients with FL or DLBCL that is relapsed or refractory (R/R) after ≥ 2 lines of systemic therapy [7, 8, 9, 10, 11, 12].
Although the efficacy and safety of these bsAbs [6, 13, 14, 15] and the general dosing strategies of most assessed CD3 bsAbs [16, 17] have been summarized previously, no comprehensive clinical pharmacology reviews have yet explored these bsAbs from a translational perspective. Notably, mosunetuzumab, glofitamab, epcoritamab, and odronextamab are all CD20×CD3 bsAbs with similar mechanisms of action; however, their binding affinities and targets for binding to CD3 on T cells and CD20 on B cells are different [6], and the strategies for their clinical development varied. The scope of this review is to provide a complete overview of the biologic characteristics, preclinical evidence, and clinical development of these bsAbs, with a focus on translational sciences, pharmacokinetics (PK), pharmacodynamics (PD), model‐based analyses for dose selection and optimization of these four CD20 × CD3 bsAbs assessed for different B‐NHL indications, and clinical trial planning strategies.
Similarities and differences in developmental strategies are discussed, including translational assessments to determine the starting dose in first‐in‐human (FIH) studies, step‐up dosing for the management of CRS, dose increments for dose escalation, regimen determination and optimization for phase II and III studies, and the application of modeling in regimen optimization. We summarize the learnings from these approaches including dose‐selection strategies to promote more efficient study design for future development of bsAbs in treating patients with B‐NHL.
2. Translational Assessment for the Design of FIH Studies
FIH studies are vital in clinical drug development [18]. In oncology, they are commonly single‐arm, open‐label studies that include multiple dose cohorts for determining phase II regimens [19]. Factors to consider in the design of FIH studies include the starting dose, increment for dose escalation, number of patients per dose level, and specifications for dose‐limiting toxicity and maximum tolerated dose (MTD). Investigational starting doses are often lower than pharmacologically active doses because of uncertainty about safety at the time of FIH study initiation [20]. Ideally, unnecessary exposure to subtherapeutic doses should be limited while safety is preserved and rapid dose escalation is maintained [18]. Although this generally applies to all FIH studies, there are some specific considerations for bsAbs that engage T cells: particularly, the choice of starting dose and dose‐escalation strategy to reduce the risk of cytokine release (induced by T‐cell activation) and associated CRS, while rapidly reaching therapeutic doses. The choice of starting dose is influenced by binding affinity (to CD20 and CD3 arms for these bsAbs) and potency, which appear to vary for these four bsAbs. Due to differences in the experimental conditions (effector: target ratio, receptor expression, cell system, etc.), the binding affinities and potency results of these CD20×CD3 bsAbs become less relevant for direct comparison [21]. However, clones of these four CD20×CD3 bsAbs have been compared in DLBCL cell lines, demonstrating varying half‐maximal effective concentrations (EC50s) in B‐cell depletion [22]. In vitro, glofitamab and odronextamab have been shown to retain significant activity in the presence of low CD20 expression [22, 23]. In clinical practice, odronextamab demonstrated similar complete response (CR) rates regardless of baseline CD20 expression [24]. Responses to glofitamab in patients with low baseline CD20 expression were limited, and rates of CD20 loss at relapse were high [25, 26]. Mosunetuzumab activity by CD20 expression is discussed below.
Approaches to select starting doses and dosing strategies in FIH studies of mosunetuzumab, glofitamab, epcoritamab, and odronextamab are outlined below.
2.1. Mosunetuzumab
Minimum anticipated biologic effect level (MABEL) was used to determine an initial mosunetuzumab starting dose (at Week 1 Day 1) of 50 μg for intravenous (IV) administration based on in vitro assays of T‐cell activation, cytokine release, and CD3 receptor occupancy (Table 1) [27]. To limit the number of patients exposed to subtherapeutic doses, single‐patient dose‐escalation cohorts (0.05–0.2 mg) were planned prior to a 3 + 3 design at higher dose levels (0.05–2.8 mg) [27, 41]. Dose‐limiting grade 4 neutropenia was observed at a dose of 1.6 mg, which helped decide the Week 1 dose of 1 mg [41, 42]. Using transgenic mice expressing human CD20 and CD3, transient B‐cell reduction was seen in the blood and complete B‐cell depletion in the spleen at a dose of 0.5 mg/kg, and strong tumor inhibition was observed at doses of 0.1 and 0.5 mg/kg in a tumor regression model, which helped identify doses that had an antitumor effect [28]. Consistent with the effective dose in mice, a 30 mg dose in patients (~0.5 mg/kg) was selected based on accumulated data and exposure‐response analyses [41].
TABLE 1.
Summary of nonclinical information on CD20 × CD3 bsAbs.
| Mosunetuzumab [27, 28, 29, 30] | Glofitamab [23, 31, 32, 33] | Epcoritamab [34, 35, 36, 37] | Odronextamab [38, 39, 40] | |
|---|---|---|---|---|
| Monoclonal antibody type (molecular weight) | Humanized IgG1‐based bsAb, 1:1 construct (146 kDa) | Humanized IgG1‐based bsAb, 2:1 construct a (197 kDa) | Humanized IgG1‐based, 1:1 construct bsAb (149 kDa) | Fully human IgG4‐based bsAb, 1:1 construct (146 kDa) |
| Approach to select the initial FIH dose (mode of assessment) | MABEL (in vitro) | PK–PDIL‐6 (ex vivo) | MABEL (in vitro) | MABEL (in vitro) |
| Initial starting dose tested (route of administration) | 50 μg (IV) | 5 μg (IV) | 4 μg (SC) | 30 μg (IV) |
| Final recommended or approved starting dose (route and day of administration) | 1 mg (IV; W1D1) |
2.5 mg (IV; W2D1) with 1000 mg obi pretreatment (IV; W1D1) |
0.16 mg (SC; W1D1) | 0.2 mg (IV; W1D1) |
| EC50 for T‐cell–dependent B‐cell killing, pM | ~1.5–75 | ~1 | 0.21–451 | 3–25 |
| In vivo antitumor activity |
In hCD20–hCD3 double transgenic mice administered a single dose of mosunetuzumab:
In mice engrafted with CLL cells and then administered a single dose of mosunetuzumab:
|
In humanized NSG mice administered glofitamab QW:
|
In humanized NOD–SCID mice administered a single dose of epcoritamab:
|
In humanized NSG mice with established tumor (220 mm3) administered a single dose of odronextamab:
|
| Toxicology in cynomolgus monkeys |
|
2‐week study:
|
|
|
| PK/TK in cynomolgus monkeys |
|
|
|
|
Abbreviations: bsAb, bispecific antibody; CLL, chronic lymphocytic leukemia; CRS, cytokine release syndrome; D, Day; EC50, half‐maximal effective concentration; ED50, half‐maximal effective dose level; FIH, first‐in‐human; hCD, human CD; IgG, immunoglobulin G; IL‐6, interleukin 6; IV, intravenous; MABEL, minimum anticipated biological effect level; NOD–SCID, nonobese diabetic–severe combined immunodeficiency; NSG, NOD–SCID gamma; obi, obinutuzumab; PD, pharmacodynamics; PK, pharmacokinetics; QW, once per week; SC, subcutaneous; TK, toxicokinetics; TMDD, target‐mediated drug disposition; W, Week.
Glofitamab has a 2:1 construct that confers bivalent binding to CD20 on B cells and monovalent binding to CD3 on T cells.
Additionally, preclinical experiments have shown that high CD20 expression may not be required for mosunetuzumab efficacy [28] and this has been confirmed clinically [43] although limited activity has been reported in some patients with low (< 10%) CD20 levels [44]. Patients who have received prior anti‐CD20 therapies (e.g., rituximab) did not require a long washout period [27] and mosunetuzumab has shown clinical activity in anti‐CD20 antibody–resistant B‐NHL [8].
2.2. Glofitamab
PK and PD assessments in cynomolgus monkeys showed that higher cytokine release was associated with higher serum glofitamab concentrations and baseline B‐cell counts [31]. As the EC50 of glofitamab was 70‐fold lower in human than monkey blood in an interleukin‐6 (IL‐6) release assay, a PK–PDIL‐6 model was developed to predict human data and showed that a 50 μg dose of glofitamab could induce ≤ 600 pg/mL increase in IL‐6 in 95% of patients who have 50 B cells/μL in blood. Considering that B cells in tumor tissue might contribute to cytokine release, an arbitrary 10‐fold safety factor was used to set the human starting dose at 5 μg (Table 1), which was 28‐fold higher than the starting dose calculated via a MABEL approach (~0.18 μg) using an in vitro EC50 for tumor lysis [31].
Moreover, pretreatment with the anti‐CD20 antibody obinutuzumab at a dose of 50 mg/kg prior to glofitamab 100 μg/kg in monkeys reduced post‐dose IL‐6 levels ≥ 64‐fold compared with those without pretreatment [31]. Obinutuzumab is a monoclonal antibody that targets the CD20 antigen expressed on the surface of B cells and, upon binding, mediates B‐cell lysis [45]. This strategy of B‐cell reduction with obinutuzumab was applied in the FIH study of glofitamab to reduce the risk of severe CRS (see Section 3), where pretreatment with obinutuzumab (1000 mg, 1 week before) enabled a higher glofitamab starting dose of 2.5 mg [46].
2.3. Epcoritamab
Subcutaneous (SC) administration of epcoritamab was selected in the FIH study, based on preclinical data showing comparable long‐lasting B‐cell depletion in peripheral blood and lymphoid organs with SC or IV administration [34, 47]. SC administration showed similar efficacy and favorable tolerability, compared with IV administration, in cynomolgus monkeys [34]. Importantly, compared with IV administration, the lower, delayed peak drug concentration following SC dosing was associated with reduced cytokine release [34, 47]. The initial starting dose (4 μg SC) was selected based on in vitro EC20 values from the most sensitive assay systems via the MABEL approach (Table 1) [35, 47], and was 40‐fold lower than the finally determined Week 1 dose (0.16 mg SC). Determination of the dose‐escalation steps and efficacious dose of epcoritamab was supported by its antitumor activity at doses ≥ 0.05 mg/kg in humanized mouse xenograft models [34]. Based on these data, epcoritamab has been developed only for SC administration in the clinic, without testing IV administration [12].
2.4. Odronextamab
The MABEL approach was used to estimate the initial odronextamab starting dose of 30 μg based on joint assessments, including EC50 values for in vitro T‐cell cytotoxicity, T‐cell proliferation, and cytokine release, as well as projected maximum concentration (C max) in humans [38]. This initial dose was approximately seven‐fold lower than the actual dose selected for Week 1 Day 1 (0.2 mg), which was determined based on clinical safety assessments [38, 48]. If the MABEL estimation had been based on the odronextamab EC50 calculated from an IL‐6 release assay (> 0.3 nM), the initial dose would have been the same as the selected dose [10, 38, 49]. This suggests that in vitro cytokine assays have translational value to identify doses that may be associated with cytokine release in patients. In mouse tumor regression models, the efficacious concentration range was 1–10 μg/mL [38]. This information supported odronextamab dose escalation to ≥ 40 mg for clinical efficacy assessment [48].
2.5. Summary
MABEL estimations, based on data from in vitro T‐cell activation and cytotoxicity assays, are commonly used to select the FIH starting dose [27, 35, 38]. This approach led to the initial selection of FIH starting doses that were ~7‐ to 500‐fold lower than the doses finally selected for Week 1 Day 1 (without anti‐CD20 antibody pretreatment) (Table 1). As cytokine release assays can generate higher EC50 values than cytotoxicity assays, their use would have led to estimated starting doses that were closer to the final selected dose [31, 38]. However, EC50 values for cytokine release can vary depending on experimental conditions [31]. Therefore, a safety factor of 10 or higher is recommended when determining a starting dose in FIH studies [50].
Different mouse models were used to evaluate the antitumor activities of the bsAbs, and a potent antitumor effect was found with doses from 0.1 to 1 mg/kg (Table 1) [23, 28, 34, 38]; this is generally consistent with the final recommended clinical doses (30–160 mg or ~0.5–2 mg/kg) across the four bsAbs [29, 32, 36, 39, 51, 52, 53]. Thus, efficacious concentrations determined in preclinical mouse models appear to have translational value in projecting active dose ranges in patients.
Dose ranges of 0.0003–10 mg/kg IV or 0.01–10 mg/kg SC were studied for these bsAbs in cynomolgus monkeys, a commonly used species for toxicology and PK assessments; target‐mediated drug disposition (TMDD) was observed at the lower doses within these ranges [30, 31, 33, 37, 38, 54, 55] (Table 1). PK modeling with allometric scaling is generally used to predict exposure at a given dose in humans [56] which is important in selecting a starting dose with an acceptable safety profile. The translational value of cytokine release data from monkeys depends on the similarity of the bsAb binding affinity in monkeys and humans [54]. Additionally, the translational value of preclinical efficacy findings depends on the cell line selected, dose range tested, and the relevance of animal models [57].
3. Strategies for the Management of CRS
CRS is a common adverse event associated with T‐cell–engaging immunotherapies, such as CD3‐engaging bsAbs and chimeric antigen receptor T‐cell (CAR‐T) therapies. CRS is characterized by transient, massive, pro‐inflammatory cytokine release, and clinical symptoms can range from mild (e.g., fever) to severe, life‐threatening manifestations [58]. During the development of blinatumomab, the first bispecific T‐cell engager antibody for the treatment of acute lymphoblastic leukemia (ALL), a “first‐dose effect” was identified, whereby CRS symptoms were most severe after the first dose and became less severe with subsequent doses [59]. Step‐up dosing prior to treatment doses was subsequently determined as an effective approach for CRS management [60] and applied during the development of CD20×CD3 bsAbs [8, 16, 17, 46, 47, 48].
Integrated analysis of preclinical data is critical to determine the appropriate step‐up doses to reduce CRS risk in FIH studies. Owing to the concerns around translatability from preclinical species to humans discussed earlier, initial doses tested for these bsAbs (e.g., from 4 to 50 μg) were much lower than the recommended and approved first doses presented on the product labels (e.g., from 0.16 to 2.5 mg) [8, 29, 32, 36, 39, 46, 47, 48, 51, 52, 53]. The use of anti‐CD20 premedications or prophylactic medications (e.g., obinutuzumab, corticosteroid, antihistamine, antipyretic) also played an important role in helping to reduce the risk of CRS mediated by bsAbs [41, 46, 47, 48].
Safety data are used in modeling approaches (e.g., Bayesian or quantitative systems pharmacology [QSP] modeling) to aid selection of step‐up doses in dose escalation [61, 62]. However, it can take many cohorts to determine the final step‐up doses for the first 3 weeks of treatment (16–19 cohorts for the four bsAbs discussed here) [41, 46, 47, 48]. With such efforts, the incidence of grade ≥ 3 CRS was 2.2% with mosunetuzumab in FL, 3.9% with glofitamab in DLBCL, 2.5% with epcoritamab in large B‐cell lymphoma, 1.6% with epcoritamab in FL, and 1.7% with odronextamab in FL or DLBCL in their pivotal trials in R/R patients (Table 2) [7, 8, 9, 10, 11, 12].
TABLE 2.
Approaches to the management of CRS with CD20×CD3 bsAbs, and rates of grade ≥ 3 ICANS.
| Mosunetuzumab (IV) [8, 29, 41, 52] | Glofitamab (IV) [9, 32, 33, 46, 53, 63] | Epcoritamab (SC) [11, 12, 36, 47, 51] | Odronextamab (IV) [7, 10, 38, 39, 48, 64] | |
|---|---|---|---|---|
| Premedication | Yes | Yes | Yes | Yes |
| Step‐up dosing | Yes | Yes | Yes | Yes |
| Approach to escalation of step‐up doses | Informed by safety | Informed by Bayesian model prediction and safety data | Modified BOIN design | 3 + 3 design informed by safety; regimen optimization informed by QSP modeling |
| Initial fixed dose | 0.05 mg | 0.6 mg | N/A | N/A |
| Initial step‐up doses by week | 0.4/1 mg | 2.5/10 mg | 0.004/0.0128 mg | 0.03/0.1 mg |
| Final cycle 1 step‐up regimen by week a | FL: 1/2/60 mg | DLBCL/LBCL: 2.5/10/30 mg with obinutuzumab pretreatment one week prior to first dose |
DLBCL: 0.16/0.8/48 mg FL: 0.16/0.8/3/48 mg |
DLBCL: 0.7/4/20/160 mg FL: 0.7/4/20/80 mg (each with split dosing in Weeks 1–3) |
| Number of cohorts to select the final step‐up regimen | 19 | 16 | 17 | 17 |
| CRS incidence with recommended step‐up dosing in pivotal study (%) | FL: 44.4 | DLBCL: 63.0 |
LBCL: 49.7 FL: 66.4 |
DLBCL: 53.3 FL: 56.7 |
| CRS by grade (1/2/3/≥ 4) with recommended step‐up dosing in pivotal study (%) | FL: 25.6/16.7/1.1/1.1 | DLBCL: 47.4/11.7/2.6/1.3 |
LBCL: 31.8/15.3/2.5/0 FL: 39.8/25.0/1.6/0 |
DLBCL: 40.0/11.7/1.7/0 FL: 45.0/10.0/1.7/0 |
| Any‐grade CRS by week during step‐up dosing in pivotal study (%) | FL: 23.3/5.6/36.4 | DLBCL: 54.5/30.4/26.8 |
LBCL: 5.8/11.8/42.8 FL: 11/6/14/36 |
DLBCL: NYR FL: 23.3/28.6/34.5/18.9 |
| Grade ≥ 3 ICANS (%) | FL: 0 | DLBCL: 1.4 |
LBCL: 0.6 FL: 0 |
DLBCL: 0 FL: 0 |
Abbreviations: BOIN, Bayesian Optimal Interval; bsAb, bispecific antibody; CRS, cytokine release syndrome; DLBCL, diffuse large B‐cell lymphoma; FL, follicular lymphoma; ICANS, immune effector cell‐associated neurotoxicity syndrome; IV, intravenous; LBCL, large B‐cell lymphoma; N/A, not applicable; NYR, not yet reported; obi, obinutuzumab; QSP, quantitative systems pharmacology; SC, subcutaneous.
Cycle 1 step‐up doses are underlined.
3.1. Mosunetuzumab
Comparison of safety data in the fixed‐dose cohorts (0.05–2.8 mg) and step‐up dosing cohorts (starting from 0.4/1/2.8 mg) of the FIH study for mosunetuzumab revealed no dose–response relationship for toxicity in the latter [41, 65]. Further, exposure–response models for safety developed using data from these respective cohorts indicated that cycle 1 step‐up dosing helped to mitigate the positive exposure–response relationship for grade ≥ 2 CRS seen with fixed dosing, allowing escalation to dose levels that were more than 20‐fold higher without reaching the MTD [66]. These data highlight that step‐up dosing is necessary to achieve a higher tolerable treatment dose. Additionally, evaluation of SC administration of mosunetuzumab in patients with NHL demonstrated an improved CRS profile (only grade 1/2 CRS) compared with IV administration [41, 67]; therefore, the SC route of administration is being investigated for the early‐line treatment of NHL (Table S1).
3.2. Glofitamab
Glofitamab has a 2:1 molecular structure that enables a high binding affinity for CD20 on B cells and CD3 on T cells [46], which may trigger excessive cytokine release. To help reduce the risk of CRS, a single 1000 mg dose of obinutuzumab was introduced prior to the first glofitamab dose. An exposure‐response analysis showed a positive relationship between the incidence of grade ≥ 2 CRS and glofitamab average receptor occupancy (RO%) over the first 24 h [68]. Based on collective information and in conjunction with step‐up doses, a starting dose of 2.5 mg glofitamab was achieved with generally manageable CRS events [23, 31, 46].
3.3. Epcoritamab
In contrast to the other three CD20×CD3 bsAbs, which can be administered by IV dosing, epcoritamab is delivered via SC administration only. A preclinical study in cynomolgus monkeys using both IV and SC dosing indicated that the latter is associated with lower peak epcoritamab and cytokine concentrations [34]. Clinically, SC administration in conjunction with step‐up dosing and prophylaxis with corticosteroid and antihistamines aided CRS management [47]. Furthermore, QSP modeling was utilized to understand the occurrence of CRS following administration of epcoritamab in patients with DLBCL [69].
3.4. Odronextamab
CRS management with odronextamab in B‐NHL involves step‐up dosing with split doses [7, 10]. Split dosing has the benefit of reducing the peak concentrations of each step‐up dose, although this does entail additional hospital visits. The step‐up doses were optimized during clinical development using a QSP modeling approach to help mitigate the risk of severe CRS [7, 10, 64].
3.5. Summary
CRS management strategies with CD20×CD3 bsAbs are summarized in Table 2.
Multiple approaches have been applied to improve the management of CRS in patients treated with CD20×CD3 bsAbs, including step‐up dosing, premedication, and SC administration. The most sensitive period for CRS appears to be during the first weeks of treatment, when very low drug concentrations can trigger marked systemic cytokine release [70, 71]. Although weekly step‐up doses can help in managing grade ≥ 3 CRS, CRS can still occur when administering the full treatment dose at Week 3 (e.g., with epcoritamab in large B‐cell lymphoma; Table 2). In this case, adding an additional step‐up week prior to the full dose may help (e.g., with odronextamab, epcoritamab in FL; Table 2). Clinical experience has shown that T‐cell–initiated tumor killing is unaffected by cytokine release and that T‐cell cytolytic activity can be achieved without it. The uncoupling of cytokine release and T‐cell cytolytic activity with CD20 × CD3 bsAbs provides a biologic rationale for step‐up dosing to help mitigate the risk of CRS [70].
4. FIH Dose Escalation and Recommended Phase II Regimen Selection
As discussed, the FIH dose‐escalation strategy for CD20×CD3 bsAbs typically involves step‐up doses before reaching an effective treatment dose to help circumvent CRS. In the clinical development of mosunetuzumab, glofitamab, epcoritamab, and odronextamab, safety data were used to guide dose escalation and identify the recommended dosing regimens for evaluation in phase II studies while minimizing patient exposure to subtherapeutic doses and reducing the risk of CRS [16, 17, 41, 46, 47, 48].
4.1. Determination of Step‐Up Dosing Regimens
As the goal of step‐up dosing is to minimize the risk of severe CRS, the general approach to defining tolerable weekly step‐up doses involves staggered dose escalation, with Week 1 and Week 2 doses fixed at doses that have been deemed tolerable in prior escalation cohorts. For example, if a dose was tolerable with limited grade ≥ 3 CRS in previous cohorts, that dose can be selected for Week 1 while continuously escalating Week 2 and Week 3 doses until a prespecified safety limit for Week 2 is met. A similar approach can be applied to the selection of the Week3 dose, if applicable. Weekly step‐up dosing in cycle 1 was adopted for all four CD20×CD3 bsAbs [41, 46, 47, 48].
The number of step‐up doses prior to the treatment dose was also tested for each of the CD20×CD3 bsAbs. A two‐step step‐up regimen was selected for mosunetuzumab and glofitamab, and a three‐step regimen was selected for odronextamab; for epcoritamab, two‐ and three‐step regimens were selected for DLBCL and FL, respectively [41, 46, 47, 48].
A translational QSP model of mosunetuzumab using preclinical data and validated using blinatumomab clinical data in R/R ALL predicted that initial step‐up dosing would help mitigate CRS risk without compromising tumor response [72]. For glofitamab, an exposure‐safety model of grade ≥ 2 CRS used the data from fixed‐dose cohorts to inform the selection of 2.5 mg as the starting step‐up dose [68]. An additional step‐up dose of 0.5 mg, prior to 2.5 mg, was also explored but CRS mitigation was not substantially improved, likely due to the pretreatment effect of obinutuzumab [33].
A QSP model that was used to help identify the optimal step‐up regimen for epcoritamab was reported [69], but whether it was used to prospectively inform step‐up dosing is unclear. In the EPCORE NHL‐1 study (NCT03625037) underpinning the first regulatory approval of epcoritamab in DLBCL, a two‐step step‐up regimen (0.16/0.8 mg) was selected, with reported grade 3 CRS in 2.5% of patients [12]. In the subsequent approval of epcoritamab in FL, three step‐up doses (0.16/0.8/3 mg) were selected, which had shown no grade 3 CRS in clinical testing [11]. Adding a third step‐up dose was informed by a repeated time‐to‐event model using monotherapy PK and CRS data from the EPCORE NHL‐1 study [73].
The development of odronextamab involved the optimization of step‐up doses via a QSP modeling approach using IL‐6 data from the FIH study [64, 74]. The impact of various IV step‐up regimens, including two to four step‐up periods with or without dose splitting, on IL‐6 concentration–time profiles was evaluated via simulation, and the results were compared to optimize step‐up dosing [64]. The three‐step approach (0.7/4/20 mg) with dose splitting in Weeks 1–3 reduced odronextamab exposure and IL‐6 concentrations in cycle 1 [64, 74]. Upon further evaluation, the three‐step approach resulted in fewer grade ≥ 3 CRS events compared with the original two‐step 1/20 mg regimen (in 1.7% and 5.9% of patients with FL, respectively) [10].
As discussed earlier, CRS mitigation strategies have been shown to enable escalation to higher doses while improving tolerability. The tolerability of these bsAbs appears to be associated with the rate of increase in exposure provided by step‐up dosing, with weekly step‐up doses optimized according to observed safety. With step‐up dosing, effective treatment doses were achieved for all four CD20×CD3 bsAbs without reaching the MTDs [16, 17, 41, 46, 47, 48].
4.2. Strategy of Dose Escalation to Full Dose
The strategy of dose escalation to the full dose is similar for CD20×CD3 bsAbs and non‐bispecific monoclonal antibodies, and is usually based on safety assessment by cohort. Bayesian Optimal Interval (BOIN) designs are model‐assisted dose‐finding designs used in some clinical trials to determine the MTD or optimal biologic dose based on safety and/or efficacy data [75]. BOIN designs consist of accelerated titrations (100% increase in dose increment between successive patient cohorts) and provide improved flexibility compared with 3 + 3 designs [76, 77].
For mosunetuzumab and glofitamab, dosing schedules of once every 2 weeks (Q2W) and/or once every 3 weeks (Q3W) were initially evaluated, allowing longer safety evaluation periods than weekly step‐up dosing [41, 46].
4.3. Dose Escalation and Determination of Recommended Phase II Regimens
4.3.1. Mosunetuzumab
Following initial selection of the 1/2/13.5 mg regimen in patients with R/R B‐NHL, higher doses of mosunetuzumab continued to be tested in dose escalation [41]. More than one dose level and schedule were evaluated in interim expansion cohorts (up to approximately 20 patients per cohort) to allow robust population‐PK and exposure‐response assessments, which informed the final phase II regimen of 1/2/60/60/30 mg (Table 3). Two 60 mg loading doses were used to induce initial tumor debulking, and the 30 mg dose in subsequent cycles maintained RO% [41]. Average CD20 RO%, a novel metric based on the serum drug concentration and binding affinities of both mosunetuzumab and rituximab (which thus accounts for the presence of residual rituximab at baseline in patients with prior rituximab treatment) was identified as the strongest exposure‐based metric when compared with mosunetuzumab dose and standard exposure metrics (AUC and C max) to characterize exposure–response relationships for mosunetuzumab efficacy and safety [41, 78]. The recommended dosage of 1/2/60/60/30 mg for the treatment of FL was supported by a positive exposure–response relationship for efficacy based on CD20 RO% over 42 days, which plateaued at 60 mg, and exposure‐independent safety profiles [30, 41]. The final exposure‐response models supported parameters of AUC (0–42 days) and CD20 RO% (0–42 days) for efficacy and CRS, respectively [30, 66].
TABLE 3.
Summary of FIH dose escalation, phase II regimen selection, response rates, and approvals for CD20×CD3 bsAbs.
| Mosunetuzumab [8, 29, 41, 52, 66, 78] | Glofitamab [9, 32, 46, 68, 79] | Epcoritamab [11, 36, 37, 47, 51, 80, 81, 82, 83] | Odronextamab [7, 10, 39, 48, 84] | |
|---|---|---|---|---|
| Dose range evaluated and MTD |
0.05–2.8 mg IV Q3W fixed dosing 0.4–60 mg IV with step‐up dosing MTD not reached |
0.005–25 mg IV fixed dosing in 14‐ or 21‐day cycles; MTD 25 mg 2.5–30 mg IV QW with step‐up dosing; MTD not reached |
0.0128–60 mg SC QW with step‐up dosing MTD not reached |
0.1–320 mg IV QW with step‐up dosing MTD not reached |
| Strategy for phase II regimen selection | Population‐PK and E‐R modeling for efficacy and safety based on CD20 RO% and/or AUC | Population‐PK and E‐R modeling for efficacy and safety based on CD20 RO% and/or AUC |
Population‐PK and E‐R modeling for efficacy based on cycle 1 AUC E‐R model for safety based on weekly C max |
Population‐PK and E‐R models for efficacy based on C min at first tumor assessment E‐R model for safety based on weekly C max |
| Approved regimen a |
R/R FL: 1/2/60 mg IV (C1: D1, D8, D15) 60 mg IV (C2: D1) 30 mg IV (≥ C3: D1) |
R/R DLBCL/LBCL: Obi 1000 mg IV pretreatment (C1: D1) 2.5/10 mg IV (C1: D8 and D15) 30 mg IV (C2–12: D1) |
R/R DLBCL/LBCL b : 0.16/0.8/48 mg (C1: D1, D8, D15) 48 mg QW (C2–3) 48 mg Q2W (C4–9) 48 mg Q4W (≥ C10) FL b : 0.16/0.8/3/48 mg (C1: D1, D8, D15, D22) 48 mg QW (C2–3) 48 mg Q2W (C4–9) 48 mg Q4W (≥ C10) |
R/R DLBCL: 0.7/4/20 mg QW (C1) 160 mg QW (C2–4) 320 mg Q2W (maintenance) and then 320 mg Q4W if CR ≥ 9 months FL: 0.7/4/20 mg QW (C1) 80 mg QW (C2–4) 160 mg Q2W (maintenance) and then 160 mg Q4W if CR ≥ 9 months |
| ORR (%) | FL: 80.0 | DLBCL: 56.1 |
LBCL: 60.8 FL: 82.0 |
DLBCL: 52.0 FL: 80.5 |
| Approval date |
R/R FL: USA, December 2022 EU, June 2022 |
R/R DLBCL: USA, June 2023 EU, July 2023 |
R/R DLBCL: USA, May 2023 EU, September 2023 R/R FL: USA, June 2024 EU, August 2024 |
R/R DLBCL and R/R FL: EU, August 2024 |
Abbreviations: AUC, area under the concentration–time curve; bsAb, bispecific antibody; C, cycle; C max, maximum concentration; C min, minimum concentration; CR, complete response; D, Day; DLBCL, diffuse large B‐cell lymphoma; E‐R, exposure‐response; FIH, first‐in‐human; FL, follicular lymphoma; IV, intravenous; LBCL, large B‐cell lymphoma; MTD, maximum tolerated dose; ORR, objective response rate; PK, pharmacokinetics; QW, once per week; QxW, every x weeks; R/R, relapsed or refractory; RO%, receptor occupancy; SC, subcutaneous.
21 days per cycle unless specified.
28 days per cycle.
4.3.2. Glofitamab
Similar to mosunetuzumab, CD20 RO% was leveraged in exposure‐response assessments for glofitamab, accounting for both glofitamab and obinutuzumab concentrations and binding affinities to aid phase II regimen selection [85]. An established obinutuzumab population‐PK model was used to estimate glofitamab RO% in the presence of obinutuzumab, which competes for CD20 receptors. Following fixed‐dose escalation of glofitamab (0.005–25 mg, Q2W or Q3W, with obinutuzumab 1000 mg pretreatment), logistic regression analyses demonstrated a significant positive exposure–response relationship between average RO% and efficacy (objective response rate [ORR] and CR up to the first tumor assessment in cycle 3, as well as between average RO% and grade ≥ 2 CRS in the first 24 h. This analysis suggested an initial step‐up regimen of 10/16 mg Q3W, which achieved an average RO% up to cycle 3 (0.466%) corresponding to an anticipated CR rate at cycle 3 (43.6%) that was in line with the observed rate in the 10/16 mg Q3W dosing cohorts [85]. Subsequently, two step‐up regimens were studied in dose‐escalation cohorts, 2.5/10/16 mg and 2.5/10/30 mg, with escalation up to 30 mg maximizing efficacy and minimizing CRS risk [68]. Selection of the phase II regimen of 2.5/10/30 mg with obinutuzumab pretreatment for DLBCL (Table 3) was supported by durable CRs in patients treated with this regimen, and CRS that was mostly low grade and generally manageable with a predictable time of onset [9, 46]. In final population‐PK and exposure‐response analyses, AUC in cycles 1–2 was identified as a strong predictor for efficacy [33].
4.3.3. Epcoritamab
The recommended phase II regimen for epcoritamab (0.16/0.8/48 mg) was initially selected based on a novel semi‐mechanistic physiologically based PK/PD model for efficacy that was developed to describe biodistribution, target binding (trimer formation), and tumor response using preclinical, clinical PK, biomarker, tumor size/growth, and response data from the dose‐escalation part of the FIH study (N = 67; dose range 0.0128–60 mg) [86]. The model predicted 48 mg to be the biologically effective dose associated with optimal trimer formation and clinical response rates [86]. The effect was predicted to plateau at 48–96 mg and to decrease at doses > 192 mg due to the “hook effect”, although the highest dose tested clinically was 60 mg in the EPCORE NHL‐1 trial [47, 86]. An initial exposure‐safety analysis was conducted using a logistic regression model to assess the relationship between epcoritamab C max and CRS risk after each weekly dose for the first 4 weeks (0.16/0.8/48/48 mg) [86]. A flat exposure‐safety relationship was demonstrated between epcoritamab exposure and risk of CRS in the dose range evaluated, supporting the initial selection of 48 mg as the recommended phase II dose [86]. Integrated analyses of population‐PK and exposure‐response for efficacy and safety based on cycle 1 AUC were subsequently conducted, which also supported the 0.16/0.8/48 mg regimen for registrational studies [37]. The ORR with epcoritamab 48 mg was similar to that of the other bsAbs approved for DLBCL (Table 3).
4.3.4. Odronextamab
The recommended phase II dosing regimens of odronextamab for FL (80 mg) and DLBCL (160 mg) were initially selected based on population‐PK and exposure‐response analyses of clinical response (ORR) using data from patients with FL (N = 40) or DLBCL without prior CAR‐T therapy (N = 38) enrolled in the dose‐escalation phase of the FIH study, where a broad dose range (0.1–320 mg) was explored (Table 3) [48]. Compared with other exposure metrics evaluated (AUC, C max), the predicted minimum concentration (C min) at Week 12 (the time of first tumor assessment) provided the strongest correlation with clinical response in FL and DLBCL [48]. Selection of different phase II regimens for FL and DLBCL was justified by the difference in steepness of exposure‐response curves [48], likely due to variations in disease progression in indolent and aggressive NHL. Furthermore, patients with DLBCL treated with the 160 or 320 mg once‐per‐week dosing regimen in the pivotal phase II ELM‐2 study (NCT03888105) had similar progression‐free survival [87], supporting selection of the 160 mg dose. Exposure‐safety analyses of odronextamab in FL and DLBCL did not show a dose‐dependent relationship between C max and selected safety endpoints of interest (including grade ≥ 3 treatment‐emergent adverse events, CRS, and infections) [88].
4.4. Summary
Although there are no head‐to‐head clinical trials comparing these treatments, clinical response rates for FL or DLBCL appear to be numerically similar across these bsAbs [7, 8, 9, 10, 11, 12] despite differences in design, analysis approaches, selected exposure metrics (i.e., CD20 RO%, cycle 1 AUC, or C min at Week 12), and recommended doses. Interestingly, phase II regimens selected using data from dose‐escalation cohorts of FIH studies and final recommended regimens are similar [41, 46, 47, 48], indicating that early exposure‐response analyses with dose‐escalation data were appropriate and predictive of the results in dose‐expansion or phase II studies. None of the exposure‐safety analyses at the recommended doses showed dose‐dependent relationships [37, 86, 88]. A novel application of CD20 RO% was used in exposure‐response analyses for mosunetuzumab and glofitamab [78, 85].
Enhanced biologic and pharmacologic understanding gained from developing CD20‐targeting agents and drug combinations for the treatment of NHL may have facilitated an effective dosing strategy for mosunetuzumab and glofitamab. Translational systems and QSP models have also helped to deepen knowledge of the complex pharmacology of T‐cell–engaging bsAbs [69, 89] and could serve as complementary approaches to support phase II regimen selection.
5. Application of Modeling and Simulation Approaches to Clinical Development
CD20×CD3 bsAb modeling activities have addressed dose selection and drug–drug interactions (DDIs) [16, 17, 31, 72, 86, 90, 91, 92, 93]. Regarding dose selection, the final dose(s) implemented as part of a step‐up regimen were considered. Studies addressing DDIs focused on the influence of IL‐6 release on cytochrome P450 (CYP) enzymes and metabolites thereof [31, 72, 86, 90, 91, 92, 93].
5.1. Mosunetuzumab
A mechanistic QSP model was developed to simulate B‐ and T‐cell dynamics and emulate cytokine release and thus aid dose selection for mosunetuzumab in patients with NHL [72]. The model included representations of resting, activated, and post‐activated T cells, including proliferation and apoptosis of antigen‐expressing cells, enabling simulation of the effects of changing T‐cell and target‐cell abundance. The model was first applied to cynomolgus monkeys treated with mosunetuzumab and then translated to patients with ALL to evaluate IL‐6 levels and antitumor efficacy. The human model was scaled so that changes in tumor size and IL‐6 concentration in the simulated virtual population matched those of a patient population treated with blinatumomab, a CD3×CD19 antibody with similar T‐cell activation to mosunetuzumab. Fractionated step‐up doses were predicted to reduce the risk of systemic cytokine release with minimal impact on antitumor efficacy. Validating the model predictions, simulations showed that the predicted IL‐6 peak values following a range of initial mosunetuzumab doses in the virtual population generally matched those observed following the first dose of mosunetuzumab in patients with NHL, except for a single patient who exhibited IL‐6 levels an order of magnitude higher than those predicted by the model [72]. Given that high cytokine levels are correlated with CRS [94, 95, 96, 97], it will be crucial to determine whether high IL‐6 expression is reproduced in a larger population.
The QSP model was also used to predict the dose–response relationship in a virtual trial [89]. Following the initial GO29781 clinical trial for mosunetuzumab, virtual twins were generated for 140 participants, whereby an instance of the model was generated to match with each patient. The response of each virtual twin was simulated for different dosing regimens, and the aggregate results were used to generate a virtual population that reflected the population studied in the initial clinical trial. Simulations predicted that an increase in mosunetuzumab exposure would increase the proportion of digital twins with a ≥ 50% reduction in tumor size by day 42. Simulations also predicted that lower mosunetuzumab exposure would be required to exhibit similar tumor size reduction in indolent compared with aggressive NHL. In addition to tumor‐related model parameters, T‐cell infiltration and expansion were identified as key determinants of response [89].
A physiologically based PK (PBPK) model was used to predict the potential for DDIs between mosunetuzumab and CYP3A substrates [90]. Although DDIs are not typically expected with monoclonal antibodies [98], elevated IL‐6 levels caused by mosunetuzumab could indirectly lead to DDIs. To address this concern, a PBPK model was used to simulate the effect of elevated IL‐6 on substrates of CYP3A (the CYP enzyme most sensitive to elevated IL‐6) [90, 91]. Midazolam and simvastatin were selected as representative CYP3A substrates sensitive to IL‐6 [99, 100], and their default PBPK models in the Simcyp compound library (Simcyp V17) were used [90]. The model was validated against clinical data for patients with rheumatoid arthritis who received either drug. To predict potential DDIs with mosunetuzumab, IL‐6 profiles calibrated to patients given the proposed mosunetuzumab dose were applied to the PBPK model. The C max and AUC ratios of midazolam in the presence and absence of IL‐6 elevation were predicted to be < 1.25‐ and 1.5‐fold, respectively, suggesting a low risk of drug interaction caused by transient IL‐6 elevation at the mosunetuzumab clinical dose in R/R FL [90].
5.2. Glofitamab
A PK/PD model with cytokine release as the output was used to recommend a FIH dose for glofitamab [31]. The model included B‐cell abundance in the blood as a measure of target burden, along with three transfer compartments and an indirect‐response model for the effect of glofitamab concentration on cytokine release. The model was first calibrated using data from humanized mice and cynomolgus monkeys and then allometrically scaled to model human responses. PD parameters related to IL‐6, interferon‐γ, and tumor necrosis factor‐α release were scaled from cynomolgus monkeys to humans based on in vitro cytokine release assays [31]. IL‐6 release was the most sensitive endpoint of the three cytokines and, as high IL‐6 levels are related to CRS [94, 95, 96, 97], the FIH dose was defined based on IL‐6 release; a dose was selected that would lead to a maximal IL‐6 release in blood predicted to be below 600 pg/mL in 95% of patients following glofitamab administration [31]. Model simulations showed that glofitamab 50 μg led to a maximum IL‐6 peak below 670 pg/mL in 95% of patients. However, because patients with cancer have an additional target burden compared with cynomolgus monkeys, a 10‐fold safety factor was applied before selecting the final FIH starting dose of 5 μg [31].
A minimal PBPK model implemented using the Simcyp Simulator (version 20) was used to predict the potential for DDIs with glofitamab [92]. The CYP probe substrate models used were standard, unmodified library models provided by the simulator. An empirical model for the effect of IL‐6 on CYP enzymes in the liver was developed using in vitro data generated by treating hepatocytes with IL‐6. The input for the PBPK model comprised IL‐6 kinetics roughly approximating IL‐6 profiles observed in patients administered the proposed glofitamab dosing regimen, grouped according to the magnitude of their observed IL‐6 profile (high, medium, low). Following simulated IL‐6 administration, the maximum mean suppression varied from 3.07% to 46.2% for CYP3A4, from 0.215% to 19.9% for CYP1A2, and from 1.43% to 37.3% for CYP2C9 in the virtual North European White population. Simulations predicted the effect of CYP inhibition on various CYP‐metabolized drugs, including simvastatin, midazolam, caffeine, theophylline, and S‐warfarin. In the low IL‐6 group, simulated drug exposure increased marginally with increased IL‐6 levels (maximum 1.03‐fold change in AUC). In the medium IL‐6 group, the AUC of simvastatin and midazolam increased ~1.3‐fold; other substrates were affected only marginally. In the high IL‐6 group, simulations resulted in mean predicted AUC ratios of ≤ 1.73‐ and ≤ 1.75‐fold for the CYP3A4 substrates simvastatin and midazolam, respectively, ≤ 1.19‐ and ≤ 1.05‐fold for the CYP1A2 substrates caffeine and theophylline, and ≤ 1.09‐fold for the CYP2C9 substrate S‐warfarin. This suggests that drugs predominantly metabolized by CYP3A4 enzymes have the highest susceptibility to DDI‐mediated suppression induced by IL‐6 at levels increased transiently above 1000 pg/mL. In summary, the simulations suggested that the magnitude of the suppressive effect of transient IL‐6 increase on hepatic CYP enzyme activities is moderate, even in patients that exhibit the highest levels of IL‐6 release following glofitamab administration [92].
5.3. Epcoritamab
A semi‐mechanistic, physiologically based PK/PD model was developed to guide the selection of the phase II regimen for epcoritamab [86]. The model includes several submodels, including those describing epcoritamab PK, lymphocyte trafficking and turnover, epcoritamab binding, T‐cell activation, circulating B‐cell killing, and tumor killing. The model was first calibrated to data collected from cynomolgus monkeys treated with epcoritamab, then translated to humans. The human model was developed using direct or allometrically scaled parameter values from monkeys. Other parameters for the human model were based on published human‐relevant values from in vitro and clinical data. The PK submodel was fitted to clinical PK data using nonlinear mixed‐effects modeling. Simulations showed that trimer formation between T cells, epcoritamab, and B cells was maximized at full doses ranging from 48 to 96 mg (suggesting that this is the optimal dose range) and started to decrease at simulated doses of 192 mg. Simulation of predicted clinical response rates reflected the prediction that they would be highest across the dose range of 48–192 mg. A logistic regression model was used to assess the relationship between CRS risk (after priming, intermediate, and first/second full doses of epcoritamab) and the C max of epcoritamab during the respective dosing interval, revealing no clear relationship between exposure and CRS. Thus, the model supports the recommended phase II regimen of 48 mg [86].
5.4. Odronextamab
The step‐up regimen for odronextamab was optimized during its clinical development to reduce the frequency/severity of CRS events [48, 74] based on the results of a mechanistic cytokine model [93]. The model comprised a PK module including target‐mediated degradation, odronextamab target‐cell interactions, and B‐cell proliferation and death, as well as T‐cell activation and subsequent cytokine release. The cytokine release model also included negative feedback mechanisms that attenuated further cytokine release [101, 102].
This model reproduced the magnitude and the temporal variability of cytokine peaks in patients treated with odronextamab, and was used to interrogate the relationship between different step‐up doses [38, 93]. Model simulations showed that lower doses during Week 1 or Week 2 may increase cytokine release following the same doses given in Week 2 or Week 3, respectively. Considering the goal of step‐up dosing was to help management of cytokine release and to reduce peaks, the modeling results led to a proposed step‐up regimen that focused on cytokine levels and time to full dose in patients with B‐cell lymphoma. Following implementation of this step‐up regimen, model predictions were validated using clinical data, indicating general agreement with clinical results [93].
5.5. Summary
Across the four bsAbs covered here, simulation and modeling approaches have proved valuable in dose selection for clinical studies. The models have typically been used to predict key efficacy (e.g., response rate) and safety (e.g., CRS risk) outcomes, factoring in variables that affect these measures. Such variables include the effect of the bsAb on immune cell levels and activation, tumor volume, and cytokine release. The type of models used varied between the bsAbs (QSP model for mosuntezumab, PK/PD models for glofitamab and epcoritamab, and a mechanistic model for odronextamab), as did the complexity of the models.
In addition to modeling efficacy and safety outcomes, simulations have also provided insight into DDIs. Here, PBPK models have been used to predict the impact of IL‐6 changes on CYP enzyme activity. In all cases, simulations based on preclinical data must be scaled for application to human subjects and should be validated in large clinical studies.
6. Clinical Development Strategy and Dose Optimization
All four bsAbs discussed in this review have obtained accelerated or conditional regulatory approvals for the treatment of R/R FL (mosunetuzumab), R/R DLBCL (glofitamab), or both (epcoritamab, odronextamab) [29, 32, 36, 39, 51, 52, 53]. Mosunetuzumab is approved in the USA and in the European Union as LunsumioTM to treat R/R FL after ≥ 2 lines of systemic therapy [29, 52]. Epcoritamab is approved in the USA (as EpkinlyTM) and in the European Union (TepkinlyTM) to treat R/R FL or DLBCL after ≥ 2 lines of systemic therapy [36, 51]. Glofitamab is approved in the USA and in the European Union as ColumviTM to treat R/R DLBCL after ≥ 2 lines of systemic therapy [32, 53]. Odronextamab is approved in the European Union as OrdsponoTM to treat R/R FL or DLBCL after ≥ 2 lines of systemic therapy, but its safety and efficacy have not been fully evaluated by any other regulatory authority [39]. Here, the clinical development strategies for the four bsAbs are discussed. Details of clinical trials for these bsAbs were obtained from ClinicalTrials.gov (Table S1); trial numbers by developmental phase and patient enrollment numbers are summarized in Table 4. These studies are sponsored by either the pharmaceutical companies or academic collaborative centers.
TABLE 4.
Summary of number of trials and enrollment numbers by phase for clinical trials of CD20×CD3 bsAbs in patients with B‐cell lymphoma a .
|
Total number of trials Total number of patients in any trial (min, max) b |
||||||
|---|---|---|---|---|---|---|
| Phase I | Phase I/II | Phase II | Phase II/III | Phase III | Total | |
| Mosunetuzumab c | 6 | 7 | 18 | 0 | 5 | 36 |
| 429 | 1798 | 1446 | 2346 | 6019 | ||
| (15, 200) | (8, 836) | (20, 396) | (222, 790) | |||
| Glofitamab c | 9 | 9 | 24 | 0 | 3 | 45 |
| 579 | 1909 | 1383 | 1582 | 5453 | ||
| (18, 172) | (27, 860) | (22, 178) | (182, 1130) | |||
| Epcoritamab | 4 | 9 | 15 | 0 | 5 | 33 |
| 91 | 2481 | 1124 | 3352 | 7048 | ||
| (15, 30) | (38, 666) | (20, 284) | (320, 1080) | |||
| Odronextamab | 3 | 0 | 1 | 1 | 5 | 10 |
| 353 | 576 | 210 | 2801 | 3940 | ||
| (62, 200) | (216, 904) | |||||
Abbreviation: bsAb, bispecific antibody.
Enrollment numbers reflect ClinicalTrials.gov pages as of November 20, 2024, regardless of whether studies were ongoing, completed, or terminated. Withdrawn studies were not included. Some studies investigated more than one bsAb.
Min: the smallest study in terms of the number of patients planned; max: the largest study in terms of the number of patients planned.
In two phase Ib studies (NCT04313608, NCT04970901) and one phase II study (NCT04889716), mosunetuzumab and glofitamab were both studied, which are counted under mosunetuzumab only for simplicity.
6.1. Clinical Trial Planning
As shown in Table 4, more phase I–II studies have been conducted with mosunetuzumab [43], glofitamab [50], and epcoritamab [41] than with odronextamab [4]. Although phase I–II studies tend to be small (often < 50 patients), the total number of patients across all of phase I–II is larger than in the phase III studies for mosunetuzumab, glofitamab, and epcoritamab. Many phase Ib and II studies are designed to address specific questions and may be used to assess monotherapy in different lines of treatment, specific patient groups, or geographic regions; different routes of administration; or combination with standard of care or novel therapies. Small studies with a simple design can be advantageous in allowing rapid generation of information to support confirmatory phase III studies.
The approach to clinical development for odronextamab was different from those of the other three bsAbs. Fewer phase I and II studies were conducted with odronextamab (Table 4), and within those that were had multiple treatment cohorts for different NHL subtypes (Table S1). Variations in patient population and study intervention (e.g., combination therapies) are being evaluated in phase III studies. Despite the total number of studies with odronextamab being three times smaller than those with mosunetuzumab, glofitamab, or epcoritamab, the total number of patients planned for inclusion in odronextamab studies equates to more than half of those for each of the other three bsAbs.
6.2. Impact of Project Optimus on bsAb Clinical Trials
Project Optimus is an initiative from the FDA Oncology Center of Excellence that was published in 2024, the objective of which is to improve dose optimization and selection by maximizing the benefit‐to‐risk ratio of cancer treatment [103]. The comparison of multiple doses in randomized, parallel‐group, dose–response trials is generally recommended [104].
6.2.1. Mosunetuzumab
Following identification of the recommended phase II regimen in the FIH study, as of November 2024, 31 phase I–II studies have been initiated to assess the safety, tolerability, and efficacy of mosunetuzumab according to route of administration (IV/SC), combination with other therapies (yes/no), and different disease and treatment settings. For instance, a phase I/II study of IV and SC mosunetuzumab‐lenalidomide in R/R FL (NCT04246086) provided evidence to support the dose selection and route of administration used in the confirmatory phase III trial of IV mosunetuzumab‐lenalidomide versus rituximab‐lenalidomide in R/R FL (NCT04712097). Similarly, data from a phase I/II study of two mosunetuzumab SC regimens (5/15/45 mg vs. 5/45/45 mg) in R/R B‐NHL (NCT02500407), as well as a small (n = 52) phase II study of mosunetuzumab SC plus lenalidomide in first‐line FL (NCT04792502), supported selection of the optimal treatment regimen and population for a phase III study of mosunetuzumab SC in first‐line FL (NCT06284122).
6.2.2. Glofitamab
Since the identification of the recommended phase II regimen, 41 phase I–II studies have opened from 2018 onwards to evaluate glofitamab in combination with other therapies (Table S1). Results from these studies supported phase III trial designs. For instance, prior to initiating a confirmatory phase III trial of triple‐combination glofitamab‐gemcitabine‐oxaliplatin in R/R DLBCL (NCT04408638), a phase Ib study (NCT04313608) in 23 patients provided safety and efficacy data for the combination. Results from phase I–II trials may help guide the selection of study conditions or drug combinations in further studies but do not always lead to confirmatory phase III trials.
6.2.3. Epcoritamab
Six phase I/II trials of epcoritamab were initiated between 2020 and 2022 after phase II regimen identification in the FIH study, with epcoritamab administered as early‐line treatment, monotherapy, or in combination with existing therapies. The combination studies included dose escalation to assess safety and tolerability and dose expansion to assess efficacy and confirm the chosen phase II regimen. Results from these studies were used as a basis for designing the phase III confirmatory trial in R/R DLBCL (EPCORE DLBCL‐1, NCT04628494). Potentially guided by Project Optimus, two dose levels of epcoritamab in combination with rituximab and lenalidomide as treatment for second‐line R/R FL were included in an ongoing phase III study, and these cohorts are continuously enrolling based on emerging safety and efficacy data (EPCORE FL‐1, NCT05409066).
6.2.4. Odronextamab
Most phase III studies for odronextamab were initiated from 2023 onwards. In alignment with Project Optimus, and following CRS occurrence with an initial 1/20 mg step‐up regimen, the step‐up doses were optimized during clinical development to a 0.7/4/20 mg regimen [10]. Ongoing phase III studies of odronextamab in combination with other therapies include dose escalation for safety assessment in Part 1A and two randomized regimens for dose optimization in Part 1B, prior to initiation of Part 2 randomization (OLYMPIA‐2, NCT06097364; OLYMPIA‐3, NCT06091865) [105, 106].
6.3. Summary
The use of phase I–II studies to select dose regimens, drug combinations, and patient populations for phase III studies appears to be effective, reducing the operational complexity and potential cost of having to address such questions in a phase III trial. As shown in Table 4, the total number of patients evaluated in phase I–II studies might exceed the phase III total, despite the small size of the individual phase I–II studies. Furthermore, the selection of patients with R/R disease, including those who have received two or more lines of prior treatment, for confirmatory phase III trials may be advantageous, as survival readouts (e.g., overall survival, progression‐free survival) might be obtained sooner than in the first‐line treatment setting.
7. Discussion
Various clinical development approaches for CD20×CD3 bsAbs in the treatment of B‐NHL have been reviewed, with insights provided on translational assessment to select starting doses in FIH studies; CRS management; dose escalation and phase II regimen optimization/selection, including application of modeling and simulation strategy; and strategies for clinical trial planning.
In vitro cytotoxicity, T‐cell activation, and cytokine release assays, as well as the EC50 values generated from these bsAbs, were used for MABEL estimations to select a FIH starting dose [27, 31, 35, 38]. This approach led to a much lower starting dose than the final starting dose as determined via dose escalation in patients. With the assistance of PK/PD or QSP modeling to understand the effect of target engagement and T‐cell activation on cytokine release in patients [31, 69], selection of an appropriate FIH starting dose similar to the actual starting dose may be plausible. Data from mouse models evaluating the antitumor activities of the bsAbs also helped define efficacious doses for testing in patients [28, 34, 38]. To accelerate dose escalation from the MABEL‐based starting dose to RP2D regimen determination, a next‐generation MABEL approach can be an alternative to support a higher starting dose, as explained in a white paper of industry perspective on clinical pharmacology strategies to support clinical development of oncology T‐cell‐engaging bispecifics [21]. For instance, cytokine release data from relevant animal models can be translated to humans via a modeling framework to estimate a starting dose at which cytokine peaks are predicted to be below a predefined threshold in patients. The projected starting dose needs to be further adjusted by a safety margin to compensate for potential cytokine release from tumors in patients.
Step‐up dosing during the first cycle of T‐cell–engaging bsAb therapy is an effective approach in helping CRS management; administration of mosunetuzumab with appropriate implementation of step‐up dosing was able to limit CRS severity to grade ≤ 2 in phase I/II clinical studies [41, 67]. Furthermore, selected premedication may shorten or eliminate the required hospital stay for monitoring CRS in patients. SC administration along with step‐up dosing and prophylaxis aided CRS management in patients treated with epcoritamab [47]. Use of exposure‐CRS or QSP modeling and simulation enabled comparison of predicted CRS incidence with proposed regimens and thus selection of optimal step‐up doses for clinical evaluation [64, 66, 68, 69, 72, 74]. This approach can improve clinical trial efficiency by limiting the number of step‐up dosing regimens tested. Despite demonstrated success of applying QSP modeling strategies for step‐up regimen optimization, a critical question involves the generalizability of a given model‐based strategy for future trial designs. More specifically, does a model calibrated to data generated using a specific antibody in a specific patient population provide any insight into a different antibody or different patient population? It is tempting to speculate that some general principles may be gleaned from these studies (i.e., effectiveness of split dosing for reducing CRS) but caution must also be applied when making quantitative predictions regarding, for example, the magnitude of dose increase in subsequent step‐up doses, or extrapolations such as transferring learnings from one patient population to another. Careful, mechanism‐based extension of the existing models to include key variables such as immune state and target‐cell accessibility will help to gain confidence in the generalizability of QSP approaches for optimizing step‐up dosing.
Initial phase II regimens identified for CD20×CD3 bsAbs based on data from dose‐escalation phases of FIH studies appeared appropriate, as further testing of the selected regimens in phase I/Ib/II studies as monotherapy or in drug combinations did not result in regimen changes. Importantly, the final approved phase II regimens were selected through exposure‐response analyses of efficacy and safety using data from all dose levels evaluated [30, 41, 48, 85, 86, 88] providing a complete spectrum of responses over a wide concentration range (up to 5 log units). Translational system and QSP models for describing the complex pharmacology of T‐cell–engaging bsAbs serve as complementary approaches to support the recommendation of a phase II regimen [69, 89].
Strategies in clinical trial planning may affect the speed of data collection, the value of the acquired data for informing data‐driven decision making, and therefore the timing of regulatory submissions. Conduct of multiple, focused phase I/Ib/II studies in parallel immediately after identification of a phase II regimen appears to be effective in obtaining the required data to initiate phase III confirmatory studies as quickly as possible (Figure 1) [107]. Phase III confirmatory studies in patients with ≥ 2 prior lines of therapy (vs. testing in the first‐line setting) could facilitate a shorter full approval timeline, as event outcomes (e.g., progression‐free survival, overall survival) are likely to be reached sooner in patients with relapsed or refractory disease, as well as lower developmental costs.
FIGURE 1.
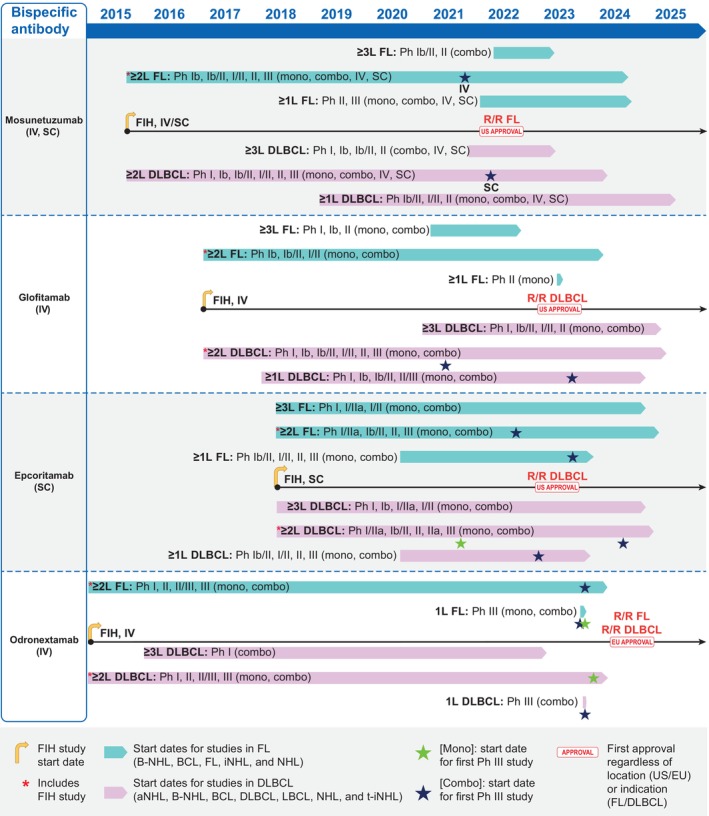
Schematic representation of the clinical development pathways for mosunetuzumab, glofitamab, epcoritamab, and odronextamab. Start dates of studies refer to the dates on which the first participant was enrolled (actual date) or was expected to enroll (expected date), as reported on ClinicalTrials.gov (accessed November 20, 2024) and summarized in Table S1. Studies in the ≥ 1 L rows include those whose inclusion criteria allowed patients with a minimum of no prior lines of therapy; those in the ≥ 2 L rows had criteria that allowed patients with a minimum of one prior line of therapy, and those in the ≥ 3 L rows had criteria that allowed patients with a minimum of two prior lines of therapy. Ph III studies represented by a star symbol are those sponsored by the pharmaceutical company responsible for each molecule. 1 L, first‐line; aNHL, aggressive non‐Hodgkin lymphoma; BCL, B‐cell lymphoma; B‐NHL, B‐cell non‐Hodgkin lymphoma; combo, combination therapy; DLBCL, diffuse large B‐cell lymphoma; EU, European Union; Fc, fragment crystallizable; FIH, first‐in‐human; FL, follicular lymphoma; iNHL, indolent non‐Hodgkin lymphoma; IV, intravenous; LBCL, large B‐cell lymphoma; mono, monotherapy; NHL, non‐Hodgkin lymphoma; NS, (route of administration) not specified; Ph, phase; R/R, relapsed/refractory; SC, subcutaneous; t‐iNHL, transformed indolent non‐Hodgkin lymphoma; US, United States; ≥ 1/2/3 L, first‐/second‐/third‐line plus therapy.
In conclusion, the developmental approaches employed for the four CD20×CD3 bsAbs described here provide valuable information that could help enhance the development of similar classes of bsAbs to achieve effective therapy with generally manageable safety profiles in the future.
Conflicts of Interest
M.Z., X.G., S.G., and J.D.D. hold stock or stock options for and are employees of Regeneron Pharmaceuticals, Inc. E.W. is an employee of Orion Pharma/Orion Corporation, and an equity holder in and former employee of Regeneron Pharmaceuticals, Inc.
Supporting information
Data S1.
Acknowledgments
Medical writing support was provided by Millicent Wilde, MSci, and Georgina Bartle, MSci, of Oberon, OPEN Health Communications, and was funded by Regeneron Pharmaceuticals, Inc., in accordance with Good Publication Practice (GPP) guidelines.
Funding: This review was funded by Regeneron Pharmaceuticals, Inc.
Erik Welf was, at the time of the study, at Regeneron Pharmaceuticals, Inc.
References
- 1. Sung H., Ferlay J., Siegel R. L., et al., “Global Cancer Statistics 2020: GLOBOCAN Estimates of Incidence and Mortality Worldwide for 36 Cancers in 185 Countries,” CA: A Cancer Journal for Clinicians 71, no. 3 (2021): 209–249. [DOI] [PubMed] [Google Scholar]
- 2. Leukemia & Lymphoma Society , “NHL Subtypes,” https://www.lls.org/lymphoma/non‐hodgkin‐lymphoma/nhl‐subtypes.
- 3. Hanel W. and Epperla N., “Evolving Therapeutic Landscape in Follicular Lymphoma: A Look at Emerging and Investigational Therapies,” Journal of Hematology & Oncology 14, no. 1 (2021): 104. [DOI] [PMC free article] [PubMed] [Google Scholar]
- 4. Ip A., Mutebi A., Wang T., et al., “Treatment Outcomes With Standard of Care in Relapsed/Refractory Diffuse Large B‐Cell Lymphoma: Real‐World Data Analysis,” Advances in Therapy 41, no. 3 (2024): 1226–1244. [DOI] [PMC free article] [PubMed] [Google Scholar]
- 5. Wang L., Li L. R., and Young K. H., “New Agents and Regimens for Diffuse Large B Cell Lymphoma,” Journal of Hematology & Oncology 13, no. 1 (2020): 175. [DOI] [PMC free article] [PubMed] [Google Scholar]
- 6. Falchi L., Vardhana S. A., and Salles G. A., “Bispecific Antibodies for the Treatment of B‐Cell Lymphoma: Promises, Unknowns, and Opportunities,” Blood 141, no. 5 (2023): 467–480. [DOI] [PMC free article] [PubMed] [Google Scholar]
- 7. Ayyappan S., Kim W. S., Kim T. M., et al., “Final Analysis of the Phase 2 ELM‐2 Study: Odronextamab in Patients With Relapsed/Refractory (R/R) Diffuse Large B‐Cell Lymphoma (DLBCL),” Blood 142, no. Suppl 1 (2023): 436. [Google Scholar]
- 8. Budde L. E., Sehn L. H., Matasar M., et al., “Safety and Efficacy of Mosunetuzumab, a Bispecific Antibody, in Patients With Relapsed or Refractory Follicular Lymphoma: A Single‐Arm, Multicentre, Phase 2 Study,” Lancet Oncology 23, no. 8 (2022): 1055–1065. [DOI] [PubMed] [Google Scholar]
- 9. Dickinson M. J., Carlo‐Stella C., Morschhauser F., et al., “Glofitamab for Relapsed or Refractory Diffuse Large B‐Cell Lymphoma,” New England Journal of Medicine 387, no. 24 (2022): 2220–2231. [DOI] [PubMed] [Google Scholar]
- 10. Kim T. M., Taszner M., Novelli S., et al., “Safety and Efficacy of Odronextamab in Patients With Relapsed or Refractory Follicular Lymphoma,” Annals of Oncology 35, no. 11 (2024): 1039–1047. [DOI] [PubMed] [Google Scholar]
- 11. Linton K. M., Vitolo U., Jurczak W., et al., “Epcoritamab Monotherapy in Patients With Relapsed or Refractory Follicular Lymphoma (EPCORE NHL‐1): A Phase 2 Cohort of a Single‐Arm, Multicentre Study,” Lancet Haematology 11, no. 8 (2024): e593–e605. [DOI] [PubMed] [Google Scholar]
- 12. Thieblemont C., Phillips T., Ghesquieres H., et al., “Epcoritamab, a Novel, Subcutaneous CD3xCD20 Bispecific T‐Cell‐Engaging Antibody, in Relapsed or Refractory Large B‐Cell Lymphoma: Dose Expansion in a Phase I/II Trial,” Journal of Clinical Oncology 41, no. 12 (2022): 2238–2247. [DOI] [PMC free article] [PubMed] [Google Scholar]
- 13. Cassanello G., Luna de Abia A., and Falchi L., “Trial Watch: Bispecific Antibodies for the Treatment of Relapsed or Refractory Large B‐Cell Lymphoma,” Oncoimmunology 13, no. 1 (2024): 2321648. [DOI] [PMC free article] [PubMed] [Google Scholar]
- 14. Goebeler M. E., Stuhler G., and Bargou R., “Bispecific and Multispecific Antibodies in Oncology: Opportunities and Challenges,” Nature Reviews. Clinical Oncology 21, no. 7 (2024): 539–560. [DOI] [PubMed] [Google Scholar]
- 15. Omer M. H., Shafqat A., Ahmad O., Alkattan K., Yaqinuddin A., and Damlaj M., “Bispecific Antibodies in Hematological Malignancies: A Scoping Review,” Cancers (Basel) 15, no. 18 (2023): 4550. [DOI] [PMC free article] [PubMed] [Google Scholar]
- 16. Elmeliegy M., Chen J., Dontabhaktuni A., et al., “Dosing Strategies and Quantitative Clinical Pharmacology for Bispecific T‐Cell Engagers Development in Oncology,” Clinical Pharmacology and Therapeutics 116, no. 3 (2024): 637–646. [DOI] [PubMed] [Google Scholar]
- 17. Lim K., Zhu X. S., Zhou D., Ren S., and Phipps A., “Clinical Pharmacology Strategies for Bispecific Antibody Development: Learnings From FDA‐Approved Bispecific Antibodies in Oncology,” Clinical Pharmacology and Therapeutics 116, no. 2 (2024): 315–327. [DOI] [PubMed] [Google Scholar]
- 18. Shen J., Swift B., Mamelok R., Pine S., Sinclair J., and Attar M., “Design and Conduct Considerations for First‐In‐Human Trials,” Clinical and Translational Science 12, no. 1 (2019): 6–19. [DOI] [PMC free article] [PubMed] [Google Scholar]
- 19. de Las Heras B., Bouyoucef‐Cherchalli D., Reeve L., et al., “Healthy Volunteers in First‐In‐Human Oncology Drug Development for Small Molecules,” British Journal of Clinical Pharmacology 88, no. 4 (2022): 1773–1784. [DOI] [PMC free article] [PubMed] [Google Scholar]
- 20. EMA , “Guideline on Strategies to Identify and Mitigate Risks for First‐In‐Human and Early Clinical Trials With Investigational Medicinal Products,” (2017), https://www.ema.europa.eu/en/documents/scientific‐guideline/guideline‐strategies‐identify‐and‐mitigate‐risks‐first‐human‐and‐early‐clinical‐trials‐investigational‐medicinal‐products‐revision‐1_en.pdf. [DOI] [PMC free article] [PubMed]
- 21. Nagaraja Shastri P., Shah N., Lechmann M., et al., “Industry Perspective on First‐In‐Human and Clinical Pharmacology Strategies to Support Clinical Development of T‐Cell Engaging Bispecific Antibodies for Cancer Therapy,” Clinical Pharmacology and Therapeutics 117, no. 1 (2025): 34–55. [DOI] [PubMed] [Google Scholar]
- 22. Bray J. S., Thomas G. R., Smith V. M., et al., “In Vitro Comparison of CD20xCD3 Biosimilar Antibodies Against Diffuse Large B‐Cell Lymphoma (DLBCL) Cell Lines With Different Levels of Expression of CD20,” British Journal of Haematology 206, no. 5 (2025): 1350–1354. [DOI] [PMC free article] [PubMed] [Google Scholar]
- 23. Bacac M., Colombetti S., Herter S., et al., “CD20‐TCB With Obinutuzumab Pretreatment as Next‐Generation Treatment of Hematologic Malignancies,” Clinical Cancer Research 24, no. 19 (2018): 4785–4797. [DOI] [PubMed] [Google Scholar]
- 24. Topp M. S., Matasar M., Allan J. N., et al., “Odronextamab Monotherapy in R/R DLBCL After Progression With CAR T‐Cell Therapy: Primary Analysis of the ELM‐1 Study,” Blood 145 (2024): 1498–1509. [DOI] [PMC free article] [PubMed] [Google Scholar]
- 25. Broske A. E., Korfi K., Belousov A., et al., “Pharmacodynamics and Molecular Correlates of Response to Glofitamab in Relapsed/Refractory Non‐Hodgkin Lymphoma,” Blood Advances 6, no. 3 (2022): 1025–1037. [DOI] [PMC free article] [PubMed] [Google Scholar]
- 26. Grigg S., Minson A., Prins E., and Dickinson M. J., “Relapse After Glofitamab Has a Poor Prognosis and Rates of CD20 Loss Are High,” British Journal of Haematology 205, no. 1 (2024): 122–126. [DOI] [PubMed] [Google Scholar]
- 27. ASCO Publications , “Genentech Protocol GO29781, Version 12,” (2021), https://ascopubs.org/action/downloadSupplement?doi=10.1200%2FJCO.23.02329&file=protocol_JCO.23.02329.pdf.
- 28. Sun L. L., Ellerman D., Mathieu M., et al., “Anti‐CD20/CD3 T Cell‐Dependent Bispecific Antibody for the Treatment of B Cell Malignancies,” Science Translational Medicine 7, no. 287 (2015): 287ra70. [DOI] [PubMed] [Google Scholar]
- 29. FDA , “Lunsumio US PI,” (2022), https://www.accessdata.fda.gov/drugsatfda_docs/label/2022/761263s000lbl.pdf.
- 30. FDA CDER , “BLA 761263 Multi‐Disciplinary Review and Evaluation,” (2022), https://www.accessdata.fda.gov/drugsatfda_docs/nda/2023/761263Orig1s000MultidisciplineR.pdf.
- 31. Frances N., Bacac M., Bray‐French K., et al., “Novel In Vivo and In Vitro Pharmacokinetic/Pharmacodynamic‐Based Human Starting Dose Selection for Glofitamab,” Journal of Pharmaceutical Sciences 111, no. 4 (2022): 1208–1218. [DOI] [PubMed] [Google Scholar]
- 32. FDA , “Columvi US PI,” (2023), https://www.accessdata.fda.gov/drugsatfda_docs/label/2023/761309s000lbl.pdf.
- 33. FDA CDER , “BLA 761309 Multi‐Disciplinary Review and Evaluation,” (2023), https://www.accessdata.fda.gov/drugsatfda_docs/nda/2023/761309Orig1s000MultidisciplineR.pdf.
- 34. Engelberts P. J., Hiemstra I. H., de Jong B., et al., “DuoBody‐CD3xCD20 Induces Potent T‐Cell‐Mediated Killing of Malignant B Cells in Preclinical Models and Provides Opportunities for Subcutaneous Dosing,” eBioMedicine 52 (2020): 102625. [DOI] [PMC free article] [PubMed] [Google Scholar]
- 35. ASCO Publications , “Genmab Protocol GCT3013‐01, Version 9,” (2020), https://ascopubs.org/action/downloadSupplement?doi=10.1200%2FJCO.22.01725&file=protocol_JCO.22.01725.pdf.
- 36. FDA , “Epkinly US PI,” (2024), https://www.genmab‐pi.com/prescribing‐information/epkinly‐pi.pdf.
- 37. FDA CDER , “BLA 761324 Multi‐Disciplinary Review and Evaluation,” (2023), https://www.accessdata.fda.gov/drugsatfda_docs/nda/2023/761324Orig1s000MultidisciplineR.pdf.
- 38. Zhu M., Olson K., Kirshner J. R., et al., “Translational Findings for Odronextamab: From Preclinical Research to a First‐In‐Human Study in Patients With CD20+ B‐Cell Malignancies,” Clinical and Translational Science 15, no. 4 (2022): 954–966. [DOI] [PMC free article] [PubMed] [Google Scholar]
- 39. EMA , “Ordspono SmPC,” https://www.ema.europa.eu/en/documents/product‐information/ordspono‐epar‐product‐information_en.pdf.
- 40. National Center for Advancing Translational Sciences , “Odronextamab,” (2024), https://drugs.ncats.io/substance/8R5CM46UIO.
- 41. Budde L. E., Assouline S., Sehn L. H., et al., “Single‐Agent Mosunetuzumab Shows Durable Complete Responses in Patients With Relapsed or Refractory B‐Cell Lymphomas: Phase I Dose‐Escalation Study,” Journal of Clinical Oncology 40, no. 5 (2022): 481–491. [DOI] [PMC free article] [PubMed] [Google Scholar]
- 42. Matasar M. J., Cheah C. Y., Yoon D. H., et al., “Subcutaneous Mosunetuzumab in Relapsed or Refractory B‐Cell Lymphoma: Promising Safety and Encouraging Efficacy in Dose Escalation Cohorts,” Blood 136 (2020): 45–46. [Google Scholar]
- 43. Bartlett N. L., Assouline S., Giri P., et al., “Mosunetuzumab Monotherapy Is Active and Tolerable in Patients With Relapsed/Refractory Diffuse Large B‐Cell Lymphoma,” Blood Advances 7, no. 17 (2023): 4926–4935. [DOI] [PMC free article] [PubMed] [Google Scholar]
- 44. Schuster S. J., Huw L. Y., Bolen C. R., et al., “Loss of CD20 Expression as a Mechanism of Resistance to Mosunetuzumab in Relapsed/Refractory B‐Cell Lymphomas,” Blood 143, no. 9 (2024): 822–832. [DOI] [PMC free article] [PubMed] [Google Scholar]
- 45. Tobinai K., Klein C., Oya N., and Fingerle‐Rowson G., “A Review of Obinutuzumab (GA101), a Novel Type II Anti‐CD20 Monoclonal Antibody, for the Treatment of Patients With B‐Cell Malignancies,” Advances in Therapy 34, no. 2 (2017): 324–356. [DOI] [PMC free article] [PubMed] [Google Scholar]
- 46. Hutchings M., Morschhauser F., Iacoboni G., et al., “Glofitamab, a Novel, Bivalent CD20‐Targeting T‐Cell‐Engaging Bispecific Antibody, Induces Durable Complete Remissions in Relapsed or Refractory B‐Cell Lymphoma: A Phase I Trial,” Journal of Clinical Oncology 39, no. 18 (2021): 1959–1970. [DOI] [PMC free article] [PubMed] [Google Scholar]
- 47. Hutchings M., Mous R., Clausen M. R., et al., “Dose Escalation of Subcutaneous Epcoritamab in Patients With Relapsed or Refractory B‐Cell Non‐Hodgkin Lymphoma: An Open‐Label, Phase 1/2 Study,” Lancet 398, no. 10306 (2021): 1157–1169. [DOI] [PubMed] [Google Scholar]
- 48. Bannerji R., Arnason J. E., Advani R. H., et al., “Odronextamab, a Human CD20xCD3 Bispecific Antibody in Patients With CD20‐Positive B‐Cell Malignancies (ELM‐1): Results From the Relapsed or Refractory Non‐Hodgkin Lymphoma Cohort in a Single‐Arm, Multicentre, Phase 1 Trial,” Lancet Haematology 9, no. 5 (2022): e327–e339. [DOI] [PMC free article] [PubMed] [Google Scholar]
- 49. Kim W. S., Kim T. M., Cho S. G., et al., “Odronextamab in Patients With Relapsed/Refractory (R/R) Diffuse Large B‐Cell Lymphoma (DLBCL): Results From a Prespecified Analysis of the Pivotal Phase II Study ELM‐2,” Blood 140 (2022): 1070–1071. [Google Scholar]
- 50. FDA CDER , “Estimating the Maximum Safe Starting Dose in Initial Clinical Trials for Therapeutics in Adult Healthy Volunteers: Guidance for Industry,” (2005), https://www.fda.gov/media/72309/download.
- 51. EMA , “Tepkinly SmPC,” (2024), https://www.ema.europa.eu/en/documents/product‐information/tepkinly‐epar‐product‐information_en.pdf.
- 52. EMA , “Lunsumio SmPC,” (2024), https://www.ema.europa.eu/en/documents/product‐information/lunsumio‐epar‐product‐information_en.pdf.
- 53. EMA , “Columvi SmPC,” (2024), https://www.ema.europa.eu/en/documents/product‐information/columvi‐epar‐product‐information_en.pdf.
- 54. Cauvin A. J., Peters C., and Brennan F., “Advantages and Limitations of Commonly Used Nonhuman Primate Species in Research and Development of Biopharmaceuticals,” in The Nonhuman Primate in Nonclinical Drug Development and Safety Assessment (Elsevier, 2015), 379–395. [Google Scholar]
- 55. Valente D., Mauriac C., Schmidt T., et al., “Pharmacokinetics of Novel Fc‐Engineered Monoclonal and Multispecific Antibodies in cynomolgus Monkeys and Humanized FcRn Transgenic Mouse Models,” MAbs 12, no. 1 (2020): 1829337. [DOI] [PMC free article] [PubMed] [Google Scholar]
- 56. Saber H., Thompson M. D., and Leighton J. K., “Pharmacokinetic Models for First‐In‐Human Dose Selection of Immune‐Activating Products in Oncology,” Regulatory Toxicology and Pharmacology 149 (2024): 105616. [DOI] [PubMed] [Google Scholar]
- 57. Seyhan A. A., “Lost in Translation: The Valley of Death Across Preclinical and Clinical Divide – Identification of Problems and Overcoming Obstacles,” Translational Medicine Communications 4 (2019): 18. [Google Scholar]
- 58. Morris E. C., Neelapu S. S., Giavridis T., and Sadelain M., “Cytokine Release Syndrome and Associated Neurotoxicity in cancer Immunotherapy,” Nature Reviews. Immunology 22, no. 2 (2022): 85–96. [DOI] [PMC free article] [PubMed] [Google Scholar]
- 59. Klinger M., Brandl C., Zugmaier G., et al., “Immunopharmacologic Response of Patients With B‐Lineage Acute Lymphoblastic Leukemia to Continuous Infusion of T Cell‐Engaging CD19/CD3‐Bispecific BiTE Antibody Blinatumomab,” Blood 119, no. 26 (2012): 6226–6233. [DOI] [PubMed] [Google Scholar]
- 60. Zhu M., Wu B., Brandl C., et al., “Blinatumomab, a Bispecific T‐Cell Engager (BiTE®) for CD‐19 Targeted cancer Immunotherapy: Clinical Pharmacology and Its Implications,” Clinical Pharmacokinetics 55, no. 10 (2016): 1271–1288. [DOI] [PubMed] [Google Scholar]
- 61. Gerard E., Zohar S., Lorenzato C., Ursino M., and Riviere M. K., “Bayesian Modeling of a Bivariate Toxicity Outcome for Early Phase Oncology Trials Evaluating Dose Regimens,” Statistics in Medicine 40, no. 23 (2021): 5096–5114. [DOI] [PMC free article] [PubMed] [Google Scholar]
- 62. Joshi A., Ramanujan S., and Jin J. Y., “The Convergence of Pharmacometrics and Quantitative Systems Pharmacology in Pharmaceutical Research and Development,” European Journal of Pharmaceutical Sciences 182 (2023): 106380. [DOI] [PubMed] [Google Scholar]
- 63. Dickinson M., Carlo‐Stella C., Morschhauser F., et al., “Glofitamab Monotherapy Provides Durable Responses After Fixed‐Length Dosing in Relapsed/Refractory (R/R) non‐Hodgkin Lymphoma (NHL) Patients (Pts),” Blood 138 (2021): 2478. [Google Scholar]
- 64. Toroghi M. K., Zhu M., Brouwer‐Visser J., et al., “A Quantitative Systems Pharmacology Modeling Framework for Evaluation of Cytokine Release Mediated by Intravenous Odronextamab Monotherapy in Patients With B‐Cell Non‐Hodgkin Lymphoma,” Blood 140, no. Suppl 1 (2022): 11930–11931. [Google Scholar]
- 65. Sehn L. H., Assouline S., Bartlett N. L., et al., “Managing Cytokine Release Syndrome (CRS) and Neurotoxicity With Step‐Up Dosing of Mosunetuzumab in Relapsed/Refractory (R/R) B‐Cell Non‐Hodgkin Lymphoma (NHL),” Hematological Oncology 37, no. Suppl_2 (2019): 310–311.30847943 [Google Scholar]
- 66. Li C. C., Bender B., Wilkins J., et al., “A Novel Step‐Up Dosage Regimen for Enhancing the Benefit‐To‐Risk Ratio of Mosunetuzumab in Relapsed or Refractory Follicular Lymphoma,” Clinical Pharmacology and Therapeutics 117 (2024): 465–474, 10.1002/cpt.3445. [DOI] [PMC free article] [PubMed] [Google Scholar]
- 67. Budde E. L., Bartlett N. L., Giri P., et al., “Subcutaneous Mosunetuzumab Is Active With a Manageable Safety Profile in Patients (Pts) With Relapsed/Refractory (R/R) B‐Cell Non‐Hodgkin Lymphomas (B‐NHLs): Updated Results From a Phase I/II Study,” Blood 140 (2022): 3753–3755. [Google Scholar]
- 68. Djebli N., Morcos P. N., Jaminion F., et al., “Population Pharmacokinetics and Exposure‐Response Analyses for Glofitamab in Relapsed/Refractory B‐Cell Non‐Hodgkin Lymphoma (R/R NHL): Confirmation of Efficacy and CRS Mitigation in Patients With Step‐Up Dosing,” Blood 136 (2020): 1–2.32430499 [Google Scholar]
- 69. Afzal N., Li T., Chiu C., et al., “Abstract 846: Utilizing Quantitative Systems Pharmacology (QSP) Model to Understand Cytokine Release Syndrome (CRS) Following Administration of Epcoritamab in DLBCL Patients,” Cancer Research 83 (2023): 846. [Google Scholar]
- 70. Li J., Piskol R., Ybarra R., et al., “CD3 Bispecific Antibody‐Induced Cytokine Release Is Dispensable for Cytotoxic T Cell Activity,” Science Translational Medicine 11, no. 508 (2019): eaax8861. [DOI] [PubMed] [Google Scholar]
- 71. Shalaby M. F., Herrero J., and Butterworth G., “1049P Cytokine Release Syndrome in Patients Treated With Bispecific T Cell Engagers and Bispecific Monoclonal Antibodies at the Christie: A Retrospective Study,” Annals of Oncology 35, no. Suppl 2 (2024): S700. [Google Scholar]
- 72. Hosseini I., Gadkar K., Stefanich E., et al., “Mitigating the Risk of Cytokine Release Syndrome in a Phase I Trial of CD20/CD3 Bispecific Antibody Mosunetuzumab in NHL: Impact of Translational System Modeling,” NPJ Systems Biology and Applications 6, no. 1 (2020): 28. [DOI] [PMC free article] [PubMed] [Google Scholar]
- 73. Li T., Polhamus D., Thalhauser C., et al., “Abstract 2798: Simplifying Selection and Optimization of Step‐Up Dosing of Subcutaneous Epcoritamab to Mitigate CRS Risk Using Repeated Time‐To‐Event Modeling,” Cancer Research 83 (2023): 2798. [Google Scholar]
- 74. Zhu M., Brouwer‐Visser J., Ambati S. R., et al., “Optimization of Intravenous Odronextamab Step‐Up Regimen for Reducing the Risk of High‐Grade Cytokine Release Syndrome,” Blood 140, no. Suppl 1 (2022): 11560–11561. [Google Scholar]
- 75. Ananthakrishnan R., Lin R., He C., Chen Y., Li D., and LaValley M., “An Overview of the BOIN Design and Its Current Extensions for Novel Early‐Phase Oncology Trials,” Contemporary Clinical Trials Communications 28 (2022): 100943. [DOI] [PMC free article] [PubMed] [Google Scholar]
- 76. Le Tourneau C., Lee J. J., and Siu L. L., “Dose Escalation Methods in Phase I Cancer Clinical Trials,” Journal of the National Cancer Institute 101, no. 10 (2009): 708–720. [DOI] [PMC free article] [PubMed] [Google Scholar]
- 77. Yuan Y., Hess K. R., Hilsenbeck S. G., and Gilbert M. R., “Bayesian Optimal Interval Design: A Simple and Well‐Performing Design for Phase I Oncology Trials,” Clinical Cancer Research 22, no. 17 (2016): 4291–4301. [DOI] [PMC free article] [PubMed] [Google Scholar]
- 78. Li C. C., Bender B., Yin S., et al., “Exposure‐Response Analyses Indicate a Promising Benefit/Risk Profile of Mosunetuzumab in Relapsed and Refractory Non‐Hodgkin Lymphoma,” Blood 134 (2019): 1285. [Google Scholar]
- 79. Roche , “European Commission Approves Roche's Fixed‐duration Columvi (Glofitamab) for People With Relapsed or Refractory Diffuse Large B‐Cell Lymphoma,” (2023), https://www.roche.com/media/releases/med‐cor‐2023‐07‐11.
- 80. AbbVie , “AbbVie Announces European Commission Approval of TEPKINLY (Epcoritamab) for Adults With Relapsed or Refractory Diffuse Large B‐Cell Lymphoma,” (2023), https://news.abbvie.com/2023‐09‐25‐AbbVie‐Announces‐European‐Commission‐Approval‐of‐TEPKINLY‐R‐epcoritamab‐for‐Adults‐with‐Relapsed‐or‐Refractory‐Diffuse‐Large‐B‐cell‐Lymphoma.
- 81. AbbVie , “European Commission Grants Second Indication Approval for TEPKINLY (Epcoritamab) for the Treatment of Adults With Relapsed/Refractory Follicular Lymphoma,” (2024), https://news.abbvie.com/2024‐08‐19‐European‐Commission‐Grants‐Second‐Indication‐Approval‐for‐TEPKINLY‐R‐epcoritamab‐for‐the‐Treatment‐of‐Adults‐with‐Relapsed‐Refractory‐Follicular‐Lymphoma.
- 82. FDA , “FDA Grants Accelerated Approval to Epcoritamab‐bysp for Relapsed or Refractory Diffuse Large B‐Cell Lymphoma and High‐Grade B‐Cell Lymphoma,” (2023), https://www.fda.gov/drugs/drug‐approvals‐and‐databases/fda‐grants‐accelerated‐approval‐epcoritamab‐bysp‐relapsed‐or‐refractory‐diffuse‐large‐b‐cell#:~:text=Approvals%20and%20Databases‐,FDA%20grants%20accelerated%20approval%20to%20epcoritamab%2Dbysp%20for%20relapsed%20or,high%2Dgrade%20B%2Dcell%20lymphoma&text=On%20May%2019%2C%202023%2C%20the,%2C%20Genmab%20US%2C%20Inc.
- 83. FDA , “FDA Grants Accelerated Approval to Epcoritamab‐bysp for Relapsed or Refractory Follicular Lymphoma,” (2024), https://www.fda.gov/drugs/resources‐information‐approved‐drugs/fda‐grants‐accelerated‐approval‐epcoritamab‐bysp‐relapsed‐or‐refractory‐follicular‐lymphoma.
- 84. Regeneron Pharmaceuticals , “Ordspono™ (Odronextamab) Approved in the European Union for the Treatment of Relapsed/Refractory Follicular Lymphoma and Diffuse Large B‐Cell Lymphoma,” (2024), https://investor.regeneron.com/news‐releases/news‐release‐details/ordsponotm‐odronextamab‐approved‐european‐union‐treatment.
- 85. Djebli N., Jaminion F., Laurent J., et al., “Population Pharmacokinetics and Novel Exposure‐Response Analyses to Inform Optimal Biologic Dose Selection for CD20‐TCB, a T‐Cell‐Engaging Bispecific Antibody, in Relapsed or Refractory B‐Cell Non‐Hodgkin Lymphoma,” Blood 134 (2019): 3799. [Google Scholar]
- 86. Li T., Hiemstra I. H., Chiu C., et al., “Semimechanistic Physiologically‐Based Pharmacokinetic/Pharmacodynamic Model Informing Epcoritamab Dose Selection for Patients With B‐Cell Lymphomas,” Clinical Pharmacology and Therapeutics 112, no. 5 (2022): 1108–1119. [DOI] [PMC free article] [PubMed] [Google Scholar]
- 87. Tucker D., Arnason J. E., Brouwer‐Visser J., et al., Circulating Tumor DNA Analysis Associates With PFS With Odronextamab Monotherapy in R/R FL and DLBCL: Identification of MRD Status and High‐Risk Subgroups From the Phase 2 ELM‐2 Study (Poster P1230) (EHA, 2024). [Google Scholar]
- 88. Zhu M., Conrado D., Srinivasan K., et al., “Odronextamab Monotherapy for the Treatment of Relapsed/Refractory (R/R) Follicular Lymphoma (FL) and Diffuse Large B‐Cell Lymphoma (DLBCL): Focus on Clinical Pharmacology and Pharmacometrics in the ELM‐1 and ELM‐2 Studies,” Blood 142 (2023): 1436. [Google Scholar]
- 89. Susilo M. E., Li C. C., Gadkar K., et al., “Systems‐Based Digital Twins to Help Characterize Clinical Dose‐Response and Propose Predictive Biomarkers in a Phase I Study of Bispecific Antibody, Mosunetuzumab, in NHL,” Clinical and Translational Science 16, no. 7 (2023): 1134–1148. [DOI] [PMC free article] [PubMed] [Google Scholar]
- 90. Chen Y., Ma F., Jones N., Deng R., Li C., and Li C. C., “Assessment of CYP3A‐Mediated Drug Interaction via Cytokine (IL‐6) Elevation for Mosunetuzumab Using Physiologically‐Based Pharmacokinetic Modeling,” CPT: Pharmacometrics & Systems Pharmacology 13, no. 2 (2024): 234–246. [DOI] [PMC free article] [PubMed] [Google Scholar]
- 91. Dickmann L. J., Patel S. K., Rock D. A., Wienkers L. C., and Slatter J. G., “Effects of Interleukin‐6 (IL‐6) and an Anti‐IL‐6 Monoclonal Antibody on Drug‐Metabolizing Enzymes in Human Hepatocyte Culture,” Drug Metabolism and Disposition 39, no. 8 (2011): 1415–1422. [DOI] [PubMed] [Google Scholar]
- 92. Djebli N., Parrott N., Jaminion F., O'Jeanson A., Guerini E., and Carlile D., “Evaluation of the Potential Impact on Pharmacokinetics of Various Cytochrome P450 Substrates of Increasing IL‐6 Levels Following Administration of the T‐Cell Bispecific Engager Glofitamab,” CPT: Pharmacometrics & Systems Pharmacology 13, no. 3 (2024): 396–409. [DOI] [PMC free article] [PubMed] [Google Scholar]
- 93. Welf E. S., Zhu M., Brouwer‐Visser J., et al., “A Mechanistic Model to Inform Step‐Up Dosing That Limits Cytokine Release Following Odronextamab Treatment for B‐Cell Lymphomas.”
- 94. Brentjens R. J., Davila M. L., Riviere I., et al., “CD19‐Targeted T Cells Rapidly Induce Molecular Remissions in Adults With Chemotherapy‐Refractory Acute Lymphoblastic Leukemia,” Science Translational Medicine 5, no. 177 (2013): 177ra38. [DOI] [PMC free article] [PubMed] [Google Scholar]
- 95. Shimabukuro‐Vornhagen A., Gödel P., Subklewe M., et al., “Cytokine Release Syndrome,” Journal for Immunotherapy of Cancer 6 (2018): 56. [DOI] [PMC free article] [PubMed] [Google Scholar]
- 96. Tanaka T., Narazaki M., and Kishimoto T., “Immunotherapeutic Implications of IL‐6 Blockade for Cytokine Storm,” Immunotherapy 8, no. 8 (2016): 959–970. [DOI] [PubMed] [Google Scholar]
- 97. Teachey D. T., Rheingold S. R., Maude S. L., et al., “Cytokine Release Syndrome After Blinatumomab Treatment Related to Abnormal Macrophage Activation and Ameliorated With Cytokine‐Directed Therapy,” Blood 121, no. 26 (2013): 5154–5157. [DOI] [PMC free article] [PubMed] [Google Scholar]
- 98. Serra López‐Matencio J. M., Nieto C. M., Baladrón A. M., and Castañeda S., “Drug Interactions of Monoclonal Antibodies – Clinical Perspective,” Journal of Immunological Sciences 2, no. 2 (2018): 4–7. [Google Scholar]
- 99. Schmitt C., Kuhn B., Zhang X., Kivitz A. J., and Grange S., “Disease‐Drug‐Drug Interaction Involving Tocilizumab and Simvastatin in Patients With Rheumatoid Arthritis,” Clinical Pharmacology and Therapeutics 89, no. 5 (2011): 735–740. [DOI] [PubMed] [Google Scholar]
- 100. Zhuang Y., de Vries D. E., Xu Z., et al., “Evaluation of Disease‐Mediated Therapeutic Protein‐Drug Interactions Between an Anti‐Interleukin‐6 Monoclonal Antibody (Sirukumab) and Cytochrome P450 Activities in a Phase 1 Study in Patients With Rheumatoid Arthritis Using a Cocktail Approach,” Journal of Clinical Pharmacology 55, no. 12 (2015): 1386–1394. [DOI] [PubMed] [Google Scholar]
- 101. Iyer S. S. and Cheng G., “Role of Interleukin 10 Transcriptional Regulation in Inflammation and Autoimmune Disease,” Critical Reviews in Immunology 32, no. 1 (2012): 23–63. [DOI] [PMC free article] [PubMed] [Google Scholar]
- 102. Murray P. J., “Understanding and Exploiting the Endogenous Interleukin‐10/STAT3‐Mediated Anti‐Inflammatory Response,” Current Opinion in Pharmacology 6, no. 4 (2006): 379–386. [DOI] [PubMed] [Google Scholar]
- 103. FDA , “Project Optimus—Reforming the Dose Optimization and Dose Selection Paradigm in Oncology,” (2024), https://www.fda.gov/about‐fda/oncology‐center‐excellence/project‐optimus.
- 104. FDA CDER , “Optimizing the Dosage of Human Prescription Drugs and Biological Products for the Treatment of Oncologic Diseases: Guidance for Industry,” (2024), https://www.fda.gov/regulatory‐information/search‐fda‐guidance‐documents/optimizing‐dosage‐human‐prescription‐drugs‐and‐biological‐products‐treatment‐oncologic‐diseases.
- 105. Hardin C., Gray C., Novelli S., et al., “Phase 3 Trial Evaluating the Efficacy and Safety of Odronextamab Plus Chemotherapy Versus Rituximab Plus Chemotherapy in Previously Untreated Follicular Lymphoma (OLYMPIA‐2),” Journal of Clinical Oncology 42 (2024): TPS7099. [Google Scholar]
- 106. Matasar M., Turgut B., Tessoulin B., et al., “Phase 3 Trial Evaluating Efficacy and Safety of Odronextamab Plus CHOP vs Rituximab Plus CHOP in Previously Untreated Diffuse Large B‐Cell Lymphoma (DLBCL; OLYMPIA‐3),” Journal of Clinical Oncology 42 (2024): TPS7086. [Google Scholar]
- 107. Abou Dalle I., Dulery R., Moukalled N., et al., “Bi‐ and Tri‐Specific Antibodies in Non‐Hodgkin Lymphoma: Current Data and Perspectives,” Blood Cancer Journal 14, no. 1 (2024): 23. [DOI] [PMC free article] [PubMed] [Google Scholar]
Associated Data
This section collects any data citations, data availability statements, or supplementary materials included in this article.
Supplementary Materials
Data S1.