

Abstract
The nonlinear driving of collective modes in quantum materials can lead to a number of striking non-equilibrium functional responses, which merit a comprehensive exploration of underlying dynamics. However, the coherent coupling between nonlinearly-driven modes frequently involves multiple mode coordinates at once, and is often difficult to capture by one-dimensional pump probe spectroscopy. One example is phonon-mediated amplification of Josephson plasmons in YBa2Cu3O6+x, a phenomenon likely associated with the mysterious superconducting-like optical response observed in this material. Here, we report two-dimensional nonlinear spectroscopy measurements in driven YBa2Cu3O6+x. We excite apical oxygen phonons with pairs of mutually-delayed carrier envelope phase stable mid-infrared pump pulses, and detect time-modulated second-order nonlinear optical susceptibility. We find that the driven phonons parametrically amplify coherent pairs of fluctuating opposite-momentum Josephson plasma polaritons, corresponding to a squeezed state of the Josephson plasma.
Subject terms: Superconducting properties and materials, Superconducting properties and materials
Introduction
Resonant optical driving has been shown to induce transient optical properties reminiscent of superconductivity at temperatures above the transition temperature Tc in a range of materials, including certain molecular solids and cuprate compounds1–11. In underdoped YBa2Cu3O6+x, the effect is based on large-amplitude excitation of c-axis apical oxygen phonon modes using resonant mid-infrared pulses, inducing optical responses that are representatively shown in Fig. 1a–c. These optical properties include a 1/ω divergence in the imaginary part of the THz-frequency optical conductivity and a plasma edge in the reflectivity2,6–8,12.
Fig. 1. Light-induced Josephson plasmon dynamics.

a Schematic of the mid-IR pump – THz probe experiment in YBa2Cu3O6.48. The sample is excited by a mid-IR pump pulse (yellow) polarized along the crystal c-axis, resonantly driving apical oxygen phonon modes as indicated inside the yellow shading. The subsequent changes in the low-frequency optical properties are sampled by a broadband, also c-polarized THz probe pulse (grey). b Photo-induced change in the reflected THz probe electric field at the peak of mid-IR pump-THz probe response, measured at a base temperature of 60 K (Tc = 48 K) (c) Sample reflectivity in equilibrium (dashed gray line) and following photo-excitation (solid dark red line at low frequencies <3 THz, solid grey line at frequencies above), measured at a base temperature of 60 K. The photo-induced changes are highlighted by yellow shading6. d Schematic of the mid-IR pump – time-resolved second harmonic probe experiment in the same sample. Here, the mid-IR pump pulse (yellow) is CEP stable and the subsequent dynamics are probed by collecting the second harmonic intensity (blue) generated from an 800 nm femtosecond probe pulse (red) as a function of detection delay t. Both incident pulses are polarized along the crystal c-axis. e Oscillatory contribution to the changes in the second harmonic intensity as a function of pump-probe time delay measured at T = 100 K, above Tc. f Corresponding Fourier spectrum, highlighting the two resonantly excited apical oxygen phonons at 17 and 20 THz in yellow, and the low-frequency amplified Josephson plasmon in red8.
Whether this short-lived non-equilibrium state has true microscopic features of a superconductor, that is a rigid condensate of Cooper pairs induced or stabilized by the optical driving, or if these effects are mainly connected to the nonlinear response of the material is still open to a definitive answer. Recent experiments have shown that this state expels magnetic fields, indicating an increase in mobility alone cannot explain these observations13.
The details of the mechanism underlying the observed state are not yet clarified. Not only is the analysis and interpretation of THz-frequency optical data a source of debate14–24, but also the theoretical efforts to conceptualize and extract a microscopic mechanism for the observed phenomena have not led to a conclusive set of hypotheses to be tested experimentally25–30. These challenges are also due to a lack of experimental data that directly reports on the microscopic non-equilibrium dynamics.
In YBa2Cu3O6+x, this phenomenon is connected to coherent dynamics of Josephson plasmon polaritons (JPPs), dispersive superconducting plasmons sustained by Cooper pair tunneling between the CuO2 planes31–36. Below TC, where long-range superconducting coherence is well-formed throughout the crystal, JPPs are observed in equilibrium as weakly damped modes down to zero momentum. Above TC, in the so-called pseudo-gap phase, phase fluctuations cause JPPs to disappear at zero momentum, but they may still be present37–44 at finite momenta, supported by short-range phase fluctuating superconductivity. Whilst no zero-momentum JPP mode exists above TC, the phonon drive may parametrically couple to finite momentum JPPs both below and above TC.
These dynamics have recently been studied in single-pump time and angle-resolved (SHG) probe experiments8. The experimental schematic is shown in Fig. 1d. Concomitant with mid-infrared excitation, a 30-fs ultrafast NIR probe pulse of center wavelength 800 nm was incident on the sample to measure pump-induced SHG. Because equilibrium YBa2Cu3O6+x is a centrosymmetric system, no (or very weak) static second harmonic is measured in absence of the pump. However, coherent motion of infrared-active modes, which dynamically break inversion symmetry as the mode coordinates oscillate about their equilibrium positions, result in a time-delay dependent SHG intensity . The data of Fig. 1d were interpreted by proposing a three-mode mixing mechanism to justify the exponential amplification of low-frequency modes. The effect was discussed in terms of parametric mixing of a zone-center high frequency phonon, and two finite momentum JPPs. As will be discussed below, whilst the key elements of this interpretation are likely correct, the exact details of coupling are still not uniquely determined, leaving important aspects of the physics not fully clarified.
In this paper, a new form of multi-dimensional spectroscopy involving sequential excitation with two mid-infrared pulses and probing the SHG via a NIR pulse is used to further clarify the coherent dynamics following the phonon drive in YBa2Cu3O6+x. The new observations presented here point towards the parametric amplification of pairs of opposite-momentum JPPs via a four-mode (rather than three-mode) mixing process with the two resonantly-driven apical oxygen phonon modes. These amplified pairs possibly form a squeezed state, potentially akin to non-classical states proposed to reduce noise and redistribute fluctuations in photonic systems45–48.
We next turn to a detailed description of the basic theory for the experimental technique, revisit the evidence reported in ref. 8, and introduce the new multidimensional measurements.
Results
Time-resolved second harmonic generation probe
The coherent, time delay dependent oscillations in induced by an infrared-active mode of a solid at frequency can be cast in the stimulated hyper-Raman scattering formalism. This refers to a third-order nonlinear mixing, in which two photons of the probe field interact with the infrared-active mode to give rise to a hyper-Raman polarization 49. For a near-infrared probe at 800 nm wavelength ), this interaction generates a sideband close to the second harmonic frequency of the probe at 400 nm (750 THz). Provided that the mode oscillates with a constant phase for all the laser shots in a pump-probe experiment and that the probe pulses are sufficiently short, the radiated hyper-Raman field can be measured as pump-probe-delay dependent oscillations of the SHG intensity . In the absence of any other electromagnetic fields on the detector, one measures only time-delay dependent oscillations proportional to , which occur at twice the mode frequency 50–53. In the Nyquist sampling limit, this channel requires the probe pulses to be shorter than one quarter of the oscillation period of the mode and is known as homodyne detection .
If interference with an auxiliary second-harmonic field takes place on the detector, a beating contribution is detected between the auxiliary field (local oscillator ) and the radiated hyper-Raman field , leading to time delay dependent oscillations at the frequency of the mode . This detection scheme relaxes the requirement on the probe pulse duration to half the period of the oscillating mode and is generally referred to as heterodyne detection . It was reported in ref. 8 that a spurious, time delay independent second harmonic field at 400 nm wavelength (2 = 750 THz), was co-propagating with the time-delay-dependent probe at the fundamental frequency . The presence of both homodyne and of a not-well controlled heterodyne response adds a degree of ambiguity when interpreting the one-dimensional data.
Representative data from ref. 8 are shown in Fig. 1e, f. The Fourier transform spectrum shows two peaks at about 17 and 20 THz (shaded in yellow) coinciding with the resonantly driven infrared-active apical oxygen phonons, which are present also in the linear response at small drive amplitudes. At the high drive fields, relevant for photo-induced superconductivity, the spectral response is dominated by a component near 2 THz, in the same frequency region where the photo-induced edge was observed in the THz reflectivity (Fig. 1c). The momentum and temperature dependence of this peak were also measured in ref. 8, and based on these results the peak was attributed to large-amplitude coherent oscillations of finite-momentum JPPs. Finally, the observed exponential scaling of the peak amplitude with the driven phonon suggests that the finite-momentum JPPs are being parametrically amplified.
Model for nonlinear phonon-plasmon coupling
In ref. 8, the three-mode mixing process, sketched in Fig. 2a, was proposed to explain the observed large-amplitude coherent excitation of finite momentum JPPs (near 200 cm-1). This model describes a nonlinear parametric interaction between only one of the resonantly excited apical oxygen phonon modes (which have amplitudes denoted by and at frequencies 17 THz and 20 THz, respectively) with a pair of parametrically amplified finite-momentum (±) JPPs (with current coordinates and corresponding to the inter-bilayer and intra-bilayer tunneling modes at frequencies and respectively). For this effect to explain the one-dimensional data a Hamiltonian interaction term was proposed (see Supplementary Information). Figure 2c shows the result of numerical simulations based on this model carried out under the assumption of heterodyne detection, where coherent oscillations of the driven phonons and the coupled JPPs are detected at the modes’ eigenfrequencies. The calculations exhibit a close agreement to the experimental data.
Fig. 2. Comparison between the three and four-wave mixing models.

a Left panel: dispersion curves of the two apical oxygen phonon modes (QIR1 at 17 THz and QIR2 at 20 THz) and of the inter-bilayer (JP1) and intra-bilayer (JP2) Josephson plasma polaritons along the in-plane momentum qx are shown as yellow and red dashed lines, respectively. The mid-IR pump excites both apical oxygen phonon modes, which parametrically amplify a pair of inter-bilayer and intra-bilayer Josephson plasma polaritons at finite momentum qJP (black arrow) such that . The right panel depicts the energy level diagram corresponding to this model. b Time-dependent displacement of phonon modes, the two Josephson plasma polaritons and their average value following the photoexcitation, simulated using the three-mode mixing model (left panel) with their respective Fourier spectrum (right panel). The yellow shading indicates the two driven apical oxygen phonons while the two red shading is attributed to Josephson plasma polaritons. c Simulated oscillatory component of the changes in second harmonic intensity of the Josephson plasmons supercurrents in the heterodyne detection limit. Left panel: the time-delay dependent second harmonic intensity in the heterodyned detection limit following apical oxygen phonon excitation, simulated using the three-mode mixing model detailed in the text, and the corresponding Fourier spectrum using the same color shading as in (b)8,54. d Left panel: same dispersion relations as in (a) now for the four-mode mixing model explained in the text. The mid-IR pump again excites the two apical oxygen phonon modes. Now, they parametrically amplify a pair of inter-bilayer Josephson plasmon polaritons (JP1) at finite momentum (illustrated by the black arrow) such that . The right panel shows the energy level diagram describing the four-mode mixing model. e Time-dependent displacement of phonon modes, the two Josephson plasma polaritons and their average value following the photoexcitation, simulated using the four-mode mixing model (left panel) with their respective Fourier spectrum (right panel). With the same color shading as in (b) and (c). f Simulated oscillatory component of the changes in second harmonic intensity of the Josephson plasmons supercurrents in the homodyne detection limit. From left to right: same as in (c) for four-mode mixing model but in the intermediate detection limit, using the same color shading as in (b), (c) and (e).
As already recognized in ref. 8, and as shown in Fig. 2d–f, the data can also be described by an alternative parametric four-mode mixing coupling mechanism, which describes the interaction between both resonantly driven phonon modes and , and fluctuating pairs of the lower frequency JPP in the form (see Fig. 2d and ref. 54). Through the mixing term , it contains a resonance condition for efficient amplification of fluctuating JPP pairs and at frequency , where at identically-opposite momenta . This is especially interesting because it could lead to a squeezed state of the JPPs55–57.
Figure 2e shows the simulated dynamics of a pair of amplified plasmons, and , for a single laser shot, alongside the temporal phase-averaged response . Whilst and are bound to respond coherently through the parametric process, the responses and , averaged over many pulses, are zero. In fact, the phase of the difference-frequency drive component at frequency is phase-stable from shot to shot. Then, the phase of the parametrically amplified JPP pairs will be set to this absolute phase, however with a zero or a shift for different shots. As a result, after averaging over many excitation pulses in the experiment, the amplified plasmon responses and remain zero. This is not the case for the product , which has a fixed phase set by the drive, hence the quantity is non-zero.
Heterodyne SHG detection is blind to these dynamics. Although the generated currents and , when taken individually, are symmetry-odd, break the inversion symmetry and therefore emit two separate hyper-Raman fields and , they cannot be detected in because the pulse averaged responses and are zero. On the other hand, the product , which oscillates at , is symmetry-even and not hyper-Raman active, hence does not modulate the SHG intensity (see Supplementary Information for details).
The situation changes if one considers homodyne detection. The measured intensity response of these fields from shot to shot is proportional to which contains the mixing terms . These terms generate homodyned SHG contributions, which yield a non-zero pulse-averaged intensity modulation at the frequency of the parametrically amplified plasmon oscillations . Figure 2f shows the results of simulating the single pump-SHG probe experiment using this four-mode mixing model, here carried out under the assumption of homodyne detection with a small heterodyne contribution. The results also show a very good agreement with the experimental data of Fig. 1e, f.
To summarize, the simulations of Fig. 2 demonstrate that the three-mode and four-mode mechanisms are indistinguishable in the single pump-probe experiment. For completeness, we also discuss in the Supplementary Information, how the three-mode mixing would impact on the homodyne detection scheme and how the four-mode mixing would affect the heterodyne detection, further underscoring the ambiguity in the earlier experiment.
Two-dimensional nonlinear spectroscopy experiment
In the present work this ambiguity was resolved by deploying a new form of two-dimensional spectroscopy58–65, based on a two-pump second-harmonic probe scheme with the aim of directly observing the inter-mode coupling processes responsible for the generation of coherent JPPs. The experimental setup is sketched in Fig. 3a. The two mid-infrared excitation pulses have electric fields denoted by EA and EB. They resonantly drive the c-axis apical oxygen phonon modes at two instants in time, separated by a controllable time delay τ. The subsequent coherent dynamics of the JPP and phonon modes are then sampled by the near-infrared probe pulse at a time delay t (defined relative to the arrival time of the last excitation pulse, see Supplementary Information). The cooperative nonlinear contribution to the tr-SHG intensity from both of the pump pulses is extracted by subtracting the isolated tr-SHG responses IA and IB (to only pulse EA and EB, respectively), from the response IAB (to both the excitation pulses): . Experimentally, INL is obtained by mechanically chopping the two excitation pulses at frequencies 1/2 and 1/3 of the laser repetition rate f and measuring the tr-SHG intensity component at their difference frequency f/6. This procedure is illustrated in Fig. 3b for an excitation pulse delay τ = 0.5 ps between EA and EB. The individual tr-SHG signals IA and IB each contain a rectified response due to the third order nonlinear mixing of the electric filed of the pump with probe (electric-field induced SHG (EFISH)), which is then followed by coherent hyper-Raman responses of the driven phonons and amplified plasmons. After subtraction, INL reveals coherent dynamics due to nonlinear terms in the system Hamiltonian. This nonlinear response is also observed to be strongly dependent on temperature, as shown for two sample temperatures 20 K and 295 K, below and above the critical temperature TC, shown in Fig. 3c.
Fig. 3. Two-dimensional mid-IR pump – time-resolved second harmonic generation probe.

a Schematic of the same experiment as shown in Fig.1d, now using two CEP stable mid-IR pump pulses EA and EB separated by the excitation time delay τ with approximate fluences of 12 and 6 mJ/cm2 for and , respectively. b From top to bottom: time-resolved SHG intensities , and measured in YBa2Cu3O6.48 at a base temperature of 20 K (below Tc), following excitation by only , by only (after excitation delay τ) and by both pulses, respectively, at a base temperature of 20 K (below Tc). c Nonlinear contribution to the time-resolved SHG intensity shown in panel (b), given as , and for base temperatures of 20 K and 295 K (below and above Tc, respectively). The dashed rectangle frames the data at later time delays, which are enlarged by a factor of 5 for clarity.
Measurements of INL as a function of delay τ between the two mid-IR pump pulses yielded the two-dimensional time domain maps shown in Fig. 4a, b again for sample temperatures of 20 K and 295 K. For early τ and t, the rectified component of the homodyne contribution to the nonlinear SHG intensity dominates the response and masks the underlying coherent phonon-plasmon dynamics. Before Fourier transformation, with the goal of isolating the longer-lived oscillating signal component, the time-domain data were cropped along both time axes, indicated by the black dashed boxes in Fig. 4a, b, (see Supplementary Information). The corresponding two-dimensional Fourier spectra, which are symmetric around the origin, are shown in Fig. 4c, d for sample temperatures of 20 K and 295 K respectively. Each exhibit four dominant peaks. The two peaks at zero detection frequency, (ft,fτ) = (0;17) THz and (0;20) THz reflect homodyne-detected nonlinear tr-SHG in response to either of the two apical oxygen phonon modes QIR1 and QIR2 (as evidenced by their positions along the vertical fτ axis). The two peaks at (-3;17) THz and (3;20) THz suggest that the dominant ~3 THz response observed in the pump-probe experiment of Fig. 1f (ref. 8) is driven cooperatively by the excitation of both apical oxygen phonon modes.
Fig. 4. Two-dimensional nonlinear spectroscopy of the SHG response.
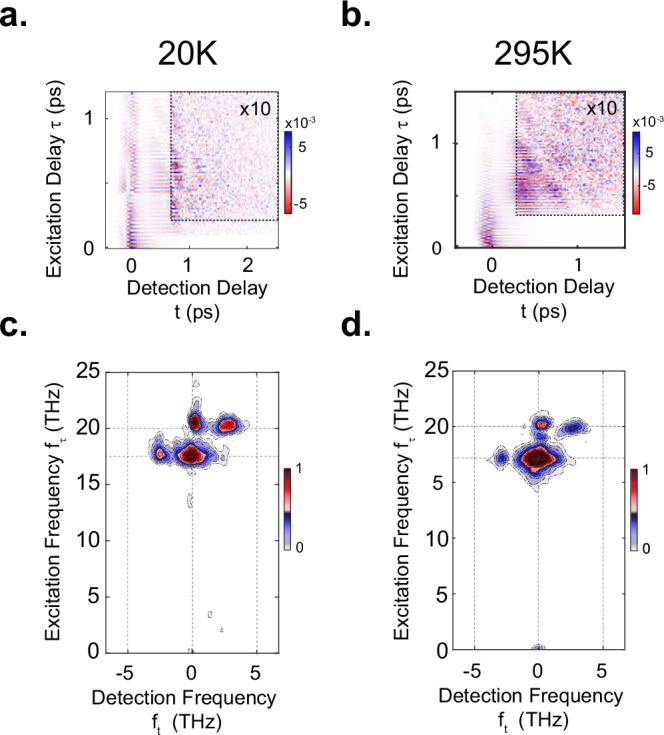
a Nonlinear contributions to the time-resolved SHG intensity (as described in Fig.3) with the excitation time delay τ changing along the vertical axis, measured in YBa2Cu3O6.48 at a base temperature of 20 K (below Tc). b Same as in (a) measured at 295 K (above Tc). The data inside the black dashed box are multiplied by 10 for clarity. Data at both temperatures were measured with approximate fluences of 12 mJ. cm-2 and 6 mJ. cm-2 for EA and EB, respectively. c Normalized two-dimensional Fourier spectrum of the data inside the black dashed box in panel (a). d Same as (c) for the data shown in panel (b). Four strong peaks are found at frequency coordinates (0;17), (0;20), (-3;17), and (3;20), all in units of THz. The Fourier transformation for the two different temperatures are performed in different windows based on the time domain data and each 2D spectrum is normalized to its own maximum (see Supplementary Information).
We next extend the simulations in Fig. 2 to calculate the corresponding multi-dimensional spectra, to identify the coupling mechanism leading to this peak pattern. For the three-mode mixing model with heterodyne detection, considered in ref. 8 and Fig. 2a–c, the resulting two-dimensional spectrum shown in Fig. 5a displays intense peaks at (−2.5;0) THz, (2.5;0) THz, (−2.5;17) THz and (2.5;17). These peaks arise from the nonlinear coupling between only the lower-frequency apical oxygen phonon QIR1 and the two JPPs JP1 and JP2 (see Supplementary Information for details). Clearly, the simulated two-dimensional nonlinear spectrum does not match the measured spectrum, despite the agreement of the one-dimensional spectrum.
Fig. 5. Comparison of the simulated nonlinear two-dimensional Fourier spectra according to three-wave and four-wave mixing models.
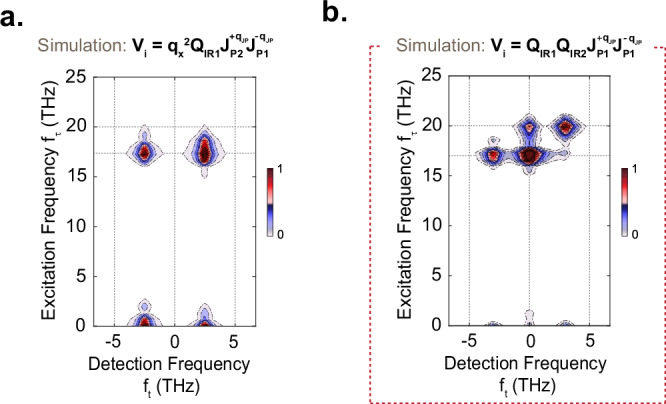
a Simulated two-dimensional Fourier spectrum for the three-mode mixing model as outlined in Fig. 2b, showing four peaks at corresponding frequency coordinates (−2.5;17), (2.5;17), (−2.5;0) and (2.5;0), all in units of THz. b Simulated two-dimensional Fourier spectrum for the four-mode mixing model as outlined in Fig. 2d, with four strong peaks at corresponding frequency coordinates (0;17), (0;20), (−3;17) and (3;20), all in units of THz. The red dashed box emphasizes that the four-mode mixing model is compatible with experimental data shown in Fig. 4.
Figure 5b shows the two-dimensional spectrum resulting from the four-mode mixing model with homodyne detection, which also exhibited good agreement with the experiment in the one-dimensional spectrum. Here, we find four dominant peaks at (0;17) THz, (0;20) THz, (-3;17) THz and (3; 20) THz. All of these peaks include homodyne contributions of the two driven phonons (as their interference produces a difference-frequency response at 3 THz), and from their cooperative amplification of JPPs. As discussed earlier, the homodyne detection of the amplified JPPs retrieves the non-radiating covariance of the amplified Josephson plasmon pairs (see Supplementary Information for a detailed discussion). This peak pattern uniquely agrees with the experimental two-dimensional spectrum, thus resolving the ambiguity of the single-pulse pump-probe experiment.
We also carried out both single and two-pump-tr-SHG probe experiments in the higher-doped compound YBa2Cu3O6.92. At this doping, the apical oxygen phonon frequencies are the same as those of YBa2Cu3O6.4837,66,67, but the zero-momentum inter-bilayer Josephson plasma resonance is blue-shifted to 7 THz68. Figure 6a compares the coherent contributions to the single-pump probe tr-SHG intensity for YBa2Cu3O6.48 (Tc = 48 K) and YBa2Cu3O6.92 (Tc = 91 K) at a sample temperature of 5 K. Both curves include high-frequency oscillations of the driven phonons, while the lower-frequency oscillations are heavily suppressed in YBa2Cu3O6.92 compared to YBa2Cu3O6.48. Figure 6b, c show nonlinear two-dimensional spectra from YBa2Cu3O6.48 and YBa2Cu3O6.92, respectively (see Supplementary Information for the corresponding time-domain data). Although in both compounds the peaks appear at the same frequency positions, the relative amplitudes of the peaks are weaker in the YBa2Cu3O6.92 doping.
Fig. 6. Temperature dependence of the SHG response in YBa2Cu3O6.48 and YBa2Cu3O6.92.

a Oscillatory component of the Mid-IR pump induced changes in second harmonic intensity as a function of detection time delay t for YBa2Cu3O6.48 (red, Tc = 48 K, excitation fluence of 5 mJ.cm-2) and YBa2Cu3O6.92 (blue, Tc = 92 K, approximate excitation fluence of 43 mJ.cm-2 nearly eight times higher than the underdoped measurement), both at base temperature of 5 K (below Tc). (b) Corresponding normalized nonlinear two-dimensional Fourier spectrum of YBa2Cu3O6.48 at base temperature of 20 K (below Tc), as in Fig. 4c. Excitation fluences for EA and EB were approximately 12 mJ.cm-2 and 6 mJ.cm-2, respectively. c Same as panel (b) for a different doping of YBa2Cu3O6.92. Excitation fluences for both EA and EB were approximately 8 mJ.cm-2. d Normalized frequency-integrated amplitude of nonlinear two-dimensional spectra of YBa2Cu3O6.48 as a function of base temperature (red circles, see Supplementary Information for details). The thick red line is a fit with a mean-field dependence (α + ), indicating that this quantity has a dominant contribution that dereases as temperature approaches the pseudogap temperature T* (380 K) and a contribution that takes a constant value α for all measured T. e Same as panel (d) for a different doping of YBa2Cu3O6.92. Here, the frequency-integrated nonlinear two-dimensional amplitude does not depend on temperature. Note that the temperature dependent data in each doping are measured under the same excitation fluence and the same two-dimensional time window for consistensy in the anaylysis.
The two-dimensional temperature-dependent measurements in both compounds are shown in Figs. 6d, e. We find that the integrated 2D-peak amplitudes measured in YBa2Cu3O6.48 consist of two components. One is temperature-dependent, exhibits a mean-field dependence proportional to with a characteristic temperature scale T* = 380 K, and is consistent with the temperature dependence reported in ref. 8, whilst a second component is weaker and temperature-independent. In contrast, the integrated 2D-peak amplitudes measured in YBa2Cu3O6.92 are temperature-independent up to 450 K, far above T* = 160 K.
In the case of YBa2Cu3O6.92, there is no symmetry-odd mode below a frequency of 2 THz66 and the plasmon drive is far from resonance (). Therefore, the data measured in YBa2Cu3O6.92 represents the 2D peak pattern which arises purely from homodyne mixing of the linearly excited phonon modes. Additionally, the 2D integrated amplitude being temperature independent implies that the excitation of the apical oxygen phonon modes is temperature independent as was also reported in ref. 8 based on the one-dimensional experiment.
We then attribute the temperature-dependent component of the 2D pattern in YBa2Cu3O6.48 to the four-mode mixing nonlinearity. Here, the plasmon amplification is a resonant process that dominates over the off-resonant temperature independent phonon homodyne mixing. The relevant temperature scale T* is consistent with the idea of finite frequency and momentum JPPs () fluctuating throughout the pseudo-gap phase.
The parametric plasmon amplification observed here provides a possible explanation for the measured superconducting-like features in the non-equilibrium THz reflectivity in YBa2Cu3O6+x. As illustrated in Fig. 7a, excitation of apical oxygen phonon modes at 17 THz and 20 THz leads to coherent amplification of pairs of finite momentum inter-bilayer JPPs which fulfill the resonance condition at 1.5 THz. These coherently amplified superconducting modes give rise to a characteristic plasma edge at , observed at a frequency blue-shifted relative to the equilibrium Josephson plasma resonance. A Fresnel-Floquet formalism was used to calculate the expected reflectivity of YBa2Cu3O6.48 under these driven conditions54,69 (see Supplementary Information). The results are shown in Fig. 7b (left panel). Starting from a featureless spectrum, a reflectivity edge emerges near 1.5 THz, in good agreement with experimental data (Fig. 7b (right panel))2,6,54,69.
Fig. 7. Four-mode mixing leading to photo-induced superconductivity in YBa2Cu3O6.48.

a Illustration of the coupling between phonon-driven amplified Josephson plasmon polaritons, assuming the four-mode mixing model, and the THz probe field, resulting in the observed photo-induced reflectivity edge. The mid-IR excitation pulse (yellow) resonantly excites the two apical oxygen phonon modes and (yellow shading) which parametrically amplify pairs of inter-bilayer Josephson plasma polaritons at frequencies (red shading). These excitations renormalize the reflection coefficient, as measured by the THz probe field at qx = 0 (grey pulses). b Comparison between experiment (left2,) and theory (right54,69,). Dashed black lines show the THz frequency reflectivity above Tc in equilibrium. Red solid lines are the THz frequency reflectivity following mid-IR excitation. In both plots, the yellow shaded area indicates the photo-induced changes at the photo-induced plasma edge (ωJPLI < 2 THz).
Discussion
In summary, multidimensional nonlinear spectroscopy was used to study the dynamics which follow strong-field excitation of the apical oxygen phonon modes and result in the emergence of superconducting-like transient THz frequency optical properties in YBa2Cu3O6.48. The 2D-peak pattern observed here, consisting of the cross-peak at ±3 THz, together with the photo-induced reflectivity edge at 1.5 THz, unambiguously point towards four-mode mixing between the two apical oxygen phonon modes and a pair of low-frequency modes. We note also that this four-mode mixing process possibly leads to the formation of a squeezed state of the lower frequency modes. While our results are consistent with a four-mode mixing by a pair of any optically active modes at 1.5 THz, the only candidates present in this frequency range below TC are the Josephson plasma polaritons. The amplification of pairs of linearly dispersing acoustic phonons is ruled out, as they cannot be excited by symmetry, nor can they modulate the second harmonic. The T* temperature scale of the parametrically amplified state suggests that the pseudo-gap phase hosts finite frequency and finite momentum JPPs.
We note that the generation of squeezed Josephson plasmons may point towards a mechanism for phase stabilization or phase-noise reduction in an incoherent superconductor, to be further explored by future theoretical and experimental work. This draws a connection to the observation that a fluctuating pseudo-gap phase, hosting some form of phase-incoherent superconductivity, is a pre-requisite for the formation of non-equilibrium coherence. Indeed, the other material systems in which some form of light-induced enhancement of superconductivity has been observed, namely K3C604,9,11 and κ-BEDT charge transfer salts5,10, also exhibit a strong vortex Nernst effect above Tc70,71. It remains to be understood if some form of mode-squeezing is relevant to the light-induced coherence in those compounds. More generally, the results reported here suggest a new framework for the engineering of parametrically amplified responses in materials, with potential connections to the physics of time crystal72–75 and to Floquet quantum matter76,77.
Methods
Sample preparation
The single crystals of YBa2Cu3O6+δ were grown in Y-stabilized zirconium crucibles. The hole doping of the Cu-O planes was adjusted by controlling the oxygen content of the CuO chain layer through annealing in flowing O2 and subsequent rapid quenching. A DC magnetization measurement was carried out to determine the critical temperatures of the superconducting transitions for the two doping levels (Tc = 48 K for YBa2Cu3O6.48, and Tc = 91 K for YBa2Cu3O6.92). The single crystals of YBa2Cu3O6.48 and YBa2Cu3O6.92 ac-surfaces were polished and mounted into an optical cryostat with achievable temperature range of 5 to 450 K.
Optical setup
In this experiment, a 1-kHz repetition rate Ti:sapphire femtosecond amplifier system (800 nm wavelength, 30 fs pulse duration) was used to pump two two-stage optical parametric amplifiers, seeded with the same white light continuum. The output signal pulses from the two OPAs, at 1235 nm and 1326 nm, were overlapped in a 350 μm thick GaSe crystal to generate CEP stable mid-IR pulses via the difference frequency generation (DFG). The mid-IR pump pulse duration (~150 fs duration) and frequency (~5 THz bandwidth, centered at 18 THz) were characterized by electro-optic sampling in a second GaSe crystal (~50 μm thickness). The mid-IR beam was focused to a spot size of ~ 70 μm on the sample. The pump polarization was fixed parallel to the YBa2Cu3O6+x c-axis.
The pump-induced dynamics of the symmetry-odd modes in the YBa2Cu3O6+x sample were sampled using time-resolved second harmonic generation of the 800 nm wavelength pulses, also polarized along the c-axis, which were focused to a spot diameter ~ 30 μm and overlapped with the mid-IR excitation pulses in a non-collinear geometry. The SH Intensity was collected in reflection geometry and detected by a photomultiplier.
The reflected probe pulses at 800 nm wavelength, used to detect the dynamics of symmetry-even modes, were separated from the SHG beam by a dichroic mirror. The photoinduced time-resolved polarization rotation of the 800 nm probe was measured by sending this beam to a half-wave plate and a Wollaston prism and detecting the difference signal of two intensity-balanced photodiodes.
In the nonlinear two-dimensional spectroscopy experiment, the excitation by two mid-IR pulses was accomplished by splitting the DFG output closely behind the GaSe crystal using a gold coated prism. One of the two pulses, EA, passed over a delay stage to control the excitation time delay τ and then recombined with EB before being focused onto the sample. The spot diameters are of order ~100 μm in this setup. Both pulses EA and EB were individually characterized by electro-optic sampling. Both the time profile and the spectral content were not affected with respect to the single pulse used in the one-dimensional experiments.
The time-delay dependent second harmonic intensity was detected as detailed above for single-pulse excitation. To isolate the nonlinear contribution to the SH intensity, the two excitation pulses EA and EB were mechanically chopped at frequencies fLaser/2 and fLaser/3, with fLaser the laser repetition rate, respectively. In this scheme, the nonlinear contribution appears at the difference frequency of the two choppers, i.e. at fLaser/6.
The time-delay dependent nonlinear polarization rotation of the 800 nm pulses was measured accordingly.
Supplementary information
Acknowledgements
We acknowledge C. Trallero-Herrero for illuminating discussions. The research leading to these results received funding from the European Research Council under the European Union’s Seventh Framework Program (FP7/2007-2013)/ERC Grant Agreement No. 319286 (QMAC). We appreciate support from the Deutsche Forschungsgemeinschaft (DFG) via the Cluster of Excellence ‘CUI: Advanced Imaging of Matter’ – EXC 2056 – project ID 390715994 and the priority program SFB925. M. H. Michael and A. Liu received funding from the Alexander von Humboldt Foundation. We thank M. Volkmann and P. Licht for their technical assistance, B. Fiedler and B. Höhling for their support in the fabrication of the electronic devices used on the measurement setup, F. Tellkamp for support relating to the data acquisition software and J. Harms for assistance with graphics.
Author contributions
N.T., M. Först, A.L. and A.C. conceived the experiment. A.C. supervised the project. The one-dimensional setup used in mid-IR pump and tr-SHG setup was built by M.F, A.vH. and the related measurements shown in Figs. 1 and 6 were performed by A.vH. and N.T. The two-dimensional mid-IR pump and tr-SHG setup was built by N.T. and M. Först. The mid-IR pump pulses were characterized by N.T. and D.P. The two-dimensional measurements were carried out by N.T. with support from E.R., A. L. and M. Först. Data analysis were performed by N. T. with support from A.L. The theory was developed by M.H. M., E.D., M.Fechner and N.T. The one- and two-dimensional numerical simulations shown in Figs. 2 and 5 were performed by N.T. with support from E.R and M.H.M. The theoretical calculation of the THz reflectivity was carried out by M. H.M. YBa2Cu3O6+x samples were provided by Y. L., S.N. and B.K. All the authors have contributed to the interpretation of the data. The manuscript was written by N.T., M. Först, M.H.M. and A.C. with contributions from all other authors.
Funding
Open Access funding enabled and organized by Projekt DEAL.
Data availability
The data that support the findings of this study are available from the corresponding author upon reasonable request.
Code availability
The simulation codes used in this study are available from the corresponding author upon reasonable request.
Competing interests
The authors declare no competing interests.
Footnotes
Publisher’s note Springer Nature remains neutral with regard to jurisdictional claims in published maps and institutional affiliations.
Supplementary information
The online version contains supplementary material available at 10.1038/s41535-025-00776-1.
References
- 1.Fausti, D. et al. Light-Induced Superconductivity in a Stripe-Ordered Cuprate. Science331, 189–191 (2011). [DOI] [PubMed] [Google Scholar]
- 2.Kaiser, S. et al. Optically induced coherent transport far above Tc in underdoped YBa2Cu3O6+ẟ. Phys. Rev. B89, 184516 (2014). [Google Scholar]
- 3.Hunt, C. R. et al. Two distinct kinetic regimes for the relaxation of light-induced superconductivity in La1.675Eu0.2Sr0.125CuO4. Phys. Rev. B91, 020505 (2015). [Google Scholar]
- 4.Mitrano, M. et al. Possible light-induced superconductivity in K3C60 at high temperature. Nature530, 461–464 (2016). [DOI] [PMC free article] [PubMed] [Google Scholar]
- 5.Buzzi, M. et al. Photomolecular High-Temperature Superconductivity. Phys. Rev. X10, 031028 (2020). [Google Scholar]
- 6.Hu, W. et al. Optically enhanced coherent transport in YBa2Cu3O6.5 by ultrafast redistribution of interlayer coupling. Nat. Mater.13, 705–711 (2014). [DOI] [PubMed] [Google Scholar]
- 7.Liu, B. et al. Pump Frequency Resonances for Light-Induced Incipient Superconductivity in YBa2Cu3O6.5. Phys. Rev. X10, 011053 (2020). [Google Scholar]
- 8.von Hoegen, A. et al. Amplification of Superconducting Fluctuations in Driven YBa2Cu3O6+x. Phys. Rev. X12, 031008 (2022). [Google Scholar]
- 9.Rowe, E. et al. Resonant enhancement of photo-induced superconductivity in K3C60. Nat. Phys19, 1821–1826 (2023). [Google Scholar]
- 10.Buzzi, M. et al. Phase Diagram for Light-Induced Superconductivity in κ-(ET)2-X. Phys. Rev. Lett.127, 197002 (2021). [DOI] [PubMed] [Google Scholar]
- 11.Budden, M. et al. Evidence for metastable photo-induced superconductivity in K3C60. Nat. Phys.17, 611–618 (2021). [Google Scholar]
- 12.Ribak, A. et al. Two-fluid dynamics in driven YBa2Cu3O6.48. Phys. Rev. B107, 104508 (2023). [Google Scholar]
- 13.Fava, S. et al. Magnetic field expulsion in optically driven YBa2Cu3O6.48. Nature632, 75–80 (2024). [DOI] [PMC free article] [PubMed] [Google Scholar]
- 14.Orenstein, J. & Dodge, J. S. Terahertz time-domain spectroscopy of transient metallic and superconducting states. Phys. Rev. B92, 134507 (2015). [Google Scholar]
- 15.Dodge, J. S., Lopez, L. & Sahota, D. G. Optical Saturation Produces Spurious Evidence for Photoinduced Superconductivity in K3C60. Phys. Rev. Lett.130, 146002 (2023). [DOI] [PubMed] [Google Scholar]
- 16.Nicoletti, D., Buzzi, M., Först, M. & Cavalleri, A. Comment on “Light-induced melting of competing stripe orders without introducing superconductivity in La1.875Ba0.125CuO4” (arXiv:2306.07869v1). arXiv:2306.14438. https://ui.adsabs.harvard.edu/abs/2023arXiv230614438N (2023).
- 17.Buzzi, M., Nicoletti, D., Rowe, E., Wang, E. & Cavalleri, A. Comment on arXiv:2210.01114: Optical Saturation Produces Spurious Evidence for Photoinduced Superconductivity in K3C60. arXiv:2303.10169. https://ui.adsabs.harvard.edu/abs/2023arXiv230310169B (2023).
- 18.Nicoletti, D. et al. Optically induced superconductivity in striped La2-xBaxCuO4by polarization-selective excitation in the near infrared. Phys. Rev. B90, 100503 (2014). [Google Scholar]
- 19.Casandruc, E. et al. Wavelength-dependent optical enhancement of superconducting interlayer coupling in La1.885Ba0.115CuO4. Phys. Rev. B91, 174502 (2015). [Google Scholar]
- 20.Cremin, K. A. et al. Photoenhanced metastable c-axis electrodynamics in stripe-ordered cuprate La1.885Ba0.115CuO4. Proc. Natl Acad. Sci.116, 19875–19879 (2019). [DOI] [PMC free article] [PubMed] [Google Scholar]
- 21.Niwa, H. et al. Light-induced nonequilibrium response of the superconducting cuprate La2-xSrxCuO4. Phys. Rev. B100, 104507 (2019). [Google Scholar]
- 22.Nishida, M., Katsumi, K., Song, D., Eisaki, H. & Shimano, R. Light-induced coherent interlayer transport in stripe-ordered La1.6-xNd0.4SrxCuO4. Phys. Rev. B107, 174523 (2023). [Google Scholar]
- 23.Katsumi, K. et al. Near-infrared light-induced superconducting-like state in underdoped YBa2Cu3Oy studied by c-axis terahertz third-harmonic generation. Phys. Rev. B107, 214506 (2023). [Google Scholar]
- 24.Zhang, S. J. et al. Photoinduced Nonequilibrium Response in Underdoped YBa2Cu3O6+x Probed by Time-Resolved Terahertz Spectroscopy. Phys. Rev. X10, 011056 (2020). [Google Scholar]
- 25.Schlawin, F., Dietrich, A. S. D., Kiffner, M., Cavalleri, A. & Jaksch, D. Terahertz field control of interlayer transport modes in cuprate superconductors. Phys. Rev. B96, 064526 (2017). [Google Scholar]
- 26.Okamoto, J. -i, Cavalleri, A. & Mathey, L. Theory of Enhanced Interlayer Tunneling in Optically Driven High-Tc Superconductors. Phys. Rev. Lett.117, 227001 (2016). [DOI] [PubMed] [Google Scholar]
- 27.Okamoto, J. -i, Hu, W., Cavalleri, A. & Mathey, L. Transiently enhanced interlayer tunneling in optically driven high-Tc superconductors. Phys. Rev. B96, 144505 (2017). [DOI] [PubMed] [Google Scholar]
- 28.Raines, Z. M., Stanev, V. & Galitski, V. M. Enhancement of superconductivity via periodic modulation in a three-dimensional model of cuprates. Phys. Rev. B91, 184506 (2015). [Google Scholar]
- 29.Kennes, D. M., Claassen, M., Sentef, M. A. & Karrasch, C. Light-induced d-wave superconductivity through Floquet-engineered Fermi surfaces in cuprates. Phys. Rev. B100, 075115 (2019). [Google Scholar]
- 30.Denny, S. J., Clark, S. R., Laplace, Y., Cavalleri, A. & Jaksch, D. Proposed Parametric Cooling of Bilayer Cuprate Superconductors by Terahertz Excitation. Phys. Rev. Lett.114, 137001 (2015). [DOI] [PubMed] [Google Scholar]
- 31.Laplace, Y. & Cavalleri, A. Josephson plasmonics in layered superconductors. Adv. Phys.: X1, 387–411 (2016). [Google Scholar]
- 32.van der Marel, D. & Tsvetkov, A. Transverse optical plasmons in layered superconductors. Czechoslovak J. Phys.46, 3165–3168 (1996). [Google Scholar]
- 33.van der Marel, D. & Tsvetkov, A. A. Transverse-optical Josephson plasmons: Equations of motion. Phys. Rev. B64, 024530 (2001). [Google Scholar]
- 34.Munzar, D., Bernhard, C., Golnik, A., Humlíček, J. & Cardona, M. Anomalies of the infrared-active phonons in underdoped YBa2Cu3Oy as evidence for the intra-bilayer Josephson effect. Solid State Commun.112, 365–369 (1999). [Google Scholar]
- 35.Grüninger, M., van der Marel, D., Tsvetkov, A. A. & Erb, A. Observation of Out-of-Phase Bilayer Plasmons in YBa2Cu3O7-δ. Phys. Rev. Lett.84, 1575–1578 (2000). [DOI] [PubMed] [Google Scholar]
- 36.Lu, Q. et al. Surface Josephson plasma waves in a high-temperature superconductor. npj Quantum Mater.5, 69 (2020). [Google Scholar]
- 37.Homes, C. C., Timusk, T., Liang, R., Bonn, D. A. & Hardy, W. N. Optical conductivity of c axis oriented YBa2Cu3O6.70: Evidence for a pseudogap. Phys. Rev. Lett.71, 1645–1648 (1993). [DOI] [PubMed] [Google Scholar]
- 38.Dubroka, A. et al. Evidence of a Precursor Superconducting Phase at Temperatures as High as 180 K in RBa2Cu3O7-δ (R= Y, Gd, Eu) Superconducting Crystals from Infrared Spectroscopy. Phys. Rev. Lett.106, 047006 (2011). [DOI] [PubMed] [Google Scholar]
- 39.Tom, T. & Bryan, S. The pseudogap in high-temperature superconductors: an experimental survey. Rep. Prog. Phys.62, 61 (1999). [Google Scholar]
- 40.Dordevic, S. V., Komiya, S., Ando, Y. & Basov, D. N. Josephson Plasmon and Inhomogeneous Superconducting State in La2-xSrxCuO4. Phys. Rev. Lett.91, 167401 (2003). [DOI] [PubMed] [Google Scholar]
- 41.Cyr-Choinière, O. et al. Pseudogap temperature T* of cuprate superconductors from the Nernst effect. Phys. Rev. B97, 064502 (2018). [Google Scholar]
- 42.Hamidian, M. H. et al. Detection of a Cooper-pair density wave in Bi2Sr2CaCu2O8+x. Nature532, 343–347 (2016). [DOI] [PubMed] [Google Scholar]
- 43.Rajasekaran, S. et al. Probing optically silent superfluid stripes in cuprates. Science359, 575–579 (2018). [DOI] [PubMed] [Google Scholar]
- 44.Berg, E., Fradkin, E., Kivelson, S. A. & Tranquada, J. M. Striped superconductors: how spin, charge and superconducting orders intertwine in the cuprates. N. J. Phys.11, 115004 (2009). [Google Scholar]
- 45.Zhang, Y. et al. Squeezed light from a nanophotonic molecule. Nat. Commun.12, 2233 (2021). [DOI] [PMC free article] [PubMed] [Google Scholar]
- 46.Even Tzur, M. et al. Photon-statistics force in ultrafast electron dynamics. Nat. Photonics17, 501–509 (2023). [Google Scholar]
- 47.Schnabel, R. Squeezed states of light and their applications in laser interferometers. Phys. Rep.684, 1–51 (2017). [Google Scholar]
- 48.Fechner, M. et al. Quenched lattice fluctuations in optically driven SrTiO3. Nat. Mater.23, 363–368 (2024). [DOI] [PMC free article] [PubMed] [Google Scholar]
- 49.Vogt, H. & Neumann, G. Observation of infrared active and silent modes in cubic crystals by hyper-Raman scattering. [], Medium: X; Size: Pages: 57-63, (1979).
- 50.Chang, Y. M., Xu, L. & Tom, H. W. K. Observation of Coherent Surface Optical Phonon Oscillations by Time-Resolved Surface Second-Harmonic Generation. Phys. Rev. Lett.78, 4649–4652 (1997). [Google Scholar]
- 51.Zhao, H. B. et al. Detection of coherent acoustic phonons by time-resolved second-harmonic generation. Phys. Rev. B83, 212302 (2011). [Google Scholar]
- 52.Mankowsky, R., von Hoegen, A., Först, M. & Cavalleri, A. Ultrafast Reversal of the Ferroelectric Polarization. Phys. Rev. Lett.118, 197601 (2017). [DOI] [PubMed] [Google Scholar]
- 53.Fiebig, M., Pavlov, V. V. & Pisarev, R. V. Second-harmonic generation as a tool for studying electronic and magnetic structures of crystals: review. J. Opt. Soc. Am. B22, 96–118 (2005). [Google Scholar]
- 54.Michael, M. H. et al. Parametric resonance of Josephson plasma waves: A theory for optically amplified interlayer superconductivity in YBa2Cu3O6+x. Phys. Rev. B102, 174505 (2020). [Google Scholar]
- 55.Garrett, G. A., Rojo, A. G., Sood, A. K., Whitaker, J. F. & Merlin, R. Vacuum Squeezing of Solids: Macroscopic Quantum States Driven by Light Pulses. Science275, 1638–1640 (1997). [DOI] [PubMed] [Google Scholar]
- 56.Bartels, A., Dekorsy, T. & Kurz, H. Impulsive Excitation of Phonon-Pair Combination States by Second-Order Raman Scattering. Phys. Rev. Lett.84, 2981–2984 (2000). [DOI] [PubMed] [Google Scholar]
- 57.Hu, X. & Nori, F. Squeezed Phonon States: Modulating Quantum Fluctuations of Atomic Displacements. Phys. Rev. Lett.76, 2294–2297 (1996). [DOI] [PubMed] [Google Scholar]
- 58.Woerner, M., Kuehn, W., Bowlan, P., Reimann, K. & Elsaesser, T. Ultrafast two-dimensional terahertz spectroscopy of elementary excitations in solids. N. J. Phys.15, 025039 (2013). [Google Scholar]
- 59.Mashkovich, E. A. et al. Terahertz light–driven coupling of antiferromagnetic spins to lattice. Science374, 1608–1611 (2021). [DOI] [PubMed] [Google Scholar]
- 60.Somma, C., Folpini, G., Reimann, K., Woerner, M. & Elsaesser, T. Two-Phonon Quantum Coherences in Indium Antimonide Studied by Nonlinear Two-Dimensional Terahertz Spectroscopy. Phys. Rev. Lett.116, 177401 (2016). [DOI] [PubMed] [Google Scholar]
- 61.Blank, T. G. H. et al. Two-Dimensional Terahertz Spectroscopy of Nonlinear Phononics in the Topological Insulator MnBi2Te4. Phys. Rev. Lett.131, 026902 (2023). [DOI] [PubMed] [Google Scholar]
- 62.Pal, S. et al. Origin of Terahertz Soft-Mode Nonlinearities in Ferroelectric Perovskites. Phys. Rev. X11, 021023 (2021). [Google Scholar]
- 63.Liu, A. et al. Probing inhomogeneous cuprate superconductivity by terahertz Josephson echo spectroscopy. Nat. Phys.20, 1751–1756 (2024). [Google Scholar]
- 64.Zhang, Z. et al. Terahertz-field-driven magnon upconversion in an antiferromagnet. 20. Nat. Phys20, 788–793 (2024). [Google Scholar]
- 65.Zhang, Z. et al. Terahertz field-induced nonlinear coupling of two magnon modes in an antiferromagnet. Nat. Phys20, 801–806 (2024). [Google Scholar]
- 66.Homes, C. C., Timusk, T., Bonn, D. A., Liang, R. & Hardy, W. N. Optical properties along the c-axis of YBa2Cu3O6+x, for x = 0.50 → 0.95 evolution of the pseudogap. Phys. C: Superconduc. 254, 265–280 (1995).
- 67.Schützmann, J., Tajima, S., Miyamoto, S., Sato, Y. & Hauff, R. Doping and temperature dependence of c-axis optical phonons in YBa2Cu3Oy single crystals. Phys. Rev. B52, 13665–13673 (1995). [DOI] [PubMed] [Google Scholar]
- 68.Koyama, T. Josephson Plasma Resonances and Optical Properties in High-Tc Superconductors with Alternating Junction Parameters. J. Phys. Soc. Jpn.71, 2986–2993 (2002). [Google Scholar]
- 69.Michael, M. H. et al. Generalized Fresnel-Floquet equations for driven quantum materials. Phys. Rev. B105, 174301 (2022). [Google Scholar]
- 70.Jotzu, G. et al. Superconducting Fluctuations Observed Far above Tc in the Isotropic Superconductor K3C60. Phys. Rev. X13, 021008 (2023). [Google Scholar]
- 71.Nam, M.-S., Ardavan, A., Blundell, S. J. & Schlueter, J. A. Fluctuating superconductivity in organic molecular metals close to the Mott transition. Nature449, 584–587 (2007). [DOI] [PubMed] [Google Scholar]
- 72.Lyubarov, M. et al. Amplified emission and lasing in photonic time crystals. Science377, 425–428 (2022). [DOI] [PubMed] [Google Scholar]
- 73.Wang, X. et al. Metasurface-based realization of photonic time crystals. Sci. Adv.9, eadg7541 (2023). [DOI] [PMC free article] [PubMed] [Google Scholar]
- 74.Michael, M. H. et al. Photonic time-crystalline behaviour mediated by phonon squeezing in Ta2NiSe5. Nat. Commun.15, 3638 (2024). [DOI] [PMC free article] [PubMed] [Google Scholar]
- 75.Haque, S. R. U. et al. Terahertz parametric amplification as a reporter of exciton condensate dynamics. Nature Mater.23, 796–802 (2024). [DOI] [PubMed] [Google Scholar]
- 76.Wang, Y. H., Steinberg, H., Jarillo-Herrero, P. & Gedik, N. Observation of Floquet-Bloch States on the Surface of a Topological Insulator. Science342, 453–457 (2013). [DOI] [PubMed] [Google Scholar]
- 77.Oka, T. & Kitamura, S. Floquet Engineering of Quantum Materials. Annu. Rev. Condens. Matter Phys.10, 387–408 (2019). [Google Scholar]
Associated Data
This section collects any data citations, data availability statements, or supplementary materials included in this article.
Supplementary Materials
Data Availability Statement
The data that support the findings of this study are available from the corresponding author upon reasonable request.
The simulation codes used in this study are available from the corresponding author upon reasonable request.