

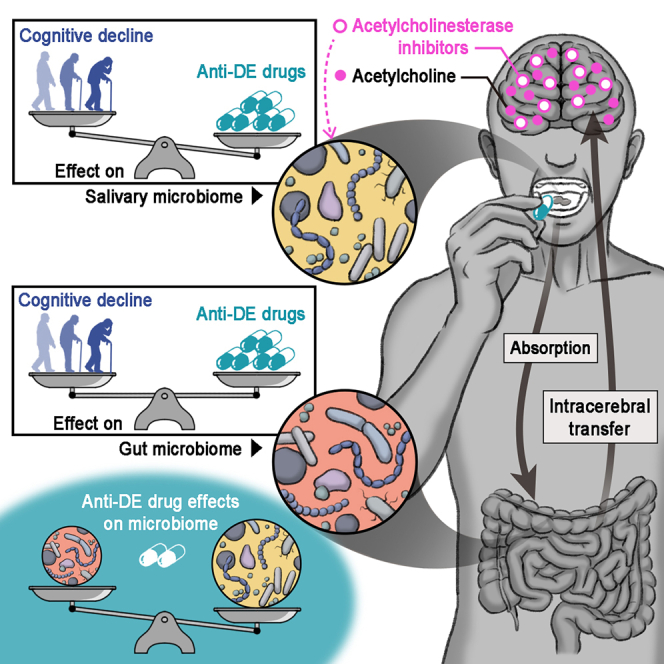
Summary
Microbiome alterations are reportedly linked to systemic disease progression and medication. However, the effects of central nervous system drugs on the microbiome of patients with neurodegenerative diseases, such as Alzheimer’s or Parkinson’s disease, are poorly understood. Here, we comprehensively analyzed the effects of medication on the salivary and gut microbiomes of patients with Alzheimer’s or Parkinson’s disease. Comparative analyses of the effects of disease severity and drug use revealed that anti-dementia (DE) drugs, particularly acetylcholinesterase inhibitors, had a greater effect on compositional changes in the salivary microbiome than on those in the gut microbiome. Multivariate analyses incorporating anti-DE drug use showed that microbial signatures may serve as promising disease biomarkers, enabling the development of more precise predictors of cognitive function. Our findings will facilitate the advancement of diagnostic tools leveraging the salivary microbiome.
Subject areas: Health sciences, Medicine, Medical specialty, Psychiatry, Internal medicine, Neurology
Graphical abstract
Highlights
-
•
The microbiomes of patients with Alzheimer’s or Parkinson’s diseases were analyzed
-
•
CNS drugs significantly affected the salivary and gut microbiomes
-
•
Anti-dementia drugs had a greater effect on the salivary microbiome than cognition
-
•
AChEis affected the salivary microbiome more than affecting the gut microbiome
Health sciences; Medicine; Medical specialty; Psychiatry; Internal medicine; Neurology
Introduction
Differences in experimental design (e.g., facility location,1 sample collection timing,2 and DNA extraction protocols3) and host variables (e.g., age, sex, and diet)4,5,6 have led to different outcomes in the field of microbiome research. In human studies, the use of prescription drugs, a host variable, might be a major confounder of microbiome composition. Recently, studies have been conducted on the interactions between prescription drugs and the human microbiome,7,8,9 with researchers focusing on the association between gut microbiome alterations and medications for gastrointestinal and metabolic diseases.10,11,12
In patients with dementia (DE), including those with Alzheimer’s disease (AD) or Parkinson’s disease (PD), changes in salivary/oral and gut microbiomes are correlated with cognitive function13,14,15,16,17,18,19,20 and disease progression.21,22,23,24 In the salivary microbiome, the abundance of several bacteria differs between patients with AD and those with mild cognitive impairment (MCI), a preclinical stage of DE,13 as well as between patients with APOE ε4 polymorphism, a significant risk factor for sporadic AD, and those without.14 To investigate the significant microbial signatures associated with dysbiosis in cognitive impairment and PD pathogenesis, gnotobiotic models have been developed based on insights derived from human gut microbiome analyses.16,25,26,27,28 Thus, the gut microbiome attracts attention for its pathogenetic influence via the gut-brain axis, whereas the salivary microbiome attracts attention because of its diagnostic potential for neurodegenerative diseases. However, the relationship between salivary and gut microbiome diversity and cognitive function remains controversial.29,30 DE is a complex disease associated with various conditions, such as AD, DE with Lewy bodies, PD, heart disease, and diabetes mellitus; therefore, affected patients are prescribed many drugs, including anti-DE and anti-PD drugs.31,32 Acetylcholinesterase inhibitors (AChEis), such as donepezil, and N-methyl-D-aspartate receptor antagonists (NMDAras), such as memantine, have been worldwide approved as anti-DE drugs.33 Anti-DE drugs can be administered in three different ways due to their different modes of action: AChEi monotherapy, NMDAra monotherapy, or a combination of these drugs. Depending on their symptoms, patients with PD are prescribed a combination of several anti-PD drugs, including levodopa, dopamine agonists, catechol-O-methyl transferase inhibitors (COMTis), and anticholinergics.34 Anti-PD drugs also include an NMDAra (amantadine HCl), with a mode of action similar to that of anti-DE drugs. A previous study suggests that gut microbiome alterations are related to the use of COMTi and amantadine HCl, whereas alterations of the oral microbiome (obtained from buccal samples) are related to the use of dopamine agonists and amantadine HCl in patients with PD.22 However, the effects of central nervous system (CNS) drugs, especially anti-DE drugs that change cerebral neurotransmission on the microbiome are largely unknown. To date, few studies have considered the effects of medications on microbiomes or compared the effects of disease severity and drug use, leading to poor cross-study replicability.
A recent study evaluated the effects of sample collection timing from a distance (dissimilarity) based on the weighted UniFrac β-diversity.2 The weighted UniFrac distance considers both the phylogeny and relative abundance of microorganisms, and is potentially suitable for evaluating the effects of drugs without antibacterial activity. Thus, in this study, we aimed to compare the effects of disease severity (i.e., cognitive function and disease staging) and drug use (i.e., anti-DE and PD drugs) on both salivary and gut microbiome compositions in Japanese patients with AD or PD using a similar approach based on the weighted UniFrac β-diversity. Previous studies using population-based cohort analyses showed an association between the gut microbiome and commonly prescribed drugs7,8,9; however, it has been pointed out that a disease-based classification (e.g., anti-diabetic drugs) makes differentiating to determine whether the drug or disease causes the effect.10 Therefore, we divided all prescribed drugs into 26 categories based on their mode of action (see STAR Methods) and performed multivariate analyses to evaluate the contribution of these drugs and other host variables (e.g., oral health) on the salivary and gut microbiomes. Moreover, we generated predictive microbial models that consider the use of prescription drugs affecting microbiome composition to classify disease severity. The accuracy of AD prediction in patients with proteinopathy was compared between salivary and fecal samples, indicating that the salivary microbiome may be more appropriate than the gut microbiome for distinguishing between AD and PD. Our findings provide new insights into the association between systemic disease progression and human microbiome, particularly regarding the use of prescription drugs. Finding a promising salivary microbial signature as a biomarker that correlates with cognitive function requires the consideration of anti-DE drug effects.
Results
Anti-DE drugs have a stronger influence than cognitive impairment on the salivary microbiome
We performed bacterial 16S ribosomal RNA (rRNA) gene sequencing of saliva and fecal samples from the AD cohort, which consists of patients with MCI or DE, and cognitively healthy controls (HCs) attending a dementia clinic (Figure 1A). The participants in the AD cohort were categorized into three sets. The “treated” set comprised patients treated with anti-DE drugs, the “untreated” set comprised patients without anti-DE drugs, and the “whole” set comprised a mixture of treated and treatment-naïve patients (Figure 1A). We divided the cognitive impairment groups (MCI and DE) into four subgroups according to the type of anti-DE drug used:33 non-users, AChEi-treated, NMDAra-treated, and AChEi plus NMDAra (A + N)-treated subgroups (Figure 1A). In the AD cohort, some participants were diagnosed as HC based on cognitive function tests but were prescribed anti-DE drugs. We collected metadata on host variables, such as oral health, frequency of alcohol consumption and smoking, and prescription drugs (see STAR Methods). The prescribed drugs were categorized according to their modes of action (Table S1). The participant characteristics, including the percentage of each prescribed drug category, are shown in Tables 1, S2, and S3. To further explore the effects of CNS drugs in patients with proteinopathy, we defined 21 drug categories according to the mode of action (Table S1). To evaluate how these variables influence the microbiome composition, we initially performed a stepwise redundancy analysis (RDA) using the weighted UniFrac distance with all metadata, including the number of prescribed drugs (0, 1–5, and ≥6) and drug formulation (oral medicine, orally disintegrating tablets, or transdermal patches). This multivariate approach showed a significant contribution of sex, age, and AChEis to salivary microbiome composition in the cognitive impairment group (cumulative adjusted R2: sex = 2.5% [p = 0.002], age = 3.7% [p = 0.011], and AChEi = 4.5% [p = 0.033]; Tables S4 and S5). AChEis may contribute significantly more to the salivary microbiome composition than oral health variables (Tables S4 and S5). None of the variables significantly contributed to the gut microbiome composition (Tables S6 and S7).
Figure 1.

Contribution of disease severity (cognitive impairment) and anti-DE drug use on human microbiome diversity in the AD cohort
(A) Participant characteristics in the AD cohort. The participants were divided into the HC, MCI, and DE groups based on cognitive function test scores. The whole set consists of patients treated with anti-DE drugs and anti-DE drug-naïve patients. The cognitive impairment (MCI and DE) group was further divided into four subgroups according to the type of anti-DE drug used: non-user, AChEi-treated, NMDAra-treated, and A + N-treated subgroups. In the AD cohort, disease severity indicates differences in cognitive function, and drug use indicates differences in anti-DE drug use.
(B) Individual and cumulative adjusted R2 (explained variance) of covariates in stepwise RDA using the weighted UniFrac distance on the salivary (n = 238) and gut (n = 107) microbiome. The graph excludes negative values for individual adjusted R2. ∗p < 0.05; ∗∗p < 0.01; ∗∗∗p < 0.005.
(C and D) Heatmap of the mean DBGs in the three cognitive function groups and the four subgroups based on anti-DE drug use. The mean values were calculated using the weighted UniFrac distance matrix on the salivary (n = 238; C) and gut (n = 107; D) microbiome analyses.
(E) Comparison of the mean DBGs (shown in C and D) by disease severity (n = 6) and drug use (n = 6) on the salivary and gut microbiome. The boxplots present the median, 25th, and 75th percentiles. Black dots indicate the whole set and red dots indicate the untreated set. Statistical significance was determined using the Wilcoxon rank-sum test (p < 0.05).
(F and G) Graphs showing the weighted UniFrac β-diversity (R2) on the salivary (F) and gut (G) microbiome among the three cognitive function groups and the anti-DE drug subgroups of patients with cognitive impairment. The R2 and p values were determined using permutational multivariate analysis of variance via the Benjamini-Hochberg method.
(H) Graph showing the −log10 weighted UniFrac β-diversity p value indicates the effects of anti-DE drug use on the salivary and gut microbiome in the same specimens from individual cohorts (n = 62).
The distribution of participants in the salivary microbiome analyses (shown in C and F) is as follows: whole set: HC = 42, MCI = 87, DE = 109; untreated set: HC = 35, MCI = 46, DE = 15; and anti-DE drug subgroup: non-user = 61, AChEi = 68, NMDAra = 35, A + N = 32. The distribution of participants in the gut microbiome analyses (shown in D and G) is as follows: whole set: HC = 25, MCI = 29, DE = 53; untreated set: HC = 17, MCI = 9, DE = 3; anti-DE drug subgroup: non-user = 12, AChEi = 33, NMDAra = 16, A + N = 21.
Table 1.
Demographics and prescribed drugs by cognitive function group in the AD cohort
| Demographic variable | Saliva | Feces | p value (Saliva/Feces) |
|---|---|---|---|
| Number of participants | HC: 42, MCI: 87, DE: 109 | HC: 25, MCI: 29, DE: 53 | – |
| Age (years), mean ± SD | HC: 76.0 ± 5.8, MCI: 77.2 ± 5.7, DE: 78.5 ± 6.0 | HC: 76.6 ± 7.1, MCI: 77.6 ± 5.1, DE: 80.0 ± 6.4 | 0.057–0.572/0.066–0.835 |
| Sex (male), % | HC: 31.0, MCI: 51.7, DE: 40.4 | HC: 56.0, MCI: 69.0, DE: 52.8 | 0.066–0.544/0.340–0.962 |
| MMSE, mean ± SD | HC: 27.8 ± 1.8, MCI: 24.7 ± 2.2, DE: 18.1 ± 4.1 | HC: 28.7 ± 1.3, MCI: 25.2 ± 1.7, DE: 16.8 ± 5.1 | <2.41E−06/< 0.004 |
| HDS-Rb, mean ± SD | HC: 27.9 ± 1.4, MCI: 23.9 ± 3.4, DE: 16.5 ± 4.9 | HC: 27.3 ± 2.6, MCI: 24.3 ± 3.3, DE: 15.1 ± 5.2 | <3.46E−05/< 0.032 |
| ADAS-cogc, mean ± SD | HC: 6.2 ± 2.3, MCI: 10.3 ± 3.7, DE: 18.6 ± 6.9 | HC: 6.0 ± 3.2, MCI: 10.6 ± 3.5, DE: 18.3 ± 6.2 | <5.57E−05/< 0.006 |
| CNS drug category, % (n) | |||
| Non-BZD hypnotics | HC: na, MCI: 1.6 (1), DE: 2.9 (3) | HC: na, MCI: 0 (0), DE: 1.9 (1) | 0.578a/0.322a |
| BZD receptor agonists | HC: na, MCI: 14.3 (9), DE: 5.7 (6) | HC: na, MCI: 10.3 (3), DE: 5.7 (3) | 0.089a/0.481a |
| Orexin receptor antagonists | HC: na, MCI: 1.6 (1), DE: 2.9 (3) | HC: na, MCI: 0 (0), DE: 9.4 (5) | 0.578a/0.024a |
| Tricyclic/tetracyclic antidepressants | HC: na, MCI: 3.2 (2), DE: 1.9 (2) | HC: na, MCI: 3.4 (1), DE: 3.8 (2) | 0.626a/0.941a |
| NMDAras | HC: 0 (0), MCI: 19.0 (12), DE: 52.4 (55) | HC: 4.0 (1), MCI: 24.1 (7), DE: 56.6 (30) | <3.28E−06, 0.059 (HC vs. MCI)/< 0.004, 0.205 (HC vs. MCI) |
| AChEis | HC: 16.7 (7), MCI: 52.4 (33), DE: 61.9 (65) | HC: 28.0 (7), MCI: 55.2 (16), DE: 71.7 (38) | <0.001, 0.417 (MCI vs. DE)/< 0.001 (HC vs. DE), 0.091–0.285 |
| Anticholinergics | HC: na, MCI: 3.2 (2), DE: 1.0 (1) | HC: na, MCI: 3.4 (1), DE: 3.8 (2) | 0.361a/0.941a |
| Other CNS drugs | HC: na, MCI: 3.2 (2), DE: 2.9 (3) | HC: na, MCI: 3.4 (1), DE: 5.7 (3) | 0.909a/0.640a |
| Drug category, % (n) | |||
| CNS drugs | HC: na, MCI: 74.6 (47), DE: 91.4 (96) | HC: na, MCI: 75.9 (22), DE: 96.2 (51) | 0.008a/0.022a |
| PNS-N drugs | HC: na, MCI: 4.8 (3), DE: 10.5 (11) | HC: na, MCI: 6.9 (2), DE: 5.7 (3) | 0.159a/0.831a |
| Arachidonate cascade regulators | HC: na, MCI: 6.3 (4), DE: 2.9 (3) | HC: na, MCI: 10.3 (3), DE: 1.9 (1) | 0.321a/0.172a |
| RAAS-targeting drugs | HC: na, MCI: 3.2 (2), DE: 3.8 (4) | HC: na, MCI: 6.9 (2), DE: 7.5 (4) | 0.828a/0.914a |
| Voltage-gated ion channel-targeting drugs | HC: na, MCI: 7.9 (5), DE: 10.5 (11) | HC: na, MCI: 6.9 (2), DE: 20.8 (11) | 0.579a/0.064a |
| DPP-4 inhibitors | HC: na, MCI: 3.2 (2), DE: 1.9 (2) | HC: na, MCI: 3.4 (1), DE: 3.8 (2) | 0.626a/0.941a |
| Statins | HC: na, MCI: 9.5 (6), DE: 6.7 (7) | HC: na, MCI: 6.9 (2), DE: 9.4 (5) | 0.523a/0.687a |
| Anticoagulants | HC: na, MCI: 3.2 (2), DE: 3.8 (4) | HC: na, MCI: 6.9 (2), DE: 3.8 (2) | 0.828a/0.571a |
| ATP-ADP-cAMP pathway regulators | HC: na, MCI: 3.2 (2), DE: 3.8 (4) | HC: na, MCI: 3.4 (1), DE: 5.7 (3) | 0.828a/0.640a |
| PPIs | HC: na, MCI: 6.3 (4), DE: 2.9 (3) | HC: na, MCI: 10.3 (3), DE: 3.8 (2) | 0.321a/0.306a |
| Vitamins | HC: na, MCI: 4.8 (3), DE: 3.8 (4) | HC: na, MCI: 3.4 (1), DE: 3.8 (2) | 0.773a/0.941a |
| Kampo | HC: na, MCI: 4.8 (3), DE: 15.2 (16) | HC: na, MCI: 13.8 (4), DE: 17.0 (9) | 0.020a/0.704a |
| Other drugs | HC: na, MCI: 6.3 (4), DE: 4.8 (5) | HC: na, MCI: 10.3 (3), DE: 11.3 (6) | 0.672a/0.893a |
AChEis, acetylcholinesterase inhibitors; AD, Alzheimer’s disease; ADAS-cog, Alzheimer’s Disease Assessment Scale-Cognitive Subscale; BZD, benzodiazepine; CNS, central nervous system; DE, dementia; DPP4, dipeptidylpeptidase 4; HC, cognitively healthy control; HDS-R, revised Hasegawa Dementia Scale score; MCI; mild cognitive impairment; MMSE, Mini-Mental State Examination; na, not available; NMDAra, N-methyl-D-aspartate receptor antagonist, PNS-N, peripheral nervous system via neurotransmitters; PPI, proton pump inhibitor; RAAS, renin-angiotensin-aldosterone system; SD, standard deviation.
The p values were estimated using Tukey’s test for demographic and CNS drug categories (NMDAras and AChEis). Also see Tables S2 and S3.
The p values were estimated using Welch’s t test for the CNS and drug categories.
Number of participants tested (saliva: n = 204; feces: n = 104).
Number of participants tested (saliva: n = 203; feces: n = 98).
To further compare the effects of disease severity with those of drug use, we defined changes in cognitive function among HC, MCI, and DE groups as “disease severity (cognition)” and the type of anti-DE drugs (i.e., differences among non-user, AChEi-treated, NMDAra-treated, and A + N-treated subgroups) as “drug use (anti-DE drugs)” in this study (Figure 1A). A weighted UniFrac distance-based stepwise RDA using four variables (age, sex, cognition, and anti-DE drugs) showed a significant contribution of sex and anti-DE drugs to the salivary microbiome composition in the whole set (cumulative adjusted R2: sex = 1.3% [p = 0.006] and anti-DE drugs = 2.5% [p = 0.002]; Figure 1B; Table S8). Only sex significantly contributed to gut microbiome composition in the whole set (cumulative adjusted R2: sex = 1.1% [p = 0.029]; Figure 1B; Table S8). To quantify the effect of cognition and anti-DE drugs on microbiome composition, we adopted the distance between groups (DBGs) based on the weighted UniFrac distance matrix of all samples to determine how similar or different microbiome compositions from two groups (e.g., MCI and DE or non-user and AChEi-treated subgroup) were to each other in the whole set, untreated set, and cognitive impairment groups, respectively. We first visualized the DBGs using heatmaps to illustrate all combinations of cognition and anti-DE drug categories (Figures 1C and 1D). In the salivary microbiome, the DBG between the MCI and DE groups was the most distant, whereas the DBG between the HC and MCI groups was the closest in both whole and untreated sets (Figure 1C). The DBG between the AChEi- and NMDAra-treated subgroups was the most distant in the cognitive impairment group (Figure 1C). Conversely, in the gut microbiome, the most distant DBG in the untreated set was observed between the HC and MCI groups (Figure 1D). The DBG between the AChEi- and A + N-treated subgroups was the most distant in the cognitive impairment group (Figure 1D). A comparison of median DBGs across combinations revealed that in the salivary microbiome, the DBG associated with anti-DE drug use was significantly greater than that associated with cognition (p = 0.009; Figure 1E). However, no significant differences were observed regarding the gut microbiome composition (Figure 1E). We then evaluated the weighted UniFrac distance-based β-diversity for all combinations. Significant differences between the non-user and AChEi-treated, non-user and A + N-treated, and AChEi-treated and NMDAra-treated subgroups were observed in the salivary microbiome (p = 0.027, 0.027, and 0.027, respectively); however, no differences were observed in the whole and untreated sets based on cognition (Figure 1F). Besides, no significant differences were observed in any of the gut microbiome combinations (Figure 1G). These results showed that drug use had a greater effect on the salivary microbiome composition than disease severity. Moreover, we compared the −log10 p values of the weighted UniFrac β-diversity between saliva and feces regarding the effect of anti-DE drug use. All values for saliva were higher than those for feces in the analysis using samples from the same specimen (Figure 1H). These results suggest that anti-DE drug use has a greater influence on the microbiome composition of saliva than on that of the gut.
We performed Shannon diversity (evenness within a specimen) analyses to determine the influence of cognition and anti-DE drugs on the microbiome composition; however, no significant differences were observed in the salivary and gut microbiomes (Figures S1A–S1D).
Effects of anti-PD drug use and disease stage on microbiomes
To further compare the effects of disease severity and drug use on the microbiomes of patients with proteinopathy, we performed 16S rRNA gene sequencing of the salivary and gut microbiomes obtained from the patients with PD. We collected metadata similar to the analyses of the AD cohort. Table 2 lists the participant characteristics. In the PD cohort, we categorized the participants into three disease severity groups according to the Hoehn and Yahr (H&Y) stages (I, II, and III; Figure 2A). Depending on their symptoms, the patients were prescribed a combination of anti-PD drugs.34 These patients were divided into non-users and users of each of the 10 anti-PD drugs. These differences were defined as “disease severity (H&Y stages)” and “drug use (anti-PD drugs)” (Figure 2A). We first performed a weighted UniFrac distance-based stepwise RDA with all metadata and found that proton pump inhibitors (PPIs), voltage-gated ion channel-targeting drugs, age, and statins significantly contributed to the salivary microbiome composition (cumulative adjusted R2: PPIs = 7.1% [p = 0.010], voltage-gated ion channel-targeting drugs = 11.8% [p = 0.030], age = 17.1% [p = 0.009], and statins = 19.9% [p = 0.046]; Tables S9 and S10). H&Y stage and age significantly contributed to the gut microbiome composition (cumulative adjusted R2: H&Y stages = 9.5% [p = 0.003] and age = 14.5% [p = 0.007]; Tables S11 and S12). Consistent with the results in the AD cohort, host variables, including oral health, smoking, and alcohol consumption, did not contribute to the salivary and gut microbiome compositions in patients with PD (Tables S9, S10, S11, and S12).
Table 2.
Demographics and prescribed drugs by Hoehn and Yahr scale score in the PD cohort
| Demographic variable | Saliva | Feces | p value (Saliva/Feces) |
|---|---|---|---|
| Number of participants | I: 18, II: 31, III: 11, IV: 1 | I: 13, II: 19, III: 4 | – |
| Age (years), mean ± SD | I: 59.9 ± 12.9, II: 65.0 ± 13.6, III: 61.5 ± 8.1 | I: 62.3 ± 12.3, II: 71.2 ± 8.8, III: 62.5 ± 7.4 | 0.382–0.943/0.066–0.999 |
| Sex (male), % | I: 55.6, II: 51.6, III: 41.7 | I: 53.8, II: 47.4, III: 50.0 | 0.747–0.963/0.937–0.995 |
| Duration (years), mean ± SD | I: 4.7 ± 4.4, II: 7.8 ± 5.3, III: 14.6 ± 5.1 | I: 5.0 ± 4.0, II: 8.3 ± 5.0, III: 13.5 ± 5.7 | 0.110 (I vs. II), <0.001/0.157–0.170, <0.014 (I vs. III) |
| UPDRS III, mean ± SD | I: 11.8 ± 7.9, II: 19.2 ± 7.4, III: 21.6 ± 7.0 | I: 9.8 ± 6.4, II: 17.8 ± 7.6, III: 26.5 ± 14.7 | 0.632 (II vs. III), <0.005/0.180 (II vs. III), <0.040 |
| MMSE, mean ± SD | I: 29.3 ± 1.1, II: 28.2 ± 2.0, III: 28.8 ± 1.2a | I: 29.2 ± 1.2, II: 28.2 ± 2.1, III: 27.8 ± 2.8b | 0.116–0.705/0.400–0.917 |
| CNS drug category, % (n) | |||
| Non-BZD hypnotics | I: 5.6 (1), II: 3.2 (1), III: 25.0 (3) | I: 7.7 (1), II: 0 (0), III: 25.0 (1) | 0.052–0.954/0.124–0.614 |
| BZD receptor agonists | I: 16.7 (3), II: 12.9 (4), III: 41.7 (5) | I: 15.4 (2), II: 5.3 (1), III: 0 (0) | 0.087–0.944/0.586–0.939 |
| Dopamine D2 receptor antagonists | I: 5.6 (1), II: 25.8 (8), III: 16.7 (2) | I: 7.7 (1), II: 26.3 (5), III: 25.0 (1) | 0.185–0.764/0.414–0.998 |
| NMDAras | I: 22.2 (4), II: 25.8 (8), III: 25.0 (3) | I: 23.1 (3), II: 26.3 (5), III: 75.0 (3) | 0.959–0.998/0.126–0.978 |
| Anticholinergics | I: 22.2 (4), II: 16.1 (5), III: 33.3 (4) | I: 30.8 (4), II: 15.8 (3), III: 25.0 (1) | 0.446–0.874/0.599–0.970 |
| Levodopa/DCIs | I: 77.8 (14), II: 77.4 (24), III: 91.7 (11) | I: 100.0 (13), II: 84.2 (16), III: 100.0 (4) | 0.556–1.000/0.266–1.000 |
| Dopamine agonists | I: 38.9 (7), II: 58.1 (18), III: 75.0 (9) | I: 46.2 (6), II: 57.9 (11), III: 50.0 (2) | 0.130–0.573/0.805–0.991 |
| COMTis | I: 11.1 (2), II: 9.7 (3), III: 41.7 (5) | I: 15.4 (2), II: 5.3 (1), III: 50.0 (2) | 0.029 (II vs. III), 0.065–0.990/0.051–0.677 |
| MAO-Bis | I: 16.7 (3), II: 19.4 (6), III: 33.3 (4) | I: 15.4 (2), II: 21.1 (4), III: 50.0 (2) | 0.532–0.974/0.334–0.926 |
| Anticonvulsant (Zonisamide) | I: 16.7 (3), II: 29.0 (9), III: 8.3 (1) | I: 23.1 (3), II: 31.6 (6), III: 25.0 (1) | 0.308–0.850/0.868–0.997 |
| Other CNS drugs | I: 0 (0), II: 9.7 (3), III: 33.3 (4) | I: 7.7 (1), II: 5.3 (1), III: 75.0 (3) | 0.013 (I vs. III), 0.066–0.535/< 0.001, 0.969 (I vs. II) |
| Drug category, % (n) | |||
| CNS drugs | I: 83.3 (15), II: 83.9 (26), III: 100.0 (12) | I: 100.0 (13), II: 84.2 (16), III: 100.0 (4) | 0.349–0.998/0.266–1.000 |
| PNS-N drugs | I: 27.8 (5), II: 6.5 (2), III: 8.3 (1) | I: 30.8 (4), II: 0 (0), III: 25.0 (1) | 0.086–0.985/< 0.035 (I vs. II), 0.357–0.949 |
| Arachidonate cascade regulators | I: 0 (0), II: 6.5 (2), III: 16.7 (2) | I: 0 (0), II: 10.5 (2), III: 25.0 (1) | 0.175–0.654/0.270–0.614 |
| RAAS-targeting drugs | I: 11.1 (2), II: 3.2 (1), III: 0 (0) | I: 15.4 (2), II: 5.3 (1), III: 25.0 (1) | 0.363–0.901/0.509–0.860 |
| Voltage-gated ion channel-targeting drugs | I: 22.2 (4), II: 16.1 (5), III: 0 (0) | I: 15.4 (2), II: 15.8 (3), III: 25.0 (1) | 0.221–0.832/0.902–1.000 |
| Transporter/symporter inhibitors | I: 16.7 (3), II: 3.2 (1), III: 25.0 (3) | I: 15.4 (2), II: 0 (0), III: 25.0 (1) | 0.112–0.757/0.232–0.811 |
| DPP-4 inhibitors | I: 5.6 (1), II: 6.5 (2), III: 0 (0) | I: 0 (0), II: 5.3 (1), III: 0 (0) | 0.667–0.990/0.667–1.000 |
| Statins | I: 0 (0), II: 12.9 (4), III: 0 (0) | I: 0 (0), II: 15.8 (3), III: 0 (0) | 0.186–1.000/0.266–1.000 |
| PPIs | I: 5.6 (1), II: 6.5 (2), III: 8.3 (1) | I: 7.7 (1), II: 10.5 (2), III: 50.0 (2) | 0.954–0.992/0.085–0.970 |
| Vitamins | I: 0 (0), II: 6.5 (2), III: 16.7 (2) | I: 0 (0), II: 10.5 (2), III: 0 (0) | 0.175–0.654/0.430–1.000 |
| Cathartics | I: 16.7 (3), II: 32.3 (10), III: 25.0 (3) | I: 15.4 (2), II: 21.1 (4), III: 0 (0) | 0.470–0.882/0.583–0.911 |
| Other drugs | I: 11.1 (2), II: 9.7 (3), III: 33.3 (4) | I: 7.7 (1), II: 21.1 (4), III: 25.0 (1) | 0.126–0.990/0.601–0.981 |
BZD, benzodiazepine; CNS, central nervous system; COMTi, catechol-O-methyl transferase inhibitor; DCI, dopa-decarboxylase inhibitor; DPP4, dipeptidylpeptidase 4; MAO-Bi, monoamine oxidase type B inhibitor; MMSE, Mini-Mental State Examination; NMDAra, N-methyl-D-aspartate receptor antagonist; PD, Parkinson’s disease; PNS-N, peripheral nervous system via neurotransmitters; PPI, proton pump inhibitor; RAAS, renin-angiotensin-aldosterone system; SD, standard deviation; UPDRS III, Unified Parkinson’s Disease Rating Scale score for Part III.
The p values were estimated using Tukey’s test.
Number of participants tested (n = 52).
Number of participants tested (n = 33).
Figure 2.

Contribution of disease severity (H&Y stage) and anti-PD drug use on human microbiome diversity in the PD cohort
(A) Participant characteristics in the PD cohort. The participants were divided into three groups based on H&Y stages: H&Y I, II, and III groups. Additionally, these patients were divided into non-users and users in each 10 anti-PD drug. In the PD cohort, disease severity indicates differences in H&Y stages, and drug use indicates differences in anti-PD drug use.
(B) Individual and cumulative adjusted R2 (explained variance) of covariates in stepwise RDA using the weighted UniFrac distance on the salivary (n = 61) and gut (n = 36) microbiome. The graph excludes negative values for individual adjusted R2. ∗∗p < 0.01; ∗∗∗p < 0.005.
(C and D) Heatmap of the mean DBGs by each subgroup (see Table 2) based on anti-PD drug use (n ≥ 3 per each drug category; C) and the three disease severity groups (D). The mean values were calculated using the weighted UniFrac distance matrix on the salivary (n = 61) and gut (n = 36) microbiome analyses.
(E) Comparison of the mean DBGs (shown in C and D) by disease severity (n = 3) and drug use (n = 36) on the salivary and gut microbiome. The boxplots present the median, 25th, and 75th percentiles. Statistical significance was determined using the Wilcoxon rank-sum test (p < 0.05).
(F and G) Graphs showing the weighted UniFrac β-diversity (R2) on the salivary (F) and gut (G) microbiome among the three disease severity groups and the anti-PD drug subgroups (n ≥ 3 per each drug category; see Table 2). The R2 and p values were determined using permutational multivariate analysis of variance via the Benjamini-Hochberg method.
(H) Graph showing the −log10 weighted UniFrac β-diversity p value indicates the effects of anti-PD drug use on the salivary and gut microbiome in the same specimen from individual cohorts (n = 35).
The distribution of participants in the salivary and gut microbiome analyses (shown in D, F, and G) is as follows: stage I = 18 and 13; stage II = 31 and 19; stage III = 12 and 4, respectively.
To further evaluate the effects of anti-PD drugs on the salivary and gut microbiomes, we performed stepwise RDA using age, sex, H&Y stage, and anti-PD drugs. Age significantly contributed to the salivary microbiome composition, whereas H&Y stage and monoamine oxidase type B inhibitors (MAO-Bis) significantly contributed to the gut microbiome composition (cumulative adjusted R2: age = 7.8% [p = 0.004], H&Y stage = 12.6% [p = 0.001], and MAO-Bis = 17.6% [p = 0.006]; Figure 2B; Table S13). To comprehensively visualize the effects of the anti-PD drugs, we used DBG heatmaps, which depict all combinations of anti-PD drugs (Figure 2C). In the salivary microbiome, the DBG between anticholinergics and NMDAras was relatively high (0.310), whereas that between anticonvulsant (zonisamide) and COMTis was relatively low (0.277) (Figure 2C). The DBG between MAO-Bis and NMDAras was the most distant, whereas that of non-users and levodopa/dopa-decarboxylase inhibitor (DCI) was the closest in the gut microbiome (DBGs = 0.433 and 0.333, respectively; Figure 2C). Regarding the H&Y stage, the DBG between stages I and II showed the greatest distance, whereas that between stages II and III was the closest in the salivary microbiome (Figure 2D). In contrast, the DBG between stages I and II was the closest, and that between stages I and III was the most distant in the gut microbiome (Figure 2D). No significant differences in median DBGs between disease severity and anti-PD drug use were observed in the salivary and gut microbiomes (Figure 2E). The β-diversity analyses based on the weighted UniFrac distance showed significant differences among the H&Y stages (i.e., III vs. I [p = 0.001] and III vs. II [p = 0.009]) and between non-users and users of MAO-Bis (p = 0.001) in the gut microbiome; however, no significant differences were noted regarding the H&Y stages and anti-PD drugs in the salivary microbiome (Figures 2F and 2G). These results suggest that in contrast to the AD cohort, the effects of disease severity and drug use on the salivary microbiome do not differ in patients with PD. Furthermore, disease severity tended to exert a stronger effect on the gut microbiome than anti-PD drug use. We further evaluated the effects of anti-PD drugs on microbiome using the −log10 p value in the salivary and fecal samples consisting of the same specimen. Notably, the value of COMTis and MAO-Bis for feces was higher than that for saliva, while the value of NMDAras for saliva was higher than that for feces (Figure 2H).
Finally, we evaluated the Shannon diversity in the H&Y stages and anti-PD drug categories (Figure S2). No significant differences were observed in the salivary and gut microbiomes, indicating that microbiome evenness was not affected by disease severity and use of anti-PD drugs.
Effects of sex on salivary microbiome diversity in patients with cognitive impairment
Recent studies have indicated that compared with male individuals, female individuals are at a higher risk of DE.35,36 We found that the Shannon diversity was increased in the salivary microbiome of males with MCI or DE compared to that of females (p = 0.002 and 0.010, respectively; Figure S3A). Notably, the Shannon diversity indices in males of the AChEi- and A + N-treated subgroups were significantly increased compared to those in females (p = 0.011 and 0.018, respectively; Figure S3B). However, no significant changes in cognition or anti-DE drug categories were found in sex-stratified Shannon diversity analyses (Figures S3A and S3B). In the gut microbiome, no significant differences in cognition or anti-DE drug categories were observed between males and females, even within each sex (Figures S3C and S3D). We then performed a sex-stratified β-diversity analysis based on the weighted UniFrac distance and found a significant difference in the salivary microbiome of male patients between non-users and AChEi-treated subgroups (p = 0.007; Figure S3E). In contrast, no significant differences were observed in the salivary microbiomes of female patients (Figure S3E). The sex-stratified β-diversity of all combinations showed no significant differences in the gut microbiome analysis of males and females (Figure S3F). These results suggest that the effects of both cognition and anti-DE drug use on the salivary microbiome may be sex dependent.
Dose-dependent changes in the microbiome of anti-DE drug users
To determine the effects of anti-DE drug dosage, we grouped AChEi and NMDAra monotherapy users into low-, middle-, and high-dose subgroups (see STAR Methods). The Shannon diversity index of the salivary microbiome tended to increase (Figure S4A) but that of the gut microbiome tended to decrease (Figure S4B) in the AChEi-treated subgroups in a dose-dependent manner. Moreover, the weighted UniFrac β-diversity in the gut microbiome differed significantly only between the middle- and high-dose subgroups in the AChEi-treated subgroup (p = 0.036; Figures S4C and S4D).
Distinct microbial alterations associated with disease severity and drug use
To explore the characteristics of microbiome alterations according to disease severity and drug use, we conducted multivariate analyses using MaAsLin2. We first performed weighted UniFrac distance-based β-diversity analyses between non-users and users of all prescribed drugs to confirm the salivary and gut microbiome confounders in cognitive impairment groups. A significant difference (p = 0.005) was noted in the salivary microbiome of AChEi users; however, no significant differences were observed for the gut microbiome of any prescribed drug users (Figure S5A). Thus, we defined age, sex, facility location, cognition, and anti-DE drugs as confounders of microbiome composition in the AD cohort (see STAR Methods). Multivariate analyses adjusted for confounders revealed that the abundance of several genera, including Aggregatibacter, Alloprevotella, Capnocytophaga, Fusobacterium, Leptotrichia, Neisseria, Rothia, and Treponema, in the salivary microbiome changed significantly by cognition status (p < 0.05; Figure 3A; Table S14). For example, the abundances of Alloprevotella and Treponema increased significantly with cognitive decline. The abundances of Aggregatibacter, Capnocytophaga, Fusobacterium, Leptotrichia, and Neisseria were lower in the MCI group than in the HC group; however, they were higher in the DE group than in the MCI group. The genera in the salivary microbiome that changed significantly with anti-DE drugs were Filifactor, G_undefined_Clostridiales Family XIII. Incertae Sedis, Granulicatella, Haemophilus, Lactobacillus, and Streptococcus (p < 0.05; Figure 3A). The abundance of G_undefined_Clostridiales Family XIII. Incertae Sedis was significantly increased in all anti-DE drug subgroups; conversely, the abundances of Granulicatella, Haemophilus, and Streptococcus were decreased in all anti-DE drug subgroups. The abundance of Lactobacillus was significantly increased in the NMDAra-treated subgroup. In the gut microbiome, the abundances of Anaerobutyricum, Dialister, Fusobacterium, Holdemanella, Megamonas, Robinsoniella, and Veillonella changed significantly with cognition, whereas those of Anaerotignum, Enterococcus, Faecalimonas, Lactobacillus, Negativibacillus, and Parasutterella changed significantly with anti-DE drug use (p < 0.05; Figure 3B; Table S15). Notably, the abundance of Enterococcus was significantly decreased in all anti-DE drug subgroups. The number of significantly different bacteria in the salivary and gut microbiomes was reduced in multivariate analyses considering anti-DE drugs compared to those that did not consider them (Figure 3C). These results suggest that multivariate analysis with anti-DE drug use as a confounder may be essential for identifying microbiome-based biomarkers of cognitive function in the humans.
Figure 3.

Distinct microbial alteration associated with disease severity and drug use in patients with proteinopathy
(A and B) Heatmaps showing representative genera enriched and depleted among each cognitive function group and anti-DE drug subgroup. The distribution of participants in the salivary (A) and gut (B) microbiome analyses is as follows: HC = 42 and 25; MCI = 87 and 29; DE = 109 and 53, non-user = 96 and 29; AChEi = 75 and 40; NMDAra = 35 and 17; and A + N = 32 and 21, respectively. The top 32 and 51 abundant genera with a relative mean abundance of >0.1% were selected from the salivary (A) and gut (B) microbiome, respectively. Statistical significance in the salivary microbiome was determined using the MaAsLin2 package with age, sex, facility location, anti-DE drugs, or cognition as random effects. Statistical significance in the gut microbiome was determined using the MaAsLin2 package with age, sex, anti-DE drugs, or cognition as random effects. ∗p < 0.05; ∗∗p < 0.01; ∗∗∗p < 0.005.
(C) Number of genera with significant differences (MaAsLin2, p < 0.05) in multivariate analyses with or without anti-DE drugs as a random effect in each cognitive function group.
(D and E) Heatmaps showing representative genera enriched and depleted among each H&Y stage and anti-PD drug subgroup (n ≥ 3 per each drug category; see Table 2). The distribution of participants in the salivary (D) and gut (E) microbiome analyses is as follows: stage I = 18 and 13; stage II = 31 and 19; and stage III = 12 and 4, respectively. The top 32 and 52 abundant genera with a relative mean abundance of >0.1% were selected from the salivary (D) and gut (E) microbiome, respectively. Statistical significance in the salivary microbiome was determined using the MaAsLin2 package with age, sex, PPIs, BZD receptor agonists, anti-PD drugs, or H&Y stages as random effects. Statistical significance in the gut microbiome was determined using the MaAsLin2 package with age, sex, PPIs, anti-PD drugs, or H&Y stages as random effects. ∗p < 0.05; ∗∗p < 0.01; ∗∗∗p < 0.005.
(F) Number of genera with significant differences (MaAsLin2, p < 0.05) in multivariate analyses with or without drug use (anti-PD drugs, PPIs, and BZD receptor agonists) as a random effect in each H&Y stage.
Next, we analyzed β-diversity in relation to prescribed drugs in the PD cohort and found a significant difference in the salivary and gut microbiomes for PPI users (p = 0.002 and 0.004, respectively; Figure S5B). A significant difference in the salivary microbiome was observed for benzodiazepine (BZD) receptor agonist users (p = 0.040; Figure S5B). Age, sex, H&Y stage, anti-PD drugs, PPIs, and BZD receptor agonists were defined as confounders for salivary and gut microbiomes in the PD cohort (see STAR Methods). Multivariate analyses adjusted for these confounders revealed that eight genera were affected by the H&Y stage while 14 genera were affected by anti-PD drugs in the salivary microbiome (p < 0.05; Figure 3D; Table S16). Although none of the genera changed significantly with both disease severity and drug use in the AD cohort, G_undefined_Clostridiales Family XIII. Incertae Sedis, Haemophilus, and Lautropia were affected by both H&Y stage and anti-PD drugs. The abundance of G_undefined_Clostridiales Family XIII. Incertae Sedis increased significantly with increasing disease severity but decreased significantly in MAO-Bi users. In the gut microbiome, we found significant changes in 14 and 30 genera according to H&Y stage and anti-PD drug use, respectively (p < 0.05; Figure 3E; Table S17). For example, the abundance of Bifidobacterium gradually increased with disease severity, whereas that of Faecalibacterium gradually decreased. The abundance of Bacteroides differed significantly in six of the eight anti-PD drug categories. The number of genera that changed significantly in the multivariate analyses adjusted for confounders of the prescribed drugs are shown in Figure 3F. Notably, the abundance of Fusobacterium in the salivary microbiome, which significantly decreased in the NMDAra-treated subgroup of the PD cohort, also showed a tendency to decrease in the AD cohort (Figures 3A and 3D). However, the abundances of Haemophilus and G_undefined_Clostridiales Family XIII. Incertae Sedis in the salivary microbiome showed contrasting changes in patients with AD and PD.
The combination of microbial signature and prescribing information predicts cognitive function
Next, we aimed to investigate the potential microbial signatures suitable for predicting cognitive function. Multivariate analyses revealed that microbiome composition was affected by anti-DE drug use, indicating that considering anti-DE drug effects would be important when investigating the effectiveness of microbial signatures as predictive biomarkers. We first generated basic random forest classifiers using the abundant species (relative mean abundance >0.1%) in the salivary and gut microbiomes. Several species were affected by cognition status and anti-DE drug use based on the results of multivariate analyses using MaAsLin2 (p < 0.05; Tables S18 and S19). We then selected 11 and 6 species in the salivary and gut microbiomes, respectively, that were significantly influenced by anti-DE drugs but not by cognition status (Figure 4A). A comparison of the area under the receiver operating characteristic curve (AUROC) between the basic predictive microbial model and the model generated by abundant species, excluding anti-DE drug-affected species, revealed significant differences in the salivary microbiome for all cognitive predictions (p < 0.005; Figure 4B). The AUROC also significantly changed in the DE prediction (i.e., DE vs. HC and DE vs. MCI) of the gut microbiome (p < 1.6 × 10⁻¹²; Figure 4C).
Figure 4.

Combination of microbial signatures and prescribing information to predict cognitive function
(A) Venn diagrams showing the number of species significantly affected by cognition or anti-DE drugs from a multivariate analysis using MaAsLin2 (p < 0.05). All species had a relative mean abundance of >0.1%.
(B and C) Graphs showing the AUROCs in random forest classifiers generated by the abundant species and abundant species excluding anti-DE drug-affected species in the salivary (B) and gut (C) microbiomes. For calculating the median AUROC, 100 independent training were performed using different random seeds. The boxplots present the median, 25th, and 75th percentiles. Dots indicate the AUROCs of single iterations. Statistical significance was determined using the Wilcoxon signed-rank test (p < 0.05).
(D and F) Graphs showing the receiver operating characteristic curves for classifying each cognitive function group based on 20 rounds of 10-fold cross-validation. Random forest classifiers were trained using 75 and 85 species (a relative mean abundance of >0.1%) in the salivary (D) and gut (F) microbiome, respectively. Age and sex, or age, sex, and anti-DE drug use were added as predictors to this basic predictive microbial model.
(E and G) Graphs showing the AUROCs for each random forest classifier for the salivary (E) and gut (G) microbiomes. For calculating the median AUROC, 100 independent training were performed using different random seeds. The boxplots present the median, 25th, and 75th percentiles. Dots indicate the AUROCs of single iterations. The median AUROCs are shown in the graph. Statistical significance was determined using the DeLong test based on 20 rounds of 10-fold cross-validation (p < 0.05). ∗p < 0.05; ∗∗p < 0.01; ∗∗∗p < 0.005.
By adding disease risk factors including age and sex to the predictive microbial model, the area under the curve (AUC) increased.37 To improve predictive accuracy, we built classifiers by adding age and sex or age, sex, and prescribed drug use (i.e., four types of anti-DE drugs) to the abundant species. In the salivary microbiome, the AUROC of the model using 75 species, age, sex, and prescribed drug use was higher than those of the other two models in the classification between the HC and DE groups and the MCI and DE groups (DeLong test: p < 0.001 and p < 0.026, respectively; Figures 4D and 4E). The AUROC of the all-factors-included model in the gut microbiome was also higher than those of the other two models for classifying HC and DE groups (DeLong test: p < 0.013; Figures 4F and 4G). These results suggest that a predictive model for cognitive function using microbial signatures can be developed by considering the effects of anti-DE drug use.
Next, we evaluated three predictive microbial models, abundant species (Tables S20 and S21); abundant species, age, and sex; and abundant species, age, sex, and prescribed drug use (anti-PD drugs, PPIs, and BZD receptor agonists), to classify the H&Y stages based on the salivary and gut microbiomes. No significant differences in AUROCs and the area under the PR curve (AUPR) were observed among the three predictive models in either salivary or gut microbiomes (Figure S6).
Discriminating AD from proteinopathy
We additionally evaluated predictive microbial models to differentiate between AD and PD in patients with proteinopathy. We determined variable importance for each predictive model from 100 independent iterations in the AD and PD cohorts (Figures S7 and S8). Specifically, we focused on predictive microbial models for classifying DE (i.e., DE vs. HC and DE vs. MCI) using the variable importance from these models as microbial signatures to differentiate AD from PD (Figure S7). We also determined microbial signatures based on the variable importance obtained using predictive microbial models of the H&Y stages (Figure S8). The receiver operating characteristic curves and median AUROCs of the predictive microbial models of the salivary and gut microbiomes are shown in Figure S9. The AUROC of the salivary microbiome was higher than that of the gut microbiome, suggesting that the salivary microbiome may be more valuable than the gut microbiome in discriminating between AD and PD.
Functional prediction of the microbiome composition associated with AChEi use
Lastly, we analyzed the predictive metabolic pathway associated with AChEi using phylogenetic investigation of communities by reconstruction of unobserved states (PICRUSt2) based on the 16S rRNA gene sequencing data. We identified 43 enriched and 24 depleted pathways with significance in the salivary microbiome of AChEi users compared to non-users (p < 0.05; Figures S10A and S10B). In the gut microbiome, five and three pathways were significantly enriched and depleted in AChEi users compared to non-users, respectively, and some of these pathways, including biosynthesis of nucleotide sugars and phosphotransferase system, were shared with the salivary microbiome (p < 0.05; Figures S10A and S10B). The unique changes in the metabolic pathways in the salivary microbiome were more abundant than those in the gut microbiome, corresponding to the results that the effect of AChEi use was greater in the salivary microbiome than that in the gut.
Discussion
The main finding of the present study was that the use of anti-DE drugs, especially AChEis, had greater effects than cognitive impairment on human microbiome alterations and that this drug effect was more prominent on the salivary microbiome than on the gut microbiome. Although population-based cohort studies have shown that the use of certain prescription drugs is associated with microbiome alterations,7,8,9 no comparative study has evaluated the effects of medication and disease severity in patients with neurodegenerative diseases. Our findings suggest that CNS drugs may partially affect dysbiosis resulting from the pathogenesis of neurodegenerative diseases. These results have significant implications for future developments of human microbiome research, including disease biomarkers, prediction model, and gnotobiotic experiments.
The pattern of changes in bacterial abundances showed that, in all anti-DE drug users, the abundance of most genera increased in the salivary microbiome (63.5%), whereas that in the gut microbiome exhibited a 49.0% increase. This pattern was not observed in the salivary and gut microbiomes of anti-PD drug users (increases by 50.0% and 49.8%, respectively). These results suggest that the effects of anti-DE drugs on microbiomes may differ between the saliva and gut. Moreover, bacteria affected by NMDAras use differed between patients with AD and PD, indicating that drugs with a similar mode of action may cause different microbiome alterations according to the disease. Altogether, among the mechanisms underlying microbiome alterations from CNS drug use, direct interactions between CNS drugs and microbiomes play a negligible role.
AChEis reversibly inhibit acetylcholinesterase, thereby increasing cerebral acetylcholine levels and enhancing cholinergic neurotransmission in patients with cognitive impairment.33 NMDAras noncompetitively block NMDA receptor activity caused by excess glutamate in patients with neurodegenerative diseases.33,38 These orally administered CNS drugs are absorbed in the gastrointestinal tract33,39,40; thereafter, AChEis (i.e., donepezil and galantamine) are mainly metabolized by cytochrome P450 in the liver,41 whereas NMDAras are not metabolized by hepatic enzymes and are excreted by the kidneys.40,42 Based on the mode of action and metabolism of CNS drugs, our main findings suggest the role of a brain-oral axis in neurodegeneration; however, whether the mechanism underlying the interplay between the salivary microbiome and drug use is direct or indirect remains unclear. Previous studies have demonstrated abnormal aggregation of α-synuclein and tau in the salivary glands of patients with proteinopathy.43,44 Cholinergic innervation by cranial nerves VII and IX acts on the salivary glands, thereby controlling saliva secretion.45,46 Neurodegeneration-related proteins, such as α-synuclein, tau, and amyloid-β, are secreted into the saliva of patients with proteinopathy.46 Schloss et al. reported that acetylcholinesterase inhibition reduces the systemic supply of inflammatory myeloid cells in cohort studies of AChEi-treated patients with AD and in mouse experiments.47 Previous studies showed that peptidoglycan, a component of bacterial cell walls, may lead to chronic inflammation and amyloidogenesis.48,49 Additionally, bacterial quorum sensing is a monitoring system of their population density, enabling synchronized behaviors, including virulence, which is detrimental to the host.50,51 The virulence factor regulated by quorum sensing exhibits an increase in the sera of patients with AD.52 These findings are consistent with our results of the predictive metabolic pathways (i.e., peptidoglycan biosynthesis and quorum sensing) in the salivary microbiome, which was depleted in AChEi users. Porphyrins in the enriched pathways (i.e., carbon and porphyrin metabolisms) in AChEi users consist of carbon atoms, and their derivates have anti-inflammatory activity in mammalian cells.53,54 Downregulation of one-carbon metabolism is associated with disease progression of AD and PD.55,56 Previous studies propose that enhancing the mitochondrial one-carbon metabolism increases neuroprotection and could be a novel therapeutic strategy to delay AD progression.57,58 As the brain controls the immune response through neurotransmitters and innervation,24,59 the salivary microbiome may better reflect CNS drug-induced systemic physiological changes than the gut microbiome.
Recently, the DE prevalence in women has been reported to be 1.6–1.9 times higher than that in men.35,36 Previous studies have shown the possibility of sex-specific gut microbiome interactions in neurodegenerative diseases60,61; however, the specific role of the salivary microbiome remains unknown. A recent cohort study reported a sex-specific oral microbial community and differential sex hormone levels, leading to sex-specific differences in host variables contributing to microbiome compositions.6 Additionally, previous reports have indicated a short-term positive cognitive response to AChEi in male patients compared with female patients.62,63 Although sex differences in antipsychotic drug responses are also known,64 our understanding of the associations between therapeutic efficacy and sex differences in patients with neurodegenerative diseases is limited.65 Nevertheless, our results suggest sex-dependent differences in cognitive status-associated salivary microbiome alterations and the effects of AChEi use in patients with cognitive impairment. These findings may provide new insights for deciphering the relationship between therapeutic efficacy and sex differences in microbial communication.
We hypothesized that the predictive accuracy discriminating between cognitive impairment groups (MCI and DE) and HC (anti-DE drug-naive participants) would be apparently higher when the predictive model included bacteria affected by anti-DE drugs rather than cognitive status. Indeed, the AUROC of the predictive microbial model excluding anti-DE drug-affected species decreased compared to that of the basic model including all species in classifying the cognitive impairment groups and HC (Figure 4B). Furthermore, the AUROC of the predictive microbial model, which excluded anti-DE drug-affected species, showed a greater increase than that of the basic model for distinguishing between MCI and DE. These observations were more pronounced in the salivary microbiome than in the gut microbiome (Figures 4B and 4C). This finding is likely attributable to the fact that patients in both the MCI and DE groups received uniform anti-DE drugs, which may have interfered with the ability to differentiate between these two groups. Although salivary microbiomes are promising biomarkers of systemic diseases, many factors influence the microbial community. Our findings highlight anti-DE drug use as a considerable factor influencing the salivary microbiome composition of patients with cognitive impairment. This knowledge may help to develop an accurate predictive model incorporating the salivary microbiome.
Limitations of the study
This study has some limitations. First, our observational study did not consider the therapeutic efficacies in microbiome alterations. We were unable to determine whether drug-associated microbiome alterations were reflected in symptom improvements. Previous studies have shown that the abundance of the Streptococcus genera in the oral cavity increased in patients with cognitive impairment compared to that in the oral cavities of HCs,66,67 supporting our results that significant reductions were observed in the abundance of the Streptococcus genera in the salivary microbiome of AChEi and A + N users compared to non-users. However, in our multivariate analyses, no significant increase was observed in the Streptococcus abundance associated with cognitive decline. In the gut microbiome, the Enterococcus genera that significantly decreased in all anti-DE drug users showed a correlation with cognitive function,68,69 although their abundance is known to differ depending on the type of DE.70 Moreover, the influence of the dosing period was not considered in the present study. Nagata et al. reported an association between medication duration and the human gut microbiome.9 Second, non-antibiotic drugs often induce gastrointestinal side effects, such as diarrhea, although analyzing the relationship between the microbiome compositional changes and side effects is difficult.71 Differences in the drug efficacy and severity of side effects between individuals may result from the differences in the gut microbiome.72,73 Previous studies have shown the interaction, including drug metabolism and bacterial inhibition, between CNS drugs, such as anti-PD and antipsychotic drugs, and the gut microbiome.74,75,76,77,78 A lack of consideration of the influence of adverse effects on the present multivariate analyses may perturb the evaluation of the association between prescription drugs and the gut microbiome. Third, diet, a determinant of microbiome composition, was not considered in our multivariate analyses. Dietary factors (e.g., macronutrients,79,80 non-nutritive sweeteners,81 and xenobiotics82) and habits (e.g., high-sugar/high-fat foods)83 can alter microbiome compositions, especially in the gut. Fourth, the relationship between the oral microbiome and oral diseases (e.g., oral cancer,84,85 osteonecrosis of the jaw,86,87 infections,88 and periodontitis89,90) was not considered. The interaction between the oral microbiome, including periodontitis-associated bacteria, and the pathogenesis of systemic diseases has recently attracted attention.91,92 These pathobionts translocate from the oral cavity to the gut and exacerbate intestinal inflammation. We collected metadata on alcohol consumption frequency, smoking status, and oral health (toothbrushing frequency, denture use, presence of oral dryness, and history of dental treatments) using questionnaires; however, it is challenging to accurately assess oral diseases using questionnaires alone. Although stepwise RDA of these variables revealed that the use of prescription drugs only had an impact on the salivary microbiome composition in patients with proteinopathy (Tables S4 and S9), precise oral health information is needed to better understand the interaction between medications and salivary microbiomes. Finally, recent studies have shown that gut microbiome compositions are influenced by the host’s genetic factors for AD93,94 and PD.95 Furthermore, the therapeutic efficacy of AChEis is differentially affected by genetic factors.96 Thus, prospective studies incorporating the therapeutic efficacy, dosing period, and genotypes are required to decipher the relationship between AChEi use and the human microbiome, including pathobionts.
In summary, we identified an association between salivary microbiome alterations and medication, particularly AChEis, indicating that compared to the gut microbiome, the salivary microbiome may be more sensitive to the effects of drugs regulating cerebral cholinergic neurotransmission. However, the influence of several confounders, including therapeutic efficacy, genotype, and diet, may lead to a poor understanding of the effects of AChEis on the gut microbiome. Given that older adults with cognitive impairment often have difficulty adhering to their medications, our findings could inform policy development aimed at improving medication adherence through the use of the salivary microbiome.
Resource availability
Lead contact
Further information and requests for resources should be directed to and will be fulfilled by the lead contact, Chihiro Akazawa (c.akazawa.gt@juntendo.ac.jp).
Materials availability
This study did not generate new unique reagents.
Data and code availability
-
•
The bacterial 16S rRNA sequencing data generated for this study were deposited in the DDBJ/GenBank/EMBL databases and NCBI BioProject database under accession numbers DRA016578, DRA016579, DRA016580, and DRA019791.
-
•
Clinical data, except those included in this article, are not available in a public repository or supplemental information to protect the privacy and confidentiality of the study participants.
-
•
Requests for clinical data can be directed to the corresponding authors and will be reviewed by the Ethics Committee of the Juntendo University School of Medicine. All shared data were de-identified.
Acknowledgments
We acknowledge all study participants. We are grateful to the medical staff of the Department of Neurology at the Juntendo University Faculty of Medicine, Department of Gastroenterology at the Juntendo Tokyo Koto Geriatric Medical Center, and the Memory Clinic Ochanomizu. We thank Misaki Ouchida for creating a graphical abstract. This work was supported by the Cabinet Office of the Japanese Government, Public/Private R&D Investment Strategic Expansion PrograM: PRISM (grant number 19AC5003 to M.H. and C.A.) and was partially supported by the Japan Society for the Promotion of Science (JSPS)/The Ministry of Education, Culture, Sports, Science and Technology (MEXT), KAKENHI Grant-in-Aid for Early-Career Scientists (grant number 21K15888 and 24K17850 to D.H.), and the Japan Agency for Medical Research and Development (AMED) (21wm0425015 to T.H. and 21dm0207070 to N.H.). We also acknowledge the financial support from the JGC Japan Corporation, Japan; ITOCHU Chemical Frontier Corporation, Japan; Otsuka Holdings Co., Ltd., Japan; and the Research and Development Board at Juntendo University.
Author contributions
Conceptualization, D.H. and C.A.; investigation, D.H., Y.M., and Y.N.; formal analysis, D.H., H.M., R.K., Y.O., and W.S.; data curation, D.H., H.T.-A., and D.A.; resources, H.T.-A., T.H., D.A., N.S., T.A., and N.H.; software, D.H., H.M., and W.S., visualization, D.H.; writing – original draft, D.H.; writing – review & editing, D.H., W.S., N.H., M.H., and C.A.; funding acquisition, D.H., T.H., N.H., M.H., and C.A.
Declaration of interests
The authors declare no competing interests.
STAR★Methods
Key resources table
| REAGENT or RESOURCE | SOURCE | IDENTIFIER |
|---|---|---|
| Biological samples | ||
| Human salivary samples | This paper | N/A |
| Human fecal samples | This paper | N/A |
| Deposited data | ||
| 16S ribosomal RNA gene sequencing data | This paper | DRA016578, DRA016579, DRA016580, and DRA019791 |
| Software and algorithms | ||
| cutadapt v4.1–1 | Martin, 201197 | cutadapt.readthedocs.io/en/stable/ |
| dada2 v1.18.0 | Callahan et al., 201698 | github.com/benjjneb/dada2 |
| PICTUSt2 v2.6.0 | Douglas et al., 202099 | github.com/picrust/picrust2 |
| vegan v2.6–4 | Dixon, 2003100 | github.com/vegandevs/vegan |
| caret v.6.0.94 | Github | github.com/topepo/caret |
| randomForest v.4.7–1.1 | Breiman, 2001101 | stat.berkeley.edu/∼breiman/RandomForests/ |
| pROC v.1.18.2 | Robin et al., 2011102 | github.com/cran/pROC |
| doParallel v.1.0.17 | Github | github.com/RevolutionAnalytics/doparallel |
| tidyverse v2.0.0 | Github | www.tidyverse.org/ |
| clusterProfiler v4.4.4 | Yu et al., 2012103 and Wu et al., 2021104 | bioconductor.org/packages/release/bioc/html/clusterProfiler.html |
| MaAsLin2 v.1.10.0 | Mallick et al., 2021105 | github.com/biobakery/Maaslin2 |
| R v4.0.3, and 4.2.1 | CRAN | www.r-project.org/ |
Experimental model and study participant details
Study design
We enrolled participants from two Japanese cohorts. First, the age- and sex-matched AD cohort consisted of patients recruited from three hospitals located in the metropolitan and suburban regions. We defined the 23 wards in Tokyo as metropolitan areas. Patients in the metropolitan cohort were recruited from the Juntendo Tokyo Koto Geriatric Medical Center and Memory Clinic Ochanomizu, both in Tokyo, Japan. The patients in the suburban cohort were recruited from the Memory Clinic of Toride, Ibaraki, Japan. The study participants were adults aged 60–90 years, diagnosed with MCI or DE using the cognitive function tests described below. We excluded patients with Lewy body DE, frontotemporal DE, and PD with DE diagnosed based on clinical data, including single-photon emission computed tomography imaging and interviews. The HC group comprised individuals who exhibited no cognitive impairment based on cognitive function tests and volunteers without any neurodegenerative diseases. Of the patients with MCI and DE who provided saliva samples, 68 also donated fecal samples. Second, the age- and sex-matched PD cohort consisted of patients with PD diagnosed using standard criteria at Juntendo University Hospital, Tokyo, Japan. The following metadata were collected in both cohorts: age, sex, prescription drugs (including anti-DE drugs and anti-PD drugs), clinical scores (Mini-Mental State Examination [MMSE] score, revised Hasegawa Dementia Scale [HDS-R] score, Alzheimer’s Disease Assessment Scale-Cognitive Subscale [ADAS-cog] score, H&Y scale score, and MDS Unified Parkinson’s Disease Rating Scale [MDS-UPDRS] score for Part III), questionnaire responses (frequency of alcohol consumption, smoking, and oral health), and disease duration for patients with PD.
The minimum number of necessary samples for each experimental group was estimated based on previous human salivary microbiome analyses.106,107
This study was approved by the Ethics Committee of Juntendo University School of Medicine (approval number H19-0244) and Juntendo Tokyo Koto Geriatric Medical Center (approval number 110-11). All participants or their legal guardians provided written informed consent for the participation in this study. The procedures were performed in accordance with the principles of the Declaration of Helsinki.
Assessment of cognitive function
The participants were divided into three groups according to MMSE and HDS-R scores: HC (MMSE ≥ 28 and HDS-R ≥ 21), MCI (24 ≤ MMSE ≤ 27 and HDS-R ≥ 21), and DE (MMSE ≤ 23 and HDS-R ≤ 20) groups. Moreover, some participants were tested using ADAS-cog to confirm the robustness of the cohort (see Table 1).
Classification of the prescribed drugs
All prescribed drugs used in the two cohorts were classified into 26 drug categories based on their modes of action (Table S1). In this study, we did not divide the drug categories according to disease-specific drugs (e.g., antidiabetic drugs) because of the difficulty in distinguishing between the effects of the disease and those of drug use on the microbiome, as suggested by Vich Vila et al.10 CNS drugs were further classified into 21 drug categories according to their modes of action (Table S1). Additionally, we divided the patients with cognitive impairment (MCI and DE) into four subgroups according to the type of anti-DE drug used33: non-users, AChEi (donepezil, galantamine, or rivastigmine)-treated, NMDAra (memantine)-treated, and A+N-treated subgroups. Likewise, we classified 10 anti-PD drugs based on their mode of action34: non-user, NMDAra (amantadine HCl), anticholinergics, levodopa/DCI, non-ergot-dopamine agonist, ergot-dopamine agonist, COMTi, MAO-Bi, adenosine A2A receptor antagonist, droxidopa, and anticonvulsant (zonisamide) users (Figure 2A).
AChEi users were divided into three subgroups according to drug dosages: donepezil: low (3 mg/day), middle (5 mg/day), and high (≥ 8 mg/day); galantamine: low (≤ 5 mg/day), middle (8 mg/day), and high (≥ 12 mg/day); and rivastigmine: low (4.5 mg/day), middle (9 mg/day), and high (13.5 mg/day). NMDAra (memantine) users were divided into three subgroups according to drug dosage: low (5 mg/day), middle (10 mg/day), and high (≥ 15 mg/day).
Method details
Sample collection and 16S rRNA gene amplicon sequencing
All samples were collected during the daytime (9:00–16:00), excluding those of participants who took antibiotics within one month before sampling, following the protocol outlined in a previous study.107 Saliva samples were collected using a sterilized sputum container (DE2000; Eiken Chemical Co., Tokyo, Japan). Fecal samples were collected using 50-mL tubes with a ventilated cap (CELLSTAR CELLreactor filter top tube, Greiner Bio-One, 227245) and AnaeroPack-Anaero (Mitsubishi, Tokyo, Japan). All samples were kept at 4°C, frozen in liquid nitrogen within 8 h after sampling, and stored at −80°C until DNA extraction. Saliva and fecal sampling, freezing, and DNA extraction from frozen samples based on the enzymatic lysis method were performed as previously described.106,107 In brief, the V1-V2 region of the 16S rRNA gene was amplified by polymerase chain reaction using the following primer sets: forward 27Fmod (5′-AATGATACGGCGACCACCGAGATCTACACxxxxxxxxACACTCTTTCCCTACACGACGCTCTTCCGATCTagrgtttgatymtggctcag-3′) and reverse 338R (5′-CAAGCAGAAGACGGCATACGAGATxxxxxxxxGTGACTGGAGTTCAGACGTGTGCTCTTCC GATCTtgctgcctcccgtaggagt-3′), containing the Illumina Nextera adapter sequence and a unique 8-bp index sequence for each sample (indicated by xxxxxxxx). Thermal cycling was performed on a 9700 PCR system (Life Technologies, Carlsbad, CA, USA) using Ex Taq polymerase (Takara Bio, Tokyo, Japan) with the following cycling conditions: initial denaturation at 96°C for 2 min; 25 cycles of denaturation at 96°C for 30 s, annealing at 55°C for 45 s, and extension at 72°C for 1 min; and final extension at 72°C. The amplicons were purified using AMPure XP magnetic purification beads (Beckman Coulter, Brea, CA, USA) and quantified using a Quant-iT PicoGreen dsDNA Assay Kit (Life Technologies, Japan). The amplicon pools were sequenced using the Illumina Miseq Platform (2 × 300 bp) according to the manufacturer’s instructions.
Data processing
The analysis pipeline for MiSeq-barcoded amplicon sequencing was constructed as described previously.108,109 Primer sequences were trimmed from the paired-end 16S rRNA gene amplicons using Cutadapt v.4.1–1. To construct amplicon sequence variants, trimmed reads were uploaded to the DADA2 R package v.1.18.0, and possible chimeric reads were removed. We used 10,000 filter-passed reads per sample of high-quality reads and deposited them in the DDBJ/GenBank/EMBL database. The taxonomic assignment of amplicon sequence variants was determined by similarity searches against the National Center for Biotechnology Information RefSeq database downloaded on January 8, 2020, using the GLSEARCH program.
Microbiome and metadata analysis
UniFrac distances were determined as described previously.108 In this study, we calculated the mean distance, as the DBG, from the weighted UniFrac distance matrix of all samples to determine how similar or different microbiomes from two groups (e.g., MCI and DE) were to each other. The β-diversity was obtained via permutational multivariate analysis of variance using the weighted UniFrac distance, and P-values were adjusted using the Benjamini–Hochberg method. The Shannon diversity index was calculated using the vegan package (v2.6−4) of the statistical programming language R, version 4.0.3 (2020-10-10, R Foundation for Statistical Computing, Vienna, Austria). To compare the effects of drug use on the microbiome, we used the −log10 transformed P-value in the β-diversity analysis.
Stepwise RDA was performed to evaluate the confounding variables that contributed to the microbiome composition using the ordiR2step function (default direction=both) in the vegan package (v2.6−4), as previously described.9,110 Distance-based RDA was performed using the Bray–Curtis distance with 999 permutations, and P-values were corrected using the Benjamini–Hochberg method. This analysis estimated the linear cumulative and individual effect sizes of all identified microbiome covariates. Individual adjusted R2 refers to the explained variance when the most influenced variables adjusted R2 is maximized in the first step involving all microbiome covariates.
Multivariate analysis of the microbial community was performed using the R package MaAsLin2 (v1.10.0) with generated linear and mixed models (default model: min abundance=0.00; min prevalence=0.10; max significance=0.25; normalization=TSS; transformation=LOG),105 as previously described.37 For the AD cohort model, fixed effects included cognitive function (HC, MCI, and DE) or anti-DE drugs (non-user, AChEi, NMDAra, and A+N), whereas random effects included age, sex, facility location (metropolitan and suburban regions), cognitive function, and anti-DE drugs. For the PD cohort model, fixed effects comprised the H&Y stage and individual anti-PD drugs (NMDAras, anticholinergics, levodopa/DCIs, non-ergot-dopamine agonists, COMTis, MAO-Bis, anticonvulsants, and other anti-PD drugs), and random effects included age, sex, individual anti-PD drugs, PPIs, and BZD receptor agonists.
Functional predictive analysis based on the 16S rRNA gene sequencing data was performed using PICRUSt2 v2.6.0.99 Raw ASV count data were imported and processed through the PICRUSt2 pipeline using default parameters. Briefly, the aligned ASVs were placed into a reference tree, which was then used to infer the gene family copy numbers for each ASV. The abundance of Kyoto Encyclopedia of Genes and Genomes (KEGG) orthology terms was obtained by PICRUSt2. The significant KEGG orthology terms were determined using the MaAsLin2 package (P<0.05). The KEGG enrichment analysis was subsequently conducted using the clusterProfiler package (v4.4.4) to identify significantly enriched metabolic pathways (adjusted P<0.05).
Construction of the random forest model
To construct a classification model for cognitive function based on the microbiome composition, we generated a random forest model using the randomforest package (v4.7−1.1). For the basic predictive microbial model, each abundant species (relative mean abundance > 0.1%) in the salivary and gut microbiomes was used as a microbial signature of random forest classifier. To evaluate the effectiveness of the prescribed drug information as a predictor, we generated two models in which physical variables (age and sex) were added to the basic predictive microbial model, and physical variables (age and sex) and prescription information (anti-DE drug use) were added to the basic predictive microbial model. All classifiers were trained using 20 rounds of 10-fold cross-validation, and their AUROCs were used. To calculate the median AUROC and variable importance (mean decrease in Gini), 100 independent training were conducted using different random seeds. The statistical difference in AUROCs between the two models was determined according to previous studies.111,112 Briefly, statistical significance was determined using the Wilcoxon signed-rank test across 100 independent training sets and the DeLong test in the pROC package (roc.test function), based on 20 rounds of 10-fold cross-validation.
Additionally, we generated a classification model for the H&Y stage in the PD cohort. However, owing to the imbalance (i.e., accuracy is 80% or more) in the fecal sample (i.e., H&Y stages III vs. II) dataset of the PD cohort, the AUPR was also fitted. To calculate the median AUPR, 100 independent training were conducted using different random seeds.
The dataset was randomly partitioned into a training set (80%) and a test set (20%) for the random forest classification model distinguishing AD from PD. We selected the variable importance in the model that predicted cognitive function (i.e., DE vs. HC and DE vs. MCI) and H&Y stages (i.e., II vs. I, III vs. I, and III vs. II) obtained by 100 independent iterations as feature species in the salivary and gut microbiomes. Feature species common to these models were used as a microbial signature of random forest classifiers. To calculate the median AUROC, 25 independent resamplings were performed using different partitioned datasets. Statistical significance was determined using the Wilcoxon signed-rank test.
Quantification and statistical analysis
All statistical analyses were performed using the statistical programming language R version 4.3.3 (2024-02-29). Statistical significance was determined using Tukey’s test, Welch’s t-test, DeLong’s test, Wilcoxon signed-rank test, and Wilcoxon rank-sum test with the Benjamini–Hochberg method. P-values below 0.05 were considered significant.
Published: May 6, 2025
Footnotes
Supplemental information can be found online at https://doi.org/10.1016/j.isci.2025.112593.
Contributor Information
Daisuke Hisamatsu, Email: d.hisamatsu.ap@juntendo.ac.jp.
Chihiro Akazawa, Email: c.akazawa.gt@juntendo.ac.jp.
Supplemental information
References
- 1.Haran J.P., Bucci V., Dutta P., Ward D., McCormick B. The nursing home elder microbiome stability and associations with age, frailty, nutrition and physical location. J. Med. Microbiol. 2018;67:40–51. doi: 10.1099/jmm.0.000640. [DOI] [PMC free article] [PubMed] [Google Scholar]
- 2.Allaband C., Lingaraju A., Flores Ramos S., Kumar T., Javaheri H., Tiu M.D., Dantas Machado A.C., Richter R.A., Elijah E., Haddad G.G., et al. Time of sample collection is critical for the replicability of microbiome analyses. Nat. Metab. 2024;6:1282–1293. doi: 10.1038/s42255-024-01064-1. [DOI] [PMC free article] [PubMed] [Google Scholar]
- 3.Tourlousse D.M., Narita K., Miura T., Sakamoto M., Ohashi A., Shiina K., Matsuda M., Miura D., Shimamura M., Ohyama Y., et al. Validation and standardization of DNA extraction and library construction methods for metagenomics-based human fecal microbiome measurements. Microbiome. 2021;9:95. doi: 10.1186/s40168-021-01048-3. [DOI] [PMC free article] [PubMed] [Google Scholar]
- 4.Vujkovic-Cvijin I., Sklar J., Jiang L., Natarajan L., Knight R., Belkaid Y. Host variables confound gut microbiota studies of human disease. Nature. 2020;587:448–454. doi: 10.1038/s41586-020-2881-9. [DOI] [PMC free article] [PubMed] [Google Scholar]
- 5.Larson P.J., Zhou W., Santiago A., Driscoll S., Fleming E., Voigt A.Y., Chun O.K., Grady J.J., Kuchel G.A., Robison J.T., Oh J. Associations of the skin, oral and gut microbiome with aging, frailty and infection risk reservoirs in older adults. Nat. Aging. 2022;2:941–955. doi: 10.1038/s43587-022-00287-9. [DOI] [PMC free article] [PubMed] [Google Scholar]
- 6.Liu X., Tong X., Jie Z., Zhu J., Tian L., Sun Q., Ju Y., Zou L., Lu H., Qiu X., et al. Sex differences in the oral microbiome, host traits, and their causal relationships. iScience. 2023;26 doi: 10.1016/j.isci.2022.105839. [DOI] [PMC free article] [PubMed] [Google Scholar]
- 7.Jackson M.A., Verdi S., Maxan M.E., Shin C.M., Zierer J., Bowyer R.C.E., Martin T., Williams F.M.K., Menni C., Bell J.T., et al. Gut microbiota associations with common diseases and prescription medications in a population-based cohort. Nat. Commun. 2018;9:2655. doi: 10.1038/s41467-018-05184-7. [DOI] [PMC free article] [PubMed] [Google Scholar]
- 8.Falony G., Joossens M., Vieira-Silva S., Wang J., Darzi Y., Faust K., Kurilshikov A., Bonder M.J., Valles-Colomer M., Vandeputte D., et al. Population-level analysis of gut microbiome variation. Science. 2016;352:560–564. doi: 10.1126/science.aad3503. [DOI] [PubMed] [Google Scholar]
- 9.Nagata N., Nishijima S., Miyoshi-Akiyama T., Kojima Y., Kimura M., Aoki R., Ohsugi M., Ueki K., Miki K., Iwata E., et al. Population-level metagenomics uncovers distinct effects of multiple medications on the human gut microbiome. Gastroenterology. 2022;163:1038–1052. doi: 10.1053/j.gastro.2022.06.070. [DOI] [PubMed] [Google Scholar]
- 10.Vich Vila A., Collij V., Sanna S., Sinha T., Imhann F., Bourgonje A.R., Mujagic Z., Jonkers D.M.A.E., Masclee A.A.M., Fu J., et al. Impact of commonly used drugs on the composition and metabolic function of the gut microbiota. Nat. Commun. 2020;11:362. doi: 10.1038/s41467-019-14177-z. [DOI] [PMC free article] [PubMed] [Google Scholar]
- 11.Mehta R.S., Mayers J.R., Zhang Y., Bhosle A., Glasser N.R., Nguyen L.H., Ma W., Bae S., Branck T., Song K., et al. Gut microbial metabolism of 5-ASA diminishes its clinical efficacy in inflammatory bowel disease. Nat. Med. 2023;29:700–709. doi: 10.1038/s41591-023-02217-7. [DOI] [PMC free article] [PubMed] [Google Scholar]
- 12.Vieira-Silva S., Falony G., Belda E., Nielsen T., Aron-Wisnewsky J., Chakaroun R., Forslund S.K., Assmann K., Valles-Colomer M., Nguyen T.T.D., et al. Statin therapy is associated with lower prevalence of gut microbiota dysbiosis. Nature. 2020;581:310–315. doi: 10.1038/s41586-020-2269-x. [DOI] [PubMed] [Google Scholar]
- 13.Bathini P., Foucras S., Dupanloup I., Imeri H., Perna A., Berruex J.L., Doucey M.A., Annoni J.M., Auber Alberi L. Classifying dementia progression using microbial profiling of saliva. Alzheimer's Dement. 2020;12 doi: 10.1002/dad2.12000. [DOI] [PMC free article] [PubMed] [Google Scholar]
- 14.Liu X.X., Jiao B., Liao X.X., Guo L.N., Yuan Z.H., Wang X., Xiao X.W., Zhang X.Y., Tang B.S., Shen L. Analysis of salivary microbiome in patients with Alzheimer's disease. J. Alzheimers Dis. 2019;72:633–640. doi: 10.3233/JAD-190587. [DOI] [PubMed] [Google Scholar]
- 15.Guo H., Li B., Yao H., Liu D., Chen R., Zhou S., Ji Y., Zeng L., Du M. Profiling the oral microbiomes in patients with Alzheimer's disease. Oral Dis. 2023;29:1341–1355. doi: 10.1111/odi.14110. [DOI] [PubMed] [Google Scholar]
- 16.Ueda A., Shinkai S., Shiroma H., Taniguchi Y., Tsuchida S., Kariya T., Kawahara T., Kobayashi Y., Kohda N., Ushida K., et al. Identification of Faecalibacterium prausnitzii strains for gut microbiome-based intervention in Alzheimer's-type dementia. Cell Rep. Med. 2021;2 doi: 10.1016/j.xcrm.2021.100398. [DOI] [PMC free article] [PubMed] [Google Scholar]
- 17.Saji N., Niida S., Murotani K., Hisada T., Tsuduki T., Sugimoto T., Kimura A., Toba K., Sakurai T. Analysis of the relationship between the gut microbiome and dementia: a cross-sectional study conducted in Japan. Sci. Rep. 2019;9:1008. doi: 10.1038/s41598-018-38218-7. [DOI] [PMC free article] [PubMed] [Google Scholar]
- 18.Saji N., Murotani K., Hisada T., Tsuduki T., Sugimoto T., Kimura A., Niida S., Toba K., Sakurai T. The relationship between the gut microbiome and mild cognitive impairment in patients without dementia: a cross-sectional study conducted in Japan. Sci. Rep. 2019;9 doi: 10.1038/s41598-019-55851-y. [DOI] [PMC free article] [PubMed] [Google Scholar]
- 19.Susmitha G., Kumar R. Role of microbial dysbiosis in the pathogenesis of Alzheimer's disease. Neuropharmacology. 2023;229 doi: 10.1016/j.neuropharm.2023.109478. [DOI] [PubMed] [Google Scholar]
- 20.Sureda A., Daglia M., Argüelles Castilla S., Sanadgol N., Fazel Nabavi S., Khan H., Belwal T., Jeandet P., Marchese A., Pistollato F., et al. Oral microbiota and Alzheimer’s disease: do all roads lead to Rome? Pharmacol. Res. 2020;151 doi: 10.1016/j.phrs.2019.104582. [DOI] [PubMed] [Google Scholar]
- 21.Romano S., Savva G.M., Bedarf J.R., Charles I.G., Hildebrand F., Narbad A. Meta-analysis of the Parkinson's disease gut microbiome suggests alterations linked to intestinal inflammation. npj Parkinson's Dis. 2021;7:27. doi: 10.1038/s41531-021-00156-z. [DOI] [PMC free article] [PubMed] [Google Scholar]
- 22.Jo S., Kang W., Hwang Y.S., Lee S.H., Park K.W., Kim M.S., Lee H., Yoon H.J., Park Y.K., Chalita M., et al. Oral and gut dysbiosis leads to functional alterations in Parkinson's disease. npj Parkinson's Dis. 2022;8:87. doi: 10.1038/s41531-022-00351-6. [DOI] [PMC free article] [PubMed] [Google Scholar]
- 23.Huang B., Chau S.W.H., Liu Y., Chan J.W.Y., Wang J., Ma S.L., Zhang J., Chan P.K.S., Yeoh Y.K., Chen Z., et al. Gut microbiome dysbiosis across early Parkinson's disease, REM sleep behavior disorder and their first-degree relatives. Nat. Commun. 2023;14:2501. doi: 10.1038/s41467-023-38248-4. [DOI] [PMC free article] [PubMed] [Google Scholar]
- 24.Fung T.C., Olson C.A., Hsiao E.Y. Interactions between the microbiota, immune and nervous systems in health and disease. Nat. Neurosci. 2017;20:145–155. doi: 10.1038/nn.4476. [DOI] [PMC free article] [PubMed] [Google Scholar]
- 25.Fujii Y., Nguyen T.T.T., Fujimura Y., Kameya N., Nakamura S., Arakawa K., Morita H. Fecal metabolite of a gnotobiotic mouse transplanted with gut microbiota from a patient with Alzheimer’s disease. Biosci. Biotechnol. Biochem. 2019;83:2144–2152. doi: 10.1080/09168451.2019.1644149. [DOI] [PubMed] [Google Scholar]
- 26.Fan Y., Pedersen O. Gut microbiota in human metabolic health and disease. Nat. Rev. Microbiol. 2021;19:55–71. doi: 10.1038/s41579-020-0433-9. [DOI] [PubMed] [Google Scholar]
- 27.Sampson T.R., Debelius J.W., Thron T., Janssen S., Shastri G.G., Ilhan Z.E., Challis C., Schretter C.E., Rocha S., Gradinaru V., et al. Gut Microbiota Regulate Motor Deficits and Neuroinflammation in a Model of Parkinson's Disease. Cell. 2016;167:1469–1480.e12. doi: 10.1016/j.cell.2016.11.018. [DOI] [PMC free article] [PubMed] [Google Scholar]
- 28.Parashar A., Udayabanu M. Gut microbiota: Implications in Parkinson's disease. Parkinsonism Relat. Disord. 2017;38:1–7. doi: 10.1016/j.parkreldis.2017.02.002. [DOI] [PMC free article] [PubMed] [Google Scholar]
- 29.Zhu X., Li B., Lou P., Dai T., Chen Y., Zhuge A., Yuan Y., Li L. The relationship between the gut microbiome and neurodegenerative diseases. Neurosci. Bull. 2021;37:1510–1522. doi: 10.1007/s12264-021-00730-8. [DOI] [PMC free article] [PubMed] [Google Scholar]
- 30.Liang X., Fu Y., Cao W.T., Wang Z., Zhang K., Jiang Z., Jia X., Liu C.Y., Lin H.R., Zhong H., et al. Gut microbiome, cognitive function and brain structure: a multi-omics integration analysis. Transl. Neurodegener. 2022;11:49. doi: 10.1186/s40035-022-00323-z. [DOI] [PMC free article] [PubMed] [Google Scholar]
- 31.Farnsworth von Cederwald B., Josefsson M., Wåhlin A., Nyberg L., Karalija N. Association of cardiovascular risk trajectory with cognitive decline and incident dementia. Neurology. 2022;98:e2013–e2022. doi: 10.1212/WNL.0000000000200255. [DOI] [PMC free article] [PubMed] [Google Scholar]
- 32.Irwin D.J., Lee V.M.Y., Trojanowski J.Q. Parkinson's disease dementia: convergence of alpha-synuclein, tau and amyloid-beta pathologies. Nat. Rev. Neurosci. 2013;14:626–636. doi: 10.1038/nrn3549. [DOI] [PMC free article] [PubMed] [Google Scholar]
- 33.Kandimalla R., Reddy P.H. Therapeutics of neurotransmitters in Alzheimer's disease. J. Alzheimers Dis. 2017;57:1049–1069. doi: 10.3233/JAD-161118. [DOI] [PMC free article] [PubMed] [Google Scholar]
- 34.Tomlinson C.L., Stowe R., Patel S., Rick C., Gray R., Clarke C.E. Systematic review of levodopa dose equivalency reporting in Parkinson's disease. Mov. Disord. 2010;25:2649–2653. doi: 10.1002/mds.23429. [DOI] [PubMed] [Google Scholar]
- 35.Cao Q., Tan C.C., Xu W., Hu H., Cao X.P., Dong Q., Tan L., Yu J.T. The prevalence of dementia: a systematic review and meta-analysis. J. Alzheimers Dis. 2020;73:1157–1166. doi: 10.3233/JAD-191092. [DOI] [PubMed] [Google Scholar]
- 36.GBD 2019 Dementia Forecasting Collaborators Estimation of the global prevalence of dementia in 2019 and forecasted prevalence in 2050: an analysis for the Global Burden of Disease Study 2019. Lancet Public Health. 2022;7:e105–e125. doi: 10.1016/S2468-2667(21)00249-8. [DOI] [PMC free article] [PubMed] [Google Scholar]
- 37.Nagata N., Takeuchi T., Masuoka H., Aoki R., Ishikane M., Iwamoto N., Sugiyama M., Suda W., Nakanishi Y., Terada-Hirashima J., et al. Human gut microbiota and its metabolites impact immune responses in COVID-19 and its complications. Gastroenterology. 2023;164:272–288. doi: 10.1053/j.gastro.2022.09.024. [DOI] [PMC free article] [PubMed] [Google Scholar]
- 38.Blanpied T.A., Boeckman F.A., Aizenman E., Johnson J.W. Trapping channel block of NMDA-activated responses by amantadine and memantine. J. Neurophysiol. 1997;77:309–323. doi: 10.1152/jn.1997.77.1.309. [DOI] [PubMed] [Google Scholar]
- 39.Seltzer B. Donepezil: a review. Expert Opin. Drug Metab. Toxicol. 2005;1:527–536. doi: 10.1517/17425255.1.3.527. [DOI] [PubMed] [Google Scholar]
- 40.Choi Y.A., Song I.S., Choi M.K. Pharmacokinetic drug-drug interaction and responsible mechanism between memantine and cimetidine. Pharmaceutics. 2018;10 doi: 10.3390/pharmaceutics10030119. [DOI] [PMC free article] [PubMed] [Google Scholar]
- 41.Ma S.L., Tang N.L.S., Wat K.H.Y., Tang J.H.Y., Lau K.H., Law C.B., Chiu J., Tam C.C.W., Poon T.K., Lin K.L., et al. Effect of CYP2D6 and CYP3A4 genotypes on the efficacy of cholinesterase inhibitors in Southern Chinese patients with Alzheimer's disease. Am. J. Alzheimers Dis. Other Demen. 2019;34:302–307. doi: 10.1177/1533317519848237. [DOI] [PMC free article] [PubMed] [Google Scholar]
- 42.Sani G., Serra G., Kotzalidis G.D., Romano S., Tamorri S.M., Manfredi G., Caloro M., Telesforo C.L., Caltagirone S.S., Panaccione I., et al. The role of memantine in the treatment of psychiatric disorders other than the dementias: a review of current preclinical and clinical evidence. CNS Drugs. 2012;26:663–690. doi: 10.2165/11634390-000000000-00000. [DOI] [PubMed] [Google Scholar]
- 43.Manne S., Kondru N., Jin H., Anantharam V., Huang X., Kanthasamy A., Kanthasamy A.G. alpha-Synuclein real-time quaking-induced conversion in the submandibular glands of Parkinson's disease patients. Mov. Disord. 2020;35:268–278. doi: 10.1002/mds.27907. [DOI] [PMC free article] [PubMed] [Google Scholar]
- 44.Conrad C., Vianna C., Freeman M., Davies P. A polymorphic gene nested within an intron of the tau gene: implications for Alzheimer's disease. Proc. Natl. Acad. Sci. USA. 2002;99:7751–7756. doi: 10.1073/pnas.112194599. [DOI] [PMC free article] [PubMed] [Google Scholar]
- 45.Ashton N.J., Ide M., Zetterberg H., Blennow K. Salivary biomarkers for Alzheimer’s disease and related disorders. Neurol. Ther. 2019;8:83–94. doi: 10.1007/s40120-019-00168-1. [DOI] [PMC free article] [PubMed] [Google Scholar]
- 46.Farah R., Haraty H., Salame Z., Fares Y., Ojcius D.M., Said Sadier N. Salivary biomarkers for the diagnosis and monitoring of neurological diseases. Biomed. J. 2018;41:63–87. doi: 10.1016/j.bj.2018.03.004. [DOI] [PMC free article] [PubMed] [Google Scholar]
- 47.Schloss M.J., Hulsmans M., Rohde D., Lee I.H., Severe N., Foy B.H., Pulous F.E., Zhang S., Kokkaliaris K.D., Frodermann V., et al. B lymphocyte-derived acetylcholine limits steady-state and emergency hematopoiesis. Nat. Immunol. 2022;23:605–618. doi: 10.1038/s41590-022-01165-7. [DOI] [PMC free article] [PubMed] [Google Scholar]
- 48.Miklossy J. Chronic inflammation and amyloidogenesis in Alzheimer’s disease: Putative role of bacterial peptidoglycan, a potent inflammatory and amyloidogenic factor. Alzheimers Rev. 1998;3:45–51. [Google Scholar]
- 49.Miklossy J., McGeer P.L. Common mechanisms involved in Alzheimer's disease and type 2 diabetes: a key role of chronic bacterial infection and inflammation. Aging (Albany NY) 2016;8:575–588. doi: 10.18632/aging.100921. [DOI] [PMC free article] [PubMed] [Google Scholar]
- 50.Ng W.-L., Bassler B.L. Bacterial quorum-sensing network architectures. Annu. Rev. Genet. 2009;43:197–222. doi: 10.1146/annurev-genet-102108-134304. [DOI] [PMC free article] [PubMed] [Google Scholar]
- 51.Chadha J., Harjai K., Chhibber S. Revisiting the virulence hallmarks of Pseudomonas aeruginosa: a chronicle through the perspective of quorum sensing. Environ. Microbiol. 2022;24:2630–2656. doi: 10.1111/1462-2920.15784. [DOI] [PubMed] [Google Scholar]
- 52.Andreadou E., Pantazaki A.A., Daniilidou M., Tsolaki M. Rhamnolipids, Microbial Virulence Factors, in Alzheimer's Disease. J. Alzheimers Dis. 2017;59:209–222. doi: 10.3233/JAD-161020. [DOI] [PubMed] [Google Scholar]
- 53.Hakli Ö., Yarali S., Öner Usta E., Ayaz F. Photodynamic anti-inflammatory activity of meso-aryl substituted porphyrin derivative on mammalian macrophages. Photodiagnosis Photodyn. Ther. 2024;45 doi: 10.1016/j.pdpdt.2023.103922. [DOI] [PubMed] [Google Scholar]
- 54.Jelic D., Tatic I., Trzun M., Hrvacic B., Brajsa K., Verbanac D., Tomaskovic M., Culic O., Antolovic R., Glojnaric I. Porphyrins as new endogenous anti-inflammatory agents. Eur. J. Pharmacol. 2012;691:251–260. doi: 10.1016/j.ejphar.2012.05.049. [DOI] [PubMed] [Google Scholar]
- 55.Kalecky K., Ashcraft P., Bottiglieri T. One-Carbon Metabolism in Alzheimer's Disease and Parkinson's Disease Brain Tissue. Nutrients. 2022;14:599. doi: 10.3390/nu14030599. [DOI] [PMC free article] [PubMed] [Google Scholar]
- 56.Maffioli E., Murtas G., Rabattoni V., Badone B., Tripodi F., Iannuzzi F., Licastro D., Nonnis S., Rinaldi A.M., Motta Z., et al. Insulin and serine metabolism as sex-specific hallmarks of Alzheimer's disease in the human hippocampus. Cell Rep. 2022;40 doi: 10.1016/j.celrep.2022.111271. [DOI] [PubMed] [Google Scholar]
- 57.Yu Y., Chen C.Z., Celardo I., Tan B.W.Z., Hurcomb J.D., Leal N.S., Popovic R., Loh S.H.Y., Martins L.M. Enhancing mitochondrial one-carbon metabolism is neuroprotective in Alzheimer's disease models. Cell Death Dis. 2024;15:856. doi: 10.1038/s41419-024-07179-3. [DOI] [PMC free article] [PubMed] [Google Scholar]
- 58.Yu Y., Martins L.M. Mitochondrial One-Carbon Metabolism and Alzheimer's Disease. Int. J. Mol. Sci. 2024;25 doi: 10.3390/ijms25126302. [DOI] [PMC free article] [PubMed] [Google Scholar]
- 59.Udit S., Blake K., Chiu I.M. Somatosensory and autonomic neuronal regulation of the immune response. Nat. Rev. Neurosci. 2022;23:157–171. doi: 10.1038/s41583-021-00555-4. [DOI] [PMC free article] [PubMed] [Google Scholar]
- 60.Cox L.M., Abou-El-Hassan H., Maghzi A.H., Vincentini J., Weiner H.L. The sex-specific interaction of the microbiome in neurodegenerative diseases. Brain Res. 2019;1724 doi: 10.1016/j.brainres.2019.146385. [DOI] [PMC free article] [PubMed] [Google Scholar]
- 61.Lopez-Lee C., Torres E.R.S., Carling G., Gan L. Mechanisms of sex differences in Alzheimer's disease. Neuron. 2024;112:1208–1221. doi: 10.1016/j.neuron.2024.01.024. [DOI] [PMC free article] [PubMed] [Google Scholar]
- 62.Wattmo C., Wallin Å.K., Londos E., Minthon L. Predictors of long-term cognitive outcome in Alzheimer's disease. Alzheimers Res. Ther. 2011;3:23. doi: 10.1186/alzrt85. [DOI] [PMC free article] [PubMed] [Google Scholar]
- 63.Wattmo C., Wallin Å.K. Early- versus late-onset Alzheimer's disease in clinical practice: cognitive and global outcomes over 3 years. Alzheimers Res. Ther. 2017;9:70. doi: 10.1186/s13195-017-0294-2. [DOI] [PMC free article] [PubMed] [Google Scholar]
- 64.Seeman M.V. Men and women respond differently to antipsychotic drugs. Neuropharmacology. 2020;163 doi: 10.1016/j.neuropharm.2019.05.008. [DOI] [PubMed] [Google Scholar]
- 65.Canevelli M., Quarata F., Remiddi F., Lucchini F., Lacorte E., Vanacore N., Bruno G., Cesari M. Sex and gender differences in the treatment of Alzheimer's disease: a systematic review of randomized controlled trials. Pharmacol. Res. 2017;115:218–223. doi: 10.1016/j.phrs.2016.11.035. [DOI] [PubMed] [Google Scholar]
- 66.Wu Y.F., Lee W.F., Salamanca E., Yao W.L., Su J.N., Wang S.Y., Hu C.J., Chang W.J. Oral Microbiota Changes in Elderly Patients, an Indicator of Alzheimer's Disease. Int. J. Environ. Res. Public Health. 2021;18 doi: 10.3390/ijerph18084211. [DOI] [PMC free article] [PubMed] [Google Scholar]
- 67.Chen L., Xu X., Wu X., Cao H., Li X., Hou Z., Wang B., Liu J., Ji X., Zhang P., Li H. A comparison of the composition and functions of the oral and gut microbiotas in Alzheimer's patients. Front. Cell. Infect. Microbiol. 2022;12 doi: 10.3389/fcimb.2022.942460. [DOI] [PMC free article] [PubMed] [Google Scholar]
- 68.Hou M., Xu G., Ran M., Luo W., Wang H. APOE-epsilon4 Carrier Status and Gut Microbiota Dysbiosis in Patients With Alzheimer Disease. Front. Neurosci. 2021;15 doi: 10.3389/fnins.2021.619051. [DOI] [PMC free article] [PubMed] [Google Scholar]
- 69.Jung J.H., Kim G., Byun M.S., Lee J.H., Yi D., Park H., Lee D.Y., KBASE Research Group Gut microbiome alterations in preclinical Alzheimer's disease. PLoS One. 2022;17 doi: 10.1371/journal.pone.0278276. [DOI] [PMC free article] [PubMed] [Google Scholar]
- 70.Vinogradova E., Jarmukhanov Z., Nurgaziyev M., Kossumov A., Nurgozhina A., Mukhanbetzhanov N., Sergazy S., Chulenabyeva L., Issilbayeva A., Askarova S., et al. Enterococcus dysbiosis as a mediator of vitamin D deficiency-associated memory impairments. Heliyon. 2025;11 doi: 10.1016/j.heliyon.2025.e41969. [DOI] [PMC free article] [PubMed] [Google Scholar]
- 71.Maier L., Pruteanu M., Kuhn M., Zeller G., Telzerow A., Anderson E.E., Brochado A.R., Fernandez K.C., Dose H., Mori H., et al. Extensive impact of non-antibiotic drugs on human gut bacteria. Nature. 2018;555:623–628. doi: 10.1038/nature25979. [DOI] [PMC free article] [PubMed] [Google Scholar]
- 72.Koppel N., Maini Rekdal V., Balskus E.P. Chemical transformation of xenobiotics by the human gut microbiota. Science. 2017;356 doi: 10.1126/science.aag2770. [DOI] [PMC free article] [PubMed] [Google Scholar]
- 73.Spanogiannopoulos P., Bess E.N., Carmody R.N., Turnbaugh P.J. The microbial pharmacists within us: a metagenomic view of xenobiotic metabolism. Nat. Rev. Microbiol. 2016;14:273–287. doi: 10.1038/nrmicro.2016.17. [DOI] [PMC free article] [PubMed] [Google Scholar]
- 74.Bergmark J., Carlsson A., Granerus A.-K., Jagenburg R., Magnusson T., Svanborg A. Decarboxylation of orally administered L-dopa in the human digestive tract. Naunyn-Schmiedebergs Arch Pharmacol. 1972;272:437–440. doi: 10.1007/BF00501249. [DOI] [PubMed] [Google Scholar]
- 75.Goldin B.R., Peppercorn M.A., Goldman P. Contributions of host and intestinal microflora in the metabolism of L-dopa by the rat. J. Pharmacol. Exp. Ther. 1973;186:160–166. [PubMed] [Google Scholar]
- 76.Nutt J.G., Holford N.H. The response to levodopa in Parkinson's disease: imposing pharmacological law and order. Ann. Neurol. 1996;39:561–573. doi: 10.1002/ana.410390504. [DOI] [PubMed] [Google Scholar]
- 77.Morgan A.P., Crowley J.J., Nonneman R.J., Quackenbush C.R., Miller C.N., Ryan A.K., Bogue M.A., Paredes S.H., Yourstone S., Carroll I.M., et al. The antipsychotic olanzapine interacts with the gut microbiome to cause weight gain in mouse. PLoS One. 2014;9 doi: 10.1371/journal.pone.0115225. [DOI] [PMC free article] [PubMed] [Google Scholar]
- 78.Davey K.J., Cotter P.D., O'Sullivan O., Crispie F., Dinan T.G., Cryan J.F., O'Mahony S.M. Antipsychotics and the gut microbiome: olanzapine-induced metabolic dysfunction is attenuated by antibiotic administration in the rat. Transl. Psychiatry. 2013;3 doi: 10.1038/tp.2013.83. [DOI] [PMC free article] [PubMed] [Google Scholar]
- 79.Koropatkin N.M., Cameron E.A., Martens E.C. How glycan metabolism shapes the human gut microbiota. Nat. Rev. Microbiol. 2012;10:323–335. doi: 10.1038/nrmicro2746. [DOI] [PMC free article] [PubMed] [Google Scholar]
- 80.Basak S., Banerjee A., Pathak S., Duttaroy A.K. Dietary Fats and the Gut Microbiota: Their impacts on lipid-induced metabolic syndrome. J. Funct.Foods. 2022;91 doi: 10.1016/j.jff.2022.105026. [DOI] [Google Scholar]
- 81.Suez J., Cohen Y., Valdes-Mas R., Mor U., Dori-Bachash M., Federici S., Zmora N., Leshem A., Heinemann M., Linevsky R., et al. Personalized microbiome-driven effects of non-nutritive sweeteners on human glucose tolerance. Cell. 2022;185:3307–3328.e19. doi: 10.1016/j.cell.2022.07.016. [DOI] [PubMed] [Google Scholar]
- 82.Culp E.J., Nelson N.T., Verdegaal A.A., Goodman A.L. Microbial transformation of dietary xenobiotics shapes gut microbiome composition. Cell. 2024;187:6327–6345.e20. doi: 10.1016/j.cell.2024.08.038. [DOI] [PMC free article] [PubMed] [Google Scholar]
- 83.Kolodziejczyk A.A., Zheng D., Elinav E. Diet-microbiota interactions and personalized nutrition. Nat. Rev. Microbiol. 2019;17:742–753. doi: 10.1038/s41579-019-0256-8. [DOI] [PubMed] [Google Scholar]
- 84.Hashimoto K., Shimizu D., Hirabayashi S., Ueda S., Miyabe S., Oh-Iwa I., Nagao T., Shimozato K., Nomoto S. Changes in oral microbial profiles associated with oral squamous cell carcinoma vs leukoplakia. J. Investig. Clin. Dent. 2019;10 doi: 10.1111/jicd.12445. [DOI] [PubMed] [Google Scholar]
- 85.Che S., Yan Z., Feng Y., Zhao H. Unveiling the intratumoral microbiota within cancer landscapes. iScience. 2024;27 doi: 10.1016/j.isci.2024.109893. [DOI] [PMC free article] [PubMed] [Google Scholar]
- 86.Pushalkar S., Li X., Kurago Z., Ramanathapuram L.V., Matsumura S., Fleisher K.E., Glickman R., Yan W., Li Y., Saxena D. Oral microbiota and host innate immune response in bisphosphonate-related osteonecrosis of the jaw. Int. J. Oral Sci. 2014;6:219–226. doi: 10.1038/ijos.2014.46. [DOI] [PMC free article] [PubMed] [Google Scholar]
- 87.Russmueller G., Seemann R., Weiss K., Stadler V., Speiss M., Perisanidis C., Fuereder T., Willinger B., Sulzbacher I., Steininger C. The association of medication-related osteonecrosis of the jaw with Actinomyces spp. infection. Sci. Rep. 2016;6 doi: 10.1038/srep31604. [DOI] [PMC free article] [PubMed] [Google Scholar]
- 88.Baker J.L., Bor B., Agnello M., Shi W., He X. Ecology of the Oral Microbiome: Beyond Bacteria. Trends Microbiol. 2017;25:362–374. doi: 10.1016/j.tim.2016.12.012. [DOI] [PMC free article] [PubMed] [Google Scholar]
- 89.Liu B., Faller L.L., Klitgord N., Mazumdar V., Ghodsi M., Sommer D.D., Gibbons T.R., Treangen T.J., Chang Y.C., Li S., et al. Deep sequencing of the oral microbiome reveals signatures of periodontal disease. PLoS One. 2012;7 doi: 10.1371/journal.pone.0037919. [DOI] [PMC free article] [PubMed] [Google Scholar]
- 90.Wang L., Gao Z., Zhao Z., Shen X., Feng J., Xiong J. Oral microbiota in periodontitis patients with and without type 2 diabetes mellitus and their shifts after the nonsurgical periodontal therapy. Heliyon. 2023;9 doi: 10.1016/j.heliyon.2023.e22110. [DOI] [PMC free article] [PubMed] [Google Scholar]
- 91.Nagao J.I., Kishikawa S., Tanaka H., Toyonaga K., Narita Y., Negoro-Yasumatsu K., Tasaki S., Arita-Morioka K.I., Nakayama J., Tanaka Y. Pathobiont-responsive Th17 cells in gut-mouth axis provoke inflammatory oral disease and are modulated by intestinal microbiome. Cell Rep. 2022;40 doi: 10.1016/j.celrep.2022.111314. [DOI] [PubMed] [Google Scholar]
- 92.Hajishengallis G., Lamont R.J., Koo H. Oral polymicrobial communities: Assembly, function, and impact on diseases. Cell Host Microbe. 2023;31:528–538. doi: 10.1016/j.chom.2023.02.009. [DOI] [PMC free article] [PubMed] [Google Scholar]
- 93.Tran T.T.T., Corsini S., Kellingray L., Hegarty C., Le Gall G., Narbad A., Müller M., Tejera N., O'Toole P.W., Minihane A.M., Vauzour D. APOE genotype influences the gut microbiome structure and function in humans and mice: relevance for Alzheimer's disease pathophysiology. FASEB J. 2019;33:8221–8231. doi: 10.1096/fj.201900071R. [DOI] [PMC free article] [PubMed] [Google Scholar]
- 94.Seo D.O., O'Donnell D., Jain N., Ulrich J.D., Herz J., Li Y., Lemieux M., Cheng J., Hu H., Serrano J.R., et al. ApoE isoform- and microbiota-dependent progression of neurodegeneration in a mouse model of tauopathy. Science. 2023;379 doi: 10.1126/science.add1236. [DOI] [PMC free article] [PubMed] [Google Scholar]
- 95.Wallen Z.D., Stone W.J., Factor S.A., Molho E., Zabetian C.P., Standaert D.G., Payami H. Exploring human-genome gut-microbiome interaction in Parkinson's disease. npj Parkinson's Dis. 2021;7:74. doi: 10.1038/s41531-021-00218-2. [DOI] [PMC free article] [PubMed] [Google Scholar]
- 96.Lu J., Wang X., Wan L., Fu J., Huo Y., Zhao Y., Guo C. Gene Polymorphisms Affecting the Pharmacokinetics and Pharmacodynamics of Donepezil Efficacy. Front. Pharmacol. 2020;11:934. doi: 10.3389/fphar.2020.00934. [DOI] [PMC free article] [PubMed] [Google Scholar]
- 97.Martin M. Cutadapt removes adapter sequences from high-throughput sequencing reads. EMBnet. j. 2011;17:10–12. [Google Scholar]
- 98.Callahan B.J., McMurdie P.J., Rosen M.J., Han A.W., Johnson A.J.A., Holmes S.P. DADA2: High-resolution sample inference from Illumina amplicon data. Nat. Methods. 2016;13:581–583. doi: 10.1038/nmeth.3869. [DOI] [PMC free article] [PubMed] [Google Scholar]
- 99.Douglas G.M., Maffei V.J., Zaneveld J.R., Yurgel S.N., Brown J.R., Taylor C.M., Huttenhower C., Langille M.G.I. PICRUSt2 for prediction of metagenome functions. Nat. Biotechnol. 2020;38:685–688. doi: 10.1038/s41587-020-0548-6. [DOI] [PMC free article] [PubMed] [Google Scholar]
- 100.Dixon P. VEGAN, a package of R functions for community ecology. J. Veg. Sci. 2003;14:927–930. [Google Scholar]
- 101.Breiman L. Random Forests. Mach. Learn. 2001;45:5–32. doi: 10.1023/A:1010933404324. [DOI] [Google Scholar]
- 102.Robin X., Turck N., Hainard A., Tiberti N., Lisacek F., Sanchez J.-C., Müller M. pROC: an open-source package for R and S+ to analyze and compare ROC curves. BMC Bioinf. 2011;12:77. doi: 10.1186/1471-2105-12-77. [DOI] [PMC free article] [PubMed] [Google Scholar]
- 103.Yu G., Wang L.-G., Han Y., He Q.-Y. clusterProfiler: an R Package for Comparing Biological Themes Among Gene Clusters. OMICS A J. Integr. Biol. 2012;16:284–287. doi: 10.1089/omi.2011.0118. [DOI] [PMC free article] [PubMed] [Google Scholar]
- 104.Wu T., Hu E., Xu S., Chen M., Guo P., Dai Z., Feng T., Zhou L., Tang W., Zhan L., et al. clusterProfiler 4.0: A universal enrichment tool for interpreting omics data. Innovation. 2021;2 doi: 10.1016/j.xinn.2021.100141. [DOI] [PMC free article] [PubMed] [Google Scholar]
- 105.Mallick H., Rahnavard A., McIver L.J., Ma S., Zhang Y., Nguyen L.H., Tickle T.L., Weingart G., Ren B., Schwager E.H., et al. Multivariable association discovery in population-scale meta-omics studies. PLoS Comput. Biol. 2021;17 doi: 10.1371/journal.pcbi.1009442. [DOI] [PMC free article] [PubMed] [Google Scholar]
- 106.Said H.S., Suda W., Nakagome S., Chinen H., Oshima K., Kim S., Kimura R., Iraha A., Ishida H., Fujita J., et al. Dysbiosis of salivary microbiota in inflammatory bowel disease and its association with oral immunological biomarkers. DNA Res. 2014;21:15–25. doi: 10.1093/dnares/dst037. [DOI] [PMC free article] [PubMed] [Google Scholar]
- 107.Iwasawa K., Suda W., Tsunoda T., Oikawa-Kawamoto M., Umetsu S., Takayasu L., Inui A., Fujisawa T., Morita H., Sogo T., Hattori M. Dysbiosis of the salivary microbiota in pediatric-onset primary sclerosing cholangitis and its potential as a biomarker. Sci. Rep. 2018;8:5480. doi: 10.1038/s41598-018-23870-w. [DOI] [PMC free article] [PubMed] [Google Scholar]
- 108.Aiyoshi T., Kakihara T., Watanabe E., Tanaka N., Ogata Y., Masuoka H., Kurokawa R., Fujishiro J., Masumoto K., Suda W. A comprehensive microbial analysis of pediatric patients with acute appendicitis. J. Microbiol. Immunol. Infect. 2023;56:695–704. doi: 10.1016/j.jmii.2023.03.006. [DOI] [PubMed] [Google Scholar]
- 109.Li Y., Watanabe E., Kawashima Y., Plichta D.R., Wang Z., Ujike M., Ang Q.Y., Wu R., Furuichi M., Takeshita K., et al. Identification of trypsin-degrading commensals in the large intestine. Nature. 2022;609:582–589. doi: 10.1038/s41586-022-05181-3. [DOI] [PMC free article] [PubMed] [Google Scholar]
- 110.Nishijima S., Nagata N., Kiguchi Y., Kojima Y., Miyoshi-Akiyama T., Kimura M., Ohsugi M., Ueki K., Oka S., Mizokami M., et al. Extensive gut virome variation and its associations with host and environmental factors in a population-level cohort. Nat. Commun. 2022;13:5252. doi: 10.1038/s41467-022-32832-w. [DOI] [PMC free article] [PubMed] [Google Scholar]
- 111.Bouckaert R.R., Frank E. Springer; 2004. Evaluating the Replicability of Significance Tests for Comparing Learning Algorithms; pp. 3–12. [Google Scholar]
- 112.Rainio O., Teuho J., Klén R. Evaluation metrics and statistical tests for machine learning. Sci. Rep. 2024;14:6086. doi: 10.1038/s41598-024-56706-x. [DOI] [PMC free article] [PubMed] [Google Scholar]
Associated Data
This section collects any data citations, data availability statements, or supplementary materials included in this article.
Supplementary Materials
Data Availability Statement
-
•
The bacterial 16S rRNA sequencing data generated for this study were deposited in the DDBJ/GenBank/EMBL databases and NCBI BioProject database under accession numbers DRA016578, DRA016579, DRA016580, and DRA019791.
-
•
Clinical data, except those included in this article, are not available in a public repository or supplemental information to protect the privacy and confidentiality of the study participants.
-
•
Requests for clinical data can be directed to the corresponding authors and will be reviewed by the Ethics Committee of the Juntendo University School of Medicine. All shared data were de-identified.