

Summary
Accurately detecting and quantifying CRISPR edits with high sensitivity is crucial for developing new genome editing applications in plants. This is especially important when analyzing heterogeneous populations from transient expression-based approaches used for technology development as well as evaluating of guide RNA (gRNA) performance in planta. However, current studies employ vastly different techniques to quantify genome editing outcomes, limiting the comparability and repeatability of results. In this study, we systematically evaluated and compared experimental techniques for quantifying plant genome editing across a wide range of efficiencies. We measured genome editing efficiency from 20 transiently expressed Cas9 targets using different techniques, including targeted amplicon sequencing (AmpSeq), PCR-restriction fragment length polymorphism (RFLP) assays, T7 endonuclease 1 (T7E1) assays, Sanger sequencing of amplicon products (deconvoluted and analyzed using three algorithms), PCR-capillary electrophoresis/InDel detection by amplicon analysis (PCR-CE/IDAA), and droplet digital PCR (ddPCR). We assessed methods based on their accuracy, sensitivity, and cost, benchmarked to AmpSeq. Furthermore, we discuss the advantages and drawbacks of each technique, the issues faced during optimization and the solutions we devised. This study will be useful to experienced and new researchers in the field, providing suggestions and guidelines to standardize data output and advice about the most suitable technique/s to quantify genome edits for different plant applications.
Subject areas: molecular biology, plant biology, plant Genetics
Graphical abstract
Highlights
-
•
Different methods show differences in the quantified frequency of CRISPR edits
-
•
Base caller affect the sensitivity of Sanger sequencing for low frequency edits
-
•
PCR-CE/IDAA and ddPCR methods are accurate when benchmarked to AmpSeq
Molecular biology; Plant biology; Plant Genetics
Introduction
The emergence of clustered regularly interspaced short palindromic repeats (CRISPR) technology enabled research laboratories to perform precise genome editing in a relatively straightforward manner with high efficiency. CRISPR has shown tremendous versatility with the development of base editors,1,2,3 prime editors,4,5 transcriptional regulators,6,7,8 epigenome modifiers,9,10 RNA editors,11,12 and others, expanding the functionality of the CRISPR toolbox beyond the “simple” introduction of targeted mutations into the genome. The basic CRISPR-Cas9 system uses a Cas9 endonuclease directed by a guide RNA (gRNA) to the target DNA sequence, resulting in the production of double-stranded breaks.13,14,15 Repair of the chromosomal breaks is mostly mediated by the non-homologous end joining (NHEJ) pathway, which occasionally introduces insertion, deletion, or substitution mutations at the break site.8,16 This fundamental CRISPR system has been widely used for targeted mutagenesis and gene knockout in plants.
The typical plant gene editing workflow relies on the introduction of CRISPR cassettes into the genome of plant tissues using Agrobacterium tumefaciens (Rhizobium radiobacter) or particle bombardment, followed by selection of transformed cells and regeneration into whole plants.17,18,19,20,21 The stably transformed regenerants are screened to identify individuals containing the desired genome edits, which are then propagated to produce a homozygous genome-edited population.19 This workflow, however, is often laborious, time-consuming, and inefficient in many non-model plant species.18,21,22,23 In the case of Cas9-based CRISPR systems, it has been extensively documented that genome editing efficiency is mainly determined by the single gRNA (sgRNA) spacer sequence, with different targets showing substantial variability in editing efficiencies.24,25,26,27,28,29 Therefore, the development of methods to predict or pre-evaluate the editing efficiency for individual sgRNAs can save a large amount of effort, time, and money. Transient expression of CRISPR reagents in plant protoplasts or specific tissues, such as leaves or roots, provides an alternative means to test genome editing efficiency for specific targets before attempting the lengthy process involved in stable genetic transformation.30,31,32 The development of new CRISPR delivery technologies, such as viral- or nanoparticle-based systems,17,33,34,35 also rely on rapid and accurate quantification of CRISPR edits to assess the viability of the method.
In transient CRISPR assays, variable transformation rates and genome editing efficiencies invariably result in the production of a highly heterogeneous population,27,31,36,37 emphasizing the importance of having robust methods to quantify editing efficiency. CRISPR-SpCas9 genome editing in tomato protoplasts produced efficiencies that varied from less than 0.1% to over 30% across 89 sgRNA targets.27 Polyploidy also complicates the accurate detection of CRISPR edits even in fully transformed plants since only a portion of the existing homeologs may be edited in the regenerants, potentially resulting in a highly heterogeneous pool of CRISPR-edited and non-edited alleles.38 Quantification accuracy, thus, becomes important to determine the zygosity of genome edits in stable transformants. In addition, plant genomes also have a high frequency of sequence variations between homeologs and gene copies, in the form of single nucleotide polymorphism (SNPs) or short nucleotide insertion-deletions (InDels), which need to be considered when choosing a quantification technique for CRISPR edits.38 Thus, detection and quantification of CRISPR edits in plants can be challenging, regardless of whether CRISPR components are transiently expressed or stably transformed.
Many molecular techniques have been developed or adapted to detect and quantify CRISPR edits. Some techniques distinguish between edited and non-edited amplicons through fragment separation, such as PCR-restriction fragment length polymorphism (RFLP),39 T7 endonuclease 1 (T7E1)39,40,41,42 or the SURVEYOR assay.16,42 More informative, sequence level analyses such as Sanger sequencing or targeted amplicon sequencing provide comprehensive profiling of CRISPR-mediated mutagenesis.43,44,45,46,47 The available techniques to analyze the outcomes of genome editing experiments have been well reviewed in the literature.19,48,49,50,51 Although many techniques claim high sensitivity and accuracy, very few studies have attempted direct benchmarking and comparison of the available genome editing quantification methods. The few existing reports are mostly focused on animal systems and do not provide an extensive direct comparison of the available methods.29,41,42,52 Despite this, plant genome editing studies are continuously appearing in the literature, using vastly different methods to quantify and analyze CRISPR edits. We provide here, a systematically designed, comparative analysis of techniques used to quantify genome edits produced by CRISPR-SpCas9 in plants. We used transient co-expression of CRISPR components and quantified the frequency of genome edits at 20 sgRNA targets in Nicotiana benthamiana using eight different methods. The accuracy and sensitivity of the different techniques were established using targeted amplicon sequencing (AmpSeq) as a benchmark, since AmpSeq is highly sensitive, accurate and considered the “gold standard”.19,49,50,51,53 Based on the analysis of our results, we discuss the observed differences in sensitivity and accuracy of the quantification methods. We discovered under discussed factors that could affect the accuracy and sensitivity of Sanger sequencing-based quantification methods such as PeakTrace, a base calling software commonly used in sequencing facilities. Finally, we discuss the applicability of the different methods, differences in technical complexity and operational cost and their advantages and disadvantages for plant applications from a researcher’s viewpoint. Our study aims to provide clear guidelines to researchers when selecting the quantification method for plant genome editing applications.
Results and discussion
sgRNA design and transient expression of CRISPR systems in plant leaves
The web-based CRISPOR tool (http://crispor.gi.ucsc.edu/) was used to select 20 targets across six endogenous N. benthamiana genes (Figures 1A and 1B).54 Targets were intentionally chosen for a range of predicted Doench’16 sgRNA efficiency scores,26,55 aiming to obtain diverse frequencies of genome editing (Figure 1E) in order to determine the sensitivity, accuracy, advantages, and disadvantages of the selected quantification methods. Out of the 20 sgRNAs, five targeted both homeologs of the N. benthamiana PHYTOENE DESATURASE (PDS) gene (denoted as AG1 to AG5), three targeted the MYC2 transcription factor (MYC2) gene (denoted BG1 to BG3), three targeted the FLOWERING LOCUS T (FT) gene (denoted CG1 to CG3), four targeted the METHYLTRANSFERASE1 (MET1) gene (denoted DG1 to DG4), four targeted the DEETIOLATED2 (DET2) gene (denoted EG1 to EG4), and one targeted both homeologs of the TRANSLOCASE OF THE INNER MEMBRANE9 (TIM9) gene (denoted FG1). Accession ID for all genes is supplied in Table S8.
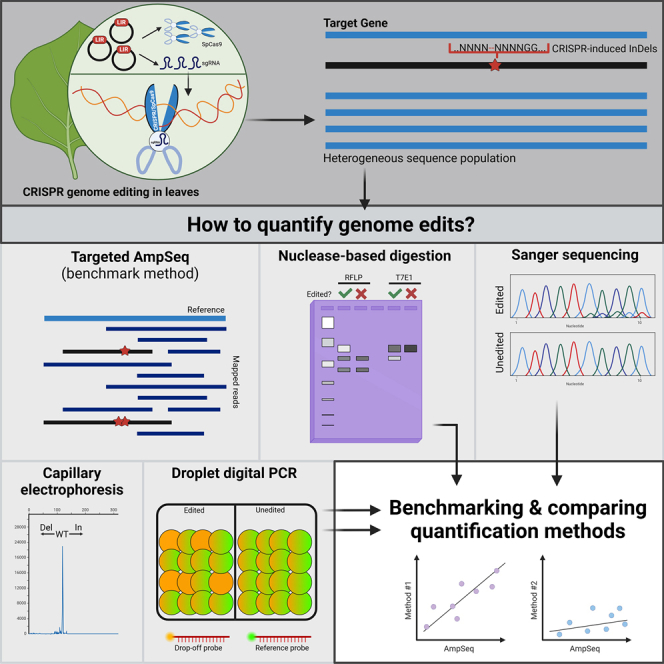
Figure 1.

Workflow for the evaluation of CRISPR genome editing efficiency in Nicotiana benthamiana plants by transient expression (Created with BioRender.com)
(A) Computational design of sgRNAs using the CRISPOR web portal ensured that sgRNAs with a wide range of predicted efficiencies (Doench’2016) were selected.
(B) Bar graph of the Doench’16 scores across the 20 selected sgRNA targets.
(C) Schematic maps of geminiviral replicon (GVR)-based binary vectors for transient expression of the SpCas9 gene and sgRNAs. LIR, geminiviral long intergenic region. SIR, geminiviral short intergenic region. LB, left border. RB, right border.
(D) GVR vectors were transiently expressed in N. benthamiana leaves through agroinfiltration and genomic DNA was extracted for downstream analysis using different methods. ICE, Inference of CRISPR Edits. TIDE, Tracking of Indels by DEcomposition (TIDE). DECODR, Deconvolution of Complex DNA Repair.
(E) The in planta genome editing efficiency of the 20 sgRNA targets was measured using the benchmarking, targeted amplicon sequencing method. The bar graph represents the mean frequency of mutations ±SEM of all biological replicates (N = 3 for CG3 target and N = 4 for all other targets).
Transient expression in Nicotiana benthamiana leaves provides a robust alternative to stable transformation for the rapid expression of CRISPR components in plants. We have previously utilized a modified, dual geminiviral replicon (GVR) system based on the Bean yellow dwarf virus (BeYDV) for transient co-expression of SpCas9 and individual sgRNA targets in leaves.56,57 The system contains two binary vectors for the expression of SpCas9 gene under the control of the Cauliflower mosaic virus 35S promoter (pIZZA-BYR-SpCas9), and different sgRNAs driven by the Arabidopsis U6-26 promoter (pBYR2eFa-U6-sgRNA) (Figure 1C). For each target, N. benthamiana leaves were co-infiltrated with pIZZA-BYR-SpCas9 and the specific pBYR2eFa-U6-sgRNA and genomic DNA extracted from the infiltrated tissue seven days after agroinfiltration of CRISPR edits. For our work, we chose eight different techniques for gene edit analysis and quantification: AmpSeq46,47,49,53,58; PCR-RFLP15,39,59; T7E129,42,60; Sanger sequencing analyzed with three online tools, the Inference of CRISPR Edits (ICE),43 Tracking of Indels by DEcomposition (TIDE),44 and Deconvolution of Complex DNA Repair (DECODR)45; PCR-capillary electrophoresis (PCR-CE)/IDAA,49,52,61,62,63,64 and droplet digital PCR (ddPCR)65,66,67,68 (Figure 1). All 20 sgRNA targets were analyzed with three to four biological replicates each.
Targeted amplicon sequencing as the benchmark for quantifying genome editing
Although it is open to debate, the next-generation sequencing-based AmpSeq is widely considered as the “gold standard” due to its sensitivity, accuracy, and reliability. However, routine and widespread use of AmpSeq is limited by its long turnaround time, need for specialized facilities, and relatively high costs, especially with large sample sizes.49,66 In our case, we reasoned that AmpSeq provides the best available estimate of the true in planta genome editing frequencies and can be used as a benchmark to compare and evaluate the remaining quantification techniques selected for our study.
We used the bioinformatic pipeline CRISPResso246 to analyze the AmpSeq results and determine the frequency and nature of genome edits across all samples. Overall, we generated 485,000 reads with an average of 24,000 reads per target. The mutation frequency using our geminiviral transient expression system ranged from ∼30% for the DG1 and AG1 sgRNAs to < 1% for the BG3 and BG2 sgRNAs (Figure 1E). This range of mutation frequencies is similar to that previously reported in tomato protoplasts27 and variations in gRNA efficiencies are expected and influenced by the spacer and PAM sequence.69
Analysis of the AmpSeq reads across all 20 targets revealed that most mutations were insertion-deletion mutations (InDel) (Figure S1A). The percentage of insertion and deletion mutations was quite balanced (45% and 54.4%, respectively), while only around 0.6% of total reads revealed substitution mutations. This mutation profile is consistent with those previously reported in human70,71 and tomato cells.27 We also found that most InDel mutations were 1 bp, with 91% of all mutations in the range of −10 bp to +10 bp (Figure S1B). These results provided important information to avoid artificial bias when assessing genome editing frequencies using other methods.
Nuclease-based digestion and fragment separation methods show limited accuracy when quantifying genome editing in plants
Nuclease-based methods are popular for detecting sequence variations as they are cheap, fast, and require little technical expertise. These methods often rely on the intrinsic ability of nucleases to recognize and cleave specific DNA sequences, followed by analysis using electrophoresis. We evaluated two commonly used nuclease-based methods for detecting genome edits in plants, PCR-RFLP and T7E1 assays (Figures 2A and 2B).
Figure 2.

Assessment of nuclease-based methods for genome editing quantification in plants
(A) Schematic representation of the PCR-restriction fragment length polymorphism (RFLP) and T7 endonuclease 1 methods (Created with BioRender.com).
(B) Representative photo of an agarose gel (top) or automated electrophoresis (bottom) used for fragment separation in PCR-RFLP (left) and T7E1 (right) analysis.
(C and D) Linear regression analysis of samples analyzed by PCR-RFLP using (C) agarose gel electrophoresis or (D) automated electrophoresis with the TapeStation system. AmpSeq mutation frequencies were used for benchmarking (N = 4 for all targets, 9 sgRNA targets analyzed).
(E and F) Linear regression analysis of samples analyzed by T7E1 using (E) agarose gel electrophoresis or (F) automated electrophoresis with the TapeStation system. AmpSeq mutation frequencies were used for benchmarking (N = 3 for CG3 target and N = 4 for all other targets, 20 sgRNA targets analyzed). R2 values are shown next to regression lines. The symbol in brackets represents the statistical significance of the correlation. ns, no significance. ∗ p ≤ 0.05. ∗∗p ≤ 0.01. ∗∗∗ p ≤ 0.001. ∗∗∗∗ p ≤ 0.0001.
(G and H) Heatmap showing differences in mean absolute percentage error (MAPE) values across all examined sgRNA targets analyzed using (G) PCR-RFLP and (H) T7E1 assays. Fragments were separated with either conventional agarose gel electrophoresis or automated electrophoresis (denoted “A” or “T”, respectively). AmpSeq mutation frequencies were used for benchmarking. MAPE values > 200% are shown in pink with actual values inside. Targets with AmpSeq quantified mutation frequencies of 0% were excluded from the analysis (black boxes). The corresponding bar plots show the mean mutation frequencies ±SEM for all examined sgRNA targets.
One of the critical disadvantages of PCR-RFLP assays quickly became evident during CRISPR target design as it required the presence of a restriction enzyme (RE) recognition site at the Cas9 cut site, thus limiting its application (Figure 2A). Only nine out of 20 selected targets were amenable to PCR-RFLP analysis and contained different RE recognition sites to avoid CRISPR target sequence homogeneity. The appearance of an undigested high molecular weight band in the agarose electrophoresis gel (shown as PCR-RFLP [A]) indicated the presence of mutations in the RE recognition site and digital quantification of the band intensity provided a measure of the mutation frequency when compared to the intensity of the digested (non-mutated) product (Figure 2B). Linear regression and correlation analysis of the mutation frequencies measured using PCR-RFLP (A) assays were performed against the AmpSeq quantified frequencies (Figure 2C). The relationship showed a statistically significant correlation with an R2 = 0.77 and a positive slope close to 1. However, we noticed that the regression line had a y-intercept of 6.4, suggesting that PCR-RFLP (A) overestimated mutation frequencies. We also analyzed the PCR-RFLP reactions using the Agilent TapeStation automated electrophoresis system (shown as PCR-RFLP [T]) as it is expected to be more accurate and sensitive than conventional agarose gel electrophoresis (Figure 2D). Surprisingly, while the correlation was still statistically significant, we observed a decrease in the R2 value with a slope of 0.85 and a slightly reduced y-intercept (y = 5.7). When we plotted all sample data points across the nine targets evaluated with AmpSeq and the two PCR-RFLP analyses, we observed that the mean frequency measured by PCR-RFLP (A) was significantly higher than AmpSeq (Figure S2A). Meanwhile, although the PCR-RFLP (T) values were still higher than AmpSeq, the difference was not statistically significant (Figure S2A).
To evaluate the accuracy of quantification methods, we measured the mean absolute percentage error (MAPE) for each target. The MAPE measures the differences between mutation frequencies obtained using the quantification method of interest relative to the AmpSeq values (used as the benchmark) for the same target. The MAPE of all tested quantification methods across the sgRNA targets were presented as heat maps. We are aware of some potential issues with using MAPE such as when the benchmark values are 0 and have, hence, excluded those targets with AmpSeq quantified mutation frequencies of 0%. In addition, MAPE values cannot exceed 100% when underestimating the benchmark while MAPE can become very large (> 100%) in overestimations. To avoid bias, we excluded any targets with MAPE > 200% from the heatmap but still included them in the figures.
Analysis of the PCR-RFLP (A) results showed that targets with a relatively high frequency of genome edits showed low MAPE values (Figure 2G). However, in targets with moderate mutation frequencies (around 9%–13%), MAPE exceeded 100% due to overestimations. This was even more pronounced when editing efficiency was low (CG1, ∼1%), resulting in a MAPE > 200%. For PCR-RFLP targets analyzed with TapeStation (T), efficient targets also showed low MAPE but a considerable improvement over PCR-RFLP (A) was observed in targets with moderate editing frequencies. However, there was a severe overestimation of genome editing frequency at the inefficient target, CG1. Neither PCR-RFLP method was able to detect genome editing in the target showing almost undetectable levels of mutation using AmpSeq. Overall, PCR-RFLP effectively captured the wide variations in mutation frequencies measured using AmpSeq but showed a systematic overestimation of editing efficiencies which resulted in high MAPE values. It is important to note, however, that our evaluation was limited to only nine targets with RE recognition sites, a major downside to the method’s application.
We chose to use T7E1 to analyze mutations produced at all 20 sgRNA targets over the alternative SURVEYOR method as it was previously shown to be better suited for screening InDel mutations, especially at low frequencies.42,72 T7E1 enzymes cleave DNA heteroduplexes formed from mismatches after re-annealing a mixed pool of amplicons (Figure 2A). In contrast to PCR-RFLP, T7E1 is a more universally applicable assay as it does not have target sequence requirements. However, the relatively high frequency of genomic sequence variations common in allelic plant genes, particularly around sgRNA targets, can result in heteroduplexes when amplicons are denatured and re-annealed. In our experience, these DNA heteroduplexes are recognized and cleaved by T7E1, leading to uninterpretable smearing during fragment separation (data not shown). In our study, this issue was addressed by specifically amplifying each homeolog separately for the PDS and TIM9 genes where both alleles were targeted.
T7E1 reactions were analyzed using either the TapeStation system (T) or GTG agarose (A) which provides better resolution than conventional agarose gels (Figure 2B). Linear regression and correlation analysis showed a statistically significant, positive correlation between T7E1 (A) and AmpSeq with an R2 of 0.61 (Figure 2E). The regression line for T7E1 (A) was slanted with a slope of 0.25, suggesting low sensitivity, consistent with previous reports where T7E1 was unable to capture the range of mutation frequencies observed with AmpSeq.29 Genome edits at inefficient targets were mostly undetectable and showed MAPEs above 100% (Figure 2H). In general, MAPE values decreased with increased genome editing efficiencies, although some individual targets, such as FG1, AG4, and CG3, still showed 100% MAPEs indicating that T7E1 (A) could not accurately quantify the mutations.
T7E1 (T) provided improvements over T7E1 (A) with lower MAPE values across most targets. Many of the undetectable edits with T7E1 (A) were detected with T7E1 (T), as expected with the increased sensitivity provided by the TapeStation system. This is also reflected by slightly increased R2 and linear regression slope values (Figure 2F). However, in targets with < 1% genome editing, T7E1 (T) overestimated the mutation frequency. This led to high MAPEs (150–200%) while T7E1 (A) was unable to detect any edits at all (Figure 2H). This phenomenon was observed for both PCR-RFLP and T7E1 assays when quantifying very low frequency mutations using the TapeStation. Interestingly, for the moderately efficient FG1 target, we noticed that TapeStation hardly improved its MAPE, and the edits detected were very low (Figure 2H). Meanwhile, other targets with similar genome editing efficiencies could be effectively quantified with the use of TapeStation. We hypothesized that the mutation profiles in the FG1 target might not be diverse enough for effective heteroduplex formation. We analyzed the InDel profile of FG1 in comparison to AG2, a target where T7E1 effectively quantified mutation efficiency. We found that the InDel size distribution for both targets was quite similar and dominated by 1 bp insertion mutations, accounting for over 60% of total InDel-containing reads (Figure S3B). However, over 80% of reads with a +1 insertion in FG1 contained a T nucleotide, whereas the +1 insertions in AG2 were more diverse, made up of T and C nucleotides at 30% and 50%, respectively (Figure S3C). We speculate that this lack of diversity in the mutation profile of FG1 may reduce heteroduplex formation and T7E1 cleavage. Genome edits at targets like AG4 and CG3 were almost undetectable without the use of TapeStation, despite having moderate to high AmpSeq mutation frequency (Figure 2H). Indeed, previous research has found that a diverse InDel profile is critical for the detection of genome edits using T7E1 29. Consequently, mutation frequencies may appear underestimated and ineffectively quantified in many targets with low mutation profile diversity. Another factor affecting accuracy is the preference of T7E1 to cleave certain heteroduplex combinations.73 Hence, the performance of T7E1 is highly dependent on the nature of the CRISPR-induced mutations at the target site.
Sanger sequencing has a high detection limit exacerbated by base calling with the PeakTrace software
Sanger sequencing is a commonly used method to detect CRISPR-induced sequence variations, providing sequence, and context information. Manual interpretation of sequencing chromatograms from a heterogeneous pool of amplicons is difficult but computer-based algorithms have been recently developed to interpret sequencing results. Powerful web-based software such as ICE, TIDE, and DECODR have been developed to deconstruct mixed sequencing chromatograms, quantify mutation frequency and provide information on their profiles.43,44,45 Hence, the use of Sanger sequencing has gained popularity in plant genome editing studies to characterize the zygosity of genome edits and/or quantify genome editing efficiency.
We evaluated editing efficiency at the CRISPR targeted regions using Sanger sequencing and three different web-based tools. As stated previously, it is important to note that existing InDel variations between WT alleles can produce superimposed and uninterpretable results when Sanger sequencing traces of homeologs are analyzed together. Therefore, we avoided these regions when designing sequencing primers for the PDS and TIM9 genes. To increase confidence, we also excluded samples with a model fit lower than 0.8, reducing the number of targets to 15 for DECODR and 16 for TIDE, while ICE retained all 20 sgRNA targets. All analysis methods showed a positive, statistically significant correlation with AmpSeq, albeit with moderate R2 values of 0.5301 (ICE), 0.5577 (TIDE), and 0.4324 (DECODR) (Figures 3B–3D and 3F). Surprisingly, many targets showing genome edits with AmpSeq were undetectable using ICE or DECODR (Figures 3B and 3F). In most of these cases, AmpSeq quantified editing efficiency was below 20%. These results are in open contrast with previous reports where ICE results showed a strong correlation with AmpSeq quantified mutation frequencies,43 therefore, we investigated the possible causes for this anomaly.
Figure 3.

Quantification of CRISPR-Cas9-mediated mutations using Sanger sequencing
(A) Sequencing chromatograms processed with PeakTrace (PT+) or unprocessed (PT-) for two representative samples targeting MET1 (top) and DET2 (bottom). The mutation frequency (Mut %) was measured using the Inference of CRISPR Edits (ICE) tool. Linear regression analysis of sequencing traces, with or without PT processing, analyzed using (B and C, respectively) ICE, (D and E, respectively) Tracking of Indels by DEcomposition (TIDE) and (F and G, respectively) Deconvolution of Complex DNA Repair (DECODR) (20, 17, and 16 sgRNA targets were analyzed for ICE, TIDE and DECODR, respectively). R2 values are shown next to all regression lines. The symbol in brackets represents the statistical significance of the correlation. ns, no significance. ∗p ≤ 0.05. ∗∗p ≤ 0.01. ∗∗∗p ≤ 0.001. ∗∗∗∗p ≤ 0.0001.
We discovered that the sequencing chromatograms provided to us by the sequencing facility were not raw data as initially assumed but had been processed using a base calling software developed by Nucleics, named PeakTrace (PT). PT is a post-sequencing data processor often used by sequencing facilities to improve the quality of traces. We hypothesized that PT interfered with the presence of superimposed peaks caused by InDel mutations at the CRISPR target site. To test our hypothesis, we compared sequencing chromatograms processed with only the default KBcaller base caller used by ABI sequencers and the same traces further processed with PT. We observed that in chromatograms unprocessed by PT, the number and intensity of double peaks greatly increased (Figure 3A). Accordingly, re-evaluation of representative samples that initially showed no editing when analyzed with ICE, showed up to 9% mutation rates upon analysis of the non-PT chromatograms (Figure 3A). Overall, there was an improvement in the R2 values of linear regression analyses between ICE/DECODR (on non-PT traces) and AmpSeq (Figures 3C and G). The effect of PT processing was most severe at low mutation frequencies and was not observed in TIDE (Figure 3D), although the TIDE R2 improved in the absence of PT processing (Figure 3E).
To further evaluate the accuracy of these tools, we constructed MAPE heat maps (using AmpSeq as reference) for all three methods (Figure 4). Large MAPE values (∼100%) were observed in the ICE results for all targets with AmpSeq frequencies below 5% (BG1 to DG4) as ICE was unable to detect the genome edits, irrespective of PT processing (Figure 4A). At higher editing efficiencies (CG3 to AG2), ICE (PT+) showed MAPE values in the range of 50–100% for most targets. The absence of PT processing improved accuracy in most targets with editing efficiencies above 5%, including those with relatively high editing efficiency (> 20%). DECODR showed a similar trend with PT-unprocessed data showing increased accuracy in targets with mutation frequencies above 5% (Figure 4C).
Figure 4.

Assessment of Sanger sequencing methods for genome editing quantification in plants
(A–C) Heatmap showing differences in MAPE values across all examined sgRNA targets analyzed using (A) ICE, (B) TIDE and (C) DECODR tools benchmarked to AmpSeq results (20, 16, and 15 sgRNA targets were analyzed using ICE, TIDE and DECODR, respectively). N = 4 for all targets analyzed using ICE except N = 3 for CG3, N = 4 for all targets analyzed using TIDE except N = 3 for DG4 and EG3, and N = 4 for all targets analyzed using DECODR. AmpSeq mutation frequencies were used for benchmarking. MAPE values > 200% are shown in pink with actual values inside. Targets with AmpSeq quantified mutation frequencies of 0% were excluded from the analysis (black boxes). Some sgRNA targets were not included for TIDE and DECODR due to low model fit values (< 0.8) during analysis. The corresponding bar plot shows the mean mutation frequencies ±SEM for all examined sgRNA targets.
TIDE analysis accuracy outperformed ICE and DECODR, with or without PT. At moderate to high AmpSeq quantified genome editing frequencies above 18% (from the EG2 target), MAPE values were mostly below 50% for TIDE (Figure 4B). However, although TIDE detected mutations at low frequencies, it was inaccurate and strongly overestimated the values obtained by AmpSeq. Interestingly, instead of improving accuracy, lack of PT processing had a strong negative effect with MAPE values > 300% in the three targets with mutation frequencies < 2% (DG4 to EG3). The negative effect on accuracy of non-PT processed data in low efficiency targets was also observed in ICE and DECODR but to a lower extent. The absence of PT processing may emphasize the effect of background signal noise in sequencing chromatograms at extremely low editing efficiencies interfering with the analysis of CRISPR edits. Previous studies have reported that Sanger sequencing has a ∼15% mutation detection threshold in diagnostic applications.74,75 The developers of ICE reported a good correlation between HEK293 cell genome editing efficiencies quantified with AmpSeq and Sanger traces analyzed with the three software,43 however, most targets had genome editing efficiencies ≥ 25%. Consistent with these results, we also found that all three tools were quite accurate at a high frequency of genome edits. However, transient expression approaches in plants tend to produce frequencies below 30% as reported here and other work.27,37 Based on our results, Sanger sequencing may be unsuitable for precise quantification of low frequency genome edits in plants, irrespective of the analysis tool.
PCR-CE is a reliable and effective method for genome edit quantification in plants
Capillary electrophoresis of fluorescently labeled PCR amplicons provides enough resolution to distinguish single bp InDels and has been used to detect and quantify genome edits.49,52,76 To reduce the associated cost of synthesizing fluorescent dye labeled PCR primers, previous studies have reported the addition of an overhang/tail sequence to one of the gene-specific primers. This allows users to perform tri-primer PCR amplification with a universal fluorescent-labeled primer that binds to the overhang sequence.52,63,76,77 This method used to produce fluorescently labeled amplicons analyzed with capillary electrophoresis for the detection of genome edits is known as IDAA. PCR-CE/IDAA has been used to measure genome editing efficiency in N. benthamiana78 and potato protoplasts.62
To assess the efficiency and accuracy of PCR-CE/IDAA quantification of CRISPR edits in plants, we designed a FAM-labeled universal primer for tri-primer PCR amplification of a 200–500 bp region around each sgRNA target. Allelic sequence variations, a reasonably common occurrence in plants and especially in polyploid species, can interfere with the interpretation of PCR-CE/IDAA results. Thus, we carefully positioned primers to avoid regions with InDel variations for sgRNAs that target both alleles of the PDS and TIM9 genes. Fluorescent-labeled amplicons were separated using capillary electrophoresis and the presence and abundance of edited vs. non-edited WT fragments (based on amplicon size) were analyzed using the Peak Scanner software.52 We surveyed a ±10 bp range from the non-edited WT fragment, which encompasses over 90% of all mutations detected by AmpSeq in the 20 sgRNA targets (Figure S1B). As an initial step, we investigated PCR-CE/IDAA’s capacity to accurately identify the InDel profiles generated by CRISPR. We extracted mutant AmpSeq reads and compared the InDel profiles with those obtained through PCR-CE/IDAA analysis for individual samples of the most efficient sgRNA, DG1 (Figure S5). PCR-CE/IDAA successfully detected the most frequent 1 bp insertion mutation but results for less frequent mutations did not match those observed by AmpSeq (Figure S5). Likewise, when a more diverse InDel profile was analyzed, we observed that PCR-CE/IDAA effectively identified the three most frequent InDel types but results for less frequent types, were inconsistent with AmpSeq results (Figure S6).
Linear regression and correlation analysis of mutation frequencies quantified by PCR-CE/IDAA and AmpSeq showed a statistically significant correlation and a high R2 (∼0.8) (Figure 5A). Importantly, unlike Sanger sequencing and nuclease-based methods, linear regression analysis of targets with low editing efficiency (< 10%) still showed a moderate R2 value of approximately 0.5 with a statistically significant, positive correlation (Figure 5B). Therefore, these results suggest that PCR-CE/IDAA performs reasonably well even at low genome editing frequencies.
Figure 5.

Assessment of PCR-Capillary electrophoresis-based methods for genome editing quantification in plants
(A) Linear regression analysis of mutation frequencies measured using PCR-CE/IDAA compared to AmpSeq (N = 4 for all targets except N = 3 for CG3, 20 sgRNA targets were analyzed). R2 values are shown next to all regression lines. The symbol in brackets represents the statistical significance of the correlation. ns, no significance. ∗p ≤ 0.05. ∗∗p ≤ 0.01. ∗∗∗p ≤ 0.001. ∗∗∗∗p ≤ 0.0001.
(B) Expanded graph details of (A) for samples with an AmpSeq quantified mutation frequency <10%.
(C) Heatmap showing differences in MAPE values across all examined sgRNA targets analyzed using PCR-CE/IDAA and benchmarked to AmpSeq (N = 4 for all targets except N = 3 for CG3, 20 sgRNA targets were analyzed). MAPE values > 200% are shown in pink with actual values inside. Targets with AmpSeq quantified mutation frequencies of 0% were excluded from the analysis (black boxes). The corresponding bar plot shows the mean mutation frequencies ±SEM for all examined sgRNA targets.
MAPE values for PCR-CE/IDAA ranged between 7% and 90%, with the highest errors in the two targets with very low genome editing frequencies of ∼1% (Figure 5C). Overall, PCR-CE/IDAA provided accurate results when benchmarked with AmpSeq, particularly at moderate or high frequencies. However, it still showed relatively low accuracy at inefficient targets. Although not statistically significant, the average genome editing frequency across all targets measured by PCR-CE/IDAA was lower than AmpSeq (Figure S7A). In samples with moderate/low editing efficiency, the +1 and −1 bp peaks often merged with the intense unmodified WT peak, affecting the identification and quantification of these InDels (data not shown). In addition, we observed that in some instances the negative control contained ±1 bp peaks that needed to be considered for normalization purposes and could potentially affect accuracy in low efficiency targets. Previous literature has attributed this phenomenon to the tendency for certain DNA polymerases to add an extra Adenine nucleotide at the 3′ end of the amplification product,76 however, we used the high-fidelity Q5 DNA polymerase in our work and still encountered this issue. Increasing extension times, the addition of DMSO and the use of the ProfileIT IDAA analysis software have been suggested to resolve the problem,76 although in our hands, normalization with a negative control seems to produce adequate results. Nonetheless, PCR-CE/IDAA showed exceptional capacity to quantify plant genome editing and future implementations could also explore fragment separation of PCR-RFLP or T7E1 reactions using capillary electrophoresis.79 Adding extra nucleotides to primers could also compensate issues with quantifying genome edits from allelic genes with high occurrence of InDel variations.
Droplet digital PCR provides highly accurate quantification of plant genome editing efficiency
DdPCR is a recently developed technology using water-oil emulsion droplets to partition DNA molecules and simultaneously perform thousands of individual PCR amplifications. DdPCR was first adopted to detect and quantify TALEN-mediated genome editing in mammalian cell cultures66,67,80 and was later used for CRISPR genome editing applications in plants.65,68 ddPCR relies on a probe drop-off assay for absolute quantification of genome-edited amplicons66 (Figures 6A and 6B). We designed drop-off (P1) probes binding to the target sequence and reference (P2) probes binding non-targeted regions for each of the 20 sgRNA targets, avoiding any SNPs or sequence variations between alleles of PDS and TIM9. Next, we quantified the frequency of genome-edited droplets across all positive droplets (i.e., droplets showing amplification) for each sample and target using ddPCR (Figure 6B). Four targets that showed low positive droplet count were excluded from the analysis. Benchmarking of ddPCR with AmpSeq through linear regression and correlation analysis showed a statistically significant correlation and a high R2 (0.77) (Figure 6C). To assess the proficiency of ddPCR for low mutation frequencies, we re-analyzed the results using samples with AmpSeq frequencies < 10% (Figure 6D). Our results showed that ddPCR retained a moderate R2 of ∼0.6 with a statistically significant correlation. These results indicate that ddPCR is quite capable of quantifying mutation frequencies in high, moderate, and low efficiency scenarios.
Figure 6.

Assessment of the droplet digital PCR (ddPCR) method for genome editing quantification in plants
(A) Schematic workflow of quantifying genome edits using ddPCR (Created with BioRender.com). DdPCR mixes containing the template DNA, PCR primers, a drop-off probe and a reference probe are used for droplet generation and PCR amplification. A droplet reader is then used to identify droplets containing either edited or non-edited amplicons.
(B) 2D Amplitude plot of a representative, edited sample and non-edited control generated using the BioRad Quantasoft Analysis software. The orange data points represent droplets with non-edited amplicons and are hence hybridizing to the reference (HEX, green signal) and drop-off probes (FAM, blue signal). The green data points represent droplets that contain edited amplicons where mutations at the sgRNA target site prevent the binding of the drop-off probe (FAM) and hence hybridize only to the HEX (reference) probe.
(C) Linear regression analysis of mutation frequencies measured using ddPCR compared to AmpSeq (N = 4 for all targets, 16 sgRNA targets analyzed). R2 values are shown next to all regression lines. The symbol in brackets represents the statistical significance of the correlation. ns, no significance. ∗ p ≤ 0.05. ∗∗p ≤ 0.01. ∗∗∗p ≤ 0.001. ∗∗∗∗p ≤ 0.0001.
(D) Expanded graph details of (A) for samples with an AmpSeq quantified mutation frequency < 10%.
(E) Heatmap showing differences in MAPE values across all examined sgRNA targets analyzed using ddPCR and benchmarked with AmpSeq across all 16 examined sgRNA targets (N = 4 for all sgRNA targets). MAPE values > 200% are shown in pink with actual values inside. Targets with AmpSeq quantified mutation frequencies of 0% were excluded from the analysis (black boxes). The corresponding bar plot represents the mean mutation frequencies ±SEM for all examined sgRNA targets.
DdPCR showed low MAPE values under 50% for 10 out of 16 analyzed targets with accurate quantification in targets with AmpSeq quantified frequencies ranging from 8% to 20% (AG2 to CG2) (Figure 6E). Importantly, ddPCR maintained moderate MAPE values even for mutation frequencies below 5%, with the exception of the EG3 target, where MAPE reached slightly over 100% due to overestimation. Finally, the average mutation frequencies quantified by ddPCR and AmpSeq were almost identical indicating that ddPCR is an accurate and sensitive method for quantification of genome edits in plants (Figure S7B). Optimization of template DNA concentrations, probe binding sites and ddPCR droplet sizes81 could further improve its sensitivity in quantifying low frequency genome edits.
Comparative analysis of CRISPR editing quantification methods
The methods evaluated here showed vast differences in their capacity to quantify CRISPR edits when benchmarked to AmpSeq. Hence, to compare them we considered several core criteria: (1) accuracy, (2) sensitivity, (3) cost, (4) information content, and (5) technical efficiency/complexity.
In addition to the MAPE, which measures the error of each method relative to AmpSeq, we calculated the mean absolute error (MAE) across all assessed sgRNA targets (Figure 7A). DECODR (PT+), PCR-RFLP (A and T) and T7E1 (A) showed the highest MAE values while ddPCR, PCR-CE/IDAA and TIDE (PT-) showed the lowest median MAE of 2.64, 3.03, and 4.28, respectively. Furthermore, ddPCR, PCR-CE/IDAA and PCR-RFLP (A) showed the highest R2 values among all methods, although the median MAE and overall MAPE for PCR-RFLP (A) were comparatively high. Unlike Sanger sequencing-based methods, PCR-CE/IDAA and ddPCR were able to detect genome edits at low (< 10%) editing efficiencies (Figures 5B and 6D). A core advantage of Sanger sequencing, however, is that it provides sequence information and mutation profile. Conversely, PCR-CE/IDAA is only capable of providing InDel profiles while ddPCR only measures the number of mutant droplets without any additional information.
Figure 7.

Comparative analysis of the genome editing efficiency quantification methods
(A) Mean absolute error (MAE) between each method and AmpSeq. Each data point represents the MAE for a sgRNA target. The lines represent the upper quartile, median and lower quartile (left to right, respectively).
(B) Bar graph showing the R2 value of linear regression analyses between each evaluated method and AmpSeq.
(C) Analysis cost per sample. For some methods, cost was calculated as a range due to variability between reagents or service providers. The costs are estimates calculated in Australian Dollars (AUD). Some minor costs such as the cost of primers were excluded.
Cost and efficiency are also important factors to consider when choosing a quantification method. We attempted to evaluate the estimated cost per sample of all methods tested in this study (Figure 7B). For simplicity, we only included major cost factors such as service costs and consumables from locally accessible suppliers with some costs shown as a range due to variability between providers. AmpSeq was the most expensive with costs between around $30 to $100 AUD but can be reduced proportionally by multiplexing samples. However, such approaches also decrease sequencing depth which may affect the accuracy and sensitivity of AmpSeq quantification. Nuclease-based methods are much cheaper, costing under $5 when using regular agarose gel electrophoresis. Fragment separation of PCR-RFLP or T7E1 using automated electrophoresis (T) brings the cost to ∼$10 per sample. The cost of PCR-CE/IDAA was comparable to that of nuclease-based methods, costing ∼$6 per run. Sanger sequencing and ddPCR were the most expensive of the non-AmpSeq methods with a cost of $11-$12 per sample. In our hands, PCR-CE/IDAA and Sanger sequencing were easiest to set up and required minimal optimization but the processing time is dependent on the service provider. PCR-RFLP and T7E1 require moderate expertise and some optimization but can be adopted in conventional research laboratories without specialized equipment. Meanwhile, ddPCR requires a large amount of technical expertise, being the most complicated and required multiple dedicated equipment if not outsourced.
Overall, based on the criteria specified previously, the best performing method to quantify genome edits for in planta transient CRISPR expression assays is PCR-CE/IDAA. PCR-CE/IDAA reliably quantified mutation frequency in the allotetraploid N. benthamiana and provided InDel size information. Technically, the analysis of fluorescently labeled PCR products by capillary electrophoresis can be performed by any provider of Sanger sequencing without modification of the usual sequencing workflow. However, it is important to note that PCR-CE/IDAA accuracy is quite limited for low InDel frequency. PCR-CE/IDAA can also determine the zygosity of genome edits in complex, high ploidy plants when designed properly. Sanger sequencing is very useful for providing sequence and contextual information, but the three analysis tools assessed here performed rather poorly when quantifying low mutation levels. Processing of Sanger sequencing with the PT base caller negatively affected the analysis and interpretation of sequencing traces for CRISPR edits and we discourage its use for this application. Although the absence of PT processing increased the accuracy for high efficiency targets, it had the opposite effect on inefficient targets, especially with TIDE. Overall, we do not recommend the use of Sanger sequencing in transient expression-based approaches as the mutation levels in these experiments are usually below the acceptable accuracy threshold for this method. In contrast, Sanger sequencing is very practical to characterize heterozygous, homozygous or bi-allelic mutations in transgenic genome edited plants. Further work is necessary to confirm the accuracy of the mutation profiles, especially complex ones, determined by the three analysis tools.
DdPCR proved to be accurate, sensitive, and reliable but at the same time, costly, laborious, and difficult to master. Unlike some of the methods assessed in this work, ddPCR did not provide mutation information and required highly specialized equipment, reducing its accessibility. Despite this, we do believe that previous reports of plant genome editing efficiency quantified using ddPCR are accurate and likely repeatable. Due to its high sensitivity, ddPCR may also be very useful for detecting genome edits in trace amounts of genetic material and for regulatory purposes.82 However, we do not recommend ddPCR as a routine, standardized method for the detection and quantification of genome editing efficiency in plants unless the technical expertise and equipment are available to the researchers.
Based on our analysis, we do not recommend the use of nuclease-based methods to obtain accurate editing efficiency information, although they can be useful as an initial, rapid detection of genome editing before further downstream analysis. PCR-RFLP can detect a large range of mutation frequencies, as suggested by a high R2, but our results show that it tends to overestimate. PCR-RFLP is also restricted by the need to have a RE recognition site in the target sequence. T7E1 is not sensitive and unable to accurately quantify low or moderate frequencies of genome edits. T7E1 also tends to underestimate mutation values and produces variable results depending on the mutation profiles.
Limitations of the study
In this study, we compared eight different methods used to quantify genome editing efficiency in plants. Rather than relying on in vitro spiking to produce a wide frequency of mutations for method evaluation, we opted to use multiple sgRNA targets for transient in planta genome editing. Our approach was intended to produce a large assortment of mutation frequencies as well as wide-ranging mutation profiles. However, all of our genome editing was conducted in the model N. benthamiana plant and have not tested whether these conclusions are reflected in other plants, particularly ones with more complex genomes and higher ploidy.
To provide a benchmark, we used the NGS-based AmpSeq and considered AmpSeq-quantified frequencies as the “true” frequency to systematically evaluate all other methods. Thus, our analysis provides an assessment of the performance relative to AmpSeq. However, it is important to state that AmpSeq has its own biases and inaccuracies.29,83 Although this approach has its disadvantages, we believe that AmpSeq is the most reasonable benchmark for in planta genome editing efficiency, as do others.43
Although we selected what we consider the most popular methods, there are a number of additional quantification techniques such as quantitative PCR,84,85 in vitro CRISPR-Cas ribonucleoprotein digestion,38,86 annealing at critical temperature PCR,87 high resolution melting analysis,88 SURVEYOR nuclease assay,16 single stranded conformational polymorphism,89 qEva-CRISPR,90 among others which were not evaluated due to cost and time constraints. For the methods assessed in this work, we only evaluated their capacity to accurately quantify genome edits at relatively low mutation frequencies; therefore our results do not necessarily reflect the performance of these methods at higher genome editing efficiencies.
Resource availability
Lead contact
Further information and requests for resources and reagents should be directed to and will be fulfilled by the lead contact, José Ramón Botella (j.botella@uq.edu.au).
Materials availability
The sequence of plasmids generated in this study is reported in the supplemental information and are available from the lead contact upon requests.
Data and code availability
-
•
The genome editing efficiencies quantified using the different methods are all reported in the Supplemental Data.
-
•
The raw AmpSeq reads have been deposited in Zenodo: https://doi.org/10.5281/zenodo.15043050.
-
•
The raw AmpSeq reads have also been deposited in The University of Queensland UQ eSpace: https://doi.org/10.48610/a32ca0d.
-
•
Any additional information required to reanalyze the data reported in this paper is available from the lead contact upon request.
Acknowledgments
The authors would like to acknowledge The University of Queensland Research Infrastructure for funding this work in the form of a Genome Innovation Hub Collaborative Project. The authors would like to acknowledge members of Genome Innovation Hub for their support, particularly Stacey Anderson for managing the project and Rafael Tubelleza for providing advice with statistical analysis. We also thank Dr. Karen Massel for insightful discussions, Heather Noble for providing suggestions on the manuscript, and Zhiwei Ye for maintenance of plant materials and technical support. In addition, we acknowledge Prof. Peter Waterhouse for kindly gifting the LAB wild type N. benthamiana seeds. Finally, we are grateful to all members of the Plant Genetic Engineering Laboratory for the helpful discussions and troubleshooting.
Author contributions
Conceptualization, Z.G., Y.Z., P.A.C., and J.R.B.; methodology, Z.G., D.X., P.A.C. and J.R.B.; project administration, D.X. and S.Y.; investigation, Z.G., Y.Z., D.X., and S.Y.; formal analysis, Z.G., P.A.C., and J.R.B.; writing—original draft, Z.G.; writing—review & editing, P.A.C. and J.R.B.; supervision, P.A.C. and J.R.B.
Declaration of interests
The authors declare no competing interests.
STAR★Methods
Key resources table
| REAGENT or RESOURCE | SOURCE | IDENTIFIER |
|---|---|---|
| Bacterial and virus strains | ||
| DH5α Escherichia coli strain | In-house | N/A |
| GV3101 Agrobacterium tumefaciens strain | In-house | N/A |
| Chemicals, peptides, and recombinant proteins | ||
| Q5 High Fidelity DNA Polymerase | New England Biolabs | M0491S |
| Q5 High Fidelity PCR Master Mix | New England Biolabs | M0492S |
| GoTaq Green PCR Master Mix | Promega | M7122 |
| Rapid ligation buffer | Promega | C6711 |
| T4 DNA ligase | Promega | M1801 |
| T7 Endonuclease 1 | New England Biolabs | M0302S |
| Exonuclease 1 | New England Biolabs | M0568S |
| Shrimp Alkaline Phosphatase | New England Biolabs | M0371S |
| Droplet generation oil for probe | BioRad | 1863005 |
| ddPCR droplet reader oil | BioRad | 1863004 |
| BsaI-HFv2 | New England Biolabs | R3733S |
| NcoI-HF | New England Biolabs | R3193S |
| BcoDI | New England Biolabs | R0542S |
| BsrDI | New England Biolabs | R0574S |
| BglII | New England Biolabs | R0144S |
| MfeI-HF | New England Biolabs | R3589S |
| RsaI | New England Biolabs | R0167S |
| BsrDI | New England Biolabs | R0574S |
| HpaI | New England Biolabs | R0105S |
| BstNI | New England Biolabs | R0168S |
| NuSieve GTG™ agarose | Lonza Bioscience | 50084 |
| Critical commercial assays | ||
| QX200 ddPCR Supermix for probe (no dUTP) | BioRad | 1863023 |
| High Sensitivity D1000 ScreenTape | Agilent | 5067-5584 |
| Deposited data | ||
| Raw targeted amplicon sequencing | This paper | https://doi.org/10.5281/zenodo.15043050 |
| Experimental models: Organisms/strains | ||
| LAB wildtype Nicotiana benthamiana plants | In-house | N/A |
| Oligonucleotides | ||
| PCR primers and their sequences are reported in the Tables S4–S7. | Sigma-Aldrich or Integrated DNA Technologies (This paper) | N/A |
| sgRNA spacer oligonucleotides and their sequences are reported in the Tables S1 and S2 | Sigma-Aldrich or Integrated DNA Technologies (This paper) | N/A |
| FAM-labelled PCR primer with sequence reported in Table S6 | Sigma-Aldrich (This paper) | N/A |
| Custom FAM or HEX labelled probes with sequences reported in Table S7 | Integrated DNA Technologies (This paper) | N/A |
| Recombinant DNA | ||
| pIZZA-BYR-SpCas9 | Gong et al.56 | N/A |
| pBYR2eFa-U6-sgRNA | Gong et al.56 | N/A |
| Software and algorithms | ||
| CRISPResso2 | Clement et al.46 | http://crispresso2.pinellolab.org/ |
| CRISPOR | Concordet and Haeussler.54 | https://crispor.gi.ucsc.edu/ |
| GraphPad Prism 9.3.1 | GraphPad | https://www.graphpad.com/ |
| SnapGene | Dotmatics | https://www.snapgene.com/ |
| ImageLab | BioRad | https://www.bio-rad.com/en-au/product/image-lab-software?ID=KRE6P5E8Z |
| Inference of CRISPR Edits (ICE) | Conant et al.43 | https://ice.editco.bio/#/ |
| Tracking of Indels by DEcomposition | Brinkman et al.44 | https://tide.nki.nl/ |
| Deconvolution of Complex DNA Repair (DECODR) | Bloh et al.45 | https://decodr.org/ |
| PeakScanner | Thermo Fisher | https://www.thermofisher.com/order/catalog/product/4381867 |
| BioRad QuantaSoft Analysis | BioRad | https://www.bio-rad.com/ |
| Other | ||
| Accessions for target genes are reported in the Table S8 | Sol Genomics Network | https://solgenomics.net/ |
Experimental model and study participant details
Plant materials
In this study, genome editing was performed in LAB WT Nicotiana benthamiana plants that was germinated and maintained on UQ23 soil supplemented with 6 g/L osmocote (UQ Plant Growth). Germinated seedlings were grown at 26°C under a 12/12-hour day/night cycle. Roughly 4 – 5 week old plants were used for agroinfiltration.
Method details
Target design and plasmid construction
CRISPR/SpCas9 sgRNAs targeting the N. benthamiana PDS, MYC2, FT, MET1, DET2 and TIM9 genes (gene A, B, C, D, E and F, respectively) were designed using the CRISPOR web server (http://crispor.gi.ucsc.edu/), based on the Doench’2016 predicted on-target score.26,55 For PDS, we specifically picked ones that targeted both PDS-A and PDS-B homeoalleles. For the FG1 sgRNA, the spacer targets both TIM9 alleles but uses the canonical 5′-NGG-3′ Cas9 PAM at TIM9-A and the most efficient non-canonical 5’-NAG-3’ PAM at TIM9-B.
Two deconstructed geminiviral replicon-based binary vectors were utilized for the transient expression of CRISPR components, as described previously.56 Briefly, we modified the original pBYR2eFa vector57 for the cloning and expression of sgRNAs, under the control of an Arabidopsis U6-26 promoter, which we named pBYR2eFa-U6-sgRNA. The target spacer sequences were synthesized as complementary oligonucleotides (Sigma Aldrich), annealed in a 1:1 mix of annealing buffer (10 mM Tris at pH 7.5 - 8, 50 mM NaCl, 1 mM EDTA) and water, and ligated into BsaI (New England Biolabs) digested pBYR2eFa-U6-sgRNA. The second vector, pIZZA-BYR-SpCas9, was constructed for the expression of human codon-optimized SpCas9 gene under the 35S promoter. It is noteworthy that we excluded the essential geminiviral C1/C2 gene from the latter GVR vector for greater cargo capacity and is supplied instead through pBYR2eFa-U6-sgRNA when co-agroinfiltrated. All cloned vectors were verified using colony PCR and Sanger sequencing (Australian Genome Research Facility).
Transient expression through agroinfiltration and genomic DNA extraction
Agroinfiltration was conducted using the GV3101 Agrobacterium tumefaciens strain. For agroinfiltration, the pIZZA-BYR-SpCas9 vector was mixed with each of the 20 designed spacers cloned into pBYR2eFa-U6-sgRNA to a final OD600 of 0.1 for each vector. Leaf discs were collected at 7 days post infiltration from the agroinfiltrated region. Genomic DNA was extracted through Edward’s DNA extraction method.91 This was used directly for PCR amplification.
PCR amplification and targeted amplicon sequencing
In this study, all PCR amplification were conducted with the Q5 High Fidelity PCR Master Mix (New England Biolabs), following the manufacturer’s instructions.
To quantify CRISPR edits using targeted amplicon sequencing, we PCR amplified a 250 to 300 bp region around the target with Nextera sequence-tagged, gene-specific primers. We either mixed 10 μl of two different amplicons together or mixed a single amplicon with 10 μl of water to a total volume of 20 μl. The mixture was sent to the Australian Genome Research Facility for Illumina MiSeq 150 bp pair-end amplicon sequencing. Amplicon sequencing reads were mapped to the reference sequence, and genome edited reads were quantified using CRISPResso2 (http://crispresso2.pinellolab.org/)46 excluding ones with an average quality of Phred33 scale <20 and single base pair quality <10. To improve accuracy in mutation calling, we used a strict quantification window of 1 bp from the 17th nucleotide (Centre of quantification window set as -3 bp) of the gRNA spacer. Samples with less than 1,000 reads were also excluded from the analysis. Genome edited samples were normalized against the negative control where leaves were agroinfiltrated with pIZZA-BYR-SpCas9 only.
Restriction fragment length polymorphism (RFLP) assay
Nine of the 20 targets contained a restriction enzyme (RE) recognition sequence at the SpCas9 cut site and were suitable for PCR-RFLP analysis. The region around these targets was PCR amplified, and half of the reaction was mixed directly with the corresponding RE (New England Biolabs) and digestion buffer according to the supplier’s instructions. The reaction was incubated at the RE’s optimal digestion temperature for 2 to 3 hours. 8 μl (in a 10 μl reaction) of the digested PCR products were electrophoresed and visualized on a 2% agarose gel. The remaining PCR-RFLP reactions were diluted 20 times and analyzed using the Agilent TapeStation system with High Sensitivity D1000 ScreenTape (Agilent). The mutation frequency was calculated as the band volume of the undigested band as quantified by ImageLab software (BioRad) for agarose gel or the calibrated concentration for TapeStation, divided by the total band volume of the digested and undigested bands.
T7 endonuclease I (T7E1) assay
All 20 targets were PCR amplified to evaluate CRISPR editing using the T7E1 enzyme. Allele-specific primers were designed for PDS and TIM9 targets by placing the 3′ end of the forward primers at single nucleotide polymorphisms (SNPs) to PCR amplify individual alleles. The entire PCR reaction was mixed with 1x NEBuffer 2 (New England Biolabs) and heated to 95 degrees for 5 minutes and heteroduplex was formed through cooling at 2 degrees per second to 85 degrees and then 0.1 degrees per second to 25 degrees. 2 units of T7 Endonuclease 1 enzyme (New England Biolabs) was added to each reaction and incubated at 37 degrees for exactly 1 hour. Two thirds (10 μl) of the treated samples were visualized on a 2%, 3:1 mix of conventional agarose to NuSieve GTG™ agarose gel (Lonza Bioscience). The T7E1 treated samples were also diluted 20 times and, likewise, electrophoresed on the Agilent Tapestation automated electrophoresis system with High Sensitivity ScreenTape (Agilent). Mutation frequency was calculated based on band volume as quantified using ImageLab (BioRad) for agarose gel or the calibrated concentration for TapeStation. The frequency of mutation was calculated as follows:
Sanger sequencing and identification of CRISPR edits using ICE, TIDE and DECODR
To detect and quantify CRISPR edits using Sanger sequencing. The target region of the sgRNAs was PCR amplified and was treated with Exonuclease I (New England Biolabs) and Shrimp Alkaline Phosphatase (New England Biolabs), according to the manufacturer’s instructions except that we incubated reactions at 37 degrees for 30 minutes, and then at 80 degrees for 20 minutes. The treated samples were sent for directional Sanger sequencing (Australian Genome Research Facility). We then analyzed sequencing traces using Synthego’s Inference of CRISPR Edits (https://www.synthego.com/products/bioinformatics/crispr-analysis), TIDE or TIDE Batch (https://tide.nki.nl/) and DECODR (https://decodr.org/). Sanger sequencing from samples agroinfiltrated with only pIZZA-BYR-SpCas9 was used as the negative control. Targets that had an R2 < 0.8 were excluded from the analysis. The default output for Sanger sequencing at the Australian Genome Research Facility is treated with the PeakTrace™ software. Sequencing chromatograms that were untreated, and outputted from the default KBcaller software were referred to as non-PT or PT-.
Digital droplet PCR (ddPCR) for quantifying CRISPR edits
To utilize droplet digital PCR (ddPCR) for quantifying the frequency of edited amplicons, a probe drop-off assay was designed as reported in previous studies.66,68 The FAM probe (Integrated DNA Technologies) was complementary to the sgRNA target and designed as the drop-off probe. Another HEX probe (Integrated DNA Technologies) was used as the reference probe which was positioned away from the editing site. Two conventional PCR primers were designed to amplify roughly 100 – 300 bp region around the sgRNA target. It is important to note that sequence variations between alleles were avoided and all ddPCR primers and probes matched all alleles of the PDS and TIM9 genes. ddPCR was conducted according to the manufacturer’s instructions, using the BioRad ddPCR Supermix for Probes and the BioRad QX200 AutoDG for droplet generation. After droplet generation, the reaction was subjected to PCR amplification using three-step thermocycling (refer to detailed protocol). The droplets were analyzed using the Bio-Rad QX200 droplet reader for FAM/HEX probes. We included two technical replicates per sample, alongside two technical replicates of a leaf infiltrated with pIZZA-BYR-SpCas9 only as the negative control as well as a non-template control. Only samples with around 15,000 droplets or more were included for analysis. The threshold for FAM and HEX probes was set based on the negative control.66 The mutation frequency is calculated as the number of droplets with a positive HEX signal divided by the total number of droplets with either a positive HEX signal or positive for both HEX and FAM signals. Droplets with only the FAM signal were excluded. The mutation frequency was averaged between the technical replicates and normalized by subtracting the negative control.
PCR-capillary electrophoresis for detecting InDel mutations
The tri-primer PCR system allows for the fluorescent dye-labelled primer to be used across multiple target genes.76 We designed a 6-FAM labelled universal overhang primer (Sigma Aldrich). We PCR amplified a region around the 20 targets using the previously described tri-primer PCR system. The PCR product was diluted 20 times and capillary electrophoresed (Genetic Research Services, UQ) with the ABI3730 analyzer (Applied Biosystems), using LIZ500 size standard (Applied Biosystems). The results were analyzed using Peak Scanner™ (Thermo Fisher). Mutation frequency was calculated as the height of mutant peaks divided by the sum of total peak height. Peaks that were -10 to +10 bp from the WT peaks were included for analysis. All calculated mutation frequencies were then normalized by subtracting the frequency from that of the negative control.
Quantification and statistical analysis
All statistical analyses were conducted in GraphPad Prism 9.3.1. Simple linear regression analysis was conducted between the measured mutation frequency using the method-of-interest and AmpSeq for each sample across all targets (N). Correlation analysis was conducted to determine whether the relationships were of statistical significance (p value ≤ 0.05). Student’s t test was conducted to determine if differences in the mean of the method-of-interest and AmpSeq were of statistical significance (p value ≤ 0.05). In these analyses, each data point represents the average genome editing efficiency of biological replicates for a particular sgRNA target. The absolute percentage error was calculated as the absolute difference between the mutation frequency from the method of interest and that obtained from targeted amplicon sequencing (AmpSeq), divided by AmpSeq and then multiplied by 100%. The mean was calculated between biological replicates of a target to obtain the mean absolute percentage error (MAPE). The mean absolute error (MAE) was calculated as the sum of the absolute error between the mutation frequency from the method of interest and that obtained from AmpSeq across biological replicates for each target, divided by the number of samples. Statistical details can be found in the figure legends and any dispersion measures reported were in the form of the standard error of the mean (SEM).
Published: April 29, 2025
Footnotes
Supplemental information can be found online at https://doi.org/10.1016/j.isci.2025.112350.
Contributor Information
Peter Alexander Crisp, Email: p.crisp@uq.edu.au.
José Ramón Botella, Email: j.botella@uq.edu.au.
Supplemental information
References
- 1.Molla K.A., Sretenovic S., Bansal K.C., Qi Y. Precise plant genome editing using base editors and prime editors. Nat. Plants. 2021;7:1166–1187. doi: 10.1038/s41477-021-00991-1. [DOI] [PubMed] [Google Scholar]
- 2.Gaudelli N.M., Komor A.C., Rees H.A., Packer M.S., Badran A.H., Bryson D.I., Liu D.R. Programmable base editing of A T to G C in genomic DNA without DNA cleavage. Nature. 2017;551:464–471. doi: 10.1038/nature24644. [DOI] [PMC free article] [PubMed] [Google Scholar]
- 3.Zong Y., Song Q., Li C., Jin S., Zhang D., Wang Y., Qiu J.-L., Gao C. Efficient C-to-T base editing in plants using a fusion of nCas9 and human APOBEC3A. Nat. Biotechnol. 2018;36:950–953. doi: 10.1038/nbt.4261. [DOI] [PubMed] [Google Scholar]
- 4.Anzalone A.V., Randolph P.B., Davis J.R., Sousa A.A., Koblan L.W., Levy J.M., Chen P.J., Wilson C., Newby G.A., Raguram A., Liu D.R. Search-and-replace genome editing without double-strand breaks or donor DNA. Nature. 2019;576:149–157. doi: 10.1038/s41586-019-1711-4. [DOI] [PMC free article] [PubMed] [Google Scholar]
- 5.Xu W., Zhang C., Yang Y., Zhao S., Kang G., He X., Song J., Yang J. Versatile Nucleotides Substitution in Plant Using an Improved Prime Editing System. Mol. Plant. 2020;13:675–678. doi: 10.1016/j.molp.2020.03.012. [DOI] [PubMed] [Google Scholar]
- 6.Lowder L.G., Zhang D., Baltes N.J., Paul J.W., III, Tang X., Zheng X., Voytas D.F., Hsieh T.-F., Zhang Y., Qi Y. A CRISPR/Cas9 Toolbox for Multiplexed Plant Genome Editing and Transcriptional Regulation. Plant Physiol. 2015;169:971–985. doi: 10.1104/pp.15.00636. [DOI] [PMC free article] [PubMed] [Google Scholar]
- 7.Lowder L.G., Zhou J., Zhang Y., Malzahn A., Zhong Z., Hsieh T.-F., Voytas D.F., Zhang Y., Qi Y. Robust Transcriptional Activation in Plants Using Multiplexed CRISPR-Act2.0 and mTALE-Act Systems. Mol. Plant. 2018;11:245–256. doi: 10.1016/j.molp.2017.11.010. [DOI] [PubMed] [Google Scholar]
- 8.Zhang Y., Malzahn A.A., Sretenovic S., Qi Y. The emerging and uncultivated potential of CRISPR technology in plant science. Nat. Plants. 2019;5:778–794. doi: 10.1038/s41477-019-0461-5. [DOI] [PubMed] [Google Scholar]
- 9.Hilton I.B., D'Ippolito A.M., Vockley C.M., Thakore P.I., Crawford G.E., Reddy T.E., Gersbach C.A. Epigenome editing by a CRISPR-Cas9-based acetyltransferase activates genes from promoters and enhancers. Nat. Biotechnol. 2015;33:510–517. doi: 10.1038/nbt.3199. [DOI] [PMC free article] [PubMed] [Google Scholar]
- 10.Huang Y.-H., Su J., Lei Y., Brunetti L., Gundry M.C., Zhang X., Jeong M., Li W., Goodell M.A. DNA epigenome editing using CRISPR-Cas SunTag-directed DNMT3A. Genome Biol. 2017;18:1–11. doi: 10.1186/s13059-017-1306-z. [DOI] [PMC free article] [PubMed] [Google Scholar]
- 11.Cox D.B.T., Gootenberg J.S., Abudayyeh O.O., Franklin B., Kellner M.J., Joung J., Zhang F. RNA editing with CRISPR-Cas13. Science. 2017;358:1019–1027. doi: 10.1126/science.aaq0180. [DOI] [PMC free article] [PubMed] [Google Scholar]
- 12.Xu C., Zhou Y., Xiao Q., He B., Geng G., Wang Z., Cao B., Dong X., Bai W., Wang Y., et al. Programmable RNA editing with compact CRISPR–Cas13 systems from uncultivated microbes. Nat. Methods. 2021;18:499–506. doi: 10.1038/s41592-021-01124-4. [DOI] [PubMed] [Google Scholar]
- 13.Jinek M., Chylinski K., Fonfara I., Hauer M., Doudna J.A., Charpentier E. A Programmable Dual-RNA–Guided DNA Endonuclease in Adaptive Bacterial Immunity. Science. 2012;337:816–821. doi: 10.1126/science.1225829. [DOI] [PMC free article] [PubMed] [Google Scholar]
- 14.McCarty N.S., Graham A.E., Studená L., Ledesma-Amaro R. Multiplexed CRISPR technologies for gene editing and transcriptional regulation. Nat. Commun. 2020;11:1281. doi: 10.1038/s41467-020-15053-x. [DOI] [PMC free article] [PubMed] [Google Scholar]
- 15.Shan Q., Wang Y., Li J., Zhang Y., Chen K., Liang Z., Zhang K., Liu J., Xi J.J., Qiu J.-L., Gao C. Targeted genome modification of crop plants using a CRISPR-Cas system. Nat. Biotechnol. 2013;31:686–688. doi: 10.1038/nbt.2650. [DOI] [PubMed] [Google Scholar]
- 16.Cong L., Ran F.A., Cox D., Lin S., Barretto R., Habib N., Hsu P.D., Wu X., Jiang W., Marraffini L.A., Zhang F. Multiplex Genome Engineering Using CRISPR/Cas Systems. Science. 2013;339:819–823. doi: 10.1126/science.1231143. [DOI] [PMC free article] [PubMed] [Google Scholar]
- 17.Demirer G.S., Silva T.N., Jackson C.T., Thomas J.B., W Ehrhardt D., Rhee S.Y., Mortimer J.C., Landry M.P. Nanotechnology to advance CRISPR–Cas genetic engineering of plants. Nat. Nanotechnol. 2021;16:243–250. doi: 10.1038/s41565-021-00854-y. [DOI] [PMC free article] [PubMed] [Google Scholar]
- 18.Shan S., Soltis P.S., Soltis D.E., Yang B. Considerations in adapting CRISPR/Cas9 in nongenetic model plant systems. Appl. Plant Sci. 2020;8 doi: 10.1002/aps3.11314. [DOI] [PMC free article] [PubMed] [Google Scholar]
- 19.Cardi T., Murovec J., Bakhsh A., Boniecka J., Bruegmann T., Bull S.E., Eeckhaut T., Fladung M., Galovic V., Linkiewicz A., et al. CRISPR/Cas-mediated plant genome editing: outstanding challenges a decade after implementation. Trends Plant Sci. 2023;28:1144–1165. doi: 10.1016/j.tplants.2023.05.012. [DOI] [PubMed] [Google Scholar]
- 20.Atia M., Jiang W., Sedeek K., Butt H., Mahfouz M. Crop bioengineering via gene editing: reshaping the future of agriculture. Plant Cell Rep. 2024;43:98. doi: 10.1007/s00299-024-03183-1. [DOI] [PMC free article] [PubMed] [Google Scholar]
- 21.Li B., Sun C., Li J., Gao C. Targeted genome-modification tools and their advanced applications in crop breeding. Nat. Rev. Genet. 2024;25:603–622. doi: 10.1038/s41576-024-00720-2. [DOI] [PubMed] [Google Scholar]
- 22.Lee S.-Y., Kang B., Venkatesh J., Lee J.-H., Lee S., Kim J.-M., Back S., Kwon J.-K., Kang B.-C. Development of virus-induced genome editing methods in Solanaceous crops. Hortic. Res. 2024;11 doi: 10.1093/hr/uhad233. [DOI] [PMC free article] [PubMed] [Google Scholar]
- 23.Panda D., Karmakar S., Dash M., Tripathy S.K., Das P., Banerjee S., Qi Y., Samantaray S., Mohapatra P.K., Baig M.J., Molla K.A. Optimized protoplast isolation and transfection with a breakpoint: accelerating Cas9/sgRNA cleavage efficiency validation in monocot and dicot. aBIOTECH. 2024;5:151–168. doi: 10.1007/s42994-024-00139-7. [DOI] [PMC free article] [PubMed] [Google Scholar]
- 24.Moreb E.A., Lynch M.D. Genome dependent Cas9/gRNA search time underlies sequence dependent gRNA activity. Nat. Commun. 2021;12:5034. doi: 10.1038/s41467-021-25339-3. [DOI] [PMC free article] [PubMed] [Google Scholar]
- 25.Hiranniramol K., Chen Y., Liu W., Wang X. Generalizable sgRNA design for improved CRISPR/Cas9 editing efficiency. Bioinformatics. 2020;36:2684–2689. doi: 10.1093/bioinformatics/btaa041. [DOI] [PMC free article] [PubMed] [Google Scholar]
- 26.Doench J.G., Fusi N., Sullender M., Hegde M., Vaimberg E.W., Donovan K.F., Smith I., Tothova Z., Wilen C., Orchard R., et al. Optimized sgRNA design to maximize activity and minimize off-target effects of CRISPR-Cas9. Nat. Biotechnol. 2016;34:184–191. doi: 10.1038/nbt.3437. [DOI] [PMC free article] [PubMed] [Google Scholar]
- 27.Slaman E., Lammers M., Angenent G.C., de Maagd R.A. High-throughput sgRNA testing reveals rules for Cas9 specificity and DNA repair in tomato cells. Front. Genome Ed. 2023;5 doi: 10.3389/fgeed.2023.1196763. [DOI] [PMC free article] [PubMed] [Google Scholar]
- 28.Naim F., Shand K., Hayashi S., O’Brien M., McGree J., Johnson A.A.T., Dugdale B., Waterhouse P.M. Are the current gRNA ranking prediction algorithms useful for genome editing in plants? PLoS One. 2020;15 doi: 10.1371/journal.pone.0227994. [DOI] [PMC free article] [PubMed] [Google Scholar]
- 29.Sentmanat M.F., Peters S.T., Florian C.P., Connelly J.P., Pruett-Miller S.M. A Survey of Validation Strategies for CRISPR-Cas9 Editing. Sci. Rep. 2018;8:888. doi: 10.1038/s41598-018-19441-8. [DOI] [PMC free article] [PubMed] [Google Scholar]
- 30.Wang Z., Shea Z., Li Q., Wang K., Mills K., Zhang B., Zhao B. Evaluate the guide RNA effectiveness via Agrobacterium-mediated transient assays in Nicotiana benthamiana. Front. Plant Sci. 2023;14 doi: 10.3389/fpls.2023.1111683. [DOI] [PMC free article] [PubMed] [Google Scholar]
- 31.Nadakuduti S.S., Starker C.G., Ko D.K., Jayakody T.B., Buell C.R., Voytas D.F., Douches D.S. Evaluation of Methods to Assess in vivo Activity of Engineered Genome-Editing Nucleases in Protoplasts. Front. Plant Sci. 2019;10 doi: 10.3389/fpls.2019.00110. [DOI] [PMC free article] [PubMed] [Google Scholar]
- 32.Lee J.S., Bae S.-J., Kim J.-S., Kim C., Kang B.-C. A streamlined guide RNA screening system for genome editing in Sorghum bicolor. Plant Methods. 2023;19:90. doi: 10.1186/s13007-023-01058-2. [DOI] [PMC free article] [PubMed] [Google Scholar]
- 33.Oh Y., Kim H., Kim S.-G. Virus-induced plant genome editing. Curr. Opin. Plant Biol. 2021;60 doi: 10.1016/j.pbi.2020.101992. [DOI] [PubMed] [Google Scholar]
- 34.Yong J., Wu M., Carroll B.J., Xu Z.P., Zhang R. Enhancing plant biotechnology by nanoparticle delivery of nucleic acids. Trends Genet. 2024;40:352–363. doi: 10.1016/j.tig.2024.01.005. [DOI] [PubMed] [Google Scholar]
- 35.Awan M.J.A., Akram A., Amin I., Mansoor S. Viral vectors as carriers of genome-editing reagents. Trends Plant Sci. 2023;28:981–983. doi: 10.1016/j.tplants.2023.05.010. [DOI] [PubMed] [Google Scholar]
- 36.LeBlanc C., Zhang F., Mendez J., Lozano Y., Chatpar K., Irish V.F., Jacob Y. Increased efficiency of targeted mutagenesis by CRISPR/Cas9 in plants using heat stress. Plant J. 2018;93:377–386. doi: 10.1111/tpj.13782. [DOI] [PubMed] [Google Scholar]
- 37.Zhang N., Roberts H.M., Van Eck J., Martin G.B. Generation and Molecular Characterization of CRISPR/Cas9-Induced Mutations in 63 Immunity-Associated Genes in Tomato Reveals Specificity and a Range of Gene Modifications. Front. Plant Sci. 2020;11:10. doi: 10.3389/fpls.2020.00010. [DOI] [PMC free article] [PubMed] [Google Scholar]
- 38.Liang Z., Chen K., Yan Y., Zhang Y., Gao C. Genotyping genome-edited mutations in plants using CRISPR ribonucleoprotein complexes. Plant Biotechnol. J. 2018;16:2053–2062. doi: 10.1111/pbi.12938. [DOI] [PMC free article] [PubMed] [Google Scholar]
- 39.Shan Q., Wang Y., Li J., Gao C. Genome editing in rice and wheat using the CRISPR/Cas system. Nat. Protoc. 2014;9:2395–2410. doi: 10.1038/nprot.2014.157. [DOI] [PubMed] [Google Scholar]
- 40.Xie K., Yang Y. RNA-Guided Genome Editing in Plants Using a CRISPR–Cas System. Mol. Plant. 2013;6:1975–1983. doi: 10.1093/mp/sst119. [DOI] [PubMed] [Google Scholar]
- 41.Ehrke-Schulz E., Bergmann T., Schiwon M., Doerner J., Saydaminova K., Lieber A., Ehrhardt A. Quantification of designer nuclease induced mutation rates: a direct comparison of different methods. Mol. Ther. Methods Clin. Dev. 2016;3 doi: 10.1038/mtm.2016.47. [DOI] [PMC free article] [PubMed] [Google Scholar]
- 42.Vouillot L., Thélie A., Pollet N. Comparison of T7E1 and Surveyor Mismatch Cleavage Assays to Detect Mutations Triggered by Engineered Nucleases. G3. 2015;5:407–415. doi: 10.1534/g3.114.015834. [DOI] [PMC free article] [PubMed] [Google Scholar]
- 43.Conant D., Hsiau T., Rossi N., Oki J., Maures T., Waite K., Yang J., Joshi S., Kelso R., Holden K., et al. Inference of CRISPR Edits from Sanger Trace Data. CRISPR J. 2022;5:123–130. doi: 10.1089/crispr.2021.0113. [DOI] [PubMed] [Google Scholar]
- 44.Brinkman E.K., Chen T., Amendola M., van Steensel B. Easy quantitative assessment of genome editing by sequence trace decomposition. Nucleic Acids Res. 2014;42:e168. doi: 10.1093/nar/gku936. [DOI] [PMC free article] [PubMed] [Google Scholar]
- 45.Bloh K., Kanchana R., Bialk P., Banas K., Zhang Z., Yoo B.-C., Kmiec E.B. Deconvolution of Complex DNA Repair (DECODR): Establishing a Novel Deconvolution Algorithm for Comprehensive Analysis of CRISPR-Edited Sanger Sequencing Data. CRISPR J. 2021;4:120–131. doi: 10.1089/crispr.2020.0022. [DOI] [PMC free article] [PubMed] [Google Scholar]
- 46.Clement K., Rees H., Canver M.C., Gehrke J.M., Farouni R., Hsu J.Y., Cole M.A., Liu D.R., Joung J.K., Bauer D.E., Pinello L. CRISPResso2 provides accurate and rapid genome editing sequence analysis. Nat. Biotechnol. 2019;37:224–226. doi: 10.1038/s41587-019-0032-3. [DOI] [PMC free article] [PubMed] [Google Scholar]
- 47.Han Y., Liu G., Wu Y., Bao Y., Zhang Y., Zhang T. CrisprStitch: Fast evaluation of the efficiency of CRISPR editing systems. Plant Commun. 2024;5 doi: 10.1016/j.xplc.2023.100783. [DOI] [PMC free article] [PubMed] [Google Scholar]
- 48.Lomov N.A., Viushkov V.S., Petrenko A.P., Syrkina M.S., Rubtsov M.A. Methods of Evaluating the Efficiency of CRISPR/Cas Genome Editing. Mol. Biol. 2019;53:862–875. doi: 10.1134/S0026893319060116. [DOI] [PubMed] [Google Scholar]
- 49.Bennett E.P., Petersen B.L., Johansen I.E., Niu Y., Yang Z., Chamberlain C.A., Met Ö., Wandall H.H., Frödin M. INDEL detection, the ‘Achilles heel’ of precise genome editing: a survey of methods for accurate profiling of gene editing induced indels. Nucleic Acids Res. 2020;48:11958–11981. doi: 10.1093/nar/gkaa975. [DOI] [PMC free article] [PubMed] [Google Scholar]
- 50.Vereecke E., Van Laere K., Ruttink T. In: A Roadmap for Plant Genome Editing. Ricroch A., Eriksson D., Miladinović D., Sweet J., Van Laere K., Woźniak-Gientka E., editors. Springer Nature Switzerland; 2024. CRISPR/Cas Mutation Screening: From Mutant Allele Detection to Prediction of Protein Coding Potential; pp. 79–88. [DOI] [Google Scholar]
- 51.Shillito R.D., Whitt S., Ross M., Ghavami F., De Vleesschauwer D., D’Halluin K., Van Hoecke A., Meulewaeter F. Detection of genome edits in plants—from editing to seed. Vitro Cell Dev. Biol. Plant. 2021;57:595–608. doi: 10.1007/s11627-021-10214-z. [DOI] [Google Scholar]
- 52.Yang Z., Steentoft C., Hauge C., Hansen L., Thomsen A.L., Niola F., Vester-Christensen M.B., Frödin M., Clausen H., Wandall H.H., Bennett E.P. Fast and sensitive detection of indels induced by precise gene targeting. Nucleic Acids Res. 2015;43:e59. doi: 10.1093/nar/gkv126. [DOI] [PMC free article] [PubMed] [Google Scholar]
- 53.Pinello L., Canver M.C., Hoban M.D., Orkin S.H., Kohn D.B., Bauer D.E., Yuan G.-C. Analyzing CRISPR genome-editing experiments with CRISPResso. Nat. Biotechnol. 2016;34:695–697. doi: 10.1038/nbt.3583. [DOI] [PMC free article] [PubMed] [Google Scholar]
- 54.Concordet J.-P., Haeussler M. CRISPOR: intuitive guide selection for CRISPR/Cas9 genome editing experiments and screens. Nucleic Acids Res. 2018;46:W242–W245. doi: 10.1093/nar/gky354. [DOI] [PMC free article] [PubMed] [Google Scholar]
- 55.Haeussler M., Schönig K., Eckert H., Eschstruth A., Mianné J., Renaud J.-B., Schneider-Maunoury S., Shkumatava A., Teboul L., Kent J., et al. Evaluation of off-target and on-target scoring algorithms and integration into the guide RNA selection tool CRISPOR. Genome Biol. 2016;17:148. doi: 10.1186/s13059-016-1012-2. [DOI] [PMC free article] [PubMed] [Google Scholar]
- 56.Gong Z., Previtera D.A., Wang Y., Botella J.R. Geminiviral-induced genome editing using miniature CRISPR/Cas12j (CasΦ) and Cas12f variants in plants. Plant Cell Rep. 2024;43:71. doi: 10.1007/s00299-023-03092-9. [DOI] [PMC free article] [PubMed] [Google Scholar]
- 57.Diamos A.G., Rosenthal S.H., Mason H.S. 5′ and 3′ Untranslated Regions Strongly Enhance Performance of Geminiviral Replicons in Nicotiana benthamiana Leaves. Front. Plant Sci. 2016;7 doi: 10.3389/fpls.2016.00200. [DOI] [PMC free article] [PubMed] [Google Scholar]
- 58.Iida M., Suzuki M., Sakane Y., Nishide H., Uchiyama I., Yamamoto T., Suzuki K.-I.T., Fujii S. A simple and practical workflow for genotyping of CRISPR–Cas9-based knockout phenotypes using multiplexed amplicon sequencing. Genes Cells. 2020;25:498–509. doi: 10.1111/gtc.12775. [DOI] [PubMed] [Google Scholar]
- 59.Nekrasov V., Staskawicz B., Weigel D., Jones J.D.G., Kamoun S. Targeted mutagenesis in the model plant Nicotiana benthamiana using Cas9 RNA-guided endonuclease. Nat. Biotechnol. 2013;31:691–693. doi: 10.1038/nbt.2655. [DOI] [PubMed] [Google Scholar]
- 60.Kim H.J., Lee H.J., Kim H., Cho S.W., Kim J.-S. Targeted genome editing in human cells with zinc finger nucleases constructed via modular assembly. Genome Res. 2009;19:1279–1288. doi: 10.1101/gr.089417.108. [DOI] [PMC free article] [PubMed] [Google Scholar]
- 61.Ramlee M.K., Yan T., Cheung A.M.S., Chuah C.T.H., Li S. High-throughput genotyping of CRISPR/Cas9-mediated mutants using fluorescent PCR-capillary gel electrophoresis. Sci. Rep. 2015;5 doi: 10.1038/srep15587. [DOI] [PMC free article] [PubMed] [Google Scholar]
- 62.Johansen I.E., Liu Y., Jørgensen B., Bennett E.P., Andreasson E., Nielsen K.L., Blennow A., Petersen B.L. High efficacy full allelic CRISPR/Cas9 gene editing in tetraploid potato. Sci. Rep. 2019;9 doi: 10.1038/s41598-019-54126-w. [DOI] [PMC free article] [PubMed] [Google Scholar]
- 63.Lonowski L.A., Narimatsu Y., Riaz A., Delay C.E., Yang Z., Niola F., Duda K., Ober E.A., Clausen H., Wandall H.H., et al. Genome editing using FACS enrichment of nuclease-expressing cells and indel detection by amplicon analysis. Nat. Protoc. 2017;12:581–603. doi: 10.1038/nprot.2016.165. [DOI] [PMC free article] [PubMed] [Google Scholar]
- 64.Foley J.E., Maeder M.L., Pearlberg J., Joung J.K., Peterson R.T., Yeh J.-R.J. Targeted mutagenesis in zebrafish using customized zinc-finger nucleases. Nat. Protoc. 2009;4:1855–1867. doi: 10.1038/nprot.2009.209. [DOI] [PMC free article] [PubMed] [Google Scholar]
- 65.Gao R., Feyissa B.A., Croft M., Hannoufa A. Gene editing by CRISPR/Cas9 in the obligatory outcrossing Medicago sativa. Planta. 2018;247:1043–1050. doi: 10.1007/s00425-018-2866-1. [DOI] [PubMed] [Google Scholar]
- 66.Mock U., Hauber I., Fehse B. Digital PCR to assess gene-editing frequencies (GEF-dPCR) mediated by designer nucleases. Nat. Protoc. 2016;11:598–615. doi: 10.1038/nprot.2016.027. [DOI] [PubMed] [Google Scholar]
- 67.Mock U., Machowicz R., Hauber I., Horn S., Abramowski P., Berdien B., Hauber J., Fehse B. mRNA transfection of a novel TAL effector nuclease (TALEN) facilitates efficient knockout of HIV co-receptor CCR5. Nucleic Acids Res. 2015;43:5560–5571. doi: 10.1093/nar/gkv469. [DOI] [PMC free article] [PubMed] [Google Scholar]
- 68.Peng C., Zheng M., Ding L., Chen X., Wang X., Feng X., Wang J., Xu J. Accurate Detection and Evaluation of the Gene-Editing Frequency in Plants Using Droplet Digital PCR. Front. Plant Sci. 2020;11 doi: 10.3389/fpls.2020.610790. [DOI] [PMC free article] [PubMed] [Google Scholar]
- 69.Moreb E.A., Lynch M.D. Genome dependent Cas9/gRNA search time underlies sequence dependent gRNA activity. Nat. Commun. 2021;12:5034. doi: 10.1038/s41467-021-25339-3. [DOI] [PMC free article] [PubMed] [Google Scholar]
- 70.Hwang G.-H., Yu J., Yang S., Son W.J., Lim K., Kim H.S., Kim J.-S., Bae S. CRISPR-sub: Analysis of DNA substitution mutations caused by CRISPR-Cas9 in human cells. Comput. Struct. Biotechnol. J. 2020;18:1686–1694. doi: 10.1016/j.csbj.2020.06.026. [DOI] [PMC free article] [PubMed] [Google Scholar]
- 71.Chakrabarti A.M., Henser-Brownhill T., Monserrat J., Poetsch A.R., Luscombe N.M., Scaffidi P. Target-Specific Precision of CRISPR-Mediated Genome Editing. Mol. Cell. 2019;73:699–713.e6. doi: 10.1016/j.molcel.2018.11.031. [DOI] [PMC free article] [PubMed] [Google Scholar]
- 72.Tsuji T., Niida Y. Development of a simple and highly sensitive mutation screening system by enzyme mismatch cleavage with optimized conditions for standard laboratories. Electrophoresis. 2008;29:1473–1483. doi: 10.1002/elps.200700729. [DOI] [PubMed] [Google Scholar]
- 73.Guan C., Kumar S., Kucera R., Ewel A. Changing the Enzymatic Activity of T7 Endonuclease by Mutations at the β-Bridge Site: Alteration of Substrate Specificity Profile and Metal Ion Requirements by Mutation Distant from the Catalytic Domain. Biochemistry. 2004;43:4313–4322. doi: 10.1021/bi036033j. [DOI] [PubMed] [Google Scholar]
- 74.Rohlin A., Wernersson J., Engwall Y., Wiklund L., Björk J., Nordling M. Parallel sequencing used in detection of mosaic mutations: Comparison with four diagnostic DNA screening techniques. Hum. Mutat. 2009;30:1012–1020. doi: 10.1002/humu.20980. [DOI] [PubMed] [Google Scholar]
- 75.Tsiatis A.C., Norris-Kirby A., Rich R.G., Hafez M.J., Gocke C.D., Eshleman J.R., Murphy K.M. Comparison of Sanger Sequencing, Pyrosequencing, and Melting Curve Analysis for the Detection of KRAS Mutations. J. Mol. Diagn. 2010;12:425–432. doi: 10.2353/jmoldx.2010.090188. [DOI] [PMC free article] [PubMed] [Google Scholar]
- 76.König S., Yang Z., Wandall H.H., Mussolino C., Bennett E.P. Springer New York; 2019. Fast and Quantitative Identification of Ex Vivo Precise Genome Targeting-Induced Indel Events by IDAA; pp. 45–66. [DOI] [PubMed] [Google Scholar]
- 77.Schuelke M. An economic method for the fluorescent labeling of PCR fragments. Nat. Biotechnol. 2000;18:233–234. doi: 10.1038/72708. [DOI] [PubMed] [Google Scholar]
- 78.Petersen B.L., Möller S.R., Mravec J., Jørgensen B., Christensen M., Liu Y., Wandall H.H., Bennett E.P., Yang Z. Improved CRISPR/Cas9 gene editing by fluorescence activated cell sorting of green fluorescence protein tagged protoplasts. BMC Biotechnol. 2019;19:1–12. doi: 10.1186/s12896-019-0530-x. [DOI] [PMC free article] [PubMed] [Google Scholar]
- 79.Butler J.M., Reeder D.J. Detection of DNA polymorphisms using PCR-RFLP and capillary electrophoresis. Methods Mol. Biol. 2001;163:49–56. doi: 10.1385/1-59259-116-7:49. [DOI] [PubMed] [Google Scholar]
- 80.Miyaoka Y., Chan A.H., Judge L.M., Yoo J., Huang M., Nguyen T.D., Lizarraga P.P., So P.-L., Conklin B.R. Isolation of single-base genome-edited human iPS cells without antibiotic selection. Nat. Methods. 2014;11:291–293. doi: 10.1038/nmeth.2840. [DOI] [PMC free article] [PubMed] [Google Scholar]
- 81.Nakamura Y., Hashimoto M. Droplet size affects the degree of separation between fluorescence-positive and fluorescence-negative droplet populations in droplet digital PCR. Anal. Methods. 2024;16:656–666. doi: 10.1039/D3AY01689G. [DOI] [PubMed] [Google Scholar]
- 82.Grohmann L., Keilwagen J., Duensing N., Dagand E., Hartung F., Wilhelm R., Bendiek J., Sprink T. Detection and Identification of Genome Editing in Plants: Challenges and Opportunities. Front. Plant Sci. 2019;10 doi: 10.3389/fpls.2019.00236. [DOI] [PMC free article] [PubMed] [Google Scholar]
- 83.Kebschull J.M., Zador A.M. Sources of PCR-induced distortions in high-throughput sequencing data sets. Nucleic Acids Res. 2015;43 doi: 10.1093/nar/gkv717. [DOI] [PMC free article] [PubMed] [Google Scholar]
- 84.Li B., Ren N., Yang L., Liu J., Huang Q. A qPCR method for genome editing efficiency determination and single-cell clone screening in human cells. Sci. Rep. 2019;9 doi: 10.1038/s41598-019-55463-6. [DOI] [PMC free article] [PubMed] [Google Scholar]
- 85.Peng C., Wang H., Xu X., Wang X., Chen X., Wei W., Lai Y., Liu G., Godwin I.D., Li J., et al. High-throughput detection and screening of plants modified by gene editing using quantitative real-time polymerase chain reaction. Plant J. 2018;95:557–567. doi: 10.1111/tpj.13961. [DOI] [PubMed] [Google Scholar]
- 86.Kim J.M., Kim D., Kim S., Kim J.-S. Genotyping with CRISPR-Cas-derived RNA-guided endonucleases. Nat. Commun. 2014;5:3157. doi: 10.1038/ncomms4157. [DOI] [PubMed] [Google Scholar]
- 87.Hua Y., Wang C., Huang J., Wang K. A simple and efficient method for CRISPR/Cas9-induced mutant screening. J. Genet. Genom. 2017;44:207–213. doi: 10.1016/j.jgg.2017.03.005. [DOI] [PubMed] [Google Scholar]
- 88.Thomas H.R., Percival S.M., Yoder B.K., Parant J.M. High-throughput genome editing and phenotyping facilitated by high resolution melting curve analysis. PLoS One. 2014;9 doi: 10.1371/journal.pone.0114632. [DOI] [PMC free article] [PubMed] [Google Scholar]
- 89.Zheng X., Yang S., Zhang D., Zhong Z., Tang X., Deng K., Zhou J., Qi Y., Zhang Y. Effective screen of CRISPR/Cas9-induced mutants in rice by single-strand conformation polymorphism. Plant Cell Rep. 2016;35:1545–1554. doi: 10.1007/s00299-016-1967-1. [DOI] [PubMed] [Google Scholar]
- 90.Dabrowska M., Czubak K., Juzwa W., Krzyzosiak W.J., Olejniczak M., Kozlowski P. qEva-CRISPR: a method for quantitative evaluation of CRISPR/Cas-mediated genome editing in target and off-target sites. Nucleic Acids Res. 2018;46:e101. doi: 10.1093/nar/gky505. [DOI] [PMC free article] [PubMed] [Google Scholar]
- 91.Edwards K., Johnstone C., Thompson C. A simple and rapid method for the preparation of plant genomic DNA for PCR analysis. Nucleic Acids Res. 1991;19:1349. doi: 10.1093/nar/19.6.1349. [DOI] [PMC free article] [PubMed] [Google Scholar]
Associated Data
This section collects any data citations, data availability statements, or supplementary materials included in this article.
Supplementary Materials
Data Availability Statement
-
•
The genome editing efficiencies quantified using the different methods are all reported in the Supplemental Data.
-
•
The raw AmpSeq reads have been deposited in Zenodo: https://doi.org/10.5281/zenodo.15043050.
-
•
The raw AmpSeq reads have also been deposited in The University of Queensland UQ eSpace: https://doi.org/10.48610/a32ca0d.
-
•
Any additional information required to reanalyze the data reported in this paper is available from the lead contact upon request.