

Abstract
The rapid decline of kidney function in middle-aged and elderly people has become an increasingly serious public health problem. Machine learning (ML) technology has substantial potential to disease prediction. The present study use dataset from the Chinese Health and Retirement Longitudinal Study (CHARLS) and utilizes advanced Gradient Boosting algorithms to develop predictive models. Least Absolute Shrinkage and Selection Operator (LASSO) regression was used to identify the key predictors, and multivariate logistic regression was utilized to validate the independent predictive power of the variables. Furthermore, the study integrated SHapley Additive exPlanations (SHAP) to boost the interpretability of the model. The findings show that the Gradient Boosting Model demonstrated robust performance across both the training and test datasets. Specifically, it attained AUC values of 0.8 and 0.765 in the training and test sets, respectively, while achieving accuracy scores of 0.736 and 0.728 in these two datasets. LASSO regression identified key influencing factors, including estimated glomerular filtration rate (eGFR), age, hemoglobin (Hb), glucose, and systolic blood pressure (SBP). Multivariate linear regression further confirmed the independent associations between these variables and rapid kidney function deterioration (P < 0.05). This study developed a risk assessment model for rapid kidney function deterioration that is applicable to middle-aged and elderly populations in China.
Supplementary Information
The online version contains supplementary material available at 10.1186/s12911-025-03043-2.
Keywords: Machine learning, XGBoost, Rapid renal function decline, Prediction model, Middle-aged and elderly population, SHAP
Background
The phenomenon of the population getting older and older all over the world shows a trend of increasing severity [1, 2]. It is projected that by the year 2030, the elderly group will represent 21.93% of all the world population [3]. China, as a country that has one of the highest aging rates [4], is supporting its old population as much as 13.50% [5] and is on their way up to 30% by the year 2050 [6]. This development poses considerable health challenges for middle-aged and older adults, while also increasing the strain on public health infrastructure and medical resource distribution [7]. Progressing in age is linked with a variety of health problems [8], mainly kidney disease, which is a feeding channel for middle-aged and elderly populations [9]. The rapid decrease in kidney function is highly correlated with the underlying kidney disease [10] and is linked to health risk events of depression [11], dementia [12], cardiovascular events [13], and early mortality [14]. Therefore, identifying patients at high risk of rapid kidney function decline early on is crucial for improving their outlook and quality of life. It is worth noting that renal function decline is a continuous and dynamic process, while most existing studies focus on the dichotomous outcome of whether renal function will deteriorate. Quantitative analysis of changes in renal function can more accurately identify the rate of decline in high-risk populations, providing timely evidence for clinical intervention. However, there is still a lack of research on dynamic influencing factors of renal function decline in middle-aged and elderly populations.
Machine Learning (ML) is a branch of artificial intelligence that enables computers to learn from data and recognize patterns without relying on traditional programming instructions [15]. This approach surpasses traditional techniques in handling unstructured data and complex patterns, leading to its increasing popularity in disease prediction [16].In the field of renal function risk prediction, machine learning technology has made significant progress. For example, Barah et al. [17] developed a discarding machine learning prediction model for predicting dead donor kidneys, which improved the success rate of organ transplantation. At the same time, there are studies to improve the prediction accuracy by integrating multiple machine learning methods in the renal transplant survival prediction model [18]. One study effectively utilized everyday lab results to forecast the occurrence of estimated glomerular filtration rate (eGFR) decline or renal dysfunction [19]. Additionally, Chen et al. [20] predicted the influence of study variables on kidney stone formation. Furthermore, numerous studies have addressed the prediction of renal function [21], acute kidney injury (AKI) [22, 23], end-stage kidney disease (ESKD) [24], and short-term eGFR fluctuations in patients with chronic kidney disease (CKD) [25]. It is worth noting that in 2024, lee et al. developed a machine learning model to predict rapid kidney function decline in patients with diabetes and chronic kidney disease, achieving an AUC of 0.826 in the test set [26].
Overall, these studies demonstrate that machine learning techniques hold great potential in predicting kidney function risks and can provide strong support for clinical decision-making. However, there are two major limitations in the existing research. First, including the study by Lee et al., most studies have primarily focused on specific patient groups (such as those with diabetes or chronic kidney disease) and lack generalizability to a broader middle-aged and elderly population. Second, current studies are largely concentrated on binary predictions of kidney function abnormalities or end-stage outcomes, with a significant lack of quantitative assessments of the risk of rapid kidney function decline in middle-aged and elderly individuals, as well as continuous analyses of the eGFR decline rate (ΔeGFR).
This study is the first to combine binary classification prediction of rapid kidney function decline with quantification of the degree of kidney function decline (eGFR decline rate). By constructing machine learning predictive models and linear regression analysis, we systematically investigate the key factors influencing rapid kidney function decline and their specific impact on ΔeGFR. When kidney function declines rapidly (defined as an annual eGFR decrease of ≥ 3 mL/min/1.73 m²) [27], the risk of progressing to chronic kidney disease (CKD) significantly increases, not only reducing the quality of life for middle-aged and elderly populations but also increasing healthcare burdens. Therefore, this study aims to develop a tool for predicting rapid kidney function decline in middle-aged and elderly Chinese citizens and further explore the specific impact of related factors on kidney function decline through regression analysis. This initiative can screen out high-risk individuals using the model and then develop personalized lifestyle adjustment plans for these high-risk individuals based on regression analysis results, thereby achieving the goal of reducing CKD incidence and improving health outcomes for middle-aged and elderly populations.
Research data and methods
Data sources and study population
The data employed in this research were derived from the China Health and Retirement Longitudinal Study (CHARLS), which was mainly aimed at Chinese people aged 45 and over [28]. The CHARLS methodology aligns with global standards by mirroring the Health and Retirement Study and using a Probability Proportional to Size sampling approach that considers county Gross Domestic Product [29]. Initiated in 2011 and completed in 2012, the baseline survey covered a broad spectrum of the population, including 150 counties and 450 communities, with a substantial sample size of 17,708 participants [30, 31]. Two-year check-ups have been conducted, culminating in four data collections by 2018. CHARLS follows the ethical rules set by the Helsinki Declaration and every participant in the study has given their informed consent. Our analysis of CHARLS data is secondary, following the Strengthening the Reporting of Observational Studies in Epidemiology (STROBE) guidelines to uphold the integrity and precision of epidemiological findings [32]. It should be noted that this study is not a clinical trial. Therefore, the clinical trial number is not applicable.
The study selected samples from two time points in the CHARLS survey data: Wave 1, the starting point in 2011, and Wave 3, a follow-up conducted in 2015. Among the initial 17,708 participants, a total of 5,022 were included according to Fig. 1.
Fig. 1.

Flowchart of participant selection for the study
Outcome definition
This study aims to assess the rapid decline in kidney function in middle-aged and older adults in China. We used the modified the Modification of Diet in Renal Disease (MDRD) equation to compute and estimate the glomerular filtration rate (eGFR) as the main indicator to evaluate renal function [33]. This equation was optimized for Chinese population, and the calculation formula is as follows:


A rapid decline in kidney function is defined as an annual eGFR decrease of 3 mL/min/1.73 m2 or more [27]. We selected eGFR data from 2011 to 2015 to assess the baseline and endpoint of kidney function changes. By comparing eGFR values at these two points, we determine the annual rate of change in participants’ kidney function. Additionally, we calculated the difference between baseline eGFR and endpoint eGFR (ΔeGFR) as an alternative measure of kidney function change.
Data preprocessing and feature selection
This study included a comprehensive selection of demographic factors such as age, sex; physiological indicators including height, weight, blood pressure, and heart rate; health risk factors encompassing smoking, alcohol consumption, sleep patterns, dyslipidemia, hypertension, diabetes, and heart and kidney diseases; and biochemical markers comprising creatinine (Cr), low-density lipoprotein (LDL), high-density lipoprotein (HDL), uric acid (UA), C-reactive protein (CRP), glucose, glycated hemoglobin, blood urea nitrogen (BUN), total cholesterol (TC), triglycerides (TG) and eGFR, resulting in a total of 35 candidate factors. In the initial stage, we standardized the dataset and applied coding transformations to categorical variables, with binary variables coded as 0/1 and multi-category variables represented using dummy variables. For missing data (total missing < 5%; see Supplementary Table S1), we utilized the mice package for multiple imputation to ensure the robustness of the dataset [34]. To understand the potential structure of the dataset, we plotted histograms for all continuous variables and bar charts stratified by the results of categorical variables to assess data quality and distribution (see Supplementary Fig S1 and Fig S2).
During the data preprocessing stage, we initially applied the Kolmogorov-Smirnov test to assess the distribution of all variables, which indicated that all variables were non-normally distributed (see Supplementary Table S2). Consequently, to mitigate potential interference caused by dimensional differences during subsequent model training, we standardized the continuous variables to conform to a standard normal distribution, denoted as N (0,1). Subsequently, we employed the Spearman rank correlation coefficient to assess the link between each variable and the swift deterioration in kidney function (see Supplementary Fig S3), establishing a correlation threshold of corr > 0.9 to filter out variables with higher correlations. Furthermore, we filtered and extracted the selected features using the feature_selection_function, resulting in a more refined and effective feature set for subsequent model construction, thereby enhancing the model’s performance and predictive accuracy.
Model construction and interpretation
Lasso Regression is employed for feature selection by incorporating L1 regularization [35]. The regularization parameter λ is optimized within the training set using 5-fold cross-validation, ultimately resulting in the selection of λ = 0.0047, which corresponds to the minimum mean squared error (see Fig. 2a-b). This process identifies an optimal subset of 16 features (see Fig. 3), which demonstrate predictive power for rapid declines in renal function. To identify the most effective predictive model for rapidly assessing kidney function decline, we evaluated four advanced machine learning algorithms: Gradient Boosting (GB), Extreme Gradient Boosting (XGBoost), Random Forest (RF), and Adaptive Boosting (AdaBoost). These models are widely used in medical prediction tasks [17–19]. The dataset was partitioned randomly into a training set and a test set in an 80:20 ratio [36]. For the training dataset, 5-fold cross-validation was combined with grid search to fine-tune the hyperparameters of four models: GB, XGBoost, RF, and AdaBoost (see Supplementary Table S3). To address the issue of class imbalance, after hyperparameter optimization, we performed Synthetic Minority Over-sampling Technique (SMOTE) sampling on the final training set (80%) to ensure a balanced data ratio. Finally, the models were trained on the training dataset using the optimized parameters and feature subset. The random seed to 0 to ensure reproducibility. To gain deeper insights into the constructed machine learning model, the SHapley Additive exPlanations (SHAP) algorithm was implemented on the highest - performing Gradient Boosting model, thereby enhancing its transparency and interpretability [37]. The SHAP algorithm assesses the contribution of each feature to the model’s predictions, presenting the average impact of each feature on the prediction of rapid declines in kidney function across all samples, both globally and locally.
Fig. 2.

(a): Variable selection by the LASSO regression model; (b): Mean Squared Error Plot for Different Lambda Values
Fig. 3.

LASSO feature importance map
Regression analysis and visualization based on ΔeGFR
To further leverage the value of data and provide deeper clinical insights, this study conducted a series of analyses focused on ΔeGFR (the change in eGFR). First, we constructed a histogram of ΔeGFR to show the central tendency and dispersion of the data (see Supplementary Fig S4). We subsequently conducted multicollinearity tests for all variables and removed Body Mass Index (BMI), TC, and LDL owing to severe multicollinearity. Following this removal, the variance inflation factors (VIF) for the remaining variables were all < 5 (see Supplementary Table S4), indicating the absence of significant multicollinearity. Next, we performed univariate linear regression analysis to evaluate each of the 35 candidate features for their independent correlation with ΔeGFR. Based on the significance criteria (p < 0.05), we initially screened out variables demonstrating a significant association with ΔeGFR, thereby establishing a foundation for subsequent analyses (see Supplementary Table S5). Subsequently, we included statistically significant features (p < 0.05) from the univariate analysis into a multivariate linear regression model using bidirectional stepwise regression to ascertain the independent association strength of each variable with ΔeGFR, represented by β coefficients and 95% confidence intervals. For variables with p < 0.05 in multivariate linear regression models, we utilized scatter plots and box plots as visualization tools to explore potential dose-response relationships with ΔeGFR, thereby enhancing our understanding of variable associations at an intuitive level (see Supplementary Fig S5 and S6).
Model performance evaluation
In order to accurately evaluate the predictive ability of the model, several widely accepted evaluation indicators were used, including receiver working characteristic curve (ROC), area under the curve (AUC), positive predictive value (PPV), sensitivity, negative predictive value (NPV), specificity, accuracy, precision, recall rate, F1 score and optimal threshold [37]. The AUC can evaluate the model’s performance at different classification thresholds; sensitivity and specificity are used to measure the model’s ability to identify true positives and true negatives; accuracy emphasizes the precision of positive predictions, while recall further reflects the model’s capability to detect true positive samples; the F1 score integrates both accuracy and recall. Additionally, we employed decision curve analysis (DCA) to illustrate the net benefit of the model at various decision thresholds, thereby assessing its effectiveness in clinical and related practical applications. By comprehensively evaluating these metrics across the training set and test set, we ultimately identified the model with the best performance for accurately predicting rapid declines in kidney function.
Statistical analysis
In this study, continuous variables were non-normally distributed and described by median and interquartile range (IQR). The Mann-Whitney U test was employed to compare differences between groups. Categorical variables were displayed as percentages, and group differences were analyzed via the Pearson chi-square test. All data analyses were executed using R (4.1.2) and Python (3.7.0).
Results
Baseline population characteristics
Overall, 5,022 individuals were included, with a median age being 58 years (IQR: 53,65). Among them, 1,692 individuals (33.7%) experienced rapid decline in kidney function (see Table 1). Compared to the group without rapid renal function decline (n = 3,330), the group with rapid renal function decline (n = 1,692) had significantly lower body weight, BMI, blood urea nitrogen, creatinine, glucose, total cholesterol, triglycerides, low-density lipoprotein, uric acid, hemoglobin, and hematocrit, while showing significantly higher baseline eGFR, ΔeGFR, and mean red blood cell volume, as well as a higher prevalence of diabetes (P<0.05).
Table 1.
Baseline characteristics of participants before imputation
| Variables | Total (n = 5022) | No-Rapid Renal Function Decline (n = 3330) |
Rapid Renal Function Decline (n = 1692) |
P |
|---|---|---|---|---|
| Age, M (Q₁, Q₃) | 58.00 (53.00, 65.00) | 58.00 (52.00, 64.00) | 59.00 (53.00, 66.00) | 0.095 |
| Hight, M (Q₁, Q₃) | 1.58 (1.52, 1.64) | 1.58 (1.52, 1.64) | 1.58 (1.52, 1.63) | 0.063 |
| Weight, M (Q₁, Q₃) | 58.20 (51.50, 65.90) | 58.65 (51.80, 66.30) | 57.20 (50.80, 65.10) | < 0.001 |
| BMI, M (Q₁, Q₃) | 23.19 (20.97, 25.82) | 23.31 (21.07, 25.98) | 22.95 (20.73, 25.44) | < 0.001 |
| SBP, M (Q₁, Q₃) | 126.00 (113.50, 141.50) | 126.00 (114.00, 141.00) | 125.25 (112.50, 142.00) | 0.562 |
| DBP, M (Q₁, Q₃) | 74.00 (66.50, 82.50) | 74.50 (67.00, 83.00) | 74.00 (66.00, 82.50) | 0.096 |
| P, M (Q₁, Q₃) | 71.00 (65.00, 78.00) | 71.00 (65.00, 78.00) | 71.50 (65.00, 78.12) | 0.694 |
| WBC, M (Q₁, Q₃) | 5.97 (4.90, 7.20) | 5.96 (4.95, 7.30) | 5.99 (4.90, 7.20) | 0.662 |
| MCV, M (Q₁, Q₃) | 91.10 (86.70, 95.30) | 91.00 (86.70, 95.00) | 91.60 (86.70, 95.80) | 0.019 |
| Plt, M (Q₁, Q₃) | 207.00 (162.00, 255.00) | 207.00 (162.00, 254.00) | 209.00 (162.00, 256.00) | 0.317 |
| BUN, M (Q₁, Q₃) | 15.14 (12.58, 18.23) | 15.27 (12.81, 18.43) | 14.79 (12.27, 17.79) | < 0.001 |
| Glucose, M (Q₁, Q₃) | 102.24 (94.14, 112.32) | 102.78 (94.50, 113.58) | 100.80 (93.60, 110.52) | < 0.001 |
| TC, M (Q₁, Q₃) | 190.59 (167.01, 214.95) | 192.53 (168.56, 216.40) | 186.34 (164.21, 211.86) | < 0.001 |
| TG, M (Q₁, Q₃) | 105.32 (74.34, 154.88) | 108.41 (76.11, 160.18) | 100.00 (72.57, 144.26) | < 0.001 |
| HDL, M (Q₁, Q₃) | 49.10 (40.59, 59.54) | 49.10 (40.21, 59.54) | 49.48 (40.98, 59.92) | 0.137 |
| LDL, M (Q₁, Q₃) | 113.66 (92.78, 136.47) | 114.82 (93.94, 137.24) | 111.73 (90.46, 133.09) | < 0.001 |
| CRP, M (Q₁, Q₃) | 0.98 (0.54, 2.05) | 0.97 (0.55, 2.01) | 1.04 (0.52, 2.09) | 0.720 |
| HbA1c, M (Q₁, Q₃) | 5.10 (4.90, 5.40) | 5.10 (4.90, 5.40) | 5.10 (4.90, 5.40) | < 0.001 |
| UA, M (Q₁, Q₃) | 4.24 (3.54, 5.08) | 4.35 (3.65, 5.21) | 4.05 (3.36, 4.87) | < 0.001 |
| PCV, M (Q₁, Q₃) | 41.70 (38.00, 45.20) | 41.80 (38.20, 45.30) | 41.30 (37.68, 45.00) | 0.004 |
| Hb, M (Q₁, Q₃) | 14.20 (13.00, 15.50) | 14.30 (13.10, 15.60) | 13.90 (12.80, 15.10) | < 0.001 |
| Cr, M (Q₁, Q₃) | 0.75 (0.64, 0.87) | 0.78 (0.69, 0.90) | 0.68 (0.58, 0.78) | < 0.001 |
| eGFR, M (Q₁, Q₃) | 106.09 (91.36, 123.47) | 100.71 (87.87, 114.80) | 121.61 (103.45, 141.25) | < 0.001 |
| eGFR1, M (Q₁, Q₃) | 102.51 (87.11, 118.21) | 106.37 (92.23, 122.12) | 94.39 (77.81, 109.39) | < 0.001 |
| ΔeGFR, M (Q₁, Q₃) | 4.21 (-7.91, 17.18) | -3.64 (-13.22, 4.14) | 23.57 (16.93, 39.46) | < 0.001 |
| Gender, n(%) | 0.916 | |||
| Female | 2669 (53.15) | 1768 (53.09) | 901 (53.25) | |
| Male | 2353 (46.85) | 1562 (46.91) | 791 (46.75) | |
| Marital status, n(%) | 0.950 | |||
| Married | 559 (11.13) | 370 (11.11) | 189 (11.17) | |
| Unmarried | 4463 (88.87) | 2960 (88.89) | 1503 (88.83) | |
| Education level, n(%) | 0.244 | |||
| Illiterate | 1441 (28.69) | 955 (28.68) | 486 (28.72) | |
| Primary School | 2174 (43.29) | 1460 (43.84) | 714 (42.20) | |
| Junior High School | 974 (19.39) | 625 (18.77) | 349 (20.63) | |
| Senior High School | 308 (6.13) | 199 (5.98) | 109 (6.44) | |
| College and Above | 125 (2.49) | 91 (2.73) | 34 (2.01) | |
| Smoke, n(%) | 0.739 | |||
| Yes | 1990 (39.63) | 1325 (39.79) | 665 (39.30) | |
| No | 3032 (60.37) | 2005 (60.21) | 1027 (60.70) | |
| Drink, n(%) | 0.451 | |||
| Never | 1261 (25.11) | 829 (24.89) | 432 (25.53) | |
| Occasionally | 395 (7.87) | 273 (8.20) | 122 (7.21) | |
| Frequently | 3366 (67.03) | 2228 (66.91) | 1138 (67.26) | |
| Sleep, n(%) | 0.066 | |||
| Good | 2453 (48.85) | 1637 (49.16) | 816 (48.23) | |
| Fair | 818 (16.29) | 563 (16.91) | 255 (15.07) | |
| Severe | 771 (15.35) | 483 (14.50) | 288 (17.02) | |
| Poor | 980 (19.51) | 647 (19.43) | 333 (19.68) | |
| Hypertension, n(%) | 0.094 | |||
| No | 3681 (73.30) | 2416 (72.55) | 1265 (74.76) | |
| Yes | 1341 (26.70) | 914 (27.45) | 427 (25.24) | |
| Diabetes, n(%) | 0.014 | |||
| No | 4711 (93.81) | 3104 (93.21) | 1607 (94.98) | |
| Yes | 311 (6.19) | 226 (6.79) | 85 (5.02) | |
| Hyperlipidemia, n(%) | 0.500 | |||
| No | 4512 (89.84) | 2985 (89.64) | 1527 (90.25) | |
| Yes | 510 (10.16) | 345 (10.36) | 165 (9.75) | |
| Kindey Diease, n(%) | 0.990 | |||
| No | 4716 (93.91) | 3127 (93.90) | 1589 (93.91) | |
| Yes | 306 (6.09) | 203 (6.10) | 103 (6.09) | |
| Heart Disease, n(%) | 0.219 | |||
| No | 4400 (87.61) | 2904 (87.21) | 1496 (88.42) | |
| Yes | 622 (12.39) | 426 (12.79) | 196 (11.58) | |
| Stroke, n(%) | 0.745 | |||
| No | 4911 (97.79) | 3258 (97.84) | 1653 (97.70) | |
| Yes | 111 (2.21) | 72 (2.16) | 39 (2.30) |
M: Median, Q₁: 1st Quartile, Q₃: 3st Quartile
Abbreviations: BMI, Body Mass Index; SBP, Systolic Blood Pressure; DBP, Diastolic Blood Pressure; BUN, Blood Urea Nitrogen; Cr, Creatinine; eGFR, Estimated Glomerular Filtration Rate at baseline; TC, Total Cholesterol; TG, Triglycerides; HDL, High-Density Lipoprotein; LDL, Low-Density Lipoprotein; CRP, C-reactive Protein; HbA1c, Hemoglobin A1c; UA, Uric Acid; PCV(Hct), Packed Cell Volume (Hematocrit); Hb, Hemoglobin; eGFR1, Estimated Glomerular Filtration Rate at endpoint; ΔeGFR, Change in Estimated Glomerular Filtration Rate (eGFR- eGFR1)
Model evaluation
Our study evaluated the ability of four machine learning techniques to predict the risk of renal function deterioration. The models assessed include Gradient Boosting, XGBoost, random forest, and adaptive boosting. Their performance was comprehensively evaluated based on accuracy, AUC values, sensitivity, specificity, positive predictive value, negative predictive value, precision, recall, and F1 score. On the training set, the AUC value of the Gradient Boosting Model.
reached as high as 0.8, significantly higher than that of the random forest (0.741), XGBoost (0.793), and AdaBoost (0.747) models, indicating its strong capability in distinguishing between rapid and non-rapid declines in renal function (See Table 2). Its accuracy was 0.736, with an F1 score of 0.64, leading among all models, suggesting that the model can effectively balance precise identification and comprehensive recall, neither missing positive cases nor making false positives. On the test set, the AUC value of Gradient Boosting Model was 0.765, only slightly lower than that of XGBoost model 0.762, but better than that of XGBoost model in accuracy (0.728) and F1 score (0.621) (accuracy 0.716, F1 score 0.613). This demonstrates that the Gradient Boosting Model not only fits well during training but also maintains good generalization performance when faced with new data, ensuring high reliability in prediction results. Compared with the performance of the combined training set and test set, the Gradient Boosting Model outperformed other models or was more advantageous than the XGBoost model with similar performance on several key indicators, making it a better choice for evaluating the risk of rapid decline in kidney function. The ROC curve (see Fig. 4) shows that among the models evaluated, the ROC curve of the Gradient Boosting model is notably closer to the upper left corner. Its AUC value is 0.765, which is higher than that of Random Forest (0.739), AdaBoost (0.758), and slightly exceeds that of XGBoost (0.762), clearly demonstrating its superior performance in distinguishing between positive and negative samples exhibiting rapidly declining renal function. The confusion matrix and decision curve analysis (Supplementary Fig S7 and S8) further corroborate the advantages of the Gradient Boosting model regarding classification accuracy and net clinical benefit, indicating that this model possesses good specificity and high sensitivity, thereby making it highly valuable for early clinical diagnosis and risk assessment.
Table 2.
Comparison of four machine learning models
| model_name | Accuracy | AUC | 95% CI | Sensitivity | Specificity | PPV | NPV | Precision | Recall | F1 | Threshold | Task |
|---|---|---|---|---|---|---|---|---|---|---|---|---|
| RandomForest | 0.73 | 0.741 | 0.7240–0.7572 | 0.523 | 0.836 | 0.618 | 0.775 | 0.618 | 0.523 | 0.567 | 0.342 | label-train |
| RandomForest | 0.73 | 0.739 | 0.7055–0.7728 | 0.555 | 0.82 | 0.61 | 0.783 | 0.61 | 0.555 | 0.581 | 0.315 | label-test |
| XGBoost | 0.721 | 0.793 | 0.7786–0.8081 | 0.721 | 0.721 | 0.567 | 0.836 | 0.567 | 0.721 | 0.635 | 0.315 | label-train |
| XGBoost | 0.716 | 0.762 | 0.7306–0.7941 | 0.667 | 0.742 | 0.568 | 0.814 | 0.568 | 0.667 | 0.613 | 0.323 | label-test |
| GradientBoosting | 0.736 | 0.8 | 0.7858–0.8146 | 0.695 | 0.757 | 0.593 | 0.83 | 0.593 | 0.695 | 0.64 | 0.318 | label-train |
| GradientBoosting | 0.728 | 0.765 | 0.7334–0.7970 | 0.661 | 0.763 | 0.586 | 0.815 | 0.586 | 0.661 | 0.621 | 0.328 | label-test |
| AdaBoost | 0.72 | 0.747 | 0.7309–0.7635 | 0.619 | 0.771 | 0.579 | 0.799 | 0.579 | 0.619 | 0.598 | 0.479 | label-train |
| AdaBoost | 0.722 | 0.758 | 0.7265–0.7904 | 0.617 | 0.776 | 0.584 | 0.799 | 0.584 | 0.617 | 0.6 | 0.479 | label-test |
Fig. 4.
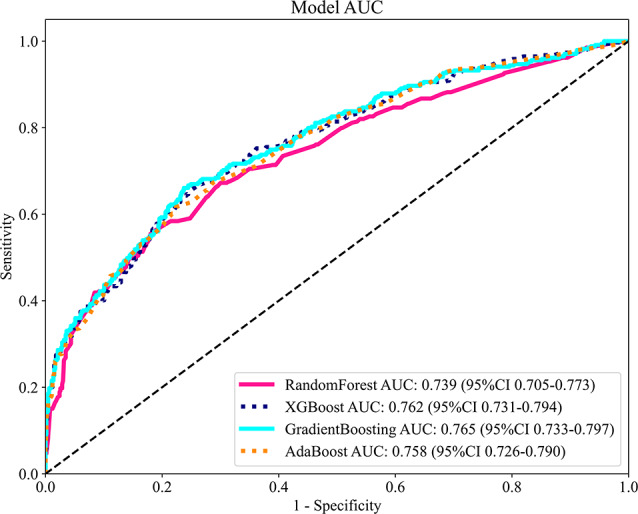
Comparison of ROC Curves and AUC Metrics for RandomForest, XGBoost, GradientBoosting, and AdaBoost Models
Analysis of feature importance and model interpretability
Among the 16 important features identified by the Gradient Boosting Model, eGFR is the most critical predictive factor, because eGFR itself is a key indicator to measure renal function (see Fig. 5a). Furthermore, the features are ranked in order of importance as follows: age, hemoglobin (Hb), blood glucose, systolic blood pressure (SBP), UA, and BUN. Figure 5b illustrates the impact of various features on the rapid decline in kidney function as identified by the Gradient Boosting Model. The results indicate that eGFR, age, SBP, and mean corpuscular volume (MCV) possess high SHAP values, positively correlating with the rapid decline in kidney function (higher feature values correspond to greater risk). Conversely, the SHAP values of Hb and other features are negative and relatively large in absolute value, negatively correlating with the rapid decline in kidney function (higher feature values correspond to lower risk). The SHAP values of the remaining features are close to zero, indicating no significant impact. Supplementary Fig S9 and S10 offer an in-depth perspective on model interpretability at the individual sample level. Although the feature influence pattern for the 150th sample differs from the overall trend, these figures aid in understanding the mechanism of features for specific individuals by displaying the SHAP values and contributions of each feature to the model output.
Fig. 5.

(a): Feature importance ranking by the Gradient Boosting Classifier model; (b): SHAP value distribution plot for features in the Gradient Boosting Classifier model
The ability of the model to stratify the risk of individual patients
To assess the model’s capacity to stratify individual risks, this study randomly selected four cases (Case 150: a 47-year-old female; Case 1249: a 54-year-old male; Case 1250: a 56-year-old female; Case 1375: a 71-year-old female) and visualized their decision-making processes using a waterfall chart and force plot (see Supplementary Fig S9 and S10). As shown in supplementary Fig S9, the baseline SHAP value was 0.277, and patients with a baseline value were more likely to experience rapid decline in renal function (e.g., f (x) = 0.28 at Case 1250 and f (x) = 0.578 at Case 1375). The SHAP value reflects the predictive characteristics of each patient and their influence on the prediction of rapid renal function decline. Specifically, in Case 1249 (a 54-year-old male with hypertension), the negative contributions of baseline eGFR (103.4 ml/min/1.73 m², SHAP = − 0.03), Hb (17.8 g/dL, SHAP = − 0.03), glucose (117.5 mg/dL, SHAP = − 0.02), and SBP (126 mmHg, SHAP = − 0.01) (blue) resulted in a predicted value (f(x) = 0.164) that was lower than the baseline, demonstrating the model’s capacity to balance traditional risk factors and protective indicators to avoid overestimating risk. In contrast, in Case 1375 (a 71-year-old female with multiple comorbidities), the baseline eGFR (113.4 ml/min/1.73 m², SHAP = + 0.09), advanced age (71 years, SHAP = + 0.09), UA (6.76 mg/dL, SHAP = + 0.06), Hb (13.6 g/dL, SHAP = + 0.06), and SBP) (157 mmHg, SHAP = + 0.05) (red) significantly increased the risk, illustrating how the model identifies high-risk patients by integrating multiple adverse factors. In Supplementary Fig S10, bold numbers represent probability predictions (f(x)), while the base values indicate predictions when the model receives no input. The value of f(x) represents the log odds ratio of the observed outcome. The red features on the left indicate an increased risk of rapid decline in renal function, whereas the blue features indicate a reduced risk; the longer the arrow, the greater the impact.
Regression analysis based on ΔeGFR
In this study, several regression analysis was Conducted to explore the factors related to ΔeGFR. Univariate linear regression analysis revealed significant correlations between ΔeGFR and several factors, including body weight, diastolic blood pressure (DBP), hematocrit, Hb, Cr, BUN, glucose, glycated hemoglobin (HbA1c), UA, and eGFR (P < 0.05; see Supplementary Table S5). Further multivariate linear regression analysis indicated that body weight, glucose, UA, Hb, Cr, and baseline eGFR were independently associated with ΔeGFR (P < 0.05; see Table 3). Notably, body weight was negatively correlated with ΔeGFR, whereas uric acid, creatinine, and baseline eGFR exhibited positive correlations with ΔeGFR. Variables such as blood urea nitrogen and glycated hemoglobin demonstrated no significant association with ΔeGFR in the multivariate model (P > 0.05). This study, through rigorous regression analysis, identified key factors influencing ΔeGFR, thereby providing a quantitative basis for investigating the mechanisms underlying renal function decline.
Table 3.
The results of multivariate linear regression analysis of each variable and ΔeGFR
| Variables | β | S.E | t | P | β (95%CI) |
|---|---|---|---|---|---|
| Intercept | -87.48 | 4.79 | -18.28 | < 0.001 | -87.48 (-96.86 ~ -78.10) |
| Weight | -0.10 | 0.03 | -3.18 | 0.001 | -0.10 (-0.16 ~ -0.04) |
| BUN | 0.11 | 0.07 | 1.50 | 0.135 | 0.11 (-0.03 ~ 0.26) |
| Glucose | -0.03 | 0.01 | -2.80 | 0.005 | -0.03 (-0.06 ~ -0.01) |
| HbA1c | -0.89 | 0.52 | -1.71 | 0.087 | -0.89 (-1.90 ~ 0.13) |
| UA | 1.19 | 0.30 | 3.92 | < 0.001 | 1.19 (0.60 ~ 1.79) |
| Hb | -1.11 | 0.15 | -7.61 | < 0.001 | -1.11 (-1.39 ~ -0.82) |
| Cr | 43.97 | 3.26 | 13.48 | < 0.001 | 43.97 (37.58 ~ 50.37) |
| eGFR | 0.76 | 0.02 | 40.51 | < 0.001 | 0.76 (0.72 ~ 0.79) |
| Heart Disease | |||||
| No | 0.00 (Ref) | ||||
| Yes | 1.45 | 0.94 | 1.55 | 0.122 | 1.45 (-0.39 ~ 3.29) |
CI: Confidence Interval
Analysis of ΔeGFR distribution based on model prediction grouping
To further investigate the relationship between the machine learning model-predicted “rapid kidney function decline” group and ΔeGFR, we plotted box plots and conducted the Mann-Whitney U test. In the box plot (see Supplementary Fig S11), the median ΔeGFR of the “rapid kidney function decline” group was significantly higher than that of the “no rapid kidney function decline” group, suggesting that ΔeGFR changes were more pronounced in the predicted rapid kidney function decline group. Furthermore, the Mann-Whitney U test results (see supplementary Table S6 and S7) showed P = 0.000, indicating a highly significant difference in the distribution of ΔeGFR between the different “rapid kidney function decline” groups (P < 0.001). This result supports the effectiveness of the model classification in reflecting real changes in kidney function decline.
Discussion
Our research utilized dataset from the CHARLS gathered from 2011 to 2015, employing advanced machine learning techniques, particularly Gradient Boosting algorithms, to predict the likelihood of rapid decline in kidney function among middle-aged and elderly populations. Feature selection was performed via lasso regression analysis to identify key variables significantly influencing kidney function decline prediction. Based on these variables, we trained and validated four machine learning models-gradient-boosted trees, XGBoost, random forest, and AdaBoost. We optimized model hyperparameters using five-fold cross-validation and grid search to enhance predictive accuracy. The results showed that the gradient-boosted trees model performed reliably in both training and test sets, achieving an AUC of 0.8 in the training set and 0.765 in the test set. The model identified 16 predictors, ranked by importance: eGFR, age, Hb, glucose, SBP, UA. To further investigate the associations between variables and rapid kidney function decline, we analyzed ΔeGFR as a continuous outcome. Multivariate linear regression analysis showed significant associations between factors such as body weight, blood glucose, uric acid, hemoglobin, creatinine, eGFR, and cardiovascular disease with changes in eGFR. Notably, blood glucose, uric acid, hemoglobin, and eGFR were also identified as important features in the machine learning model, which enhanced the reliability of the research findings to some extent.
From the perspective of predictive performance, the Gradient Boosting model demonstrated the best performance, attaining an AUC value of 0.8 on the training set and 0.765 on the test set, with accuracy rates of 0.736 and 0.728 for the train and test sets, respectively. In contrast, Lee et al.‘s XGBoost model [26], developed in a diabetic CKD population, reported a higher test set AUC (0.826). This discrepancy may stem from differences in study population and outcome definition: our study included a broader middle-aged and elderly cohort (encompassing non-diabetic and non-CKD individuals), whereas Lee et al. focused on a high-risk subgroup of diabetic nephropathy (event rate: 13.1%), which exhibits greater population homogeneity. Additionally, their threshold for defining ‘rapid decline’ was stricter (≥ 5 mL/min/1.73 m²annual eGFR decrease vs ≥ 3mL/min/1.73 m²in this study). Despite the marginally lower AUC, our model demonstrates broader generalizability and can serve as an early screening tool for undiagnosed diabetes or CKD populations, whereas Lee’s model is better suited for fine stratification of high-risk patients. As a typical representative of ensemble learning, the gradient boosting model can effectively identify key features and automatically capture complex nonlinear interactions [38]. Through regularization techniques and appropriate parameter tuning, overfitting was mitigated [39]. This study further employed SHAP value analysis to quantify the contribution of each feature. Specifically, baseline GFR, age, SBP, MCV, UA, BUN, and stroke were significantly positively associated with the risk of rapid kidney function deterioration. Conversely, higher Hb and glucose levels were significantly associated with a reduced risk of rapid decline (Fig. 5b). Supplementary Fig S9 and S10 illustrate individual-level SHAP value distributions, which highlight the heterogeneity of feature effects and suggest that clinical decisions should consider both population patterns and individual differences. Lee et al. similarly applied SHAP analysis but extended this by quantifying intervention thresholds such as SBP > 120 mmHg and HbA1c > 6.5% through individual conditional expectation (ICE) plots and copula simulation techniques, providing more specific targets for clinical action.
eGFR is a key indicator for assessing kidney function and is strongly associated with its decline. The prognostic significance of age and SBP has been widely validated across diverse populations. Studies have shown that eGFR in healthy adults exhibits a steady downward trend with increasing age, averaging 0.75–1.0 mL/min/1.73 m² per year, consistent with physiological renal aging in healthy individuals [40]. Additionally, the impact of elevated SBP on kidney function is particularly pronounced in elderly patients with isolated hypertension [41], a finding corroborated in Lee et al.‘s diabetic nephropathy cohort. Notably, the synergistic effect of smoking and SBP on renal vasculature may exacerbate kidney function deterioration [42], underscoring the importance of blood pressure management and lifestyle interventions in older populations. Beyond age and SBP, multiple studies have demonstrated predictive utility for metabolic markers such as glucose, Hb, and serum uric acid (SUA ≥ 6.0 mg/dL) [43, 44], which is consistent with the findings of this study. Furthermore, BUN, a product of nitrogen metabolism, is independently associated with adverse renal outcomes irrespective of eGFR [45], further justifying the inclusion of multidimensional biomarkers in risk assessment frameworks. The consistent identification of these factors across diverse study designs provides a robust theoretical foundation for developing cross-population predictive models [46–49].
The innovations of this study are reflected in the following aspects: First, it applies machine learning methods to predict the rapid decline in kidney function among middle-aged and elderly individuals in China. In comparison to traditional statistical methods, this technology efficiently processes multi-dimensional data, including age, metabolic indicators, and blood parameters, thereby accurately capturing the nonlinear and complex relationships between variables [50]. Second, the study explores the treatment of dynamic changes in kidney function, ΔeGFR, as continuous variables, employing linear regression models for quantitative analysis to accurately quantify the specific impacts of factors such as body weight, blood glucose, and hemoglobin on changes in kidney function. Additionally, the study employs a comprehensive array of visualization tools, including histograms, scatter plots, and box-and-whisker diagrams, to present data characteristics from multiple dimensions. Through visual analysis, the study clearly demonstrates the distribution patterns of key predictive factors, the ranking of variable importance, and differences in indicators across varying kidney function states. This intuitive presentation facilitates researchers in identifying potential data patterns and provides clinicians with a clear reference for understanding complex risk factors, thereby aiding in the translation of research findings into practical evaluation tools.
This study and the research by Lee et al. [26]both utilized single-cohort approaches (CHARLS versus the Korean Diabetic Nephropathy Specialist Cohort) to develop machine learning models, with rigorous cross-validation employed to ensure internal validity. However, there are notable differences in the target populations and methodological designs. Our study included an unfiltered cohort of middle-aged and elderly individuals, encompassing both non-diabetic and non-chronic kidney disease subjects, with the primary aim of facilitating early screening at the community level. In contrast, Lee et al. focused on high-risk subgroups with diabetes duration of ≥ 5 years, targeting the precise prediction of end-stage kidney disease (ESKD) risk. Regarding outcome definition, we defined rapid renal function decline as an eGFR decrease of ≥ 3 mL/min/1.73 m² per year, emphasizing the identification of early intervention opportunities. Lee et al., however, combined short-term eGFR decline (≥ 5 mL/min/1.73 m² per year) with long-term ESKD events and established a risk-outcome association through survival analysis (HR = 1.82, 95% CI 1.17–2.83). In terms of feature integration, both studies identified the core predictive roles of age, SBP, and metabolic indicators (such as blood glucose and uric acid), further confirming their importance across different populations. The differences lie in the fact that Lee et al. included specialized indicators such as proteinuria and HbA1c, while our study covered basic blood parameters such as MCV and BUN, reflecting the characteristics of “general screening” and “specialized precision screening,” respectively. In summary, Lee et al. quantified intervention thresholds (e.g., a 39% risk increase when SBP > 120 mmHg) through time-dependent AUC (0.826) and individual conditional expectation plots. Their dynamic modeling strategy complements the static prediction framework of this study methodologically, collectively expanding the application dimensions of machine learning in kidney function prediction.
This study has certain limitations. First, the data from 2011 to 2015 have limited timeliness and cannot fully reflect recent health changes or emerging risk factors of the participants. Second, unmeasured confounding factors, such as medication use, may affect the accuracy of predictions. This is mainly due to the broad range of drug assessment categories in the CHARLS dataset (for example, whether traditional Chinese medicine, Western medicine, or other methods are used for treating hypertension/diabetes), which fails to capture specific drug names, dosages, or whether there is nephrotoxicity. Additionally, this study was only validated within the CHARLS dataset and not in different external populations, which may reduce the model’s general applicability.
Conclusion
This study developed a model to predict rapid decline in kidney function among middle-aged and elderly people in China using the CHARLS dataset combined with advanced machine learning techniques. By identifying key risk factors, the model helps to identify high-risk individuals with rapidly declining kidney function early on. This allows for early personalized care interventions to reduce the prevalence of chronic kidney disease and slow the deterioration of kidney function, thereby improving health and quality of life for middle-aged and elderly populations.
Electronic supplementary material
Below is the link to the electronic supplementary material.
Acknowledgements
We would like to express our gratitude to the CHARLS team for their diligent efforts and selfless sharing of survey data.
Abbreviations
- ML
Machine learning
- CHARLS
China Health and Retirement Longitudinal Study
- LASSO
Least Absolute Shrinkage and Selection Operator
- SHAP
SHapley Additive exPlanations
- eGFR
Estimated glomerular filtration rate
- Hb
Hemoglobin
- SBP
Systolic blood pressure
- AKI
Acute kidney injury
- ESKD
End-stage kidney disease
- CKD
Chronic kidney disease
- HRS
Health and Retirement Study
- PPS
Probability Proportional to Size
- GDP
Gross Domestic Product
- STROBE
Strengthening the Reporting of Observational Studies in Epidemiology
- MDRD
The Modification of Diet in Renal Disease
- ΔeGFR
The difference between baseline eGFR and endpoint eGFR
- HDL
High density lipoprotein
- CRP
C-reactive protein
- UA
Uric acid
- BUN
Blood urea nitrogen
- TC
Total cholesterol
- TG
Triglycerides
- LDL
Low-density lipoprotein
- BMI
Body Mass Index
- VIF
Variance inflation factors
- AUC
Area under the curve
- DCA
Decision curve analysis
- ROC
Receiver operating characteristic
- PPV
Positive predictive value
- NPV
Negative predictive value
- IQR
Interquartile range
- XGBoost
eXtreme Gradient Boosting
- GB
Gradient Boosting
- RF
Random Forest
- AdaBoost
Adaptive Boosting
- CI
Confidence interval
- MCV
Mean corpuscular volume
- DBP
Diastolic blood pressure
- HbA1c
Glycated hemoglobin
- PCV
Hematocrit
- SUA
Serum uric acid
- ICE
Individual conditional expectation
Author contributions
Y.L.: Methodology, Writing-Original Draft; K.Z: Data Curation; Y.W., Y.Z., J.Z.: Formal analysis; F.T., L.P.: Conceptualization; W.Z.: Supervision; X.L.: Funding acquisition; L.D.: Writing-Review & Editing. Allauthors reviewed the manuscript.
Funding
This work was supported by the Deng Lili’s Health and Chronic Disease Management Studies (No. A1-2601-24-415-120Z154), the clinical translational research of Chuan Hong Tongluo Gel Patch for protecting autologous arteriovenous fistulas (No. 2023KT16934), and the development and application of traditional Chinese medicine tea bags for the prevention and treatment of IgA nephropathy based on the pharyngeal-kidney correlation theory (No. 2022KT1392).
Data availability
The datasets supporting the conclusions of this article are available publicly, http://charls.pku.edu.cn/en/.
Declarations
Ethics approval and consent to participate
All experiments involving human data in this study were performed in strict accordance with the ethical guidelines and relevant regulations. The data used in this research was sourced from the China Health and Retirement Longitudinal Study (CHARLS). CHARLS is a longitudinal survey representing the population aged 45 and above in the Chinese mainland. This study was ethically reviewed and approved by the Biomedical Ethics Review Committee of Peking University in accordance with the principles of the Declaration of Helsinki. The approval number is IRB00001052-11015. All respondents signed informed consent forms, fully protecting the rights and interests of the participants, and the data were only used for relevant analyses in this study.
Consent for publication
Not applicable.
Competing interests
The authors declare no competing interests.
Footnotes
Publisher’s note
Springer Nature remains neutral with regard to jurisdictional claims in published maps and institutional affiliations.
Contributor Information
Xusheng Liu, Email: liuxusheng@gzucm.edu.cn.
Lili Deng, Email: denglili@gzucm.edu.cn.
References
- 1.Zhang W, Zhang Y, Wang J. Effect and mechanism of reading habits on physical and mental health among the elderly: evidence from China. Front Public Health. 2022;10:1031939. [DOI] [PMC free article] [PubMed] [Google Scholar]
- 2.Xingwei W, Huan C, Mengting L, Lv Q, Jiaying Z, Enwu L, et al. A machine learning-based risk warning platform for potentially inappropriate prescriptions for elderly patients with cardiovascular disease. Front Pharmacol. 2022;13:804566. [DOI] [PMC free article] [PubMed] [Google Scholar]
- 3.Beard JR, Bloom DE. Towards a comprehensive public health response to population ageing. Lancet. 2015;385:658–61. [DOI] [PMC free article] [PubMed] [Google Scholar]
- 4.Fang EF, Scheibye-Knudsen M, Jahn HJ, Li J, Ling L, Guo H, et al. A research agenda for aging in China in the 21st century. Ageing Res Rev. 2015;24:197–205. [DOI] [PMC free article] [PubMed] [Google Scholar]
- 5.Yu Q, Zuo G. Relationship of indoor solid fuel use for cooking with blood pressure and hypertension among the elderly in China. Environ Sci Pollut Res. 2022;29:53444–55. [DOI] [PMC free article] [PubMed] [Google Scholar]
- 6.Ren Y, Tong E, Di C, Zhang Y, Xu L, Tan X, et al. Association between ABCA1 gene polymorphisms and the risk of hypertension in the Chinese Han population. Front Public Health. 2022;10:878610. [DOI] [PMC free article] [PubMed] [Google Scholar]
- 7.Nie Y, Ma Y, Li X, Wu Y, Liu W, Tan Z, et al. PA during the COVID-19 outbreak in china: a cross-sectional study. Neural Comput Applic. 2023;35:13739–54. [DOI] [PMC free article] [PubMed] [Google Scholar]
- 8.Wang X, Huang Z, Xu T, Li Y, Qin X. Exploring the future design approach to ageing based on the double diamond model. Systems. 2023;11(8):404. [Google Scholar]
- 9.O’Sullivan ED, Hughes J, Ferenbach DA. Ren Aging: Causes Consequences JASN. 2017;28(2):407–20. [DOI] [PMC free article] [PubMed] [Google Scholar]
- 10.Kim JY, Joo YS, Jhee JH, Han SH, Yoo T-H, Kang S-W, et al. Effect of psychosocial distress on the rate of kidney function decline. J GEN INTERN MED. 2021;36:2966–74. [DOI] [PMC free article] [PubMed] [Google Scholar]
- 11.Zhang Z, He P, Liu M, Zhou C, Liu C, Li H, et al. Association of depressive symptoms with rapid kidney function decline in adults with normal kidney function. Clin J Am Soc Nephrol. 2021;16(6):889–97. [DOI] [PMC free article] [PubMed] [Google Scholar]
- 12.Xu H, Garcia-Ptacek S, Trevisan M, Evans M, Lindholm B, Eriksdotter M, et al. Kidney function, kidney function decline, and the risk of dementia in older adults: A Registry-Based study. Neurology. 2021;96(24):e2956–65. [DOI] [PMC free article] [PubMed] [Google Scholar]
- 13.Coresh J, Turin TC, Matsushita K, Sang Y, Ballew SH, Appel LJ, et al. Decline in estimated glomerular filtration rate and subsequent risk of End-Stage renal disease and mortality. JAMA. 2014;311(24):2518–31. [DOI] [PMC free article] [PubMed] [Google Scholar]
- 14.Derebail VK, Zhou Q, Ciccone EJ, Cai J, Ataga KI. Rapid decline in estimated glomerular filtration rate is common in adults with sickle cell disease and associated with increased mortality. Br J Haematol. 2019;186(6):900–7. [DOI] [PMC free article] [PubMed] [Google Scholar]
- 15.Rajula HSR, Verlato G, Manchia M, Antonucci N, Fanos V. Comparison of conventional statistical methods with machine learning in medicine: diagnosis, drug development, and treatment. Medicina. 2020;56(9):455. [DOI] [PMC free article] [PubMed] [Google Scholar]
- 16.Mouchabac S, Leray P, Adrien V, Gollier-Briant F, Bonnot O. Prevention of suicidal relapses in adolescents with a smartphone application: bayesian network analysis of a preclinical trial using in Silico patient simulations. J Med Internet Res. 2021;23(9):e24560. [DOI] [PMC free article] [PubMed] [Google Scholar]
- 17.Barah M, Mehrotra S. Predicting kidney discard using machine learning. Transplantation. 2021;105(9):2054–71. [DOI] [PMC free article] [PubMed] [Google Scholar]
- 18.Tolstyak Y, Zhuk R, Yakovlev I, et al. The ensembles of machine learning methods for survival predicting after kidney transplantation. Appl Sci. 2021;11(21):10380. [Google Scholar]
- 19.Ferguson T, Ravani P, Sood MM, et al. Development and external validation of a machine learning model for progression of CKD. KIDNEY INT REP. 2022;7(8):1772–81. [DOI] [PMC free article] [PubMed] [Google Scholar]
- 20.Chen Y, Shen X, Li G, et al. Association between aldehyde exposure and kidney stones in adults. Front Public Health. 2022;10:978338. [DOI] [PMC free article] [PubMed] [Google Scholar]
- 21.Kuo C-C, Chang C-M, Liu K-T, Lin W-K, Chiang H-Y, Chung C-W, et al. Automation of the kidney function prediction and classification through ultrasound-based kidney imaging using deep learning. Npj Digit Med. 2019;2(1):29. [DOI] [PMC free article] [PubMed] [Google Scholar]
- 22.Dong J, Feng T, Thapa-Chhetry B, Cho BG, Shum T, Inwald DP, et al. Machine learning model for early prediction of acute kidney injury (AKI) in pediatric critical care. Crit Care. 2021;25(1):288. [DOI] [PMC free article] [PubMed] [Google Scholar]
- 23.Chaudhary K, Vaid A, Duffy Á, Paranjpe I, Jaladanki S, Paranjpe M, et al. Utilization of deep learning for subphenotype identification in Sepsis-Associated acute kidney injury. CJASN. 2020;15(11):1557–65. [DOI] [PMC free article] [PubMed] [Google Scholar]
- 24.Segal Z, Kalifa D, Radinsky K, et al. Machine learning algorithm for early detection of end-stage renal disease. BMC NEPHROL. 2020;21:1–10. [DOI] [PMC free article] [PubMed] [Google Scholar]
- 25.Tsai M-H, Jhou M-J, Liu T-C, Fang Y-W, Lu C-J. An integrated machine learning predictive scheme for longitudinal laboratory data to evaluate the factors determining renal function changes in patients with different chronic kidney disease stages. Front Med. 2023;10:1155426. [DOI] [PMC free article] [PubMed] [Google Scholar]
- 26.Lee WV, Song Y, Chun JS, Ko M, Jang HY, Kim I-W, et al. Development of a machine learning model for precision prognosis of rapid kidney function decline in people with diabetes and chronic kidney disease. Diabetes Res Clin Pract. 2024;217:111897. [DOI] [PubMed] [Google Scholar]
- 27.Han S, Xu Y, Wang Y. Association between pulmonary function and rapid kidney function decline: a longitudinal cohort study from CHARLS. BMJ Open Resp Res. 2024;11:e002107. [DOI] [PMC free article] [PubMed] [Google Scholar]
- 28.Wang Y, Zhang M, Wang X, Liu S, Ding H. Correlates of cognitive impairment in the elderly in china: A cross-sectional study. Front Public Health. 2022;10:973661. [DOI] [PMC free article] [PubMed] [Google Scholar]
- 29.Zhao Y, Mahal AS, Tang S, Haregu TN, Oldenburg B. Effective coverage for hypertension treatment among middle-aged adults and the older population in china, 2011 to 2013: A nationwide longitudinal study. J GLOB HEALTH. 2020;10:010805. [DOI] [PMC free article] [PubMed] [Google Scholar]
- 30.Zhao Y, Strauss J, Yang G et al. China health and retirement longitudinal study–2011–2012 national baseline users’ guide. Beijing: National School of Development, Peking University. 2013;2:1–56.
- 31.Chen X, Crimmins E, Hu P, et al. Venous blood-based biomarkers in the China health and retirement longitudinal study: rationale, design, and results from the 2015 wave. Am J Epidemiol. 2019;188(11):1871–7. [DOI] [PMC free article] [PubMed] [Google Scholar]
- 32.Von Elm E, Altman DG, Egger M, Pocock SJ, Gøtzsche PC, Vandenbroucke JP. The strengthening the reporting of observational studies in epidemiology (STROBE) statement: guidelines for reporting observational studies. Lancet. 2007;370:1453–7. [DOI] [PubMed] [Google Scholar]
- 33.Ma Y-C, Zuo L, Chen J-H, Luo Q, Yu X-Q, Li Y, et al. Modified glomerular filtration rate estimating equation for Chinese patients with chronic kidney disease. J Am Soc Nephrol. 2006;17:2937–44. [DOI] [PubMed] [Google Scholar]
- 34.Blazek K, van Zwieten A, Saglimbene V, Teixeira-Pinto A. A practical guide to multiple imputation of missing data in nephrology. Kidney Int. 2021;99(1):68–74. [DOI] [PubMed] [Google Scholar]
- 35.Han L, Askari M, Altman RB, Schmitt SK, Fan J, Bentley JP, Narayan SM, Turakhia MP. Atrial fibrillation burden signature and Near-Term prediction of stroke: A machine learning analysis. Circ Cardiovasc Qual Outcomes. 2019;12(10):e005595. [DOI] [PMC free article] [PubMed] [Google Scholar]
- 36.Lin T, Peng S, Lu S, Fu S, Zeng D, Li J, Chen T, Fan T, Lang C, Feng S, Ma J, Zhao C, Antony B, Cicuttini F, Quan X, Zhu Z, Ding C. Prediction of knee pain improvement over two years for knee osteoarthritis using a dynamic nomogram based on MRI-derived radiomics: a proof-of-concept study. Osteoarthritis Cartilage. 2023;31(2):267–78. [DOI] [PubMed] [Google Scholar]
- 37.Guan C, Gong A, Zhao Y, Yin C, Geng L, Liu L, Yang X, Lu J, Xiao B. Interpretable machine learning model for new-onset atrial fibrillation prediction in critically ill patients: a multi-center study. Crit Care. 2024;28(1):349. [DOI] [PMC free article] [PubMed] [Google Scholar]
- 38.Oh SW, Byun SS, Kim JK, Jeong CW, Kwak C, Hwang EC, Kang SH, Chung J, Kim YJ, Ha YS, Hong SH. Machine learning models for predicting the onset of chronic kidney disease after surgery in patients with renal cell carcinoma. BMC Med Inf Decis Mak. 2024;24(1):85. [DOI] [PMC free article] [PubMed] [Google Scholar]
- 39.Hirst JA, Taal MW, Fraser SD, Mena JMO, O’Callaghan CA, McManus RJ, Taylor CJ, Yang Y, Ogburn E, Hobbs FR. Change in glomerular filtration rate over time in the Oxford renal cohort study: observational study. Br J Gen Pract. 2022;72(717):e261–8. [DOI] [PMC free article] [PubMed] [Google Scholar]
- 40.Xu L, Yu C, Chen A, Li C, Mao Y. Longitudinal analysis of renal function changes in elderly populations: health status evaluation and risk factor assessment. Clin Interv Aging. 2024;19:1217–24. [DOI] [PMC free article] [PubMed] [Google Scholar]
- 41.Young JH, Klag MJ, Muntner P, Whyte JL, Pahor M, Coresh J. Blood pressure and decline in kidney function: findings from the systolic hypertension in the elderly program (SHEP). J Am Soc Nephrol. 2002;13(11):2776–82. [DOI] [PubMed] [Google Scholar]
- 42.Hernesniemi JA, Mahdiani S, Tynkkynen JA, et al. Extensive phenotype data and machine learning in prediction of mortality in acute coronary syndrome - the MADDEC study. Ann Med. 2019;51(2):156–63. [DOI] [PMC free article] [PubMed] [Google Scholar]
- 43.Oh IH, Choi JW, Lee CH, et al. Estimating negative effect of abdominal obesity on mildly decreased kidney function using a novel index of Body-Fat distribution. J Korean Med Sci. 2017;32(4):613–20. [DOI] [PMC free article] [PubMed] [Google Scholar]
- 44.Tseng WC, Chen YT, Lin YP, Ou SM, Yang CY, Lin CH, Tarng DC. Taiwan geriatric kidney disease (TGKD) research group. Hyperuricemia predicts an early decline in renal function among older people: A Community-Based cohort study. Sci Rep. 2019;9(1):980. [DOI] [PMC free article] [PubMed] [Google Scholar]
- 45.Seki M, Nakayama M, Sakoh T, Yoshitomi R, Fukui A, Katafuchi E, Tsuda S, Nakano T, Tsuruya K, Kitazono T. Blood Urea nitrogen is independently associated with renal outcomes in Japanese patients with stage 3–5 chronic kidney disease: a prospective observational study. BMC Nephrol. 2019;20(1):115. [DOI] [PMC free article] [PubMed] [Google Scholar]
- 46.Wei C, Zhang L, Feng Y, Ma A, Kang Y. Machine learning model for predicting acute kidney injury progression in critically ill patients. BMC Med Inf Decis Mak. 2022;22(1):17. [DOI] [PMC free article] [PubMed] [Google Scholar]
- 47.Yue S, Li S, Huang X, Liu J, Hou X, Zhao Y, et al. Machine learning for the prediction of acute kidney injury in patients with sepsis. J Transl Med. 2022;20(1):215. [DOI] [PMC free article] [PubMed] [Google Scholar]
- 48.Bai Q, Su C, Tang W, Li Y. Machine learning to predict end stage kidney disease in chronic kidney disease. Sci Rep. 2022;12(1):8377. [DOI] [PMC free article] [PubMed] [Google Scholar]
- 49.Ferguson T, Ravani P, Sood MM, Clarke A, Komenda P, Rigatto C, et al. Development and external validation of a machine learning model for progression of CKD. Kidney Int Rep. 2022;7(8):1772–81. [DOI] [PMC free article] [PubMed] [Google Scholar]
- 50.Kasim S, Malek S, Song C, Wan Ahmad WA, Fong A, Ibrahim KS, Safiruz MS, Aziz F, Hiew JH, Ibrahim N. In-hospital mortality risk stratification of Asian ACS patients with artificial intelligence algorithm. PLoS ONE. 2022;17(12):e0278944. [DOI] [PMC free article] [PubMed] [Google Scholar]
Associated Data
This section collects any data citations, data availability statements, or supplementary materials included in this article.
Supplementary Materials
Data Availability Statement
The datasets supporting the conclusions of this article are available publicly, http://charls.pku.edu.cn/en/.