

Abstract
Biopolymer blends (GGs) derived from renewable plant or animal‐based raw materials, hold significant potential for competing in the packaging industry by offering environmentally biodegradable and bioresorbable alternatives. One of the main challenges lies in optimizing the mechanical properties to enhance stress transfer between active additives and the gelatin matrices reinforced with modified SiO₂ compounds. In this study, a 5 °C increase in the glass transition temperature and a fourfold improvement in tensile strength (reaching 12 MPa) were achieved by incorporating hydrophilic SiO₂ nanoclay. Ion distribution maps visualized the interactions between silicon derivatives and polypeptide domains within the gel matrix, revealing increased stability attributed to ions such as Si+, SiO+, SiH+, and SiHO+. The absence of heavy metals in the blends underscores their potential as environmentally friendly and sustainable packaging solutions, with promising applications in sectors such as medical packaging.
Keywords: bioplastics, gelatin blends, nanoclay, hydrophilic bentonite, GG75‐PVA
Biodegradable gelatin‐based gel blends reinforced with SiO₂ and nanoclay exhibit enhanced mechanical strength, thermal stability, and ion‐mediated structural integrity. These metal‐free, eco‐friendly materials open new opportunities for sustainable packaging.

1. Introduction
Polymeric materials offer a wide range of properties crucial for current and future applications, including their use in the packaging industry.[ 1 ] While plastics such as polyethylene, polypropylene, and polyvinyl chloride have been widely adopted due to their ease of processing, low cost, and versatile properties, their environmental impact remains a significant drawback. Synthetic polymers are particularly problematic in single‐use and short‐term applications due to their prolonged degradation times and the release of harmful compounds upon improper disposal, such as in landfills.[ 2 , 3 , 4 ] As a result, there is a growing demand for environmentally friendly alternatives that combine biodegradability with satisfactory physicochemical properties.[ 5 , 6 ] Biodegradable biopolymers, such as starch and gelatin, are promising solutions for sustainable packaging materials. Derived from renewable natural sources, these materials can degrade naturally, thereby reducing environmental harm.[ 7 , 8 , 9 ]
Gelatin, a biopolymer sourced from renewable animal‐based resources, can be extracted under various conditions, with modifications to extraction methods aimed at reducing its environmental impact.[ 10 , 11 , 12 , 13 , 14 , 15 ] Bioplastics, made from plant‐based or animal‐based biopolymers, offer both biodegradability and renewability, but often require specialized processing techniques. Alternatives to petroleum‐based plastics, such as PLA (polylactic acid) and PHA (polyhydroxyalkanoates), are gaining attention due to their ecological properties and potential for packaging applications.[ 16 , 17 , 18 , 19 , 20 ] Biodegradable biopolymers, including polysaccharides, polypeptides, and lipids, are naturally occurring materials with a wide range of applications.[ 16 , 17 , 18 , 19 , 20 , 21 , 22 , 23 ]
Gelatin, in particular, is an animal‐derived biopolymer known for its strong gelling properties, film‐forming ability, and versatility across various applications. It is obtained from collagen, primarily sourced from animal skin and bones, and demonstrates excellent functional properties, making it a valuable material for bioplastics.[ 24 , 25 , 26 , 27 ] Recent studies have explored biopolymer blends to improve their mechanical and thermal properties. One promising approach involves incorporating silica (SiO₂), which can enhance the strength and stability of the material. Silica, an abundant natural material, forms strong bonds with biopolymers, thereby improving their durability without introducing harmful components.[ 28 , 29 ] Silica‐modified gelatin composites have already shown potential in tissue engineering and other biomedical applications where structural integrity and bioactivity are essential.[ 30 , 31 ] Additionally, recent studies suggest that such hybrid materials can be processed into scaffolds with tailored properties depending on the degree of crosslinking and silica content.[ 32 , 33 ]
Furthermore, silane‐based organosilicon compounds, such as 3‐(Triethoxysilyl)propyl isocyanate and 3‐(glycidyloxypropyl)trimethoxysilane, have been used to couple gelatin, producing colloidal nanoparticles with magnetic properties.[ 34 ] These hybrids exhibit thermosensitive properties, making them suitable for biomedical applications such as controlled drug release. This method is also used to coat magnetic iron oxide nanoparticles, enhancing their functionality with magnetic properties.
While the integration of SiO₂ into biopolymer matrices is not a new concept, there remains a gap in understanding the specific impact of different ionized forms of silicon on the properties of gelatin‐based biopolymers. Previous studies have primarily focused on the general effect of silica on biopolymers without thoroughly addressing the detailed mechanisms behind these interactions and their influence on biodegradability, mechanical performance, and potential applications in packaging or medicine. This study aims to address this gap by investigating the modification of gelatin matrices with various forms of silicon and evaluating the resulting changes in their physicochemical properties. By enhancing the mechanical strength and biodegradability of gelatin‐based materials, this research aims to provide an innovative solution for sustainable packaging and other applications where environmental impact and performance are critical.
2. Results and Discussion of Blend
2.1. Tensile Strength, Relative Elongation at Break, and Shore Hardness Scale
The systems based on a gelatin matrix proposed in this work contained the addition of silicas: Arsil, Aerosil, and Nanobent due to their different origins and different chemical structures (Table 1). The optimization of the composition of gelatin composites was carried out based on the experimental planning algorithm, which included defining variables such as gelatin concentration, Poly(vinyl alcohol) (PVA) concentration, SiO2 concentration, taking into account the introduction of a plasticizer – glycerin, and temperature parameters of the drying‐crosslinking process. The structure of an exemplary macromolecule of the gel material is shown in Figure 1a, while Figure 1b illustrates the key processing parameters of the final product in the form of dumbbells—a potential shape of samples intended for further physicochemical studies. The first of Arsil is a hydrated, amorphous form of silicon dioxide (SiO₂), which was precipitated in an aqueous medium from solutions containing silicon salts. Next, Aerosil is colloidal silica produced in the process of flame hydrolysis of silicon tetrachloride, which gives it very high purity. However, the third Nanobent contains crystalline layers of silicates such as montmorillonite, referred to as nanoclay, characterized by very small particle sizes and may have unique properties such as high specific surface area or adsorption capacity. The assessment of the impact on the mechanical properties of silicon compounds introduced into the gel matrices was demonstrated based on the parameters of tensile strength, elongation at break and hardness measurements.[ 35 ]
Table 1.
Substrates given in parts by weight (PBW) used to synthesize biopolymeric matrixes.
| Ingredients | |||||||
|---|---|---|---|---|---|---|---|
| Sample symbol | Gelatin (PBW) | Glycerine (PBW) | Water (PBW) | PVA (PBW) | AEROSIL (PBW) | ARSIL (PBW) | NANOBENT (PBW) |
| GG75 | 75 | 25 | 100 | 0 | – | – | – |
| GG75.AEROSIL | 5 | – | – | ||||
| GG75.ARSIL | – | 5 | – | ||||
| GG75.NANOBENT | – | – | 5 | ||||
| GG75PVA | 5 | – | – | – | |||
| GG75PVA.AEROSIL | 5 | – | – | ||||
| GG75PVA.ARSIL | – | 5 | – | ||||
| GG75PVA.NANOBENT | – | – | 5 | ||||
Note: To all samples dyes were added: Cochineal red (E124) A (pas 4R); Quinoline yellow (E104) (0.01–0.02%).
Figure 1.

a) Structure of the gelatin matrix macromolecule; b) Parameters of the gelatin matrix production process and the external appearance of “paddle‐shaped” samples with the type of dye introduced (Cochineal red A & Quinoline yellow); c) Stress‐relative elongation curves for exemplary polymer blends.
The tensile strength T Sb and relative elongation at break E b of the biopolymer samples with GG75 matrix are presented in Table 2 and Figure 1c. The results for breaking strength indicate that the addition of PVA improved the properties of the samples. Significantly higher values of stress in relation to elongation were obtained for systems containing PVA, which is visible in the stress‐relative elongation curves (Figure 1c). This generates smaller, permanent plastic deformations in the case of systems containing PVA. Therefore, the material ceases to be elastic and begins to behave plastically. Scientists Walley and Field[ 36 , 37 ] observed a range of material reactions depending on the structure of the polymer. The relationship between the stresses occurring in the case of a given force and the mechanical response of the polymer will depend on its structure and the share of, for example, the amorphous phase in glassy polymers or the share of the crystalline phase in semi‐crystalline polymers.
Table 2.
Mechanical test results: tensile strength T Sb, elongation at break E b, and hardness H Shore “A”. Data are presented as mean values ± standard deviation (error bars represent standard deviation, n = 5.
| Sample symbol | T Sb [MPa] | E b [%] | H [°Sh A] |
|---|---|---|---|
| GG75 | 2.02 ± 0.11 | 176.6 ± 4.5 | 32.8 ± 8.4 |
| GG75.AEROSIL | 6.70 ± 0.35 | 71.0 ± 6.5 | 46.3 ± 4.3 |
| GG75.ARSIL | 4.18 ± 0.20 | 184.0 ± 6.7 | 58.4 ± 12.7 |
| GG75.NANOBENT | 6.27 ± 0.42 | 70.8 ± 7.3 | 41.9 ± 9.0 |
| GG75PVA | 3.00 ± 0.26 | 166.5 ± 8.2 | 54.6 ± 5.9 |
| GG75PVA.AEROSIL | 11.10 ± 0.40 | 98.1 ± 2.3 | 59.1 ± 7.0 |
| GG75PVA.ARSIL | 7.28 ± 0.12 | 134.5 ± 9.2 | 48.4 ± 4.6 |
| GG75PVA.NANOBENT | 12.40 ± 0.45 | 77.8 ± 5.7 | 66.5 ± 1.1 |
The introduction of silica additives, both without and with stabilizer (PVA), contributed to a significant increase in the mechanical strength of gelatin blends by over 50%, which can be attributed to the interactions between silica and the polymer matrix. In nanostructures, such as nanoclay, intermolecular interactions can occur, including Van der Waals forces, hydrogen bonds, and electrostatic interactions, which—although weaker than covalent bonds—play a key role in stabilizing the structure of the material, which is reflected in further research results. Additionally, the influence of Arsil and Aerosil silicas on the mechanical properties of polymer blends is not the same. Due to differences in the process of their preparation, Aerosil silica has a more favorable effect on mechanical parameters compared to Arsil silica (Table 2). This results from significant differences in the specific surface area of these materials (180 and 380 m2/g) and their synthesis methods.[ 37 ] Arsil silica is usually obtained by hydrolysis of silicic acid in the presence of an electrolyte, then filtered, washed, and dried. Aerosil silica, which is a colloidal form, is produced by flame hydrolysis of silicon tetrachloride, which results in its high purity (SiO₂). The latter feature translates into better mechanical and thermal stability of polymer blends containing Aerosil silica.
The results of the Shore “A” hardness tests, even with a standard error, also indicate an increase in the resistance of the tested matrices to local plastic deformation (Table 2).[ 37 ]
The Shore hardness results show a definite change in the properties of the biopolymer compositions after the addition of silica. The most favorable results were in the case of the polymer matrix enriched with nanometric silica with the addition of Poly(vinyl alcohol) and composition with NANOBENT. Due to increased fragmentation the active surface of the material increases, more bonds form between the additive and the polymer matrix, which also improves silica dispersion. Due to the reinforcing nature of the silica used, polymer‐silica composites are created. This, in turn, is associated with the formation of hydrogen bonds, van der Waals interactions and other intermolecular interactions that improve the hardness parameter of the final materials.[ 38 , 39 ] The visible improvement in tensile strength and hardness for blends containing PVA stabilizer can be attributed to better interfacial adhesion of this polyalcohol with reinforcing materials such as silicon compounds.[ 40 ]
The systems based on a gelatin matrix proposed in this work were enhanced by the addition of silicas: Arsil, Aerosil, and Nanobent, due to their differing origins and distinct chemical structures (Table 1). The optimization of the gelatin composite composition was performed following an experimental design algorithm, which involved defining key variables such as gelatin concentration, PVA concentration, SiO₂ concentration, and the incorporation of a plasticizer (glycerin), along with the temperature parameters for the drying‐crosslinking process. The structure of an exemplary macromolecule of the gel material is depicted in Figure 1a, while Figure 1b illustrates the primary processing parameters of the final product in the form of dumbbell‐shaped samples, intended for further physicochemical analysis.
Arsil is a hydrated, amorphous form of silicon dioxide (SiO₂) precipitated from aqueous solutions containing silicon salts. Aerosil, on the other hand, is colloidal silica produced via flame hydrolysis of silicon tetrachloride, resulting in very high purity SiO₂. Finally, Nanobent is a form of nanoclay composed of crystalline silicate layers, such as montmorillonite, which are characterized by their small particle sizes and unique properties, including high specific surface area and adsorption capacity. The impact of these silicon compounds on the mechanical properties of the gelatin matrices was assessed through tensile strength, elongation at break, and hardness measurements.
The tensile strength (T Sb) and relative elongation at break (E b) of the biopolymer samples with the GG75 matrix are presented in Table 2 and Figure 1c. Results indicate that the addition of Poly(vinyl alcohol) (PVA) significantly improves the mechanical properties of the samples. Systems containing PVA exhibit higher stress values relative to elongation, as demonstrated in the stress‐relative elongation curves (Figure 1c). This improvement is due to smaller, permanent plastic deformations in samples with PVA, resulting in a transition from elastic to plastic behavior. As observed by Walley and Field,[ 36 , 37 ] the mechanical response of a polymer to applied stress depends on its structural characteristics, including the proportion of amorphous and crystalline phases.
The incorporation of silica additives, both with and without the PVA stabilizer, resulted in a substantial increase in the mechanical strength of the gelatin blends by over 50%. This enhancement is attributed to interactions between the silica and the polymer matrix, including intermolecular forces such as Van der Waals interactions, hydrogen bonds, and electrostatic interactions. While these forces are generally weaker than covalent bonds, they play a critical role in stabilizing the material's structure, which is further supported by experimental results.
Additionally, the effects of Arsil and Aerosil silicas on the mechanical properties of the polymer blends were not uniform. Due to differences in their synthesis methods and specific surface areas (180 m2/g for Arsil and 380 m2/g for Aerosil), Aerosil demonstrated a more favorable influence on mechanical performance. Arsil is typically produced by the hydrolysis of silicic acid in the presence of an electrolyte, followed by filtration, washing, and drying. In contrast, Aerosil is produced through flame hydrolysis of silicon tetrachloride, resulting in higher purity and superior mechanical and thermal stability of the polymer blends containing Aerosil.[ 37 ]
Shore “A” hardness tests (Table 2) also demonstrated a noticeable improvement in the resistance of the tested matrices to local plastic deformation, even considering the standard error.[ 41 ] The hardness results revealed a significant enhancement in the biopolymer compositions after the addition of silica. The most favorable results were obtained with the polymer matrix enriched with nanometric silica (NANOBENT) in the presence of PVA.
The improved performance is associated with the increased fragmentation of the active surface of the material, resulting in a higher number of bonds between the additive and the polymer matrix, thereby improving silica dispersion. The reinforcing nature of the silica contributes to the formation of polymer‐silica composites, where the enhancement of mechanical properties is linked to the formation of hydrogen bonds, Van der Waals interactions, and other intermolecular forces.[ 38 , 39 ]
The visible improvement in tensile strength and hardness in blends containing the PVA stabilizer can be attributed to better interfacial adhesion between PVA and reinforcing materials, such as silicon compounds.[ 40 ] PVA's stabilizing effects on the structure of the blends are primarily due to the formation of hydrogen bonds with the polymer chains. Additionally, PVA's hydrophilic nature may affect the material's water absorption properties, which is particularly relevant for materials designed for specific engineering applications.
Overall, the optimization of the gelatin composites was conducted through a systematic approach involving variations in SiO₂ concentration, PVA concentration, and other processing conditions. The improved mechanical performance is attributed to the enhanced interfacial adhesion mechanisms, including hydrogen bonding and other interactions, between the gelatin matrix and the silica additives. While this study successfully demonstrates enhanced mechanical properties, further investigation using advanced analytical techniques, such as NMR spectroscopy or molecular dynamics simulations, could provide a more comprehensive understanding of the underlying molecular interactions.
2.2. Analysis of the contact angle and Surface Free Energy (SFE)
Surface free energy (SFE) was calculated using the Owens‐Wendt (OW) method. Goniometric tests were performed for compositions containing GG75 or GG75PVA matrices with silica additives. For each test, 1 µL of three solvents with different polarities—water, diiodomethane, and ethylene glycol—was applied dropwise onto the composition surfaces. Images of the droplets were captured upon contact with the surface, and the contact angles were measured. Based on the known polar and dispersive components of the tested liquids, the corresponding SFE values for the polymer gels were calculated using appropriate software. The results are presented in Table 3.
Table 3.
Contact angle values (Θ) measured for water, ethylene glycol, and diiodomethane, along with calculated polar component (γs P), dispersion component (γs D), and total surface free energy (γs) for biopolymeric samples. Data are presented as mean values ± standard deviation (error bars represent standard deviation, n = 5).
| Symbol sample | Θwater [°] | Θethylene glycol [°] | Θdiiodomethane [°] | γsP [mN/m] | γsD [mN/m] | γS [mN/m] |
|---|---|---|---|---|---|---|
| GG75 | 116.92 ± 1.99 | 53.06 ± 2.37 | 51.17 ± 2.12 | 39.36 | 0.14 | 39.50 |
| GG75.AEROSIL | 92.17 ± 2.17 | 63.91 ± 2.72 | 55.18 ± 2.54 | 29.76 | 1.41 | 31.17 |
| GG75.ARSIL | 92.61 ± 3.22 | 56.34 ± 2.42 | 61.54 ± 2.09 | 23.99 | 5.03 | 29.02 |
| GG75.NANOBENT | 101.73 ± 2.4 | 59.72 ± 5.09 | 50.84 ± 2.71 | 35.49 | 0.01 | 35.50 |
| GG75PVA | 117.39 ± 1.56 | 61.73 ± 2.70 | 51.84 ± 2.85 | 43.01 | 2.09 | 45.10 |
| GG75PVA.AEROSIL | 113.86 ± 1.74 | 62.23 ± 2.16 | 55.77 ± 2.67 | 38.33 | 0.36 | 38.69 |
| GG75PVA.ARSIL | 83.16 ± 3.46 | 69.27 ± 2.57 | 47.94 ± 2.48 | 33.67 | 0.83 | 34.50 |
| GG75PVA.NANOBENT | 101.18 ± 4.22 | 56.64 ± 2.39 | 45.82 ± 1.55 | 35.07 | 1.24 | 36.31 |
The contact angle measurements indicate that almost all samples exhibited angles above 90° for water, suggesting their hydrophobic nature. The incorporation of silica compounds resulted in a slight reduction in contact angles, implying an increase in surface wettability. However, the composition containing PVA and ARSIL silica continued to demonstrate hydrophobic properties, with contact angles exceeding 90° for water but showing improved wettability for less polar and nonpolar solvents such as ethylene glycol and diiodomethane. The recorded contact angles ranged from 45° to 61° for diiodomethane and 53° to 69° for ethylene glycol.
The highest SFE values were observed for the native compositions (GG75 and GG75PVA), while the addition of silica compounds generally caused a slight decrease in SFE. This reduction is likely due to modifications in the surface structure resulting from the incorporation of silica. It is worth noting that surface modification of silica may introduce functional groups that influence the polar component of the surface energy, although this effect depends on various factors, including the type of silica and its weight fraction.
Overall, the changes in contact angles and SFE are relatively minor, indicating that the presence of silica additives has only a moderate effect on the surface properties of the composites. These findings suggest that further studies are necessary to gain a more comprehensive understanding of the influence of silica on surface free energy and wettability.
2.3. Differential Scanning Calorimetry (DSC), Thermogravimetric Analysis (TGA), and X‐ray Diffraction (XRD)
Thermogravimetric analysis (TGA) was performed to assess the mass changes and thermal behavior of the tested gelatin mixtures under controlled temperature conditions (Figure 2a). The first mass loss, occurring within the range of 140–150 °C, is likely attributed to the evaporation of water from the polymer network (dehydration process[ 42 ]), resulting in a relatively small mass reduction of less than 5%.
Figure 2.

a) Thermogravimetric analysis diagram TGA & DTG of the base sample GG75PVA and samples with silica additives, b) Thermal properties of the base sample GG75PVA and comparison to samples modified with silica with DSC analysis diagram of the base sample GG75PVA and samples with silica additives.
The second significant mass loss, observed around 250 °C, is associated with the decomposition of PVA, which typically begins at approximately 230 °C. This process is likely due to the dehydroxylation of structures rich in ‐OH groups, which is consistent with the presence of collagen‐PVA systems.
A more substantial thermal transformation is observed around 330 °C, corresponding to the decomposition of gelatin into smaller molecules, atoms, ions, and radicals due to thermal dissociation. This temperature range may also include the degradation of glycerol, which begins to decompose above 290 °C. The final stage of mass loss, occurring above 650 °C, is attributed to the pyrolysis of residual material and the complete thermal decomposition of hydrocarbon structures.[ 42 ]
The incorporation of silicon compounds into the gelatin blends altered the TGA curves, but the improvement in thermal stability was relatively moderate. The most noticeable effect was observed at temperatures above 300 °C, where the mass loss of the samples was slightly reduced compared to the native system. This effect may be attributed to potential interactions between silica and the polymer matrix, which could limit degradation processes to some extent.
During thermal decomposition under a nitrogen atmosphere, the formation of carbosilicates and the release of gases such as methane, ammonia, carbon dioxide, oxygen, hydrogen, and water are also possible.[ 43 , 44 ] Although the higher degradation temperature could suggest a slight enhancement of thermal resistance, the observed mass differences are relatively minor and do not indicate substantial improvements in thermal stability.
These findings suggest that while the introduction of silicon domains may influence the degradation behavior of the matrix, they do not contribute significantly to high‐temperature resistance. Additionally, the incorporation of Aerosil and Nanobent may have a more beneficial effect on the structural integrity of the gel mixture, which will be further investigated in subsequent studies.[ 45 ]
2.4. DSC analysis
The use of silica fillers improved the thermal properties of the obtained gelatin compositions. The gelatin blends with the addition of silica compounds showed higher thermal decomposition temperatures. In addition, there was less mass loss during subsequent thermal transformations.
DSC was performed to determine the effect of adding silica on the thermal properties of the gelatin films (Figure 2b and Table 4). Tests were carried out for compositions based on the GG75PVA standard. Analysis of the resulting thermograms gave the thermal properties of each sample (Table 4).[ 46 ]
Table 4.
Thermal properties of the base sample GG75PVA and samples modified with silica additives, including glass transition temperature (T g), heat capacity change (Δ C p), decomposition peak temperature (T Peak), and heat flow enthalpy (ΔH). The uncertainty values provided result from the measurement accuracy of the analytical equipment.
| Sample symbol | T g [°C] | Δ C g [J·g−1K−1] | T Peak [°C] | ΔH [J·g−1] |
|---|---|---|---|---|
| GG75PVA | 64 | 0.088 | 136 | −54.08 |
| GG75PVA AEROSIL | 69 | 0.201 | 142 | −29.47 |
| GG75PVA ARSIL | 69 | 0.132 | 136 | −54.13 |
| GG75PVA NANOBENT | 69 | 0.044 | 140 | −32.29 |
T g – glass transition temperature; Δ C p– Heat Capacity; T Peak – decomposition temperature; ΔH‐heat flow enthalpy
The DSC analysis enabled comparison of the glass transition temperatures of the gel compositions. In the case of the composition containing PVA, silica additives increased the T g value by over 5 °C in the case of ARSIL, AEROSIL silica and NANOBENT compared to the GG75PVA reference blend. The applied silica additives shifted the glass transition temperature ranges toward higher values. The increase in the glass transition temperature may be caused by the influence of the silicon compounds used on the compatibility, morphology, or other properties of the polymer blends. The obtained T g values are also influenced by the use of a solvent such as water and plasticizers, causing a change in thermal, mechanical, and ultimately, barrier properties. This leads to the possibility of obtaining a less flexible and more stiff polymer film with probably increased resistance to the penetration of gases and water vapors, which will be demonstrated in subsequent scientific research.[ 47 , 48 ] Beneficial cross‐linking of gelatin systems due to the greater thermal stability has been reported by Bigi et al.,[ 49 ] who observed cross‐linking of T‐Gas transglutaminase in modified gel matrix containing soy protein isolate. The thermal stability of gelatin blends increases and the waterproofing properties of gelatin films are improved as covalent cross‐links are formed.
The application of silica compounds to a native gelatin matrix increases the specific heat (Δ Cp) at which destabilization of the system occurs.[ 50 ] This may be related to the formation of hydrogen cross‐links with the participation of silica compounds as shown in Figure 3a‐c in the case of the nanometric NANOBENT additive. To increase the stability of gelatin systems and improve their film‐forming properties, they should be characterized by a higher percentage of amino acid residues, such as proline or hydroxyproline, which are responsible for stabilizing the helical structure of proteins in the gelling process. This may also increase their melting point.[ 51 ] According to the literature,[ 52 ] covalent bonds that form during the synthesis of biopolymer gels break exothermically, in contrast to hydrogen bonds which break endothermically. Higher C p values may indicate a greater number of hydrogen bonds than covalent bonds in the cross‐linked film. To confirm this hypothesis, further analyses should be carried out, for example taking into account the adsorption and drying curves of the produced composites. The possibility of the formation of weak hydrogen bonds between silicon compounds (SiO2) and a polypeptide molecule containing ‐COOH, ‐OH groups is indicated by the presence of O‐hydroxide ions (TOF SIMS analysis, Section 3.11). The mechanism may involve the donation of a hydrogen ion (H+) from the hydroxyl group of the protein molecule constituting the proton donor to form a hydrogen bond with an oxygen atom (O−) – acceptor in the silicon dioxide molecule. This specific type of electrostatic interaction is the result of sharing an electron pair between a hydrogen atom (H) bonding with an atom of higher electronegativity, that is, oxygen (O). The bond formed is weak and belongs to polar covalent intermolecular bonds, but is extremely important in many chemical processes.[ 53 , 54 ]
Figure 3.

a) Probable mechanism of interactions between the basic amino acid of gelatin–hydroxyproline with silicon compound nanoclay; b) X‐ray diffraction XRD of base samples and samples modified by the addition of Poly(vinyl alcohol); c) Compound appearance after MM2 (minimum energy) ChemDraw 18.0 analysis Developer PerkinElmer.
The addition of silica compounds contributed to an increase in the glass transition temperature by an average of several percent compared to the GG75PVA standard, according to XRD analysis. This result may indicate increased crystallinity or cross‐linking in the obtained gelatin blends.
XRD analysis was performed on GG75PVA hydrogel composites modified with silica compounds using a Bruker D8 Advance diffractometer, U.S. with Cu Kα1 radiation (λ = 1.5406 Å) and a strip detector (LynxEye, Drottninggatan 95A, 113 60) with an angular range of 10–70 2θ, step 0.03.
Figure 3b shows XRD diffraction patterns for PVA/silicate hydrogel systems. The spectrum of the GG75PVA.AEROSIL composite shows two main diffraction peaks on the crystal, at 21.4° (0.211 nm) and 31.7° (0.147 nm). These two peaks may be due to the amorphous structure of the gelatin‐PVA molecular chains arranged in parallel, which correspond to D spacings of 0.281 nm and 0.404 nm. Literature data on the analysis of signals from gelatin films indicate a wide diffraction angle peak on the crystal in the range of 18–25° 2θ, which is repeated here. The reference sample GG75PVA has angle values of 22.8° (0.199 nm) and 32.3° (0.144 nm).
The addition of ARSIL precipitated silica and AEROSIL colloidal silica resulted in similar diffraction peak angles, at 22.8° (0.198 nm); 21.4° (0.211 nm) and 31.9° (0.146 nm), 31,7° (0.147 nm), respectively. However, a slightly different distribution was observed for Nanobent, with a shift of the crystal reflection plane toward higher reflection values of 23.1° (0.196 nm) and 32.1° (0.145 nm) relative to the native system and a small crystalline peak at 29.3° (0.157 nm), indicating the semi‐crystaline nature of the gelatin systems. Nanobent has a different structure from ARSIL and AEROSIL. As well as silicon oxides, there are Al2O fragments, which can increase the mechanical and thermal stability of the system.[ 55 ]
Based on these data, the introduction of AEROSIL and ARSIL shifted the diffraction toward lower 2‐theta angles. The samples were characterized by a slightly reduced proportion of crystalline phase, than in the case of gel matrix with the addition of NANOBENT. The introduction of hydrophilic nanoclay into the gelatin matrix resulted in an increase in the degree of crystallinity of the gelatin systems compared to the GG75PVA composite. This was also confirmed by analysis of the degree of crystalline phase by DSC. The increase in the polar character as a result of the introduction of nanoclay is also evidenced by the reduced contact angles of the tested surfaces with water in relation to the GG75PVA or GG75 composites, as measured by goniometric analysis (Section 3.2). The different behavior of NANOBENTONITE in relation to the other silica can be explained by its structure. The presence of Al3+ aluminum ions (also confirmed by EDS analysis, Section 3.11) in the nanoclay (H2Al2O6Si) stabilizes intermolecular interactions in the gelatin matrix.
2.5. Scanning Electron Microscopy (SEM) and Transmission Electron Microscopy (TEM)
Figure 4a shows pictures from scanning atomic force microscopy and transmission electron microscopy of the silicon‐gelatin blends. The SEM pictures show probable 3D structural models made with a ChemDraw Professional 18.0 (PerkinElmer) for matrices both containing and without PVA.
Figure 4.

a) SEM pictures of base and modified samples with and without the addition of Poly(vinyl alcohol); b) TEM images of the GG75PVA, GG75.PVA.AEROSIL composition at three magnifications (1)‐(3).
In the images of the fracture topography of composites at 10,000× magnification, a slightly more heterogeneous surface can be observed for matrices containing Poly(vinyl alcohol). Fine graining can be observed, usually spherical[ 56 ] with a size of about 0.1–0.2 µm, mostly under the surface (GG75PVA.AEROSIL) or just on the surface (GG75PVA.NANOBENT) of the polymer material. These numerous protuberances of irregular shapes may indicate undissolved PVA particles and fine crystalline silica. In the pictures of samples with silica additives, regardless of the matrix used or the presence of PVA, larger inclusions of silica structures are visible with spherical or oblong shapes and diameters from 1–5 µm. GG75PVA.AEROSIL Materials containing ARSIL were characterized by a homogeneous surface, but with folds perpendicular to longitudinal humps. The use of nano‐sized silicon (NANOBENT) in PVA matrices produced a heterogeneous structure with agglomerated suspended clusters of particles, probably derived from the SiO2 compound used. The spherical and oblong particles visible in Figure 4a at 10,000× magnification reach dimensions of less than 2.5 µm. Dyes used; Quinoline yellow and Cochineal red, differentiating matrices without and with PVA, did not negatively affect the structures imaged in microscopic photos.
The SEM images show 3D models of the gelatin blends containing SiO2 compounds (ARSIL and AEROSIL) and H2Al2O6Si (NANOBENT) as cross‐linking substances. The silica affected the development of the structure of the biopolymer gels by creating bridges and cross‐linking systems as well as permanent, ionic interactions and hydrogen bonds.
Transmission electron microscopy (TEM) was performed to characterize the morphology and crystal structure of the obtained gelatin films (Figure 4b). Scanning electron microscope (SEM) images of the gelatin matrix with AEROSIL had revealed a favorable even distribution of the silica compound. Therefore, GG75PVA.AEROSIL was selected for TEM research, with native GG75PVA as a control. The micrographs shown in Figure 4b were taken in bright‐ and dark‐field mode.
The pictures in Figure 4b taken at three magnification (1–3) show clear differences between the composite cross‐linked with AEROSIL and the native sample. In pictures (1–3) in Figure 4b, spherical elements can be observed that may be pores that formed during the processing process, associated with evaporation of the solvent. In the close‐up (2) in Figure 4b the homogeneous structure of the gelatin matrix is visible, forming a spatial network. No inclusions are visible in the pictures in Figure 4b (GG75PVA), because the sample does not contain SiO2 compounds. In the TEM images of the GG75PVA.AEROSIL composition, the regular structure of the gelatin matrix can be seen, with the crystalline inclusions of the silica compound visible in the form of darkened elements. Accumulations of AEROSIL silica crystallites occur irregularly. Single crystallites (visible most clearly at maximum magnification in photo (3) in Figure 4b – GG75.PVA.AEROSIL) form elongated aggregates, which in turn combine into larger agglomerates with sizes ranging from several dozen to several hundred nanometers (shown in photo (2) in Figure 4b – GG75.PVA.AEROSIL). The agglomerates have the shape of stretched balls. Photo (1) (Figure 4a) shows a TEM micrograph of an AEROSIL‐type colloidal silica similar to those in the literature.[ 57 ] The organic components in the gelatin matrix and other additives, except for the inorganic silicon compound, affected the diffraction of electrons in the tested areas of the sample. Electron diffraction in the selected area shown in photo (3) in Figure 4b – GG75.PVA.AEROSIL is attributable to the formation of amorphous regions of organic precursors, as confirmed by XRD analysis (Section 3.3),[ 57 , 58 ]
SEM and TEM analyses provided valuable insights into the structure and dispersion of silica particles within the gelatin composites. SEM images revealed the presence of fine grains (0.1–0.2 µm) and larger silica inclusions (1–5 µm), highlighting differences in dispersion homogeneity influenced by the presence of PVA and the type of silica used. The SEM results also indicate structural heterogeneity, particularly in materials containing NANOBENT additives.
TEM analysis enabled a more detailed examination of morphology and crystal structure, showing a relatively homogeneous dispersion of particles in GG75PVA.AEROSIL samples, while greater agglomeration was observed in composites containing NANOBENT. Both microscopic techniques confirm that silica influences the structural characteristics of the composites and suggest that further studies focused on interfacial adhesion and dispersion homogeneity could provide a more comprehensive understanding of the material properties.
2.6. Equilibrium Swelling and Degree of Cross‐Linkage
Representative samples of 30–40 mg weighed on an analytical balance were placed in media (toluene or water) for 48 hours and then reweighed. Unfortunately, as a result of their polar structure the samples placed in water dissolved. Therefore, the study was continued using the samples soaked in toluene. After soaking in toluene for 48 hours the samples were dried at 25 °C for 48 hours and then reweighed.
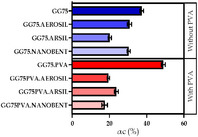
Based on the weights of the samples, the coefficient Qw was determined using Equation 2 and 3. The degree of crosslinking αc was also calculated for each sample. The results are presented in Table 5.
Table 5.
Results of equilibrium swelling (Q w) and degree of cross‐linkage (αc) for base and modified samples. Data presented as mean values ± standard deviation (error bars correspond to standard deviation, n ≥ 3).
| Sample symbol | Q w [dimensionless unit] | αc [%] |
|---|---|---|
| GG75 | 0.0261 ± 0.0009 |
|
| GG75.AEROSIL | 0.0324 ± 0.0014 | |
| GG75.ARSIL | 0.0495 ± 0.0010 | |
| GG75.NANOBENT | 0.0330 ± 0.0011 | |
| GG75PVA | 0.0204 ± 0.0007 | |
| GG75PVA.AEROSIL | 0.0508 ± 0.0008 | |
| GG75PVA.ARSIL | 0.0404 ± 0.0011 | |
| GG75PVA.NANOBENT | 0.0583 ± 0.0011 |
The degree of cross‐linking in individual gelatin films was determined based on the results of the equilibrium swelling test. The degree of crosslinking ranged from 15% to 61%. V. Sethi et al.[ 59 , 60 ] in their scientific research on the swelling of polymers rightly noted that the tendency to swell hydrogel materials depends mainly on the presence of carboxyl groups in the structure, free hydroxyl groups, as well as the structure of the matrix surface itself. that the tendency to swell hydrogel materials depends mainly on the presence of carboxyl groups in the structure, free hydroxyl groups, as well as the structure of the matrix surface itself. The carboxyl groups present in the system under study can be deprotonated and, as a result, electrostatic repulsive interactions will act between the polypeptide chains. This leads to an increase in the pores in the hydrogel network and an increase in the rate of its swelling. Consistently, the whole process is facilitated by the hydrogen bonds formed with associating water molecules. The effect of the addition of silica compounds on the cross‐linking process of gelatin matrix can be seen in the results of the analysis of the mechanical properties of the composites which was carried out in Chapter 3.1. Tensile strength, relative elongation at break and Shore hardness scale. Based on the data in Table 2, it was observed that the tensile strength increases on average by 50% as a result of the introduction of silica compounds in the presence of PVA or without PVA, which proves the development of a spatial network compared to the native sample. However, there was a noticeable decrease in the degree of cross‐linking (αc) in the materials with silicon additives compared to the native sample. A possible explanation lies in the assumption that the structure with the addition of silicon compounds is stiffer, as indicated by the glass transition temperature results, which in turn may provide resistance to external agents during the swelling process, thus leading to a more porous structure of the cross‐linked gel. Precipitated and nanometric silica, in the presence o hydroxyl groups of polyvinyl alcohol, showed greater infiltration of polar solvent in the hydrogel matrix than colloidal silica.
2.7. Microbial Degradation
The effect of bacteria on the samples was assessed using a defective medium: agar with mineral salts. Microbiological tests were carried out using method B with spores of Aspergillus brasiliensis ATCC 16 404 to determine the fungistatic effect, and method C with Pseudomonas aeruginosa ATTC 9027 was used to determine the antibacterial effects of the samples.
In method B, samples of polymeric materials were exposed to a suspension of a mixture of fungal spores in the presence of a complete nutrient medium, which provided a carbon source for the fungi. Even without nutrients, the fungi can grow on polymers and their metabolic products can affect the sample. Any inhibition of growth, on either the material or medium, indicates fungistatic activity. The study used A. brasiliensis ATCC 16 404 in a solution of mineral salt with glucose. The spore suspension was washed and centrifuged as recommended by the PN EN ISO 846 standard. The spore suspension was adjusted with a sterile mineral salt solution with glucose to a density of approximately 106 spores/mL (Figure 5b). Three batches of samples, Batch 0, Batch I, and Batch S, were used for the tests, with five samples in each batch. Before starting the tests, the samples were cleaned in a 70% ethanol solution and then dried at 45 °C for 4 hours. The materials showed a tendency to dissolve under the influence of the bactericidal solution. Therefore, batch S samples were not immersed in the solution, but treated with UV radiation for a period of 20 minutes. No visual changes in the samples were observed after irradiation. These results point toward the possibility of programming external factors for controlled decomposition of gelatinous materials.
Figure 5.

a) Photographs of samples placed in soil for the composting process; b) Visual assessment of the growth of fungi from the A. brasiliensis ATCC 16 404 group on the biopolymer gel. Visual assessment of the polymeric material: Batch 0 – baseline; Batch S – inoculated and incubated samples; Batch I – sterile samples irradiated with UV; c) Microbiological degradation using a strain Pseudomonas aeruginosa.
The growth of filamentous fungi on the samples after 4 weeks of incubation was estimated according to the ISO 846 standard, on a scale from 0 to 5 indicating no visible growth of fungi (0) or maximum growth covering the entire surface of the test material (5). The results are summarized in (Figure 5). As can be seen, there was intensive growth of fungal cells, that is, no fungistatic effect at level 5, regardless of the addition of a silica compound to the gelatin matrix. It can be concluded that the use of AEROSIL colloidal silica as a cross‐linking and stabilizing agent for the gelatin matrix did not adversely affect its susceptibility to filamentous fungi. The material behaved identically to the reference sample GG75PVA (Figure 5).
In Method C, the gelatin matrix were exposed to the P. aeruginosa ATTC 9027 strain, using an incomplete agar medium with mineral salts. The bacterium was cultured on a peptone medium with soybean casein. Incubation of the bacterial suspension in a buffer solution (density of about 106 cells/mL) was carried out for 24 hours at 29 °C. As in Method B, three batches of samples (Batch 0, Batch I, and Batch S) were used, with five samples in each batch. The samples were incubated for 4 weeks at 29 °C ± 1 °C. Before starting the tests, the samples were cleaned in a 70% ethanol solution and then dried at 45 °C for 4 h. As in Method B, the gelatin samples showed a tendency to dissolve. Therefore, the samples in Batch S were directly irradiated with UV, omitting immersion in the killing reagent.
After a 4‐week incubation period, growth of microorganisms was observed on the surface around the samples (Figure 5c). This proves that the polymeric materials contain nutrients needed for the growth of microorganisms. The introduction of silica compounds into the structure of gel matrix based on polypeptide proteins did not inhibit the growth of bacterial or fungal colonies. This proves the presence of assailable minerals for biotic factors of external environments. The bactericidal effect of complex hydrogel systems can be adjusted by changing the length of the alkyl chain, for example, of photosensitizers, if materials with increased resistance to Escherichia coli bacteria are intended. Following this step, you can produce hydrogels depending on your needs and use additives that will initiate the production of reactive oxygen species under the influence of light or other atmospheric factors.[ 61 ]
2.8. Composting Process
To determine the susceptibility of the obtained gelatin compositions to biodegradation, composting was performed under controlled conditions. The polymeric materials enriched with silica compounds shaped in the form of “paddles” for mechanical testing were placed in ceramic containers on a universal substrate moistened with water at pH 6.0– 7.0 and incubated for 15 days in a climatic chamber with 80% RHA (humidity relative to air) at 30 °C (Figure 5a). After 15 days, the sample dishes were removed from the climatic chamber and an attempt was made to extract the residues of the biodegraded gelatin compositions. However, it was found that all the compositions were completely biodegraded. This result confirms our previous studies,[ 62 , 63 ] which showed that all the obtained gelatin compositions are characterized by excellent biodegradability.
2.9. Gel Permeation Chromatography GPC
Triple detection SEC analysis was performed on samples of GG75PVA.ARSIL and GG75PVA.AEROSIL dissolved in water (after 2 weeks). The GG75PVA.NANOBENT composite was not included in these studies, due to its very low solubility. The tested polymers were first filtered through a 0.2 µm syringe filter, so that the concentration of the samples was c ∼ 5 mg/ml. For some of the analyzed solutions, tests were carried out with partially dissolved fractions. Triple detection SEC analysis was conducted using a GPC/SEC chromatographic column. Figure 6a shows the chromatograms of the tested samples. The chromatograms revealed signals of different intensities (RI, RALS and LALS). Generally, the chromatograms showed low intensity signals (RI, RALS and LALS).
Figure 6.

a) Chromatograms for GG75.PVA, GG75.PVA.ARSI and GG75.PVA. AEROSIL; b) FTIR spectra of base sample and modified samples with the addition of Poly(vinyl alcohol); c) Raman scattering intensities versus frequency for four representative samples (GG.75.PVA; GG.75.PVA.AErOSIL, GG.75.PVA.ARSIL, GG.75.PVA.NANOBENT).
In all chromatograms, there is are sharp signals at v = ∼30.9 ml in the case of the native composite and v = ∼30.5 ml. for GG75PVA.ARSIL and GG75PVA.AEROSIL (Figure 6a). These signals are due to the solvent (i.e., water) remaining bound in the structure of the polymer. In the chromatograms of all types of composites, the signals from RI, RALS, and LALS are very low intensity and therefore very noisy, especially in the case of RALS and LALS. After accepting the range of signal occurrence, the approximate value of molar masses of polymers was estimated on the basis of linear calibration determined for dextrans or glucans. In the case of RI, broad signals in the range of v = ∼21.5–26 ml were observed. In the case of RALS, broad signals in the range of v = ∼20.7–25 ml (GG75PVA) are visible. These values can be assigned a range of molar masses: 37700–3400 (for RI) and 57900–5700 (for RALS) for glucan calibration and 29 600‐2500 (for RI) and 50000–5400 (for RALS) for dextran calibration.
The composites containing AEROSIL and ARSIL showed corresponding signals for RI (v = 22.3 ml) and RALS. On this basis, it was possible to estimate the approximate molar masses of the polymers. Based on the linear calibration determined for dextrans and glucans, the molar masses of polymers were 24500 (glucan calibration) and 19700 (dextran calibration). In both chromatograms, there is a clear signal for v = ∼30.5 ml (Figure 6a; GG75PVA.ARSIL GG75PVA.AEROSIL). This signal is due to the remaining solvent or water in the polymer.
The silica compound AEROSIL had the most favorable effects on the gelatin matrix. This compound is characterized by a high specific surface area (380 m2/g). It is a hydrophilic colloidal silica with a particle size ranging from 5 nm to 40 nm. As a result, samples with the addition of AEROSIL were not only characterized by the lowest molar mass, but also showed the best solubility in the tested medium, so it could be caused by the depolymerization process leading to cracking of polymer chains and their faster solvation.[ 64 ]
2.10. Fourier Transform Infrared Spectroscopy
Fourier transform infrared spectroscopy (FTIR) was carried out to confirm the structures of the obtained compositions and to determine the changes resulting from the introduction of silicon fillers into the gelatin matrix. The spectra for the 60% and 75% gelatin compositions are summarized in Figure 6b without and with PVA. The FTIR spectra (Figure 6b without and with PVA) confirmed the structures of the resulting gelatin compositions. In all spectra, there are characteristic bands originating from gelatin: a strong amide band in the range of 3100–3600 cm−1, corresponding to the stretching vibrations of N─H bonds and O─H bonds, and primary (wave number 1638 cm−1), secondary (wave number 1533 cm−1), and tertiary (wave number 1235 cm−1) amino bands.
Symmetric and asymmetric stretching vibration bands for the C─H bond from the CH2 groups were also observed, in the form of adjacent peaks in the range of 2850–2950 cm−1. The signals visible in the FTIR spectra (Figure 6b without PVA) at 3280 cm−1 and 920 cm−1 may indicate ‐OH bending vibrations from glycerol. The C─H stretching bond is visible in the region of the 2870–2930 cm−1 band.[ 65 ]
As can be seen from the spectra shown in Figure 6b without and with PVA., the introduction of the silicon compound contributed primarily to increase the intensity of the band from 3 100 cm−1 to 3400 cm−1, corresponding to O‐H bond stretching vibrations. The maximum of this band at 3280cm−1 indicates the occurrence of hydrogen bonds between the OH groups. Another peak from symmetrical and asymmetric stretching vibrations of the C─H bond in the CH2 groups at 2918 cm−1 decreased and shifted to 2934cm−1.
The spectra show that the addition of macrometric silica did not increase the intensity of the band for O‐H bond stretching vibrations (from 3100 cm−1 to 3400 cm−1). However, the addition of micrometric silica had a positive effect on increasing this band. The maximum was reached at 3285 cm−1. The band originating from the CH2 groups changed almost in the same way as in the case of the composition with micrometric silica. On the basis of Time‐of‐Flight Secondary Ion Mass Spectrometry (TOF‐SIMS) (Section 3.11) measuring the distribution of ions on the surface of polymer gels, the presence was determined of ions originating from fragments of silicon structures, including SiH+ and SiHO+. The presence of SiHO+ ions, which is justified by the interaction mechanism described in Section 3.3 on the basis of DSC, TGA, and XRD, indicates the existence of ‐Si‐H and ‐Si‐O‐ stretching vibrations in the presented spectra in the range of 2800‐3000 cm−1. A more intense peak at the wavenumber of 2920 cm−1 is visible for the composite with nanometric NANOBENT compared to the other samples (Figure 6b with PVA). This peak may result from the presence of word bonds stabilizing the (Si)O─H groups.[ 66 ] According to the proposed mechanism (Figure 6b without PVA), carboxylic salts of polypeptide derivatives may form as a result of the introduction of silica into the structure of collagen gels. Depending on the reaction environment, protein compounds may behave as zwitterions, weak acids, or weak bases. As a result of the introduction of silicon structures, they will act as a weak base. Hence the occurrence of stretching vibrations of asymmetric ‐CO2‐ groups in the infrared spectra at the wavelength of 1580 cm−1 and of stretching vibrations of symmetrical ‐COO‐ groups at 1405 cm−1.
There was also an increase in band intensity for primary amines with a maximum at 1632 cm−1 and for secondary amines with a maximum at 1544 cm−1 (Figure 6b without PVA). There was significant intensification of the band at 900–1250 cm−1, which usually corresponds to stretching vibrations of the C─O bonds, although in this case this increase in intensity should rather be attributed to the introduction of silica and the formation of Si‐O‐Si bonds.
The intensity of bands in the range of 2700–3600 cm−1 originating from ‐OH hydroxyl groups increased significantly in the case of gelatin matrix stabilized with Poly(vinyl alcohol) (PVA) (Figure 6b with PVA). Signals from stretching vibrations of the C‐O‐H and C‐O groups of primary alcohols are visible in range of 1400–1420 cm−1 and at 1100 cm−1, respectively. In the case of compositions with nanometric silica, there was a noticeable increase in the intensity of bands in the range from 2000 cm−1 to 3400 cm−1. A peak with an intensity of 3281 cm−1 indicates the presence of O─H groups. The increase in bands in the range of 1500–1650 cm−1 indicates the formation of more hydrogen bonds associated with amino acids. The intensities of the primary amine bands (1632 cm−1) did not increase greatly in the PVA systems. On the other hand, there was an increase in absorbance in the range of 1335–1544 cm−1 indicating stretching vibrations from the C═O and C═N double bonds of the II amides. The intensity of the vibration band stretching the C─O and Si─O─Si bonds in the range of 900–1250 cm−1 also increased, for the same reasons.
The peaks in the range of 900–1250 cm−1 correspond to vibrations stretching C─O bonds. A broadening of the 103 1cm−1 peak was also observed, which may suggest the formation of Si O(H) vibration connections, described above, originating from acid silicates in the vibration range of 700–1100 cm−1.
The addition of silicon fillers to the gelatin compositions influenced the formation of silicon‐oxygen networks in combination with hydroxyl groups. The produced polymer network was stable due to the presence of hydrogen bonds. Signals from hydroxyl groups were observed in the range of 3100–3600 cm−1 and the presence of hydrogen bonds was confirmed by spectroscopic analysis and Raman spectroscopy. Analysis of the contact angle and surface energy also showed an increase in the hydrophilicity of the surfaces of the compositions filled with silica.
In summary, FTIR analysis confirmed that the introduction of silica influences the polymer structure by promoting the formation of hydrogen bonds and electrostatic interactions between ‐OH, ‐COO⁻, and ‐Si‐OH groups. The increase in the intensity of the O‐H and N─H bond bands (3100–3600 cm⁻¹) after silica incorporation suggests the formation of new hydrogen bonds. Additionally, characteristic amide bands at wave numbers 1638 cm⁻¹, 1533 cm⁻¹, and 1235 cm⁻¹ confirm the presence of gelatin. The observed shift in the intensity of C‐H and CH₂ groups from 2918 cm⁻¹ to 2934 cm⁻¹ after the introduction of silica suggests interactions between silica and the polymer matrix. Furthermore, the intensification of the Si─O─Si and C─O bands (900–1250 cm⁻¹) in the presence of silica indicates the formation of new Si─O─Si bonds. The appearance of signals associated with carboxylate salts (‐COO⁻) at 1405 cm⁻¹ and 1580 cm⁻¹ suggests interactions between silica and polypeptide groups of amino acids. Additionally, changes in the intensity and width of the band at 1031 cm⁻¹ may indicate the potential formation of Si‐O(H) bonds within the gelatin structure.
2.11. Raman Spectroscopy
Raman spectra several revealed significant bands confirming the possibility of interactions between the silica and the collagen matrix (Figure 6c). Due to the high autofluorescence of the samples, each of them was subjected to bleaching to reduce the background and increase the probability of obtaining spectra of sufficient quality to distinguish the bands for a given sample. The Raman transition was recorded between the energy levels of the tested molecules, in the range of low‐and high‐radiation frequency vibrations. Groups related to the presence of Si─H bonds, including SiH+, SiOH+, are visible in the spectral bands.[ 67 ] In the Raman shift range of 930–1050 cm−1, there are visible signals probably originating from acid silicates (Si‐O(H) formed as a result of introducing silica into the polypeptide matrix, as well as dimer derivatives of acid groups found in protein amino acids, including (2S,4R)‐4‐hydroxypyrrolidine‐2‐carboxylic acid. The intensity of these bands decreased compared to the native matrix. The silica undoubtedly reacted with the amino acids proline and hydroxyproline of polypeptide structures. The structure of alpha and beta helices (α‐helix, β‐sheet) present in polypeptide compounds determines the formation of hydrogen bonds with interactions with ‐Si‐O groups, etc. Tyrosine from the side chains of the hydrophobic aromatic amino acid is also visible in the Raman spectrum at 850 cm−1 in the form of C‐O‐C groups.[ 68 , 69 ] Tyrosine is one of the basic amino acids of the collagen derivative gelatin. Vibrations of excited particles occurring in the range of 1560–1690 cm−1 are attributed to primary amides, the intensity of which increased as a result of the introduction of silicon atoms into the composite structure. Signals from a tertiary amide were observed in the spectra of all samples at 1250 cm−1.
The introduction of silicon systems increased the intensity of band interactions at 1470 cm−1 and 2945 cm−1. These signals indicate skeletal and deformation vibrations of the ‐CH2, ‐CH3 groups in the side chains and the C─C main chain of collagen macromolecules.[ 69 ] Increased vibration doublet intensity at 2886 cm−1 and 2945 cm−1 may be the result of silicon implantation into the polypeptide chains of the matrixes. This is also suggested by the change in the intensity of the C─H interactions at 1470 cm−1 and by the probable interactions originating from amide II, mainly N─H groups, as 60% of the signal from amide II consists of bending vibrations in the N─H bond plane and 40% consists of C─N stretching vibrations.[ 69 , 70 ] This description is consistent with the results of the XRD measurements, which revealed a phase transitions at 2θ = 22.8° (0.199 nm): 32.3° (0.144 nm) for GG75P, VA; 21.4° and 31.7° (0.211 nm and 0.147 nm) for GG75PVA.AEROSIL) 22.8° and 31.9° (0.199 nm and 0.146 nm) for GG75PVA.ARSIL; 23.1° and 32.1° (0.303 nm and 0.400 nm) with a small crystalline phase at 29.3° (0.377 nm) for GG75PVANANOBENT (Section 3.3). The addition of silica shifted the occurrence of theta angle maxima toward lower values. The structural transformation associated with the introduction of ‐Si atoms may also cause stronger shifts in the absorbance spectra of the samples. The use of silica, their type and concentration, can be differently excited by red light. This opens the possibility of producing silicon‐gel films with a higher degree of crystallinity, for example, during processing, annealing, etc.[ 71 ]
Raman spectroscopy confirmed that silica interacts with specific amino acids of gelatin, including proline, hydroxyproline, and tyrosine, thereby influencing the secondary structure of the polymer and strengthening hydrogen bonds. Signals attributed to silicic acids (Si‐O(H)) and interactions between silica and polypeptides are observed within the 930–1050 cm⁻¹ range. The presence of a signal at 850 cm⁻¹, associated with tyrosine C‐O‐C groups, further suggests interactions between silica and gelatin. Additionally, the intensification of the amide I band (1560–1690 cm⁻¹) indicates that silica affects the secondary structure of proteins. The presence of the amide III signal (1250 cm⁻¹) in all samples confirms the structural integrity of the gelatin matrix. Furthermore, the increased intensity of ‐CH₂ and ‐CH₃ signals (1470 cm⁻¹, 2945 cm⁻¹) resulting from interactions with silica suggests modifications in the structure of amino acid side chains. These findings support the hypothesis that silica incorporation alters the gelatin structure through enhanced hydrogen bonding and other intermolecular interactions.
2.12. (TOF SIMS) and Energy‐dispersive X‐ray spectroscopy (EDS)
Elemental analysis is one of the key techniques for estimating the occurrence of structural interactions of polymer matrix produced in the solvent cast synthesis process. Table 6 shows the percentage share of basic elements. Table 7 showcases the intensity of characteristic ions in compositions.
Table 6.
Elemental composition (C, H, O, N, Si, S, Al, Mg) of composite samples expressed as percentage by weight (%). Data are presented as mean values ± standard deviation (error bars correspond to standard deviation, n ≥ 3).
| Sample symbol | C [%] | H [%] | O [%] | N [%] | Si [%] | S [%] | Al [%] | Mg [%] |
|---|---|---|---|---|---|---|---|---|
| GG75.PVA | 41.15 ± 0.10 | 7.88 ± 0.14 | 34.88 ± 0.11 | 9.96 ± 0.18 | – | 0.15 ± 0.06 | – | – |
| GG75PVA.AEROSIL | 40.60 ± 0.14 | 7.07 ± 0.03 | 35.32 ± 0.17 | 12.05 ± 0.04 | 0.90 ± 0.12 | 0.15 ± 0.06 | – | – |
| GG75PVA.ARSIL | 39.90 ± 0.09 | 7.08 ± 0.03 | 35.16 ± 0.34 | 11.65 ± 0.04 | 0.41 ± 0.08 | 0.19 ± 0.06 | – | – |
| GG75PVA.NANOBENT | 40.79 ± 0.12 | 7.13 ± 0.09 | 36.14 ± 0.28 | 11.78 ± 0.13 | 0.46 ± 0.08 | 0.15 ± 0.05 | 0.16 ± 0.06 | 0.06 ± 0.01 |
Table 7.
Intensity of characteristic ions identified in composite samples GG75PVA and GG75PVA.AEROSIL. Intensities represent mean values from TOF‐SIMS analysis. The estimated relative measurement uncertainty is ±5%, resulting from equipment characteristics (single measurement).
| GG75PVA | GG75PVA.AEROSIL | ||||||
|---|---|---|---|---|---|---|---|
| Ions (−) | Intensity | Ions (+) | Intensity | Ions (−) | Intensity | Ions (+) | Intensity |
| CNO− | 3.59·105 | C3H5 + | 1.33·105 | CNO− | 3.44·105 | C3H7 + | 2.76·105 |
| C2H− | 8.15·104 | C4H7 + | 1.18·105 | C2H− | 6.83·104 | C3H5 + | 2.35·105 |
| O− | 4.75·104 | C3H7 + | 9.83·104 | O− | 4.48·104 | C4H7 + | 2.22·105 |
| OH− | 3.30·104 | C4H8N+ | 6.81·104 | OH− | 3.59·104 | C4H8N+ | 1.71·105 |
| C− | 1.75·104 | C4H9NO+ | 2.13·103 | C− | 1.27·104 | C2H5 + | 8.96·104 |
| CH2 − | 1.14·104 | CH2 − | 8.01·103 | C3H3O+ | 5.54·104 | ||
| C3H− | 4.22·103 | C3H− | 4.02·103 | C4H9NO+ | 1.76·104 | ||
| C3 − | 3.84·103 | C3 − | 3.56·103 | Si+ | 8.09·103 | ||
| NH2 − | 2.79·103 | NH2 − | 2.80·103 | CH3 + | 5.42·103 | ||
| S− | 5.41·102 | Si− | 1.26·103 | SiHO+ | 3.68·103 | ||
| O2 − | 3.26·102 | S− | 6.27·102 | SiH+ | 2.63·103 | ||
| O2 − | 4.55·102 | ||||||
The introduction of silica systems into the gelatin matrix did not affect the carbon or hydrogen content, which could be expected. As a result of introducing silica into gelatin matrix, silicon, aluminum, or magnesium atoms appeared, obviously due to the mineral origin of silicon additives. The percentage of oxygen or nitrogen increased. Due to the addition of ARSIL, AEROSIL, or NANOBENT the gelatin‐based matrix was reorganized during the synthesis process by the solvent casting method. New stable cross‐linking systems appeared and branches along the main chain were stabilized, including by hydrogen bonds. The aluminum or magnesium atoms present in NANOBENT affected the amorphous‐crystalline network of the designed silica‐gelatin systems, which was confirmed by prior XRD and IR Raman analyses.
The distribution of ions on the surface of the sample was analyzed by TOF SIMS. The results are presented in Figure 7 and Table 7. A low‐energy electron gun was used in surface potential mode to reduce sample charging during the analysis. Mass calibration was carried out using the mass of CH3 +, C4H8NO+ ions in positive polarization and C−, C5− ions in negative polarization. The sputtered sample, rasterized in the area of 500 × 500 µm, was etched with oxygen ions operating at 2 keV energy. Under the influence of primary ion bombardment, the proteins decompose, giving characteristic fragments of amino acid side chains, the signals of which are listed in Figure 7a,b.[ 72 ]
Figure 7.

a) TOF SIMS of base sample and b) modified sample and TOF SIMS of modified sample with micrometric silica.
The top row in Figure 7, shows photos of the GG75PVA composite and the bottom row shows images of GG75PVA.AEROSIL taken using an optical camera. Ions identified in the silica‐gelatin matrix are marked below the photos. A more intense and even distribution of C2H8N+ and C2H6N+ ions is observed for the composite with the addition of AEROISL than for the native composite. These differences supported previous spectral analyzes focusing on the presence of amide groups and elemental analysis, indicating an increase in the percentage share of elements including nitrogen and oxygen. Figure 7b presents before and after etching photos of the samples, showing Si+ ions as well as SiHO+, SiH+, and SiO+ ions. In the optical image of the ion distribution of the GG75PVA.AEROSIL composite subjected to etching, a sequence of ions originating from the silica structures is visible. As expected, the optical images reveal a fairly intense etching process—that is, the presence of silica structures in the structure of the produced film.
The addition of AEROSIL resulted in changes to the ion distribution map of more visible fragments of the structure (SiH+, SiO+, SiHO+). Overall, local concentrations of Si atoms and Si+ ions appeared in the structure of the material. Often, there is no single peak for ion masses above 200 μ, but instead a mass range of 3–5 μ, and so mass given is the middle value. Concentrated peaks around a given mass give convergent maps of ion distributions, which can be treated as pseudomolecular ions with a different number of protons. Therefore, a wider area was selected to summarize the data and to improve the quality of the map. Elemental analysis (EDS method) showed that the probably amount of NH2 −, C4H8N+, or C4H9NO+ ions increased as a result of the addition of silica compounds. Signals from O2 or OH were definitely more intense in the samples with the addition of silica compounds, which confirmed the results of FTIR spectrophotometric analysis. This may also be associated with the favorable tendency of the silica to release CO2 during decomposition, as was indicated by microbiological analysis (Section 3.9). As a result of the introduction of silica compounds, ions of the C3H3O+ or SiHO+ type appeared, entering the common polymer network, similarly to CH2 segments, the intensity of which decreased from 1.14 × 10⁴ to 8.01 × 10³. This had already been proven in the FTIR analysis to reduce the intensity of the absorption bands at 2918 cm−1.
In summary, TOF‐SIMS analysis demonstrated that silica is incorporated into the polymer network and influences the distribution of functional groups. The localized concentration of silicon (Si) suggests potential cross‐linking of gelatin by silica particles. The presence of ions originating from silica, such as SiH⁺, SiHO⁺, and SiO⁺, confirms its incorporation into the composite structure. The increased intensity of C₂H₈N⁺ and C₂H₆N⁺ ions indicates an enhancement in the number of amine groups following the addition of AEROSIL, suggesting possible interactions with polypeptide chains. Additionally, the observed decrease in CH₂ intensity (from 1.14 × 10⁴ to 8.01 × 10³) confirms structural modifications in the polymer matrix resulting from interactions with silica. Energy‐dispersive X‐ray spectroscopy (EDS) further validated the incorporation of silica into the gelatin structure, indicating changes in chemical composition and stability through interactions with amino acids and polar groups. The increased content of Si, O, and N supports the integration of silica into the gelatin matrix, while the appearance of Al and Mg (attributable to NANOBENT) suggests potential contributions of mineral additives to polymer cross‐linking. Notably, the minimal changes in C and H content indicate that the fundamental polymer skeleton remains intact.
3. Conclusions
This study presented a method for enhancing and cross‐linking polymer gel compositions using compounds based on colloidal and precipitated silica. Various analytical techniques were employed to investigate the resulting materials, including (FTIR), Raman Spectroscopy, Surface Free Energy Analysis (SFE), X‐ray Diffraction (XRD), Transmission Electron Microscopy (TEM), Thermogravimetric Analysis and Differential Scanning Calorimetry (TGA/DSC), (TOF‐SIMS), Scanning Electron Microscopy with Energy‐Dispersive X‐ray Spectroscopy (SEM/EDS), Gel Permeation Chromatography with Size Exclusion Chromatography (GPC/SEC), Shore Scale Hardness Testing, Tensile Strength (TSb), Elongation at Break (Eb), and compostability analysis. These techniques allowed for a comprehensive examination of the physicochemical changes induced by the incorporation of silica‐based cross‐linking agents.
The addition of silica compounds, both with and without Poly(vinyl alcohol) (PVA), resulted in substantial improvements in the mechanical properties of the gelatin‐based materials, with tensile strength increasing by over 50% compared to the base systems. This enhancement is attributed to interactions between silica particles and protein amino acids, as demonstrated by TOF‐SIMS mapping of individual ions. The presence of O⁻ ions suggest the possibility of forming weak intermolecular bonds such as hydrogen bonds with SiO₂ molecules, which, when formed, may weaken the primary covalent bonds between hydrogen and oxygen within the protein structure while contributing to overall network stabilization.
Thermal stability improvements were moderate, as confirmed by TGA/DSC analysis, particularly at temperatures above 300 °C. The increased stability of the gel materials is associated with the presence of ions derived from fragments of silicon structures, including Si⁺, SiO⁺, SiH⁺, and SiHO⁺. FTIR analysis revealed changes in wavenumber bands at 1100–1080 cm⁻¹ and 1700–1500 cm⁻¹, corresponding to amorphous SiO₂ as well as C═O and C─N peptide groups, suggesting interactions between the silica network and protein molecules.
The estimation of molecular weight using the GPC/SEC method, calibrated with dextran and glucans, indicated polymer molar mass values ranging from 19,700 to 24,600 Da. Analytical methods confirmed that the introduction of silica into the gelatin matrix results in an increase in hydrogen bonds between ‐OH, ‐COO⁻, and silica, interactions with amino acids such as proline, hydroxyproline, and tyrosine that influence the secondary structure of proteins, changes in the distribution of ions and elements confirming the incorporation of silica into the polymer, and the formation of new Si‐O‐Si and Si‐O‐C networks that stabilize the composite structure.
The produced silica‐gelatin matrix demonstrated good biodegradability, as evidenced by enhanced proliferation of bacteria and yeasts and the absence of fungistatic effects. The involvement of nitrogen, sulfur, and oxygen, which act as acceptors of oxidizing agents during aging processes, may contribute to the accelerated degradation process. Furthermore, the incorporation of Quinoline Yellow and Cochineal Red dyes did not negatively impact the distribution of other components within the polymer matrix, nor did it compromise the physical and chemical properties of the resulting blends.
The resulting materials, characterized by enhanced mechanical strength and biodegradability, show potential for use as carriers of active substances in capsule form for medical and agricultural applications, as well as for disposable packaging in the food industry.
4. Experimental Section
Sample preparation
Polymer gelatin blends were prepared by mixing pre‐dried gelatin, glycerin, PVA, silica additives, dye, and water in a temperature‐controlled reactor. After stirring at 75 °C for 120 minutes, the gel was molded, thermally stabilized, and plasticized into plates, from which “paddle” samples were cut. Quinoline yellow and Cochineal red dyes were used to distinguish polymer compositions and assess dye distribution due to their stability.
Research Facilities
The biopolymer composites were prepared using gelatin (Bloom 200), glycerin, PVA, and silica additives (AEROSIL, ARSIL, NANOBENT). Natural dyes, Quinoline yellow and Cochineal red, were used to distinguish compositions, considering their potential application in packaging.
Biopolymer blends were plasticized at 110 °C and 2 Ba for 5 minutes, then molded into “paddle” samples for mechanical and thermal tests. Hardness (Shore A), tensile strength, and elongation at break were measured before and after thermo‐oxidative aging. Additional analyses included contact angle (OCA 15EC), thermal stability (TGA/DSC), crystallinity (XRD), morphology (SEM/TEM), and cross‐linking via equilibrium swelling in water and toluene.
Microbiological tests were conducted following the PN EN ISO 846 standard to evaluate the effects of fungi (Aspergillus brasiliensis) and bacteria (Pseudomonas aeruginosa) on polymer materials. Samples were incubated under controlled conditions for four weeks, assessing fungistatic and antibacterial properties. Biodegradability tests were performed in a climatic chamber at 30 °C and 80% humidity. For structural and compositional analysis, FTIR (Nicolet 6700) and Raman spectroscopy (NTEGRA SPECTRA SOLAR) were used. Chromatographic analysis (GPC/SEC) was performed in NaN₃ solution, and ion distribution was examined using TOF‐SIMS spectrometry. Detailed surface characterization was conducted with secondary ion mass spectrometry under controlled vacuum conditions.
Other detailed methodological content has been collected in SI (Supporting Information).
Conflict of Interests
The authors declare no conflict of interest.
Supporting information
Supporting Information
Acknowledgments
Authors thank financial support from the National Science Center NCN, Krakow, Poland, scientific project Miniaura 4.0 2020/04/X/ST5/00869. National Science Centre NCN, Krakow, Poland, Project Miniatura 4.0 2020/04/X/ST5/00869.
Data Availability Statement
The data that support the findings of this study are available from the corresponding author upon reasonable request.
References
- 1. Brostow W., Lobland H. E. H., Materials: introduction and applications, John Wiley & Sons, 2016. [Google Scholar]
- 2. Gewert B., Plassmann M. M., MacLeod M., Environ. Sci. Process. Impacts 2015, 17, 1513. [DOI] [PubMed] [Google Scholar]
- 3. Chamas A., Moon H., Zheng J., Qiu Y., Tabassum T., Jang J. H., Suh S., ACS Sustain. Chem. Eng. 2020, 8, 3494. [Google Scholar]
- 4. Cooper D. A., Corcoran P. L., Mar. Pollut. Bull. 2010, 60, 650. [DOI] [PubMed] [Google Scholar]
- 5. Lligadas G., Ronda J. C., Galia M., Cadiz V., Mater. Today 2013, 16, 337. [Google Scholar]
- 6. Das S. K., Sathish A., Stanley J., Mater. Today: Proc. 2018, 8, 16774. [Google Scholar]
- 7. Mroczkowska M., Germaine K., Culliton D., Kakouli Duarte T., Neves A. C., Recycling 2021, 6, 81. [Google Scholar]
- 8. Fakhouri F. M., Costa D., Yamashita F., Martelli S. M., Jesus R. C., Alganer K., Innocentini‐Mei L. H., Carbohydr. Polym. 2013, 95, 681. [DOI] [PubMed] [Google Scholar]
- 9. Mroczkowska M., Culliton D., Germaine K., Neves A., Clean Technologies 2021, 3, 424. [Google Scholar]
- 10. Sampaio A. P. C., de Sá M de Sousa Filho M., Castro A. L. A., de Figueirêdo M. C. B., Int. J. Life Cycle Assess. 2017, 22, 767. [Google Scholar]
- 11. Razza F., Innocenti F. D., Asia‐Pac. J. Chem. Eng. 2012, 7, S301. [Google Scholar]
- 12. Zhang S., Fu Q., Li H., Wu P., Waterhouse G. I., Li Y., Ai S., Chem. Eng. J. 2023, 463, 142452. [Google Scholar]
- 13. Felix M., Perez‐Puyana V., Romero A., Guerrero A., J. Polym. Environ. 2017, 25, 91. [Google Scholar]
- 14. Félix M., Lucio‐Villegas A., Romero A., Guerrero A., Ind. Crops Prod. 2016, 79, 152. [Google Scholar]
- 15. Naser A. Z., Deiab I., Darras B. M., RSC Adv. 2021, 11, 17151. [DOI] [PMC free article] [PubMed] [Google Scholar]
- 16. Boey J. Y., Mohamad L., Khok Y. S., Tay G. S., Baidurah S., Polymers 2021, 13, 1544. [DOI] [PMC free article] [PubMed] [Google Scholar]
- 17. Runnels C. M., Lanier K. A., Williams J. K., Bowman J. C., Petrov A. S., Hud N. V., Williams L. D., J. Mol. Evol. 2018, 86, 598. [DOI] [PMC free article] [PubMed] [Google Scholar]
- 18. Chaudhary S., Jain V. P., Jaiswar G., The composition of polysaccharides: monosaccharides and binding, group decorating, polysaccharides chains. In Innovation in Nano‐Polysaccharides for Eco‐sustainability, Elsevier, 2022, pp. 83. [Google Scholar]
- 19. Zou Q., Yan X., Chem. Eur. J. 2018, 24, 755. [DOI] [PubMed] [Google Scholar]
- 20. De Leeuw J. W., Largeau C., A review of macromolecular organic compounds that comprise living organisms and their role in kerogen, coal, and petroleum formation. Organic geochemistry: principles and applications, 1993, pp. 23. [Google Scholar]
- 21. Crisma M., Formaggio F., Moretto A., Toniolo C., Pept. Sci. 2006, 84, 3. [Google Scholar]
- 22. Dyson H. J., Wright P. E., Scheraga H. A., Proc. Natl. Acad. Sci. USA 2006, 103, 13057. [DOI] [PMC free article] [PubMed] [Google Scholar]
- 23. Yan X., Zhu P., Li J., Chem. Soc. Rev. 2010, 39, 1877. [DOI] [PubMed] [Google Scholar]
- 24. Boran G., Regenstein J. M., Adv. Food. Nutr. Res. 2010, 60, 119. [DOI] [PubMed] [Google Scholar]
- 25. Hanani Z. N., Roos Y. H., Kerry J. P., Food Hydrocolloids 2012, 29, 144. [Google Scholar]
- 26. Hafidz R. M. R. N., Yaakob C. M., Amin I., Noorfaizan A., Int. Food Res. J. 2011, 18, 787. [Google Scholar]
- 27. Gómez‐Guillén M. C., Giménez B., López‐Caballero M. A., Montero M. P., Food Hydrocolloids 2011, 25, 1813. [Google Scholar]
- 28. Folino A., Karageorgiou A., Calabrò P. S., Komilis D., Sustainability 2020, 15, 6030. [Google Scholar]
- 29. Njaramba L. K., Kim M., Yea Y., Yoon Y., Park C. M., Chem. Eng. J. 2023, 452, 139426. [Google Scholar]
- 30. Liu H., Yan X., Jiu J., Li J. J., Zhang Y., Wang G., Wang B., Chem. Eng. J. 2023, 451, 138806. [Google Scholar]
- 31. Mahony O., Tsigkou O., Minelli C., Ling L., Hanly R., Smith M. E., Stevens M. M., Jones J. R., Adv. Funct. Mater. 2010, 20, 3835. [Google Scholar]
- 32. Xue N., Cui H., Dong W., Chu W., Li M., Jiang H., Wei N., Eng. J. 2022, 455, 140614. [Google Scholar]
- 33. Dupree E., Pettifer R. F., Nature 1984, 308, 523. [Google Scholar]
- 34. Soares S. F., Fateixa S., Trindade T., Daniel‐da‐Silva A. L., Adv Compos Hybrid Mater 2022, 5, 884. [Google Scholar]
- 35. Walley S. M., Field J. E., DYMAT 1994, 1, 211. [Google Scholar]
- 36. Chen W. W., Song B., Dynamic characterization of soft materials, Dynamic failure of materials and structures, 2010, pp. 1. [Google Scholar]
- 37. Liu Q. X., Xu W. C., Adv. Mater. Res. 2012, 512, 2428. [Google Scholar]
- 38. Ahmed W., Siraj S., Al‐Marzouqi A. H., Polymers 2021, 13, 2423. [DOI] [PMC free article] [PubMed] [Google Scholar]
- 39. Dobrzański L. A., Dobrzańska‐Danikiewicz A. D., Obróbka powierzchni materiałów inżynierskich, Gliwice, Poland: International OCSCO World Press, 2011. [Google Scholar]
- 40. Jain N., Singh V. K., Chauhan S., J. Mech. Behav. Mat. 2017, 26, 213. [Google Scholar]
- 41. Weng W., Zheng H., Food Chem. 2015, 169, 255. [DOI] [PubMed] [Google Scholar]
- 42. Szumera M., LAB Laboratoria, Aparatura, Badania 2013, 1, 24. [Google Scholar]
- 43. Daviau K., Lee K. K., Phys. Rev. B 2017, 96, 174102. [Google Scholar]
- 44. de Buyl F., Yoshida S., Degradation mechanisms of silicones, Reliability of organic compounds in microelectronics and optoelectronics, 2022, no. 1. [Google Scholar]
- 45. Schulnell M., TECHNIKI I METODY: Analiza termiczna – interpretacja krzywych (część IV) 2021, 4, 4. [Google Scholar]
- 46. Kalogeras I. M., Hagg Lobland H. E., J. Mater. Educ. 2012, 34, 69. [Google Scholar]
- 47. Liu R., Qiao C., Liu Q., Yao J., Xu J., Soft Matter 2024, 20, 1603. [DOI] [PubMed] [Google Scholar]
- 48. Martucci J. F., Accareddu A. E. M., Ruseckaite R. A., J. Mater. Sci. 2012, 47, 3282. [Google Scholar]
- 49. Bigi A., Borghi M., Cojazzi G., Fichera M. A., Panzavolta S., Roveri N., J. Therm. Anal. Calorim. 2000, 2, 451. [Google Scholar]
- 50. Staroszczyk H., Pielichowska J., Sztuka K., Stangret J., Kołodziejska I., Food Chem. 2012, 2, 335. [Google Scholar]
- 51. Gómez‐Guillén M. C., Turnay J., Fernández‐Dıaz M. D., Ulmo N., Lizarbe M. A., Montero P., Food Hydrocolloids 2002, 1, 25. [Google Scholar]
- 52. Bigi A., Panzavolta S., Rubini K., Biomaterials 2004, 25, 5675. [DOI] [PubMed] [Google Scholar]
- 53. Arunan E., Desiraju G. R., Klein R. A., Sadlej J., Scheiner S., Alkorta I., Nesbitt D. J., Pure Appl. Chem. 2011, 83, 1637. [Google Scholar]
- 54. Sobczyk L., Wiązania wodorowe, praca zbiorowa, Warszawa: Państwowe Wydawnistwo Naukowe PWN, 1969. [Google Scholar]
- 55. Li B., Sun Y., Yao J., Shen Y., Wu H., Li J., Yang M., Int. J. Biol. Macromol. 2022, 222, 938. [DOI] [PubMed] [Google Scholar]
- 56. Touzout Z., Abdellaoui N., Hadj‐Hamou A. S., Int. J. Biol. Macromol. 2024, 263, 130389. [DOI] [PubMed] [Google Scholar]
- 57. Alpha Nanotech Silica Nanospheres , Alpha Nanotech Silica Nanospheres, [Online]. Available: https://www.alphananotechne.com/silica‐nanoparticles?gclid=EAIaIQobChMIvfzb‐raj‐wIVcxDmCh3‐fQ2hEAAYAiAAEgI0svD_BwE
- 58. Jo Y.‐R., Myeong S.‐H., Kim B.‐J., RSC Adv. 2018, 8, 5158. [DOI] [PMC free article] [PubMed] [Google Scholar]
- 59. Sethi V., Kaur M., Thakur A., Rishi P., Kaushik A., Int. J. Biol. Macromol. 2022, 222, 844. [DOI] [PubMed] [Google Scholar]
- 60. Hia E. M., Jang S. R., Maharjan B., Park J., Park C. H., Kim C. S., Int. J. Biol. Macromol. 2024, 262, 130218. [DOI] [PubMed] [Google Scholar]
- 61. Zhao Y., Jia S., Yuan H., Li Y., Qi R., Yuan H., Int. J. Biol. Macromol. 2024, 261, 129209. [DOI] [PubMed] [Google Scholar]
- 62. Tshela N., Prochoń M., J. Therm. Anal. Calorim. 2016, 125, 1151. [Google Scholar]
- 63. Prochoń M., Marzec A., Szadkowski B., Materials 2019, 12, 1684. [DOI] [PMC free article] [PubMed] [Google Scholar]
- 64. Mousavi A., Mashayekhan S., Baheiraei N., Pourjavadi A., Int. J. Biol. Macromol. 2021, 180, 692. [DOI] [PubMed] [Google Scholar]
- 65. Wang W., Huang D., Kang Y., Wang A., Colloid Surf B 2013, 106, 51. [DOI] [PubMed] [Google Scholar]
- 66. Andrei M. E., Pogareva V. G., Chem. Geol. 2006, 229, 198. [Google Scholar]
- 67. Brodsky M. H., Cardona M., Cuomo J. J., Phys. Rev. B 1977, 8, 3556. [Google Scholar]
- 68. Sarbon N. M., Badii F., Howell N. K., Food Hydrocolloids 2013, 1, 143. [Google Scholar]
- 69. Wiœniewski M., Sionkowska A., Kaczmarek H., Lazare S., Tokarev V., Polimery 2007, 52, 25. [Google Scholar]
- 70. Wiśniewski M., Sionkowska A., Kaczmarek H., Lazare S., Tokariew W., Polimery 2007, 4. [Google Scholar]
- 71. Raevskaya A. E., Stroyuk A. L., Kuchmiy S. Y., Dzhagan V. M., Zahn D. R. T., Schulze S., Solid State Commun. 2008, 145, 288. [Google Scholar]
- 72. Lhoest J. B., Wagner M. S., Tidwell C. D., Castner D. G., Characterization of adsorbed protein films by time of flight secondary ion mass spectrometry. Journal of Biomedical Materials Research: An Official Journal of The Society for Biomaterials, The Japanese Society for Biomaterials, and The Australian Society for Biomaterials and the Korean Society for Biomaterials, 2001, 57, 432. [DOI] [PubMed] [Google Scholar]
Associated Data
This section collects any data citations, data availability statements, or supplementary materials included in this article.
Supplementary Materials
Supporting Information
Data Availability Statement
The data that support the findings of this study are available from the corresponding author upon reasonable request.