Abstract
Maltose-limited, continuous growth of the hyperthermophile Thermotoga maritima at different temperatures and dilution rates (80°C/0.25 h−1, 80°C/0.17 h−1, and 85°C/0.25 h−1) showed that transcriptome-wide variation in gene expression within mechanical steady states was minimal compared to that between steady states, supporting the efficacy of chemostat-based approaches for functional genomics studies.
Continuous culture can be an effective tool for determining global transcriptional patterns in functional genomics studies (5). It may also be useful for examining the fluctuation in gene expression that arises within a specific environmental context or growth condition. It is not clear yet whether biovariability in gene expression in unperturbed cells impacts the interpretation of transcriptional response to intended perturbations. Thus, some of the variation between experimental conditions could reflect the variation within an experimental condition. This issue was examined by using a whole-genome cDNA microarray for Thermotoga maritima, an obligately anaerobic, hyperthermophilic, heterotrophic bacterium growing optimally at 80°C (2, 4, 8). Chemostat-based transcriptional response experiments with whole-genome cDNA microarrays were used to investigate sources of variance that contribute to the observed patterns of differential gene expression both within and between mechanical steady states (temperature and dilution rate) by using three common procedures used to assign differential gene expression.
Experimental overview.
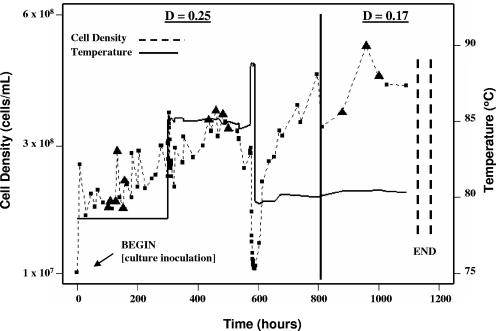
A full-genome Thermotoga maritima DNA microarray constructed from PCR products (3) was used to measure transcriptional variation during continuous cultivation (6). Three mechanical steady states chosen to reflect perturbations within the normal growth range of the organism were examined: 80°C at a dilution rate of 0.25 h−1 (six samples taken at 103.7, 109.3, 127.7, 133.4, 151.8, and 157.5 h [19.4 generations]), 85°C at a dilution rate of 0.25 h−1 (four samples taken at 435.4, 459.6, 483.4, and 501.7 h [23.9 generations]), and 80°C at a dilution rate of 0.17 h−1 (three samples taken at 879.0, 958.5, and 1,000.0 h [29.7 generations]) (Fig. 1). Isolation of total RNA, hybridizations and washes were performed as described previously (9). Slides were scanned with a Scanarray 4000 scanner (Perkin Elmer, Fremont, CA) and the raw intensity data were processed as described previously (1). The hybridization scheme was arranged according to a loop design strategy, which allows statistically efficient comparisons between samples (11).
FIG. 1.
Growth of Thermotoga maritima in continuous culture. Six samples (at different time points) were taken at 80°C at a dilution rate of 0.25 h−1; four samples (at different time points) were taken at 85°C at a dilution rate of 0.25 h−1; and three samples (at different time points) were taken at 80°C at a dilution rate of 0.17 h−1. Sample points used in the study are indicated with the filled triangles. Optical densities of samples collected from the chemostat outflow were measured every hour for each steady state, and cell densities (squares) were determined by epifluorescent cell count enumeration. An attempt to stabilize the chemostat at a dilution rate of 0.25 h−1 and 90°C (the reported upper temperature limit of growth for T. maritima [2]), prior to shifting to a lower dilution rate (0.17 h−1) was made; however, washout occurred under these conditions. The solid line indicates temperature.
Simple “fold change” criteria and estimate-based probabilities.
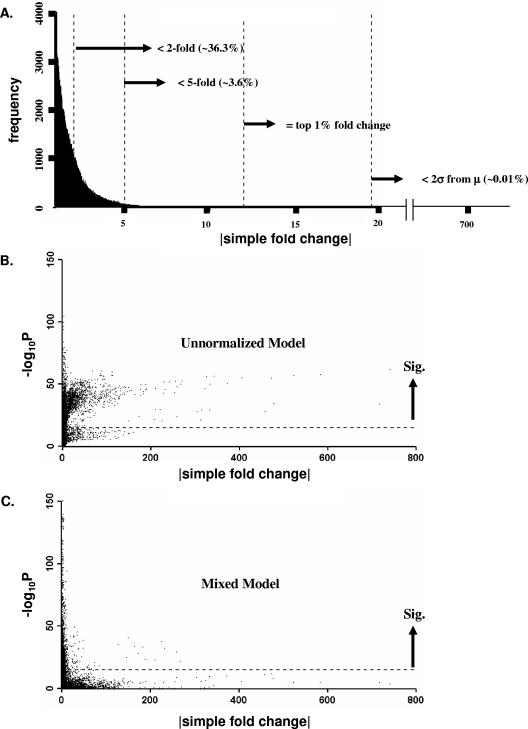
Differential gene expression calls based on simple fold change criteria were evaluated by pairwise t tests derived from least-squares mean estimates from log2-transformed raw signal intensity data and mixed model analyses (1). The log2-transformed analysis is referred to as “unnormalized” because systematic global variation remained confounded with growth state effects; important sources of variation were taken into account through mixed model analyses. Over 36% of the open reading frames (ORFs) on the array were changed by the “twofold change rule” (Fig. 2A), but most of these simple fold change calls were not significant by statistical criteria. Even fold changes greater than 20-fold did not ensure that changes were statistically significant (Fig. 2B and C).
FIG. 2.
Gene expression calls for three different methods. (A) Shown is the distribution of simple fold change calls. Simple fold change was calculated by dividing the mean signal intensities from one sample by the mean signal intensities from a comparison sample, after balancing Cy3/Cy5 signal intensity channels across arrays. (B) Unnormalized log2-transformed significance measures are shown as a function of simple fold changes. (C) Mixed model significance versus simple fold changes. A total of 148,368 comparisons were made in the experiment. The dotted lines in panels B and C correspond to a Bonferroni corrected significance level (α) of 3.37 × 10⁻⁷, representing a conservative cutoff that bounds the experiment-wise false-positive error rate at 0.05. Statistical tests based on unnormalized estimate differences were in close agreement with simple fold change methods for fold changes greater than 10-fold (data not shown), but estimates resulting from mixed model analyses did not depend strongly on degree of fold change for any fold change threshold.
Selected discrepancies between methods are shown in Table 1. The effect of growth rate on transcription response has yet to be characterized in T. maritima, but comparison with a previous study describing the dynamic expression of temperature-inducible CIRCE-related genes (7) in the organism provided biological support for the utility of the mixed model procedure. Here, increased expression of the CIRCE-related genes were called more often using significance criteria from the mixed model approach than from the unnormalized method or twofold simple fold change cutoffs for growth at 85°C compared to growth at 80°C.
TABLE 1.
Selected discrepant genes up-regulated due to temperature or growth rate effectsa
| Locus | Function | n1.25 | Value for n1.25
|
n2.0 | Value for n2.0
|
n5.0 | Value for n5.0
|
|||
|---|---|---|---|---|---|---|---|---|---|---|
| % UN | % MM | % UN | % MM | % UN | % MM | |||||
| Temperature effects (85°C vs 80°C) (CIRCE regulon) | ||||||||||
| TM0373 | DnaK protein | 9 | 11.1 | 33.3 | 18 | 16.7 | 38.9 | 24 | 16.7 | 45.8 |
| TM0374 | Heat shock protein class I | 4 | 0 | 100 | 16 | 0 | 100 | 24 | 4.2 | 100 |
| TM0505 | GroES | 3 | 0 | 100 | 14 | 0 | 100 | 24 | 4.2 | 24 |
| TM0506 | GroEL | 0 | 5 | 0 | 60 | 24 | 25 | 41.7 | ||
| TM0849 | DnaJ protein | 0 | 5 | 0 | 0 | 22 | 22.7 | 0 | ||
| TM0850 | GrpE protein | 8 | 0 | 37.5 | 18 | 0 | 33.3 | 24 | 0 | 25 |
| TM0851 | Heat shock operon repressor HrcA | 9 | 0 | 100 | 19 | 0 | 78.9 | 24 | 0 | 66.7 |
| Growth rate effects (D = 0.17 h−1 vs D = 0.25 h−1) | ||||||||||
| TM0402 | Ammonium transporter | 4 | 100 | 100 | 9 | 100 | 100 | 18 | 100 | 100 |
| TM0403 | Nitrogen regulatory protein P-II | 2 | 100 | 100 | 16 | 81.3 | 100 | 18 | 83.3 | 100 |
| TM0451 | Ribosomal protein L33 | 4 | 25 | 50 | 13 | 53.8 | 53.8 | 18 | 33.3 | 61.1 |
| TM0454 | Ribosomal protein L11 | 3 | 33.3 | 100 | 15 | 20 | 100 | 18 | 16.7 | 100 |
| TM0455 | Ribosomal protein L1 | 2 | 100 | 0 | 6 | 100 | 0 | 6 | 100 | 0 |
| TM0456 | Ribosomal protein L10 | 5 | 60 | 0 | 15 | 75 | 0 | 18 | 66.7 | 0 |
| TM1835 | Cyclomaltodextrinase, putative | 0 | 10 | 0 | 70 | 18 | 0 | 66.7 | ||
| TM1840 | Alpha-amylase | 6 | 0 | 100 | 8 | 0 | 100 | 17 | 0 | 88.2 |
| TM1845 | Pullulanase | 1 | 0 | 100 | 8 | 0 | 75 | 18 | 0 | 72.2 |
For the number of comparisons less than a given simple fold change threshold (nx refers to the number of occurrences less than an x-fold change), the percentages of occurrence genes that were detected to be differentially expressed using the unnormalized log2-transformed (% UN) or mixed model (% MM) methods are shown. A total of 24 comparisons were possible for each temperature effect and 18 comparisons were possible for each dilution rate effect (Fig. 1). Genes corresponding to the CIRCE regulon are known to be induced by temperature upshift in T. maritima (7) and were chosen as a benchmark for comparison. D, dilution rate.
Biological trends in expression based on mixed model analyses.
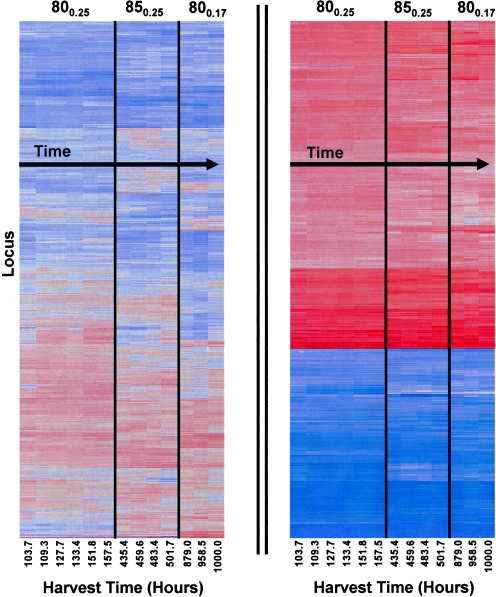
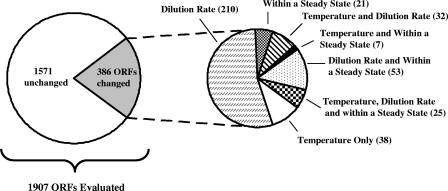
As visualized in the overall least-squares mean heat plot, expression of most ORFs within a steady state was relatively consistent over time (Fig. 3). Such consistency within and between growth conditions was expected, given the relatively mild levels of perturbation studied here. However, the mixed model approach led to a total of 386 differentially expressed ORFs (or about 20% of the 1,907 ORFs examined; the full set of differentially expressed genes will be published online at http://www.che.ncsu.edu/extremophiles/) in spite of the overall stability in expression (Fig. 4). Of this number, 102 transcripts were differentially regulated at the elevated temperature and 320 transcripts were significantly different at the reduced dilution rate (57 ORFs were modulated in response to both perturbations). Most ORFs differentially expressed between steady states (301/386 ORFs or about 88% of the final gene list) were not differentially expressed within a steady state, but those that were called indicate the need for multiple samplings within a treatment condition.
FIG. 3.
Hierarchical clusters constructed by using least-squares mean estimates. Harvest times (hours since reactor inoculation) and steady-state regions are indicated. Each row represents a different gene in the organism.
FIG. 4.
Summary of transcriptional responses within and between steady states. Significant findings (adjusted P, <0.05) are reported for global transcriptional responses within and between the mechanical steady states at 80°C (dilution rates of 0.25 h−1 and 0.17 h−1) and 85°C (dilution rate of 0.25 h−1). Differentially expressed ORFs within a given steady state for all three mechanical steady states are summed together and reported as “Steady State.” Significant ORFs in each pie chart are mutually exclusive to the stated category.
Experiments designed to study the influence of growth temperature on transcription in prokaryotes have usually been conducted in batch cultures, in which an increase in growth temperature leads to a corresponding increase in cell growth rate. However, the continuous culture presented a means to investigate the effects of temperature apart from growth rate considerations. While heat shock genes were induced in T. maritima at 85°C and 80°C (Table 1), about 75% of the ORFs with significant transcriptional differences due to growth temperature were down-regulated at the higher growth temperature. These included genes from most annotated prokaryotic clusters of functional categories of orthologous groups of proteins (COGs) (10). No COG functional categories were up-regulated due to growth at the higher temperature, but ORFs belonging to COG functional categories E (amino acid transport and metabolism), G (carbohydrate transport and metabolism), K (transcription), P (inorganic ion transport and metabolism), and M (cell envelope biogenesis and lipid metabolism) were down-regulated at the increased temperature. This downshift of major functional groups may indicate that at 85°C (5 degrees higher than the reported growth temperature optimum for this organism), T. maritima is devoting cellular resources to rescue and recovery efforts.
Transcriptional adjustments also arose from a change in the dilution rate. Among the ORFs showing the most significant changes were genes encoding a putative ammonium transporter, various ribosomal proteins, and enzymes involved in the processing of the growth substrate (maltose), which were all up-regulated at the lower dilution rate (Table 1). Nearly one-third of all the transcriptional differences due to dilution rate were ORFs encoding genes involved in the transport and metabolism of amino acids and carbohydrates.
In conclusion, repeated samplings of three different mechanical steady states demonstrated that transcriptional variation was remarkably constant in spite of possibly influential mechanisms operating within and upon the vessel. Thus, the key finding of this study is that continuous culture used with appropriate statistical models is an excellent tool for functional genomics investigations.
Acknowledgments
This work was supported in part by grants from the Department of Energy (Energy Biosciences Program) and the National Science Foundation (Biotechnology Program). K.R.S. was supported by a Department of Education GAANN Fellowship. S.B.C. was supported by a National Institute of Environmental Health Sciences traineeship in Bioinformatics.
REFERENCES
- 1.Chhabra, S. R., K. R. Shockley, S. B. Conners, K. L. Scott, R. D. Wolfinger, and R. M. Kelly. 2003. Carbohydrate-induced differential gene expression patterns in the hyperthermophilic bacterium Thermotoga maritima. J. Biol. Chem. 278:7540-7552. [DOI] [PubMed] [Google Scholar]
- 2.Huber, R., T. A. Langworthy, H. Konig, M. Thomm, C. R. Woese, U. B. Sleytr, and K. O. Stetter. 1986. Thermotoga maritima sp. nov. represent a new genus of unique extremely thermophilic eubacteria growing up to 90°C. Arch. Microbiol. 144:324-333. [Google Scholar]
- 3.Johnson, M. R., C. I. Montero, S. B. Conners, K. R. Shockley, S. L. Bridger, and R. M. Kelly. 2005. Population density-dependent regulation of exopolysaccharide formation in the hyperthermophilic bacterium Thermotoga maritima. Mol. Microbiol. 55:664-674. [DOI] [PubMed] [Google Scholar]
- 4.Nelson, K. E., R. A. Clayton, S. R. Gill, M. L. Gwinn, R. J. Dodson, D. H. Haft, E. K. Hickey, J. D. Peterson, W. C. Nelson, K. A. Ketchum, L. McDonald, T. R. Utterback, J. A. Malek, K. D. Linher, M. M. Garrett, A. M. Stewart, M. D. Cotton, M. S. Pratt, C. A. Phillips, D. Richardson, J. Heidelberg, G. G. Sutton, R. D. Fleischmann, J. A. Eisen, C. M. Fraser, et al. 1999. Evidence for lateral gene transfer between archaea and bacteria from genome sequence of Thermotoga maritima. Nature 399:323-329. [DOI] [PubMed] [Google Scholar]
- 5.Piper, M. D., P. Daran-Lapujade, C. Bro, B. Regenberg, S. Knudsen, J. Nielsen, and J. T. Pronk. 2002. Reproducibility of oligonucleotide microarray transcriptome analyses. J. Biol. Chem. 277:37001-37008. [DOI] [PubMed] [Google Scholar]
- 6.Pysz, M. A., K. D. Rinker, K. R. Shockley, and R. M. Kelly. 2001. Continuous cultivation of hyperthermophiles. Methods Enzymol. 330:31-40. [DOI] [PubMed] [Google Scholar]
- 7.Pysz, M. A., D. E. Ward, K. R. Shockley, C. I. Montero, S. B. Conners, M. R. Johnson, and R. M. Kelly. 2004. Transcriptional analysis of dynamic heat-shock response by the hyperthermophilic bacterium Thermotoga maritima. Extremophiles 8:209-217. [DOI] [PubMed] [Google Scholar]
- 8.Rinker, K. D., and R. M. Kelly. 2000. Effect of carbon and nitrogen sources on growth dynamics and exopolysaccharide production for the hyperthermophilic archaeon Thermococcus litoralis and bacterium Thermotoga maritima. Biotechnol. Bioeng. 69:537-547. [DOI] [PubMed] [Google Scholar]
- 9.Shockley, K. R., D. E. Ward, S. R. Chhabra, S. B. Conners, C. I. Montero, and R. M. Kelly. 2003. Heat shock response by the hyperthermophilic archaeon Pyrococcus furiosus. Appl. Environ. Microbiol. 69:2365-2371. [DOI] [PMC free article] [PubMed] [Google Scholar]
- 10.Tatusov, R. L., D. A. Natale, I. V. Garkavtsev, T. A. Tatusova, U. T. Shankavaram, B. S. Rao, B. Kiryutin, M. Y. Galperin, N. D. Fedorova, and E. V. Koonin. 2001. The COG database: new developments in phylogenetic classification of proteins from complete genomes. Nucleic Acids Res. 29:22-28. [DOI] [PMC free article] [PubMed] [Google Scholar]
- 11.Yang, Y. H., and T. Speed. 2002. Design issues for cDNA microarray experiments. Nat. Rev. Genet. 3:579-588. [DOI] [PubMed] [Google Scholar]


