

Summary
Oncolytic viruses (OVs) combined with radiotherapy (RT) show promise but are limited by challenges such as poor intravenous delivery and insufficient RT-induced DNA damage. In this study, an oncolytic adenovirus (AD) formulation, RadioOnco (AD@PSSP), is developed to improve delivery, infectivity, immune response, and RT efficacy. The multifunctional polyethylenimine (PEI)-selenium-polyethylene glycol (PEG) (PSSP) enhances intravenous delivery, shields the virus from rapid clearance, and enables targeted delivery to tumor sites after RT. The exposed PEI enhances the infectivity of AD through electrostatic interactions, thereby increasing DNA damage after RT by inhibiting the expression of DNA repair proteins, such as CHEK1 and CDK1. Furthermore, AD-PEI captures and delivers RT-induced tumor-released antigens to lymph nodes, activating robust anti-tumor immune responses. Animal model data demonstrate that RadioOnco overcomes RT resistance, targets distant metastases, and promotes long-term immunity, addressing metastasis and recurrence. In summary, this intravenously injectable OV enhances RT synergy through surface modification with multifunctional materials.
Keywords: oncolytic viruses, adenovirus, radiotherapy, radiotherapy resistance, radiotherapy sensitizer, synergistic therapy, DNA damage and repair, antigen capture, anti-tumor immune responses, ROS-responsive materials
Graphical abstract
Highlights
-
•
RadioOnco can release AD-PEI under the ROS produced by tumor irradiation at a dose of 2 Gy
-
•
The released AD-PEI can enhance the sensitivity to RT through the CHK1-CDK1 pathway
-
•
AD-PEI enhances post-RT immune killing by capturing antigens to the lymph nodes
-
•
Animal studies show RadioOnco combined with RT has strong clinical translational value
Xu et al. develop RadioOnco (AD@PSSP), an oncolytic adenovirus formulation that enhances intravenous delivery, viral infectivity, immune response, and radiotherapy efficacy. Through PEGylation, ROS-responsive Se-Se bonds, and PEI modification, it reverses RT resistance, targets tumors, and boosts anti-tumor immunity, showing promise for overcoming metastasis and recurrence in clinical RT.
Introduction
Oncolytic viruses (OVs) represent a promising cancer therapeutic approach, leveraging their ability to selectively lyse tumor cells and modulate the tumor microenvironment (TME).1,2,3 However, optimal treatment of metastatic or recurrent tumors usually requires the additional use of radiotherapy (RT).4,5 RT-induced antigen release amplifies the immune response triggered by OVs, while viral infection of tumor cells impedes the repair of RT-induced DNA damage, which enhances RT efficacy. Recent clinical investigations into the combined modality of engineered OVs and RT have confirmed its safety profile. However, the therapeutic efficacy has fallen short of expectations.6,7,8,9,10,11,12,13,14,15,16,17,18 The primary challenge is the insufficient infectivity of OVs at tumor sites, which results in a weak anti-tumor immune response. Additionally, the intratumoral administration of OVs limits their use to tumors that are easily accessible, posing significant challenges for treating metastatic lesions. Addressing these limitations requires the development of advanced synthetic delivery systems tailored for OVs in combination with RT.
Recent advances in nucleic acid drug delivery, particularly through lipid-based nano delivery systems, have provided new technical possibilities19. For instance, cationic liposomes enhance intracellular delivery of nucleic acids via electrostatic adsorption, while responsive liposomes facilitate intravenous (i.v.) administration.20 These innovations could effectively overcome issues of insufficient viral infectivity and limited applicability due to the method of administration. Similar to cationic liposome technology, cationic polymers like polyethylenimine (PEI) have shown potential when complexed with OVs, promoting cellular uptake through charge-mediated internalization.21,22 PEI-based polymers also serve as in situ tumor vaccine carriers by adsorbing tumor antigens released post-RT.23,24
Intratumoral injection is the only approved method for administration of OVs, often limiting therapeutic effects to the injection site.25 i.v. delivery could improve efficacy by exposing all tumor sites, including metastatic lesions, to OVs.26 Various strategies, including retargeting, cell carriers, polymer coatings, and liposomes, have been explored to facilitate i.v. administration of OVs.27,28,29,30 However, these modifications often reduce the viral infectivity, hindering clinical translation.31,32,33 Responsive material modifications, which enable the shedding of the protective shell at lesion sites, could restore the biological activity of OVs.34,35,36 In the context of combining OVs with RT, RT-induced reactive oxygen species (ROSs) have been extensively studied as triggers for carrier conformational changes, leading to the development of ROS-responsive carriers, including selenium-containing variants.37,38
In this study, we developed an OV tailored for RT (RadioOncolytic virus, RadioOnco) via surface integration with multifunctional PEI-Se-Se-polyethylene glycol (PEG) (PSSP), termed AD@PSSP (Figure 1A). This modification endows the OVs with multiple functionalities, including i.v. injectability, enhanced infectivity, and anti-tumor immune response. The PEGylation strategy is designed to shield the OVs from rapid clearance, extending their circulation in the bloodstream. The Se-Se bond is designed to be responsive to ROS produced in the tumor following low-dose RT, facilitating PEG detachment and restoring the OV’s infective capacity. Furthermore, our findings reveal that, post-RT, PEI can enhance the infection of tumor cells with OVs through electrostatic interactions. Interestingly, AD-PEI can attenuate the expression of CHEK1 and CDK1 proteins, inhibiting the repair of RT-induced DNA damage in tumor cells. We also demonstrated that AD-PEI can act as an in situ tumor vaccine, using PEI to capture antigens, significantly amplifying antigen-specific immune responses and generating long-term immunological memory (Figure 1B). The components of RadioOnco (AD@PSSP) have been shown to be safe for human application. The preparation of AD@PSSP is straightforward and highly reproducible and significantly enhances RT efficacy through multiple pathways.
Figure 1.

Design and mechanism of action of RadioOncolytic virus (RadioOnco, AD@PSSP)
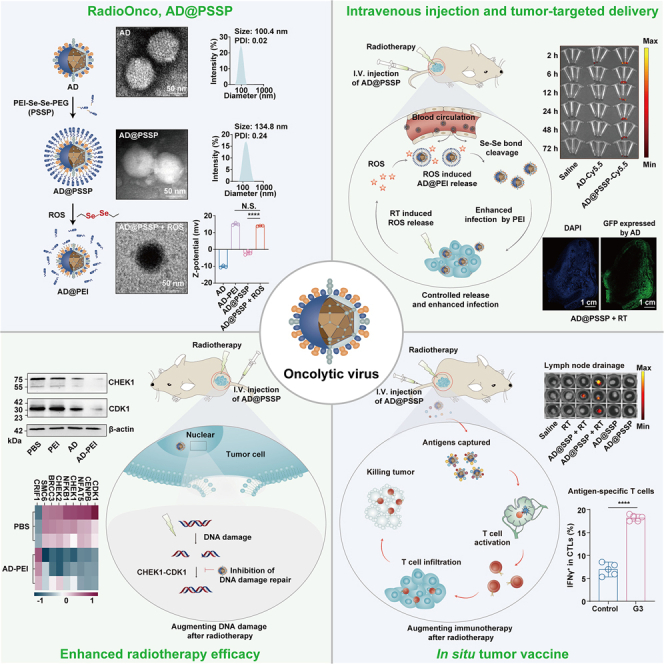
(A) AD@PSSP is an OV platform designed for enhanced radiosensitization. The OV surface is modified with PEI-Se-Se-PEG, providing key benefits: (1) i.v. injectability, (2) increased infectivity, and (3) robust anti-tumor immune response. PEGylation prolongs circulation by preventing rapid clearance, while the ROS-sensitive Se-Se bond promotes PEG detachment and restores infectivity at the tumor site during low-dose RT.
(B) The anti-tumor mechanisms of AD@PSSP in combination with RT. After i.v. injection, the PEGylated AD@PSSP extends its circulatory half-life. ROS produced at the tumor site following RT facilitates PEG shell shedding, which exposes the PEI component, enhancing viral infection via electrostatic interactions with tumor cells. Additionally, AD@PSSP inhibits the CHEK1-CDK1 pathway, suppressing the DNA damage repair response induced by RT. Moreover, AD@PSSP functions as an in situ tumor vaccine, using PEI to capture antigens, thereby boosting antigen-specific immune responses and promoting long-lasting immune memory.
Results
Preparation and characterization of AD@PSSP
To facilitate i.v. administration of OVs, we employed electrostatic adsorption to modify the surface of oncolytic adenovirus (AD) type 11 with multifunctional PSSP. We established the optimal ratios of AD to PSSP for various molecular weights (5, 10, 20, and 30 kDa) to be 6 × 10⁶/Vp, 3.2 × 10⁶/Vp, 1.6 × 10⁶/Vp, and 1 × 10⁶/Vp, respectively (Figure S1A). The resistance of PEGylated AD to neutralizing antibodies and macrophage phagocytosis was found to enhance with increasing PEG molecular weight, reaching its apex at 20 kDa (Figures S1B and S1C). Conversely, the infection efficiency of PEGylated AD in TC-1 cells and HCT-116 cells was inversely proportional to the PEG’s molecular weight (Figures S1D and S1E). Subsequently, we intravenously administered Cy5.5-labeled AD and AD@PSSP to TC-1-bearing mice. Ex vivo imaging data indicated that PEG modification reduced AD accumulation in the liver and kidneys while augmenting tumor-site enrichment (Figures S1F–S1H). We selected a PEG molecular weight of 20 kDa for subsequent experiments, as this value was found to reach a critical threshold based on comprehensive data.
The morphology and sizes of both AD and AD@PSSP were scrutinized using transmission electron microscopy (TEM) and dynamic light scattering (DLS). AD exhibited a distinct spike structure with an average diameter of 100.4 nm (Figure 2A). Upon PSSP modification, these spikes disappeared, and the particle size increased to 134.8 nm (Figure 2B), confirming successful PEGylation. Simultaneous barium iodide staining (to detect PEG) and sodium dodecyl sulfate-polyacrylamide gel electrophoresis (SDS-PAGE) staining (to detect the major structural proteins of AD) were performed on AD@PSSP, providing evidence for the successful PEGylation (Figure S1A). Moreover, AD@PSSP maintained stability under repeated freeze-thaw cycles, indicating its potential for long-term storage at low temperatures (Figure S2A). We also observed that PEGylation decreased nonspecific infection and cytotoxicity of AD toward normal human umbilical vein endothelial cells (Huvec), thus enhancing the safety profile of AD (Figures S2B–S2E). Most notably, the addition of PEG extended the half-life of AD in blood (Figures 2C and S2F), significantly improving its bioavailability. However, while PEG promoted tumor tissue accumulation of AD, the highly accumulated AD did not effectively infect tumor cells (Figure S1I). This underscores the necessity of PEG shedding in our future investigations. In summary, PEGylation has made the i.v. injection of AD feasible, but it also poses the risk of diminished infection capability.
Figure 2.

Characterization and ROS-responsive performance of RadioOnco
(A–C) TEM images and particle size distribution of AD (A) and AD@PSSP (B); scale bar, 50 nm. Polydispersity index (PDI) values are shown for both formulations. (C) Ex vivo fluorescence intensity of blood samples collected at various time points following i.v. injection of different formulations (n = 3).
(D) Schematic illustration of ROS-responsive fluorescence probes based on AD@PSSP. Upper: AD was modified with PSSP-Cy3 and its black-hole quencher, NHS-BHQ2, to generate AD(BHQ2)@PSSP-Cy3. In this formulation, Cy3 fluorescence is quenched by BHQ2, and ROS-induced Se-Se bond cleavage restores Cy3 fluorescence. Bottom: AD tagged with NHS-Cy5.5 and PSSP-Cy3 (AD(Cy5.5)@PSSP-Cy3). ROS-mediated Se-Se bond disintegration leads to the separation of Cy3 and Cy5.5, facilitating fluorescence signal distinctness.
(E) Fluorescence emission spectra of AD(BHQ2)@PSSP-Cy3 at varying concentrations of DCF.
(F) Ex vivo fluorescence imaging of tumor tissues and major organs from TC-1 tumor-bearing mice 24 h post-i.v. administration of the indicated formulations.
(G) Immunofluorescence staining of tumor tissues 24 h after i.v. injection of the indicated formulations and radiation. Scale bar, 10 μm
(H) TEM images of AD@PSSP and ROS-treated AD@PSSP; scale bar, 50 nm
(I) Zeta potential of different formulations (n = 3).
(J) Transfection efficiency of different formulations for 14 h. GFP expression in TC-1 cells was determined by flow cytometry (n = 3).
(K) Immunofluorescence staining of TC-1 tumors 24 h post-injection of different formulations, followed by radiation. GFP expression in infected TC-1 cells. Scale bar, 1 cm.
Data are shown as mean ± SD and analyzed by Tukey’s post hoc test. N.S., not significant; ∗∗∗∗p < 0.0001.
ROS-responsive performance of AD@PSSP
Subsequently, we evaluated the capability of AD@PSSP to shed its PEG shell in response to ROS. Initially, we engineered two types of fluorescence probes by concurrently attaching the fluorescent molecule PSSP-Cy3 and the quencher black hole quencher2 (BHQ2) or fluorescent molecule Cy5.5 onto the surface of AD. In the presence of BHQ2 or Cy5.5 alongside Cy3 on an AD scaffold, it is observed that BHQ2 effectively quenches the fluorescence emitted by Cy3. Concurrently, the emission spectrum of Cy5.5 exhibits substantial overlap with that of Cy3. Under conditions of abundant ROS, the Se-Se bond within PSSP-Cy3 undergoes cleavage. This reaction mechanism facilitates the liberation of Cy3 molecules, thereby reinstating their fluorescent properties or enabling the distinct separation of fluorescence signals (Figure 2D). Compared to AD@PSSP-Cy3, AD(BHQ2)@PSSP-Cy3 exhibited a significant reduction in fluorescence intensity, indicating successful construction of the fluorescence probes (Figure 2E). To assess the responsive release of AD@PSSP in vivo, we established a model with pre-existing neutralizing antibodies against AD through multiple subcutaneous injections of AD, which was used for subsequent animal experiments (Figure S3A).
To ascertain the requisite dosage of RT for Se-Se disruption and to optimize the timing for RT and OVs therapy, an extensive experimental investigation was undertaken. Initially, it was established that the ROS levels within the tumor culminated at their zenith 12 h post-RT (Figure S3B),with the mean fluorescence intensity of 2',7'-dichlorofluorescin (DCF) values at 0, 1, and 2 Gy radiation yielding respective measurements of 81.8, 219.3, and 345.8 (Figure S3C). Furthermore, by setting a gradient of ROS concentration, we discovered that complete fluorescence recovery occurred when the mean fluorescence intensity of DCF reached 350, suggesting that the minimal radiation dose required for in vivo PEG shell shedding should be equivalent to that of 2 Gy (Figure 2B). Additionally, a dosage of 2 Gy represents the most commonly employed low-dose radiation in clinical RT settings.39,40 Additionally, after i.v. injection of AD@PSSP-Cy3 into mice, the accumulation of AD in the tumor reached its maximum at 12 h post-injection, aligning with the peak time of ROS levels at an RT dose of 2 Gy (Figures S3D and S3E). Thus, we elect to pursue concurrent RT and i.v. administration of AD@PSSP in the forthcoming animal trials, with a chosen dosage of RT set at 2 Gy.
We then observed fluorescence recovery in tumors of mice injected with AD(BHQ2)@PSSP-Cy3 (Figures 2F and S3F) and successful visualization of fluorescence separation in tumor of mice injected with AD(Cy5.5)@PSSP-Cy3 (Figure 2G). Furthermore, it was observed that, following RT, the injection of AD(BHQ2)@PSSP-Cy3 did not yield significant fluorescence restoration in major organs such as the liver, kidneys, spleen, heart, and lungs (Figures S3G–S3K). Lastly, through TEM imaging, we more visually discerned the transition of AD@PSSP from negative to positive staining due to the shedding of PEG (Figure 2H), potentially as a result of increased uranyl acetate adsorption by the surface PEI. Incubated in blood for 24 h, AD@PSSP likewise maintained its stability (Figures S3L and 3M). These findings demonstrate that Se-Se bonds in PSSP can be cleaved under ROS generated by 2Gy RT in tumors, while remaining intact in critical organs and blood.
Furthermore, we noted that, under the influence of ROS, the potential of AD@PSSP shifted from negative to positive, reaching an equipotential with AD-PEI (Figure 2I). We further assessed the ability of AD to infect tumor cells after shedding the PEG shell. To our delight, we found that the residual PEI could enhance the infection and killing efficacy of AD on TC-1 (Figures 2J, S3N, and S3O) and HCT-116 cells (Figure S3P), possibly due to the tumor cells adsorbing more AD through electrostatic interactions. AD-PEI and PEG-shedding AD@PSSP had no significant impact on AD replication in HCT-116 cells, indicating that surface modifications and release responses did not affect AD’s replication ability (Figure S3Q). By observing the expression of GFP in tumor tissues, we confirmed that AD@PSSP not only restored the ability to infect cells with OVs upon RT but also gained additional enhancement through PEI (Figure 2K). These results indicate that, after PEG is detached from AD@PSSP, AD’s infectivity is significantly restored, and PEI can further amplify AD’s infective capability.
AD@PSSP as a radiosensitizer and in situ vaccine
Then, we evaluated the synergistic mechanism of AD@PSSP and RT. Clonogenic assays revealed that AD-PEI demonstrated the most potent tumor cytotoxicity at an RT dose of 0 Gy (Figures 3A and S4A–S4C). Additionally, it was discerned that the augmentation of ROS levels post-RT notably enhanced the infective capability of AD-PEI toward tumor cells (Figure S4D). With the escalation of RT doses, AD-PEI effectively reduced the average lethal dose of RT to 1.58 Gy, thereby signifying AD-PEI’s promising capacity to counteract and potentially reverse the resistance to RT (Figure 3B). Proteomic analysis (IPROX:IPX0010992000) further assessed protein expression changes in HCT-116 cells under the influence of AD-PEI and RT. Relative to the PBS group, there was an upregulation of 195 proteins and downregulation of 76 proteins (Figures 3C and 3D), among which 20 proteins previously reported to enhance radiotherapeutic efficacy were identified (Figures 3C and S5A).41,42,43,44,45,46,47,48,49,50,51,52,53,54,55,56,57 Intriguingly, of these 20 proteins, the expression of 8 was upregulated and 1 downregulated, all known to inhibit DNA damage repair (Figures 3C and 3E). Within this ensemble of 9 proteins, the CHEK1 inhibitor has been employed in clinical trials to potentiate the responsiveness of malignant tumors to RT.58,59 To validate these findings, we performed RT on HCT-116 cells with CHEK1 inhibition and overexpression. The results suggest that CHEK1 degradation increases sensitivity to RT (Figures S5B–S5D). Additionally, numerous studies have confirmed that adenoviruses can degrade the CHEK1 protein.60,61,62 Moreover, CDK1, a key downstream partner of CHEK1, is the only protein among its cohort to exhibit a concentration significantly higher than the norm (Figure S5E). Downregulation of the CHEK1-CDK1 pathway accentuates DNA damage by forestalling the entry of compromised DNA into the cell cycle’s G2/M phase.63,64 Western blotting (WB) confirmed a significant downregulation of the CHEK1-CDK1 pathway in cells treated with AD-PEI (Figure 3F), validating AD-PEI’s promotion of RT efficacy via inhibition of DNA damage repair mechanisms. We performed proteomic analysis (IPROX:IPX0010992000) and WB validation on non-RT-treated HCT-116 and TC-1 cells. The results showed a downregulation of CHEK1 and CDK1 expression after AD-PEI infection, consistent with previous findings (Figures S5F–S5I). We investigated the role of PEI in this pathway and found that PEI alone had no effect. However, when combined with AD, PEI enhanced AD infection, as confirmed by qPCR analysis (Figure 3G).
Figure 3.

RadioOnco as a radiosensitizer and in situ vaccine
(A) Representative image of HCT-116 cell colonies after treatment with different agents and radiation doses.
(B) Survival fraction of HCT-116 cells treated with different agents and radiation doses. The mean lethal dose (D0) was calculated for each treatment group based on the multi-target single-hit model (n = 3).
(C–E) Proteomic analysis of HCT-116 cells treated with AD-PEI, followed by irradiation with three fractions of 6 Gy. (C) Flowchart outlining the process for screening differentially expressed proteins. (D) Differential protein expression in HCT-116 cells after treatment with AD-PEI, compared to PBS-treated controls (n = 3). (E)Relative abundance of DNA damage repair-related proteins in (D) (n = 3).
(F) WB analysis of the CHEK1-CDK1 pathway in HCT-116 cells following treatment with AD-PEI and radiation (irradiated with 3 fractions of 6 Gy). β-actin was used as a loading control.
(G) qPCR analysis of AD gene expression in HCT-116 cells from the AD and AD-PEI groups (n = 3).
(H) Quantification of TDPs capture by different treatment groups (n = 3).
(I) Antigen presentation by BMDCs following treatment with AD and AD-PEI, as quantified by flow cytometry (n = 3).
(J) Schematic illustration of the experimental schedule for evaluating lymphatic drainage and antigen presentation by AD@PSSP.
(K) Ex vivo fluorescence images of draining lymph nodes (n = 3).
(L) Quantification of fluorescence intensity in the draining lymph nodes shown in (K) (n = 3).
(M) Uptake of Cy5.5-labeled OVA by cells in lymph nodes, as determined by flow cytometry (n = 3).
(N) Proportion of antigen-presenting DCs in the draining lymph nodes, assessed by flow cytometry (n = 3).
(O) The schematic illustration of lymphatic drainage in AD following RT.
(P and Q) Ex vivo fluorescence images (P) and fluorescence intensity (Q) of draining lymph nodes after injection of free Cy5.5 or AD-Cy5.5 (n = 3).
(R) Flow cytometry analysis of Cy5.5+ cells in draining lymph nodes after injection of AD-Cy5.5 (n = 3).
(S) Proportions of specific cell types within the Cy5.5+ population in draining lymph nodes (n = 3).
(T) Immunofluorescence staining of draining lymph nodes at 24 h post-injection of AD-Cy5.5. B220 and CD3 antibodies were used to label B cell and T cell regions, respectively. Scale bar, 5 μm.
Data are shown as mean ± SD and analyzed by Tukey’s post hoc test. N.S., not significant; ∗∗p < 0.01; ∗∗∗∗p < 0.0001.
More intriguingly, we discovered that the PEI on the surface of AD not only bolsters its infection efficiency but also possesses the capacity to adsorb tumor-derived proteins (Figure 3H). In vitro experiments demonstrated that AD-PEI and ROS-treated AD@PSSP can be more effectively taken up and presented by bone marrow-derived dendritic cells (BMDCs) after co-incubation to the model antigen ovalbumin-Cy5.5 (OVA-Cy5.5) than other treatment groups (Figure 3I). In in vivo studies, OVA-Cy5.5 was injected into the peritumor, followed by RT and i.v. administration of AD@SSP (AD-PEG1Kda-Se-Se-PEG20Kda) or AD@PSSP (Figure 3J). The results indicated that, under the influence of RT, AD@PSSP could adsorb OVA-Cy5.5, leading to efficient lymph node drainage (Figures 3K and 3L), significantly enhancing the uptake of antigens by lymph node cells (Figure 3M), and antigen presentation (Figure 3N). Subsequently, we investigated how AD or AD-PEI is trafficked to the lymph nodes and which specific regions within the lymph nodes are targeted. Free Cy5.5 and AD-Cy5.5 were subcutaneously injected into TC-1 tumor-bearing C57BL/6 mice (Figure 3O). At 24 h post-RT on the tumor, a faint Cy5.5 fluorescent signal was detected exclusively in the lymph nodes isolated from the AD-Cy5.5 group (Figures 3P–3R). Further analysis revealed that migratory dendritic cells (mDCs) and macrophages played a primary role in trafficking AD to the lymph nodes (Figure 3S). Using fluorescent antibodies against B220 and CD3 to label the B cell and T cell zones within the lymph nodes, AD-Cy5.5 was found to predominantly accumulate in the T cell zone, facilitating the activation of antigen-specific T cells (Figure 3T). Overall, RT-induced exposure of PEI on AD’s surface enhances AD infectivity, suppresses DNA damage repair by downregulating the CHEK1-CDK1 pathway, and captures tumor-derived proteins (TDPs) released by RT, boosting the anti-tumor immune response.
Anti-tumor therapeutic efficacy and mechanism of AD@PSSP combined with RT
Given the strong in vitro therapeutic effect of AD@PSSP and RT, we evaluated its anti-tumor capabilities in a TC-1 mouse model with pre-existing immunity against AD, as shown in Figure 4A. In non-RT cohorts, better therapeutic outcomes were seen with AD@PP (AD-PEI-PEG) and AD@SSP, highlighting PEG’s role in evading neutralizing antibodies and prolonging circulation. The AD@PSSP group showed the best results, likely due to tumor-derived ROS promoting the release of AD@PSSP (Figure 2E). Within the RT-treated groups, mice that received AD@PSSP exhibited the most pronounced synergistic effect in conjunction with RT, without inducing any weight loss (Figures 4B, 4C, S6A, and S6B).
Figure 4.

Anti-tumor efficacy and mechanisms of AD@PSSP in combination with RT in murine models
(A) Schematic representation of the experimental design to evaluate the anti-tumor effects of AD@PSSP combined with RT in C57BL/6 mice with pre-existing immunity to AD.
(B and C) Tumor images (B) and tumor volume growth curves (C) on day 14 (n = 4–5).
(D) Quantification of viral gene copies in tumor tissues via qPCR (n = 4–5).
(E and F) Flow cytometric analysis of tumor-infiltrating T cells (E) and CTLs (F) at day 14 (n = 4–5).
(G and H) Frequencies of IFNγ+ CTLs (G) and IFNγ+ Ths (H) in splenocytes after stimulation with TDPs (n = 5).
(I and J) Transcriptomic and proteomic analysis of tumor tissues from G1 and G9 groups. (I) Heatmap of the top 10 most significantly altered genes, highlighting the differential expression of CHEK1 (n = 4). (J) Relative abundance of key proteins involved in DNA damage repair, including CHEK1 and CDK1 (n = 4).
(K) WB analysis showing downregulation of CHEK1 and CDK1 in tumor tissues of the RT+AD@PSSP group. β-actin was used as control.
(L) Schematic illustration of the experimental design for evaluating the anti-tumor efficacy of AD@PSSP combined with RT in immunodeficient BALB/c nude mice.
(M and N) Tumor growth curves (M) and weights (N) were recorded (n = 5).
(O) Immunofluorescence images of tumor tissues stained for CHEK1, CDK1, and GFP.
Data are shown as mean ± SD and analyzed by Tukey’s post hoc test. N.S., not significant; ∗p < 0.05; ∗∗p < 0.01; ∗∗∗p < 0.001; ∗∗∗∗p < 0.0001.
To delineate the anti-tumor mechanism further, tumor, spleen, and blood samples were analyzed post-treatment. The RT+AD@PSSP treatment group exhibited the highest accumulation of OVs within the tumor (Figure 4D), reinforcing the notion that PEG shedding under RT is a critical factor for OV accumulation at the tumor site following i.v. injection. Additionally, in the RT+AD@PSSP-treated mouse tumors, there was a notable increase in innate immune cell infiltration (Figures S7–S10), and a significant elevation in pro-inflammatory cytokine levels (Figure S1I), suggesting that AD@PSSP in combination with RT can shift the tumor immune microenvironment from “cold” to “hot.” T cell infiltration (Figures 4E and S12A) and cytotoxic T lymphocytes (CTLs, CD3+CD8+ cells) (Figures 4F and S12B) were most abundant in the RT+AD@PSSP group. To assess antigen-specific T lymphocyte populations, splenocytes were isolated and stimulated with TDPs or AD. A higher frequency of TDP-specific T lymphocytes, targeting tumor-associated antigens, was detected in the RT+AD@PSSP-treated group (Figures 4G, 4H, and S13). Concurrently, the bare AD-treated groups generated more potent AD-specific T cell responses and significantly greater anti-AD titers than groups treated with AD coated with PEG (Figure S14). Interferon (IFN)γ levels in the serum and tumor lysate supernatant were significantly elevated in the RT+AD@PSSP group as compared to other groups (Figure S15), indicating that AD@PSSP facilitated the delivery of more antigens generated by RT, thus promoting antigen-specific immune-mediated killing. To further investigate the underlying mechanisms, we performed RNA sequencing (RNA-seq) and proteomics analysis on tumor tissues from both the saline group and the AD@PSSP combined with RT group. RNA-seq (NCBI: PRJNA1215939) analysis revealed several key differentially expressed genes, such as H19 and stpbn2 (Figure 4I). Notably, CHEK1, a key differentially expressed gene in our cellular validation, was among them. Proteomic analysis (IPROX:IPX0010992000) of DNA damage repair-related genes showed significant changes in proteins like CHEK1 and CDK1 (Figure 4J). Lastly, WB analysis indicated that, compared to the saline group, proteins related to the CHEK1-CDK1 pathway were significantly downregulated in the AD@PSSP combined with RT group (Figure 4K), suggesting that the CHEK1-CDK1 pathway plays a crucial role in the anti-tumor mechanism. Throughout the treatment, mice exhibited normal blood biochemistry profiles and no pathological damage was detected in major organs (Figures S16 and S17). In summary, AD@PSSP combined with RT has elicited a synergistic anti-tumor effect and has stimulated a tumor-specific immune response.
Further, we validated the synergistic therapeutic mechanism of AD@PSSP and RT in an immunodeficient mouse model. The experimental design and formulations are outlined in Figure 4L. The RT+AD@PSSP group exhibited a more pronounced inhibitory effect on tumor growth compared to other groups (Figures 4M and 4N). Consistent with in vitro results, immunofluorescence analysis of tumor tissue from the RT+AD@PSSP group showed a significant reduction in CHEK1 and CDK1 protein levels and an expanded range of virus infection as evidenced by increased GFP expression (Figure 4O). The combination of AD@PSSP and RT demonstrates a significant synergistic anti-tumor effect, enhancing immune response and tumor infiltration, with modulation of the CHEK1-CDK1 pathway playing a crucial role in its therapeutic efficacy.
Synergistic effects of AD@PSSP and RT in overcoming RT resistance and enhancing tumor regression
To mimic individuals with RT tolerance, we developed an in vitro RT-resistant model by systematically exposing TC-1 cells to RT.65 Colony formation assay results confirm the successful establishment of this model (Figures 5A and 5B). Subsequent in vivo trials have revealed significant erosion in the sole efficacy of RT; a persistence of this trend was noted despite a 1.5-fold increase in dosage, which failed to yield any notable therapeutic benefits. Conversely, the amalgamation of AD@PSSP with a steady dosage of RT culminated in a distinctly potentiated curative effect (Figures 5C–5E). Furthermore, the quintessential adverse consequences associated with RT, primarily leukopenia and radiation-induced enteritis, were subjects of our scrutiny.66 Our assessments substantiate that AD@PSSP does not exacerbate the decline of total blood cell counts nor incites the onset of radiation-induced enteritis (Figures 5F–5I).
Figure 5.

Anti-tumor efficacy of AD@PSSP combined with RT in RT-resistant and PDX models
(A–E) Evaluation of AD@PSSP combined with RT in RT-resistant TC-1 tumor-bearing mice. (A) Representative colony formation images of TC-1 and RT-resistant TC-1 cells exposed to escalating doses of irradiation (0, 3, 6 Gy) (n = 3). (B) Survival fractions of TC-1 and RT-resistant TC-1 cells at different radiation doses (n = 3). (C) Tumor growth curves in RT-resistant TC-1 tumor-bearing mice (n = 5). (D) Representative tumor images on day 14 post-treatment (scale bar, 1 cm) (n = 5). (E) Tumor weights measured on day 14 (n = 5).
(F–H) Hematological analysis of white blood cell (WBC) counts (F), red blood cell (RBC) counts (G), and platelet (PLT) counts (H) on day 14, demonstrating no significant exacerbation of RT-induced myelosuppression by AD@PSSP (n = 5).
(I) H&E staining of colorectal tissue sections, showing no evidence of radiation-induced enteritis across treatment groups (scale bar, 20 μm).
(J–M) Assessment of AD@PSSP combined with RT in a PDX model of hepatocellular carcinoma. (J) Schematic representation of the experimental design to evaluate the anti-tumor effects of AD@PSSP combined with RT in PDX model. Tumor growth curves (K), representative tumor images (L), and tumor weights (M) in the PDX model, illustrating the superior therapeutic efficacy of the AD@PSSP+RT combination over other treatments (n = 5).
Data are presented as mean ± SD. Statistical significance was determined using Tukey’s post hoc test. N.S., not significant; ∗p < 0.05; ∗∗p < 0.01; ∗∗∗p < 0.001; ∗∗∗∗p < 0.0001.
To further assess the clinical relevance of combining AD@PSSP with RT, we utilized a patient-derived xenograft (PDX) model. In a moderately RT-sensitive human hepatocellular carcinoma PDX model, we observed that neither RT nor AD@PSSP administered alone resulted in significant anti-tumor effects (Figures 5J–5M). In stark contrast, the combination of AD@PSSP with RT yielded the most pronounced therapeutic response, highlighting the substantial potential of this combinatory approach for clinical translation.
We explored the potential synergistic effects of combining PD-1 inhibitors with RT and AD@PSSP to evaluate their combined therapeutic efficacy, mimicking clinical combination therapies for advanced malignancies (Figure S18A). The results indicated that the incorporation of PD-1 inhibitors did not substantially enhance the anti-tumor effects when added to the original treatment regimen (Figures S18B–S18D). Subsequent flow cytometric analysis of both tumor and splenic cells revealed a downregulation of PD-1 expression on CTLs within the TME (Figure S18E) and spleen (Figure S18F). However, despite this modulation, the functional activity of CTLs was not significantly augmented (Figures S18G–S18I). This may be due to the rapid anti-tumor response from the combination therapy, which occurred before optimal PD-1 inhibition, limiting its ability to further enhance immune function.
Furthermore, we compared the anti-tumor efficacy of intratumoral and i.v. AD@PSSP administration. As expected, intratumoral injection showed superior results (Figures S18B–S18D). Intratumoral injection, compared to i.v. injection, has limitations such as patient non-compliance and invasiveness. However, it offers notable advantages, including activation of systemic immune responses (e.g., CTLs and natural killer [NK] cells), improved efficacy against metastatic lesions, and enhanced safety by reducing viral circulation and associated toxicities. The choice of treatment should be tailored to the specific clinical context.
The data demonstrate that AD@PSSP combined with RT shows synergistic anti-tumor effects across various preclinical models. This combination enhances tumor regression, boosts immune cell infiltration, and increases pro-inflammatory cytokine levels, shifting the TME to a “hot” state. It also downregulates key DNA repair proteins like CHEK1 and CDK1, improving therapeutic efficacy. Importantly, AD@PSSP does not worsen common RT-induced side effects, such as leukopenia or radiation-induced enteritis. In RT-resistant models, it further enhances the therapeutic response, offering a promising strategy for clinical cancer therapy.
Abscopal effect elicited by AD@PSSP combined with RT
OVs and RT are frequently utilized in patients whose metastatic conditions preclude surgical intervention. Hence, the abscopal effect elicited by such treatments is of paramount importance.67 We evaluated the therapeutic efficacy of AD@PSSP in combination with RT in a metastatic tumor model. The experimental design and formulations are detailed in Figure 6A. The RT+AD@PSSP group exhibited the most robust anti-tumor effect on both the primary and metastatic tumors (Figures 6B, 6C, S19A, and S19B). The immune response within the primary tumors was consistent with results obtained in Figure 4, displaying heightened T cell reactivity following RT+AD@PSSP treatment. In the distant metastatic tumors, the infiltration of dendritic cells (DCs) (Figure S19C), macrophages (Figure S19D), NK cells (Figure S19E), and neutrophils (Figure S19F) increased significantly following RT+AD@PSSP treatment, indicating that the RT+AD@PSSP treatment regimen could effectively mobilize the innate immune response within metastatic tumors, converting immunologically “cold” tumors to “hot.” Furthermore, the infiltration of T cells (Figure 6D) and CTLs (Figure 6E) in distant metastatic tumors from mice treated with RT+AD@PSSP was notably higher than that in other groups. Following this, splenocytes were isolated and stimulated with TDPs. In line with previous animal study findings, splenocytes from mice treated with RT+AD@PSSP secreted more IFNγ, indicating a heightened level of antigen-specific immune response following RT+AD@PSSP treatment (Figures 6F and 6G). Finally, we did not detect any viral genes in the metastases in all group. There were no significant changes in serum levels of alanine aminotransferase (ALT), aspartate aminotransferase (AST), alkaline phosphatase (ALP), blood urea nitrogen (BUN), creatinine (CREA), creatine kinase (CK), and lactate dehydrogenase (LDH) across all groups (Figure S20).
Figure 6.

Systemic abscopal effects and immune activation elicited by AD@PSSP in combination with RT
(A) Schematic representation of the experimental design to evaluate the abscopal effect and immunological mechanisms of AD@PSSP combined with RT.
(B) Representative images of primary and distant tumors from treated mice (n = 4–5) on day 14 (scale bar, 1 cm).
(C) Growth kinetics of primary and distant tumors across treatment groups (n = 4–5).
(D and E) Flow cytometry quantification of T cells (D) and CTLs (E) in distant tumors at the study endpoint (n = 4–5).
(F and G) Analysis of antigen-specific immune responses: IFNγ+ CTLs (F) and IFNγ+ Ths (G) in splenocytes re-stimulated with TDPs (n = 5).
(H) Schematic overview of the experimental setup to assess the therapeutic efficacy of H101@PSSP combined with RT in a B16-CAR mouse model.
(I) DLS analysis of H101 and H101@PSSP size distributions (n = 3).
(J and K) Growth curves of primary (J) and distant (K) tumors across treatment groups in the B16-CAR model (n = 5).
(L) Immunohistochemistry of hexon protein in primary tumors, demonstrating OV accumulation.
(M–P) Quantification of immune cell infiltration in tumors via flow cytometry: DCs (M), macrophages (N), T cells (O), and CTLs (P).
(Q) Flow cytometry analysis of IFNγ+ CTLs in splenocytes re-stimulated with TDPs, highlighting antigen-specific immune responses (n = 5).
Data are presented as mean ± SD and analyzed using Tukey’s post hoc test. Statistical significance is denoted as follows: N.S., not significant; ∗p < 0.05; ∗∗p < 0.01; ∗∗∗p < 0.001; ∗∗∗∗p < 0.0001.
QA To assess the broad-spectrum therapeutic potential of our proposed strategy, we engineered the clinically approved H101 adenovirus by incorporating PSSP modifications. Anti-tumor efficacy was subsequently evaluated using the B16-CAR mouse model, with experimental design and formulations detailed in Figure 6H. The observed increase in particle size provided confirmation of the successful synthesis of the H101@PSSP formulation (Figure 6I). In comparison to the H101+RT treatment group, the H101@PSSP+RT group demonstrated significantly enhanced anti-tumor efficacy, particularly in the context of metastatic tumors, highlighting a marked and sustained abscopal effect (Figures 6J and 6K). Importantly, no significant weight loss was observed in the treated mice, suggesting minimal systemic toxicity (Figure S21A). Immunohistochemistry (IHC) analysis of hexon protein expression revealed a pronounced accumulation of OVs within the tumors of the RT+H101@PSSP-treated cohort (Figure 6L). Consistent with prior animal studies, tumors from the RT+H101@PSSP-treated mice exhibited marked infiltration of innate immune cells (Figures 6M–6O and S21B), T cells (Figure S21C), and CTLs (Figure 6P). To further assess the antigen-specific immune response, splenocytes were isolated and stimulated with TDPs. The RT+H101@PSSP-treated group displayed a notably higher frequency of TDP-specific T lymphocytes targeting tumor-associated antigens, indicating robust immune activation (Figure 6Q). Throughout the treatment regimen, no significant alterations in blood biochemical parameters were observed, and histopathological examination revealed no detectable damage to major organs, further confirming the safety profile of the H101@PSSP treatment (Figures S22 and S23).
The RT regimen employed in our study consisted of a high number of fractions with relatively low doses per fraction. Additionally, we investigated alternative RT protocols that utilized fewer fractions with higher doses per fraction. Our findings, however, indicated that these alternative RT schedules did not significantly influence the abscopal effect. This suggests that the total delivered dose, rather than the dose per fraction, may play a more pivotal role in mediating this phenomenon (Figures S24A–S24F).
We investigated whether irradiating non-cancerous tissues could lead to AD@PSSP accumulation and differential abscopal effects between tumor and non-tumor sites. After i.v. AD@PSSP administration, we irradiated the thigh and tumor tissues separately and compared viral gene expression. The results showed significantly higher viral gene expression in the tumor tissue than in the thigh tissue (Figures S24G and S24H), supporting our hypothesis that normal tissues exhibit a greater capacity for clearing OVs than tumor tissues. Furthermore, the abscopal effect induced by RT was much more pronounced in the tumor tissue than in the irradiated thigh tissue (Figure S24I).
These findings suggest that, at the site of the tumor, the release of AD-PEI may play a more crucial role than AD alone in the synergistic anti-metastatic effect of RT. Collectively, the data indicate that the potent anti-tumor immunity generated by the RT+AD@PSSP combination treatment in primary tumors can disseminate systemically, with high-level innate and antigen-specific immune responses within distant metastatic tumors leading to effective tumor control.
AD@PSSP enhances postoperative RT efficacy by inducing durable anti-tumor immune memory and mediating CD8+ T Cell- and NK cell-dependent responses
Postoperative tumor recurrence remains a significant challenge in the clinical management of cancer. Consequently, additional RT is often necessary after surgery to eliminate any residual and potentially malignant cells, thereby reducing the risk of local recurrence or distant metastasis. We further assessed the potential of AD@PSSP as an adjuvant treatment during the postoperative RT phase. The capacity of AD@PSSP to induce lasting immune memory following postoperative RT was critical and evaluated as per Figure 7A. We resected 90% of the TC-1-Luc tumor 20 days post-inoculation and initiated various treatments three days subsequent to the surgery (Figure 7B). By day 60, 80% of mice treated with RT+AD@PSSP survived, whereas only 30% survival was observed in mice receiving postoperative RT alone (Figures 7B and 7C). Additionally, 50% of mice in the RT+AD@PSSP group exhibited no tumor burden (Figure 7D), while all mice in the postoperative RT group had tumor growth. We next challenged the 5 tumor-free mice in the RT+AD@PSSP group with a secondary tumor inoculation on day 60. Age-matched mice were inoculated with TC-1 cells as a control group. In comparison to the rapid tumor growth observed in the control group, RT+AD@PSSP-treated mice displayed a significant reduction in tumor growth (Figures 7E–7G). Subsequently, we assessed immune memory cells in splenocytes and blood via flow cytometry at day 80. The proportion of effector memory T cells (Tem) in both splenocytes and blood was significantly elevated in the RT+AD@PSSP-treated group compared to the control group (Figures 7H, 7I, and S25). Moreover, splenocytes from RT+AD@PSSP-treated mice demonstrated the strongest tumor-killing ability (Figure 7J). Additional IFNγ+ CTLs (Figure 7K) and Ths (Figure 7L) responsive to TC-1 cell-derived antigens were more prevalent in the RT+AD@PSSP-treated group than in the control group. To validate that RT-induced endogenous antigen-driven immune responses can establish long-term immune memory, we harvested spleens on days 0, 20, and 40; isolated CD3+ T cells; and performed single-cell RNA-seq analysis (NCBI: PRJNA1215939). The results demonstrated a progressive upregulation of T cell markers associated with immune functionality and memory formation over time. These findings provide robust evidence supporting our conclusion, offering a detailed temporal characterization of the immune response dynamics (Figure 7M).
Figure 7.

Long-term immune memory and critical immune mechanisms elicited by AD@PSSP combined with RT
(A) Schematic illustration of the experimental procedure evaluating long-term immune memory induced by AD@PSSP combined with RT after surgery.
(B) Bioluminescence imaging of primary tumors following surgery and treatment (n = 10).
(C) Survival curves for mice under different treatment regimens (n = 10).
(D) Analysis of primary tumors on days 60 (n = 10). CR, complete regression; PR, partial regression.
(E) Representative images of distant tumors on day 80 (n = 5) (scale bar, 1 cm).
(F and G) Growth curves (F) and tumor weight (G) of distant tumors were recorded (n = 5).
(H and I) Proportions of effector memory T cells (Tem, CD3+CD8+CD44+CD62L) in blood (H) and splenocytes (I) on day 80, as determined by flow cytometry (n = 5).
(J) Tumor-specific killing ability of splenocytes re-stimulated with TC-1 cells derived proteins on day 80, measured by CCK-8 assay (n = 5).
(K and L) Flow cytometry analysis of IFNγ+ CTLs (K) and IFNγ+ Th cells (L) in splenocytes re-stimulated with TDPs (n = 5).
(M) Heatmap of relative gene expression levels associated with T cell immune functionality and memory formation from single-cell RNA sequencing of CD3+T cells isolated from spleens on days 0, 20, and 40.
(N) Experimental design for immune cell depletion models using monoclonal antibodies targeting CD4+ T cells, CD8+ T cells, or NK cells.
(O–R) Primary tumor images (O), primary tumor growth curves (P), distant tumor images (Q), and distant tumor growth curves (R) in immune cell-depleted models treated with AD@PSSP and RT (n = 5).
Log rank (Mantel-Cox) test was used for survival curve analysis. All other data are shown as mean ± SD and analyzed by Tukey’s post hoc test. N.S., not significant; ∗∗∗∗p < 0.0001.
To elucidate the critical roles of CD4+ T cells, CD8+ T cells, and NK cells in mediating the AD@PSSP combined with RT-induced anti-tumor immune response, we developed CD4+ T cell-, CD8+ T cell-, and NK cell-depleted mouse models. The experimental design and formulations are detailed in Figure 7N. In these immune cell-depleted models, the proportions of CD4+ T cells, CD8+ T cells, and NK cells were markedly reduced, confirming the successful depletion of these immune cell subsets (Figures S26A–S26C). The therapeutic efficacy of AD@PSSP in combination with RT was significantly compromised in the CD8+ T cell- and NK cell-depleted models, with a pronounced reduction in the anti-tumor response, especially against metastatic tumors (Figures 7O–7R). In contrast, the depletion of CD4+ T cells resulted in a more modest attenuation of anti-tumor activity (Figures 7O–7R). These findings indicate that the anti-tumor immune response induced by AD@PSSP combined with RT is predominantly mediated by CD8+ T cells and NK cells.
In sum, in a clinically relevant postoperative RT tumor model, AD@PSSP under RT could further suppress tumor growth, achieving complete remission in 50% of the mice and eliciting durable anti-tumor immune memory within the host. These findings suggest that AD@PSSP holds promise as an adjuvant therapeutic strategy for postoperative RT with potential clinical application.
Discussion
RadioOnco (AD@PSSP) combines OVs with PEGylation to enhance RT efficacy, leveraging PEG’s ability to prolong circulatory persistence. However, PEG’s inertness hinders tumor cell infection.68,69 To address this, we introduced an ROS-responsive Se-Se bond between PEG and OVs, allowing the PEG cloak to be removed at the RT-treated tumor site, effectively releasing AD-PEI for targeted therapy. Conjugating PEI to AD enhances its infectivity and DNA-damaging effect in synergy with RT. Proteomic analysis revealed that AD-PEI amplifies DNA damage by modulating pathways involving CHEK1 and CDK1. RT-induced DNA damage activates the DNA damage response (DDR), leading to G2/M arrest and DNA repair.70,71 CHEK1-induced phosphorylation of CDC25B and CDC25C prevents CDK1/cyclin B complex activation.72,73 Although CHEK1 inhibitors are under clinical evaluation, their toxicity to healthy tissues limits clinical approval.74 RadioOnco, however, demonstrates strong CHEK1 degradation, offering potential for improved cancer therapy efficacy and the clinical use of CHEK1 inhibitors.
In this study, we employed AD-PEI to capture auto-antigens produced by irradiated tumors, enhancing the immune response alongside RT. Unlike standard immunotherapeutic approaches that rely on synthetic antigens, the use of endogenous antigens, which are less heterogeneous, may prove more effective for cancer vaccines. Identifying tumor antigens is challenging, and acquiring exogenous antigens for rare cancers is often impractical.75,76 Our findings demonstrate that RT, in combination with an immune response induced by endogenous antigens, can foster long-lasting immune memory, potentially preventing tumor recurrence post-surgery. We tested the combined therapy of RadioOnco and RT across various animal models, including those simulating RT resistance, metastatic tumors, and immune memory. The results showed that this approach not only elicited strong immune-mediated cytotoxicity but also counteracted RT resistance to some extent. This strategy could reduce the required RT dosage, enhancing safety. Although treatment tolerance may develop at advanced stages, we aim to design a treatment regimen that incorporates different OVs to address this challenge effectively.
In summary, we have developed an intravenously injectable RadioOnco with PEG encapsulation, enhancing blood circulation and safety. Its ROS-responsive design targets tumors, while PEI-mediated electrostatic adsorption improves viral infection and enables in situ tumor vaccination. RadioOnco effectively suppresses DNA damage repair from RT, inducing a potent anti-tumor immune response that inhibits metastasis and recurrence. Consequently, RadioOnco is well positioned to drive groundbreaking advancements in clinical trials involving OVs combined with RT, paving the way for clinical applications.
Limitations of the study
This study has some limitations, including the use of a subcutaneous tumor model, which may not fully represent tumors with unclear boundaries like those in lung or cervical cancer. While AD-PEI could potentially affect surrounding normal tissues, OVs generally show selective tumor targeting and are cleared by antiviral immune responses in normal tissues. Additionally, the treatment’s efficacy and safety have not yet been validated in humans. Future research will focus on using viruses from different species, engineering the virus based on proteomics, and advancing the therapeutic strategy into clinical trials.
Resource availability
Lead contact
Further information and requests for resources should be directed to and will be fulfilled by the lead contact, Funan Liu (fnliu@cmu.edu.cn).
Materials availability
AD11-5ETe1-GFP and PEI1.8kDa-Se-Se-PEG5kDa,10kDa, 20kDa, 30kDa in this study will be available upon request.
Data and code availability
-
•
Data: The RNA-seq data and proteomics data reported in this paper have been deposited in the National Center for Biotechnology Information (NCBI) and the integrated proteome resources (IPROX) databases, under BioProject accession numbers PRJNA1215939 and IPX0010992000, respectively. All other relevant detailed data could be available upon reasonable request from the lead contact.
-
•
Code: No custom computer codes are reported in this paper. The code for data analysis is available upon request.
-
•
Any additional information required to reanalyze the data reported in this work paper is available from the lead contact upon request.
Acknowledgments
This work was supported by grants from National Natural Science Foundation of China (32222045, X.Z.; 32471450, K.C.; 82402462, K.C.; 82073368, F.L.), Beijing Nova Program (20230484398, X.Z.), National Key R&D Program of China (2021YFA0909900, X.Z.; 2022YFC2403401, F.L.), Liaoning Revitalization Talents Program (XLYC2007071, F.L.), Joint Program of Science and Technology Program of Liaoning Province (2023JH2/101700094, F.L.), and Beijing Natural Science Foundation (Z200020, X.Z.; 7244523, K.C.).
Author contributions
The First Affiliated Hospital of China Medical University identifies clinical challenges in OV therapy combined with RT, while the National Center for Nanoscience and Technology proposes the treatment strategy, designs and synthesizes nanoparticles, and evaluates immunotherapeutic efficacy. C.X., L.C., and G.L. contributed equally to this work. Conceptualization, C.X.; data curation, C.X.; formal analysis, C.X.; funding acquisition, X.Z. and F.L.; investigation, K.C., G.N., and F.L.; methodology, X.Z., K.C., G.N., and F.L.; project administration, C.X., L.C., G.L., J.X., W.L., X.G., and P.X.; resources, C.X.; software, C.X.; supervision, K.C., G.N., and F.L.; validation, K.C., G.N., and F.L.; visualization, K.C., G.N., and F.L.; writing – original draft, C.X.; writing – review and editing, K.C., G.N., and F.L.
Declaration of interests
The authors declare no competing interests.
STAR★Methods
Key resources table
| REAGENT or RESOURCE | SOURCE | IDENTIFIER |
|---|---|---|
| Antibodies | ||
| FITC-anti-mouse CD11c | Biolegend (USA) | RRID: AB_313775 |
| PE-anti-mouse CD80 | Biolegend (USA) | RRID: AB_313128 |
| PE/Cy7-anti-mouse CD86 | Biolegend (USA) | RRID: AB_439783 |
| PE/Cy7-anti-mouse MHCI-OVA | Biolegend (USA) | RRID: AB_2750196 |
| PE-anti-mouse F4/80 | Biolegend (USA) | RRID: AB_10803547 |
| FITC-anti-mouse CD3Ɛ | Biolegend (USA) | RRID: AB_312671 |
| PE/Cy7-anti-mouse CD8α | Biolegend (USA) | RRID: AB_312761 |
| PE/Cy7-anti-mouse IFNγ | Biolegend (USA) | RRID: AB_2295770 |
| APC-anti-mouse CD8α | Biolegend (USA) | RRID: AB_312750 |
| FITC-anti-mouse CD49b | Biolegend (USA) | RRID: AB_313027 |
| PE/Cy7-anti-mouse CD45 | Biolegend (USA) | RRID: AB_2563535 |
| APC-anti-mouse CD11c | Biolegend (USA) | RRID: AB_313779 |
| PE/Cy7-anti-mouse F4/80 | Biolegend (USA) | RRID: AB_893478 |
| PE-anti-mouse CD11b | Biolegend (USA) | RRID: AB_312790 |
| FITC-anti-mouse Ly6G | Biolegend (USA) | RRID: AB_1236494 |
| APC-anti-mouse CD3Ɛ | Biolegend (USA) | RRID: AB_2750432 |
| PE-anti-mouse CD3Ɛ | Biolegend (USA) | RRID: AB_312672 |
| FITC-anti-mouse CD8α | Biolegend (USA) | RRID: AB_312744 |
| FITC anti-mouse CD4 | Biolegend (USA) | RRID: AB_313688 |
| PE/Cy7-anti-mouseCD62L | Biolegend (USA) | RRID: AB_313103 |
| PE-anti-mouse CD44 | Biolegend (USA) | RRID: AB_312959 |
| PE-anti-mouse CD103 | Biolegend (USA) | RRID: AB_535948 |
| APC/Cy7-anti-human/mouse Granzyme B Recombinant | Biolegend (USA) | RRID: AB_2936711 |
| PE-anti-mouse CD279 (PD-1) | Biolegend (USA) | RRID: AB_1877232 |
| PE-anti-mouse CD4 | Invitrogen (USA) | RRID: AB_465512 |
| CHEK1 Polyclonal antibody | Proteintech Group, Inc (China) | RRID: AB_2880283 |
| CDK1 Polyclonal antibody | Proteintech Group, Inc (China) | RRID: AB_2074898 |
| ChromoTek GFP-Booster Alexa Fluor® 647 | Proteintech Group, Inc (China) | RRID: AB_2827575 |
| Recombinant Anti-beta Actin antibody | Wuhan Servicebio Technology Co., Ltd (China) | RRID: AB_2904016 |
| HRP conjugated Goat Anti-Rabbit IgG | Wuhan Servicebio Technology Co., Ltd (China) | RRID: AB_2811189 |
| Anti-Mouse CD8a (Ly 2.2) | Purified in vivo GOLD™ Functional Grade | RRID: AB_2737483 |
| Anti-Mouse NK1.1 Antibody | Purified in vivo GOLD™ Functional Grade | RRID: AB_2737553 |
| Anti-Mouse CD4(Clone GK1.5) | Purified in vivo GOLD™ Functional Grade | RRID: AB_2737452 |
| Virus strains | ||
| AD11-5ETe1-GFP | Beijing Bio-Targeting Therapeutics Technology Co., Ltd (China) | N/A |
| H101 | Sunway biotech co. ltd | N/A |
| Chemicals, peptides, and recombinant proteins | ||
| Propidium Iodide Solution | Biolegend (USA) | 421301 |
| IL-6 | ELK Biotechnology CO.,LTD (China) | ELK1157 |
| IFNγ | ELK Biotechnology CO.,LTD (China) | ELK1132 |
| Reactive oxygen species (ROS) detection kit | Nanjing Jiancheng Haihao Biotechnology Co., Ltd (China) | E004-1-1 |
| D-Luciferin potassium salt | Shanghai Macklin Biochemical Technology Co., Ltd (China) | D812647 |
| PEI1.8kDa-Se-Se-PEG5kDa,10kDa,20kDa,30kDa | Xi’an ruixi Biological Technology Co., Ltd (China) | N/A |
| PEI1.8kDa-Se-Se-PEG5kDa,10kDa,20kDa-Cy5.5 | Xi’an ruixi Biological Technology Co., Ltd (China) | N/A |
| PEI1.8kDa-Se-Se-PEG20kDa-Cy3 | Xi’an ruixi Biological Technology Co., Ltd (China) | N/A |
| NHS-BHQ2 | Xi’an ruixi Biological Technology Co., Ltd (China) | N/A |
| NHS-PEG1kDa | Xi’an ruixi Biological Technology Co., Ltd (China) | N/A |
| NHS-PEG1kDa-Se-Se-PEG20kDa | Xi’an ruixi Biological Technology Co., Ltd (China) | N/A |
| PEI1.8kDa | Macklin (China) | E808879 |
| Iodine | Macklin (China) | I812016 |
| Barium chloride | Macklin (China) | B861682 |
| Murine GM-CSF | Sino Biological Inc (China) | 51048-M01H |
| Murine IL-4 | Sino Biological Inc (China) | 51084-MNAE |
| Potassium iodide | Aladdin (China) | P116284 |
| Cy5.5-NHS ester | Aladdin (China) | 1469277-96-0 |
| OVA257-264(SIINFEKL) | Top Peptide (China) | N/A |
| B7-H1 | Biorebo | JN1525-LSP |
| LY2606368 (CHEK1 inhibitors) | Selleck | 1234015-52-1 |
| Overexpression CHEK1 plasmid (human) | Hanbio | pHBLP003747 |
| Adenovirus hexon protein Rabbit pAb | Bioss | bs-12354R |
| Opti-MEM | Gibco | 51985034 |
| Key Resource Table | ||
| Proteomics data of HCT-116 cells (post-RT) treated with PBS and AD-PEI. | This paper | [IPROX]: [IPX0010992000] |
| Proteomics data of HCT-116 cells treated with PBS and AD-PEI. | This paper | [IPROX]: [IPX0010992000] |
| Proteomics data of TC-1 cells treated with PBS and AD-PEI. | This paper | [IPROX]: [IPX0010992000] |
| Proteomics data of TC-1 tumor tissues treated with saline and RT+AD@PSSP. | This paper | [IPROX]: [IPX0010992000] |
| RNA sequencing data of TC-1 tumor tissues treated with saline and RT+AD@PSSP. | This paper | [NCBI]: [PRJNA1215939] |
| RNA sequencing data of spleen T cells on day 20 and day 40 post-treatment with RT+AD@PSSP. | This paper | [NCBI]: [PRJNA1215939] |
| Experimental models: Cell lines | ||
| TC-1-CD46 | Beijing Bio-Targeting Therapeutics Technology Co., Ltd (China) | N/A |
| JH-293 | Beijing Bio-Targeting Therapeutics Technology Co., Ltd (China) | N/A |
| B16-CAR | Beijing Bio-Targeting Therapeutics Technology Co., Ltd (China) | N/A |
| Huvec | ATCC | N/A |
| HCT-116 | ATCC | N/A |
| Experimental models: Organisms/strains | ||
| Female C57BL/6 mice | Vital River Laboratory Animal Technology Co. Ltd (China) | N/A |
| BALB/c nude mice | Vital River Laboratory Animal Technology Co. Ltd (China) | N/A |
| Software and algorithms | ||
| SPSS | IBM (USA) | Version 22.0 |
| GraphPad Prism | GraphPad (USA) | Version 7 |
| NovoExpress Software | ACEA Biosciences (USA) | Version 1.1.0 |
| ImageJ Lab | Bio-Rad (USA) | Version 6.1 |
| NIS-Elements Viewer | Nikon (Japan) | Version 4.2.0 |
| Other | ||
| X-ray Biological Irradiator | Rod Source technologies Asia Limited (USA) | RS2000 |
Experimental model and study participant details
Cell lines
The Beijing Bio-Targeting Therapeutics Technology Co., Ltd generously provided the genetically modified TC-1 cell line, which bears the human CD46 receptor, B16 cell line, which bears the human CAR receptor and alongside JH-293 cells. AD11 and H101, exhibits potent infective capabilities toward human tumor cell lines that express the CD46 receptor and CAR receptor. However, murine cell lines scarcely display this receptor. Consequently, for immunological experiments, we have selected the TC-1-CD46 cell line and B16-CAR cell line. Huvec cells and the HCT-116 cell line were sourced from the American Type Culture Collection (ATCC) in Manassas, USA. These cell lines—TC-1, JH-293, Huvec, and HCT-116—were carefully propagated in Dulbecco’s Modified Eagle’s Medium (DMEM), supplemented with 10% fetal bovine serum and fortified with 100 U/mL of sodium penicillin G and 100 μg/mL of streptomycin. To assure their unimpeachable condition, they were subjected to stringent mycoplasma examinations and certified mycoplasma-free. For their cultivation, the cells were nurtured at 37°C in a humidified atmosphere containing 5% CO2 to provide the most favorable growth environment. The critical components for their growth, specifically the cell culture medium and fetal bovine serum, were acquired from Biological Industries in Israel.
Viruses
AD11 adeptly infects DC, which is advantageous for tumor immunotherapy.77 Consequently, in this experiment, the AD11-5ETe1-GFP, procured from Beijing Bio-Targeting Therapeutics Technology Co., Ltd, was utilized. The production of the AD11-5ETe1-GFP is detailed as follows: The AD vector AD11-5EP was constructed by homologous recombination, replacing a 365bp segment upstream of the AD5 E1A coding sequence—including the enhancer and promoter of AD5 E1A—with a corresponding region in AD11, thus forming the AD11-5EP vector. The recombinant human adenovirus vector AD11-5ETe1-GFP was engineered by simultaneously recombining the constructed shuttle vectors pSSENTel and pSSGFP with the AD11-5EP genome. In comparison to AD5, AD11 exhibits lesser replication and cytolytic potential, which is influenced not by its infectivity but by the activity of its early gene enhancers and promoters. Therefore, compared to AD11, AD11-5ETe1-GFP possesses enhanced anti-tumor capabilities.78 H101 was purchased from Sunway biotech Co. Ltd.
Experimental models (mices)
Female C57BL/6 mice and BALB/c nude mice, aged between 6 and 8 weeks, were procured from Vital River Laboratory Animal Technology Co. Ltd, located in Beijing, China. The mice resided in a controlled environment, with temperatures maintained between 20°C and 22°C and a relative humidity of 30–70%. They were granted unrestricted access to feed and water, while experiencing a balanced 12-h light/dark cycle. This study rigorously adhered to pertinent ethical guidelines for animal experimentation and research. All animal protocols were duly approved by the Institutional Animal Care and Use Committee of the National Center for Nanoscience and Technology (No: NCNST21-2202-YC01).
Method details
Titer assay
The experiment to determine the infection titers of OVs was conducted as follows: JH-293 cells were seeded in a 96-well plate and incubated with OVs for a duration of 8 days. Post incubation, the cytopathic effect (CPE) was observed to evaluate the titers of OVs.The calculation for OVs infection titer was made using the following equation:
Where, V. represents the OVs infection titer (IU/mL); Pw. stands for the number of positive holes; n.is the number of holes per dilution; D. indicates the dilution factor; Aw. signifies the average basal area occupied by JH-293 cells (6.3 × 10⁻⁶ cm2); Cw. corresponds to the number of JH-293 cells per well at infection; I. represents the adenovirus fixed binding transmission coefficient 2.38 × 10⁻⁴; t. stands for the infection time.
Preparation of AD@PSSP
In crafting AD@PSSP, the solution of 400 μL PSSP (1 mg/mL) was amalgamated with 100 μL AD and subsequently allowed to incubate at room temperature for half an hour. Superfluous PSSP was eliminated via ultracentrifugation at 1500 g at a 4°C for a span of 10 min. The proportionate interaction of AD with PSSP is graphically represented in Figure S1. The morphology and size of the AD@PSSP were ascertained through the utilization of DLS (courtesy of Malvern Instruments, UK) and Transmission Electron Microscopy TEM (facilitated by an HT7700 electron microscope; Hitachi, Japan). AD-NHS-PEG1kDa-Se-Se-PEG (referred to as AD@SSP) were concocted following the identical method to that of AD@PSSP.
Barium iodide staining
In this study, a volume of 100 μL of the AD@PSSP sample, with a concentration of 107 Vp/mL, was subjected to heating at 100°C for a duration of 5 min. The process of electrophoresis was initiated, and a stringent halt was implemented immediately as 20 μL of the protein sample achieved migration to the gel’s bottom. Subsequent to the cessation of electrophoresis, the gel underwent a series of washing cycles, ranging from 2 to 3 times, with deionized water. This step was essential to eliminate any remnants of the electrophoresis buffer from the gel’s surface, thereby preventing potential interference with subsequent analytical procedures. Further processing involved the immersion of the gel in a 5% barium chloride solution for a period extending from 20 to 30 min. To ensure the complete removal of barium chloride, which could interfere with subsequent staining processes, the gel was subjected to additional washing steps, 2 to 3 times, with deionized water. The staining phase involved the gel being soaked in a 0.1 M iodine solution for approximately 5 min, or until the PEG bands were distinctly visible. To achieve optimal clarity and background contrast, the gel was immersed in deionized water, with multiple changes of the water until the background was fully decolorized. Conclusively, the gel, now with a clear background and devoid of impurities, was subjected to imaging.
Quantitative real-time PCR
For the E1A gene, the primers AD11-F (TTGGACGGCTCCTGGAATAG) and AD11-R (TGTGACGGAAACAACCCTGACT) were utilized. The qPCR assay was conducted using the ABI Quantitative 3.0 system. The SYBR Green assay (Vazyme, China) was employed for the detection of the virus genome.
Neutralizing antibody binding with AD or AD-PEG
The serum containing neutralizing antibodies of AD was diluted to 1:100. 10 μL diluted neutralizing antibody was then mixed with 10 μL AD or AD-PEG (107 pfu/mL) and incubated for 1 h at 4°C. Subsequently, protein G-coated agarose beads (Beyotime, China) were added to the mixture and incubated for another hour. The mixture was then centrifuged at 6000 rpm for 1 min, and the supernatant was collected. The amount of AD remaining in the supernatant was determined by a qPCR assay. The qPCR results with AD, but without the antibody, were used as controls in the experiment.
Macrophage endocytosis of AD or AD-PEG
Bone Marrow-Derived Macrophages (BMDM) were seeded at 106 cells per well (100 μL) in 96-well plates. AD and AD-PEG were added at a starting Multiplicity of Infection (MOI) of 20 pfu/cell. After incubation for 2 h, the plates were centrifuged. The amount of AD remaining in the supernatant was determined by a qPCR assay. The qPCR results with AD, but without any BMDM, were used as controls in this experiment.
Cell transfection assay
TC-1, HCT-116, and Huvec cells were seeded at a density of 10,000 cells per well into 96-well plates (100 μL) and cultured overnight. Thereafter, these cells were treated with an AD-related preparation (at 1 × 10⁴ pfu/well, 1 × 10⁵ pfu/well or 2 × 10⁵ pfu/well) dispensed in culture medium, and then incubated for a duration of 14 h. In vitro generation of ROS was achieved using a 10% H2O2 solution. Pertaining to the RT-centered experiments, cells underwent an irradiation protocol (2 Gy), succeeded by the introduction of AD-related formulations a dozen hours thereafter. The intracellular GFP expression was quantified through flow cytometry analysis, employing apparatus from ACEA Biosciences, USA, specifically the NovoCyte system. For the in vivo tumor transfection study, AD-associated formulations were intravenously injected into C57 mice harboring TC-1 tumors. The mice were concurrently subjected to radiation therapy at a dosage of 2 Gy, concomitant with the venous administration of the treatment agent. A day following treatment, the tumors were carefully resected to undergo detailed immunofluorescence imaging.
Viral replication
HCT-116 cells were seeded at a density of 5000 cells per well in a 96-well plate, arranged in 8 rows of 10 wells each. In the first row, 10 μL of AD related preparations (100 pfu/cell) was added to each well. Successive rows were inoculated with a 10-fold serial dilution of the virus. Two hours post-infection, the supernatant was discarded and the cells were washed thrice with serum-free DMEM. Subsequently, each well was replenished with 0.1 mL of DMEM supplemented with 10% FBS, and the plate was incubated at 37°C with 5% CO2. The TCID50 was calculated using a methodology previously described in the literature. The replication rate was determined by dividing the TCID50 at 96 h by the TCID50 at 24 h.
Immunofluorescence
The tumor tissues were embedded and sectioned for further study. The tissue sections were then examined using laser scanning confocal microscopy equipment from 3DHISTECH, Hungary (models: pannoramic MIDI, pannoramic 250FLASH, pannoramic DESK).
Cell viability assay
The cytotoxicity of AD-related formulations or RT on TC-1, HCT-116, and Huvec cells was assessed via the CCK8 assay. In brief, related cells were planted at a density of 10,000 cells per well in 96-well plates (100 μL) and left to incubate overnight. The cells were subsequently infected with AD-related formulations (at concentrations of 1 × 10⁷ pfu/well, 1 × 10⁶ pfu/well, 1 × 10⁵ pfu/well, and 1 × 10⁴ pfu/well) in culture media, and then incubated for a span of 96 h. Following this incubation, each well was supplemented with 100 μL of CCK8 (at a concentration of 1 mg/mL) and incubated for an additional 0.5 h at 37°C.
In vitro generation of ROS was achieved using a 10% H2O2 solution. Pertaining to the RT-centered experiments, cells underwent an irradiation protocol (2 Gy), succeeded by the introduction of AD-related formulations a dozen hours thereafter.
The optical density of the CCK8 assay was determined at a wavelength of 450 nm. Cells cultivated solely in medium were used as a positive control (indicating maximum OD), while culture medium alone served as the negative control (representing minimum OD). Cell viability was calculated with the following formula: Cell viability (%) = (OD experimental - OD negative control)/(OD positive control - OD negative control) × 100.
Construction of high-CHEK1-HCT-116 cells
HCT-116 cells are seeded into a 6-well plate at a density of 1×10⁵ cells per well, using Opti-MEM as the growth medium. For transfection, 2.5 μg of plasmid DNA (pHBLP003747) is added per well. Lipofectamine 3000 is diluted in serum-free medium, and the plasmid DNA solution is then mixed with the transfection reagent solution. The mixture is incubated at room temperature for 5-20 min to allow for complex formation. Subsequently, the transfection mixture is carefully added to each well, ensuring uniform distribution by gently shaking the plate. The cells are cultured at 37°C in a 5% CO2 incubator for 48 h post-transfection. To assess the expression level of CHEK1, a Western blot analysis is performed.
In vitro ROS measurement
Tumor cells from different groups were prepared into a single-cell suspension. Subsequent operations were carried out according to the instructions of the ROS detection kit (E004-1-1). The ROS levels in tumor tissues, following various doses of radiation therapy, were measured 12 h post-irradiation upon excision of the murine tumors.
To confirm the breakage of Se-Se in AD@PSSP under ROS action
NHS-BHQ2 and PEI-Se-Se-PEG-Cy3 were mixed in PBS at a molar mass ratio of 1:1. They were then mixed with AD at a ratio of 1.6x10⁶/Vp at room temperature for 30 min. The unreacted NHS-BHQ2 and PEI-Se-Se-PEG-Cy3 were then removed through dialysis (with a molecular weight cut-off of 10,000) in a phosphate buffer for an additional 24 h at 4°C. The final product was AD(NHS-BHQ2)-@PSSP-Cy3. In contrast, the counterpart formulation AD@PSSP-Cy3 was synthesized through the equimolar mixing of NHS-PEG1Kda and PEI-Se-Se-PEG-Cy3 in a 1:1 ratio. Formulations of H2O2 were meticulously prepared at distinct concentrations to reflect ROS levels equivalent to those observed in tumors treated with 0 Gy, 1 Gy, and 2 Gy of RT, where the mean fluorescence intensity of DCF measured 80, 220, and 350, respectively. The formulations AD(BHQ2)@PSSP-Cy3, AD@PSSP-Cy3, and AD(BHQ2)@PSSP-Cy3, following a 10 min immersion in the aforementioned H2O2 solutions, were then placed within a fluorescence spectrophotometer (Hitachi, Japan, F-4600) to measure their respective wavelengths.AD(BHQ2)@PSSP-Cy3 was then intravenously injected into C57 mice bearing TC-1 tumors. One group of mice received RT (2 Gy) targeted to the tumor while the other group did not receive RT. 24 h later, the tumor, liver, spleen, kidney, lungs, and heart were dissected for an ex vivo fluorescence examination using the Maestro system (Caliper, USA, IVIS Spectrum). Similarly, AD(Cy5.5)@PSSP-Cy3 was prepared and intravenously injected into C57 mice bearing TC-1 tumors. One group of mice received RT (2 Gy) targeted to the tumor while the other group did not receive RT. 24 h later, the tumors were collected and immunofluorescence staining was performed.
Clone formation assay
1 mL HCT-116 cells were seeded in a 6-well plate (approximately 300 cells per well), and were treated with various substances, namely PBS, AD, PEI, and AD-PEI (1 pfu/cell). Each group was then exposed to X-ray irradiation at various doses: 0 Gy, 3 Gy, 6 Gy, and 9 Gy. Post irradiation (after 24 h), the culture medium was replaced, and cells were observed periodically. Cultivation was halted when visible colonies appeared in the PBS, 0 Gy cell group. The culture medium was thereafter discarded, followed by three washes of the cells with PBS, and then left to air-dry naturally. Each well was fixed with 1mL of methanol for 15 min, after which the methanol was discarded and the plate was left to air-dry naturally. The cells were then stained with crystal violet for 15 min, then slowly rinsed with running water to remove the crystal violet staining solution, and again left to air-dry naturally. The number of colonies (each consisting of ≥50 cells) formed in each well of the six-well plate was counted. Radiation-related biological parameters were calculated and survival curves were fitted according to the single-hit multi-target model. In the equation SF = 1-(1-e-D/D0)N (1), SF represents the survival fraction, D0 represents the mean lethal dose , D represents the radiation dose, and N represents the extrapolation number.
Proteomic analysis
Proteomic analysis was conducted on three cell lines: HCT-116 cells irradiated with 6 Gy radiation three times, unirradiated HCT-116 cells, and TC-1 cells. PBS and AD-PEI (1 pfu/cell for HCT-116 cells and 10 pfu/cell for TC-1 cells) were subsequently added to the cells. After 24 h, supernatants were collected, and cells were harvested, with 20 μL (3×10⁶ cells) obtained from each group. Each experimental group included three biological replicates.
For tumor tissue analysis, samples from both the primary tumor control group and the RT+AD@PSSP treatment group were dissected and processed into 80 mg samples for further analysis, with four biological replicates per group.
For splenocyte analysis, spleens from mice in the immune memory model were collected on days 0, 20, and 40 and mechanically dissociated into single-cell suspensions. CD3+ T cells were isolated by flow cytometry, with three biological replicates per group.
The collected samples were sent to Novogene Co. Ltd. for proteomic analysis using label-free quantification. Protein identification was performed using the Uniprot database. The heatmap data processing method involved standardizing the protein or metabolite values in each sample using the formula: z = (x – μ)/σ, where ‘x' represents the original quantification value of a specific protein or metabolite in a sample, ‘μ' is the mean value of that protein or metabolite across all samples, and ‘σ' is the standard deviation (STDEV.S) of the protein or metabolite across all samples.
TDPs preparation
The TC-1 cells were planted in a flask that contained 30 mL of culture media. After being incubated overnight at a temperature of 37°C, they were washed with PBS and exposed to a dosage of 20 Gy photon radiation. This was carried out using an X-ray biological irradiator (RS2000, Rod Source technologies Asia Limited, USA). Following the irradiation, the TC-1 cells were left to incubate in media that lacked FBS for a period of 48 h. Upon completion of the incubation period, the supernatant was harvested and subjected to centrifugation at a speed of 200 g for a duration of 5 min. This was done to eliminate any insoluble cellular debris that may have been present.
In vitro antigen capture
The 100 μL AD, AD-PEI, AD@PSSP and ROS+AD@PSSP were dissolved in 500 μL TDPs (2 mg/mL) and incubated at a temperature of 4°C for a period of 60 min. After this, they were centrifuged at a speed of 12,000 rpm using an ultra-centrifugal tube (MWCO 200 KD). The total amount of protein uptake by the AD, AD-PEI, AD@PSSP and ROS+AD@PSSP was calculated by subtracting the protein concentration detected in the supernatant after capture by the AD, AD-PEI, AD@PSSP and ROS+AD@PSSP from the protein concentration measured in the supernatant prior to the capture.
In vitro antigen uptake and presentation assays
Initially, Cy5.5-NHS was reacted with OVAs for a period of 12 h in a dark room, at a mass ratio of 1:100. The unreacted Cy5.5-NHS was then removed through dialysis (with a molecular weight cut-off of 10,000) in a phosphate buffer over an additional 24 h. Following this, Cy5.5-labeled OVAs were introduced to BMDCs (106 cells). Subsequently, AD, AD-PEI, AD@PSSP and ROS+AD@PSSP were added to the mix respectively. After an incubation period of 5 h at 37°C, the fluorescence of Cy5.5 in the BMDCs was analyzed using flow cytometry, which allowed for the assessment of antigen uptake. The maturation of the cells was evaluated through the use of anti-mouse MHCI-OVA was used for the evaluation of antigen presentation.
Lymph node drainage and antigen presentation in vivo
Cy5.5-labeled OVAs were administered around the TC-1 tumors in C57BL/6 mice. This was followed by intravenous injections of saline, AD@SSP (AD-PEG1Kda-Se-Se-PEG20Kda), and AD@PSSP. Concurrently, the tumor underwent irradiation of 2 Gy. After a period of 24 h, the right-drained lymph nodes were collected for an ex vivo fluorescence examination using the Maestro system (Caliper, USA, IVIS Spectrum). The assessment of Cy5.5+ cells and antigen presentation in BMDCs was performed according to previously established procedures. To elaborate, the procured lymph nodes were crushed into a single cell suspension using cell strainers of 70 μm. After this crushing process, the cells were centrifuged at room temperature for a duration of 5 min at a speed of 1500 rpm, and the supernatant was disposed of. The cellular precipitate was subsequently re-suspended using RPMI 1640 supplemented with 2% FBS, and then stained with the specified antibodies.
AD-Cy5.5, Cy5.5, and PBS were intratumorally administered to subcutaneous TC-1 tumor-bearing C57BL/6 mice. After 24 h, the draining lymph nodes were harvested for ex vivo fluorescence imaging using the Maestro system (Caliper, USA, IVS Spectrum). The inguinal lymph nodes were subsequently flash-frozen, cryo-sectioned, and stained with DAPI, anti-CD3, and anti-B220 antibodies. The stained sections were visualized using laser scanning confocal microscopy (3DHISTECH, Hungary; Pannoramic MIDI, Pannoramic 250 FLASH, Pannoramic DESK). The distribution of Cy5.5 in various immune cell populations within the lymph nodes, including F4/80+ macrophages, CD11c+ DCs, CD11c+ CD8− CD103- resident DCs, and CD11c+CD8+CD103+ migratory DCs, was assessed based on established protocols.
Evaluation of antibody titers by elisa
A Nunc MaxiSorp flat-bottom 96 well plate was coated with a solution of AD (10 μg mL−1, 100 μL per well), in phosphate buffer saline (PBS, 0.01 m, pH 7.4) and left to incubate at 4°C overnight. The coated plate was then washed with PBS/0.5% Tween 20 (PBST) (4 × 200 μL) and blocked with 1% BSA in PBS (100 μL per well) at 4°C for 6 h. The plate was washed again with PBST (4 × 200 μL) and incubated with serial dilutions of mouse sera in 0.1% BSA/PBS (100 μL per well, 4 wells for each dilution). The plate was then incubated at 37°C for 2 h, following which it was washed with PBST (4 × 200 μL). Next, a 1:2000 dilution of HRP-conjugated goat anti-mouse IgG in 0.1% BSA/PBS (100 μL) was added to each well and incubated at 37°C for 1 h. The plate was then washed with PBST (4 × 200 μL) and trimethylbenzene (TMB) solution (100 μL) was added. The color was allowed to develop for 10–15 min before adding 1 m H2SO4 (100 μL) to quench the reaction.mThe absorbance was measured at 450 nm using a microplate reader (Synergy HTX, BioTek, USA). The titer was determined by regression analysis, plotting log10 dilution against optical density. The titer was reported as the highest dilution fold producing an optical absorbance value of 0.1 over the preimmune control sera (OD = 0.2). All samples were tested in four replicates.
Immunization and tumor therapy experiments
For bilateral tumor mice models, on day −7, 3.5 × 10⁶ TC-1 cells or B16 cells were subcutaneously injected into the back (primary tumor) of female C57BL/6 mice (aged 6–8 weeks). Then, on day −4, another 3.5 × 10⁶ TC-1 cells or B16 cells were injected into a different location on the back (distant tumor). On days 0, 2, 4, and 6, the primary tumors were intratumorally injected with various drugs (AD, AD@SSP (AD-PEG1Kda-Se-Se-PEG20Kda), and AD@PSSP at a dose of 5 × 10⁷ pfu; H101 and H101@PSSP at a dose of 5 × 10⁸ pfu). RT was administered daily across a span of eight days (1–8 days), meted out in eight discrete doses of 2 Gy each. On day 14, the primary tumors, distant tumors, spleens, and serum of the mice were analyzed. During drug administration, tumor volume and body weight were measured every two days. The formula for calculating tumor volume (V) was: V = 1/2ab,2 where ‘a' and ‘b' are the long and short axes of the tumor, respectively.
For mice with pre-existing immunity against AD, a low dose of AD (5 × 10⁶ pfu) was subcutaneously injected into the mice on days −42, −28, and −14. The timeline was the same as described above for animal experiments, except that the tumor was inoculated on day −7.
In the immune checkpoint inhibitor animal model, the PD-1 inhibitor B7-H1 was administered subcutaneously at a dose of 40 μg on days 0, 2, 4, and 6. The remaining treatment schedule followed the previously described protocol.
In the different drug injection method animal models, AD@PSSP was administered intratumorally 12 h prior to RT. The remaining treatment schedule followed the previously described protocol.
To deplete CD4+ T cells, CD8+ T cells, and NK cells, mice were intraperitoneally injected with 50 μg of monoclonal antibodies targeting CD4, CD8, and NK cells on days −8, −6, −2, 2, 6, and 10. The subsequent treatment regimen followed the same schedule as described above.
In the different RT protocol animal models, the RT regimens were as follows: 2 Gy per session, once daily, for a total of 8 sessions; 4 Gy per session, once every two days, for a total of 4 sessions; and 8 Gy per session, once every four days, for a total of 2 sessions. The remaining treatment schedule followed the previously described protocol.
In the RT normal tissue efficacy models, the treatment protocol for the thigh mirrors that used for tumors. Specifically, a daily dose of 2 Gy is administered once per day for a total of eight fractions. The subsequent treatment regimen adhered to the same schedule as outlined above.
In the BALB/c nude mice, 1 × 10⁸ HCT-116 cells were subcutaneously inoculated on day 0. On days 12 and 14, pertinent drugs were administered. RT was administered daily across a span of four days (12–15 days), meted out in four discrete doses of 2 Gy each. By day 21, the tumors were harvested for subsequent immunofluorescence analysis, allowing for the observation of CHEK1, CDK1, and GFP expression among different groups.
Cells were collected and subjected to intracellular staining in accordance with the manufacturer’s guidelines, following the Intracellular Flow Cytometry Staining Protocol supplied by BioLegend.
RT-resistant model
The establishment of RT-resistant mouse models typically involves inducing tumor cells to develop radioresistance through prolonged fractionated radiation exposure. Two primary theories explain the mechanisms underlying radioresistance: radiation-induced tumor mutations and tumor radiation selection.79,80 The first theory posits that low-dose, long-term irradiation induces gradual mutations in tumor cells, resulting in the emergence of radioresistant clones. The second theory, which we employed in this study, involves high-dose, short-course irradiation. This approach selectively eliminates radiation-sensitive tumor cells, leaving behind a population enriched with radioresistant cells and cancer stem cells that subsequently dominate. In our study, we first determined the half-maximal lethal dose (LD50) for TC-1 cells to be 6 Gy. Based on this, TC-1 cells were exposed to 6 Gy of radiation. Upon reaching 80% confluence in culture, cells were subjected to repeated irradiation until a cumulative dose of 30 Gy was achieved.Clonogenic assays were then performed to evaluate the radioresistance of these treated cells. A significant difference in the mean lethal dose (D0) between the treated and untreated cells confirmed the successful generation of RT-resistant tumor cells.Next, 1×10⁶ radiation-resistant TC-1 cells were subcutaneously implanted into C57BL/6 mice. Subsequent procedures, including immunotherapy and tumor treatment experiments, were conducted as described in the corresponding section.As outlined earlier, a minimum dose of 2 Gy is required to facilitate the release of AD-PEI from AD@PSSP, making it the starting dose for irradiation in this study. In preliminary tests, we found that under continuous radiation conditions, 4 Gy is the maximum tolerable dose for C57BL/6 mice. Based on these findings, we selected doses of 2 Gy, 2.5 Gy, and 3 Gy per fraction for safety and efficacy evaluations in this study.
PDX model
The PDX tumor was derived from a human liver cancer cell line provided by Hefei PreceDo Pharmaceuticals Co., Ltd. It demonstrated moderate sensitivity to RT. The PDX tumor tissue was rinsed twice with 5 mL of PBS containing 1% penicillin-streptomycin, with the PBS completely removed after each wash. Subsequently, 3 mL of PBS with 1% penicillin-streptomycin was added to immerse the tumor tissue. Using sterilized scalpels and tweezers, fascia, necrotic tissues, and blood clots on the tumor surface were carefully excised, leaving behind a uniformly elastic and intact tumor region. The remaining tumor tissue was sectioned into approximately 2 × 2 × 2 mm fragments and placed in normal saline for further use. A pre-sterilized inoculation needle was prepared, and tumor fragments were loaded into the barrel of the needle. A small volume of PBS was added to the needle barrel to surround and cushion the tumor fragments. Female athymic nude mice aged 6 to 8 weeks were restrained manually with the left hand, exposing the right lateral skin. The local skin was disinfected with an alcohol swab. Using the right hand, the inoculation needle was inserted at a shallow angle along the lower edge of the ribcage into the subcutaneous space. The needle was carefully advanced subcutaneously along the underside of the skin toward the forelimb extremity. Care was taken to ensure the needle remained within the subcutaneous space, with a total insertion length of approximately 4 cm. When the needle tip reached the scapular region on the right side, the tumor fragment was injected into the subcutaneous space. After implantation, the nude mice were returned to their cages for continued rearing. On day 14 post-implantation, treatment protocols commenced. RT was delivered daily at a dose of 2 Gy for six consecutive days. AD-related drugs, at a dose of 5 × 10⁷ pfu, were administered intravenously every other day for a total of three doses. Tumors were harvested on day 12 after the completion of the treatment regimen.
Elisa
Whole blood was gathered and subjected to centrifugation at 4°C at 3000 g for 30 min to collect the serum. Additionally, 1 mL of the tumor cell suspension was centrifuged at 4°C at 2000 rpm for 10 min to separate the supernatant. Proceed in accordance with the instructions provided in the reagent manual.
The survival curves and immune memory
C57BL/6 mice were subcutaneously inoculated with 3.5 × 10⁶ TC-1-Luc cells on day −20 at the right back to establish primary tumors. On day −3, a surgical procedure was employed to remove the tumors, leaving 10% of the residual tumor behind. After that, Different agents were given for 4 times on days 0, 2, 4 and 6 and given intravenously. RT was administered daily across a span of eight days (1–8 days), meted out in eight discrete doses of 2 Gy each. Mice were imaged in vivo prior to and post-surgery, and on days 20, 40, and 60 following surgery. The in vivo imaging analysis was conducted as follows: A 15 mg/mL D-Luciferin working solution was prepared in PBS (without Mg2+ and Ca2+), and bacteria were removed by filtering through a 0.2 μm filter membrane. The injection volume was calculated as 10 μL per gram of body weight. 10 to 15 min post intraperitoneal injection, the mice were placed in the imaging machine for analysis. The growth of tumor volume in primary tumors was measured every other day until day 60. On day 60, living mice in the RT+AD@PSSP group were subcutaneously inoculated with 3.5 × 10⁶ TC-1-Luc cells at the left back to establish distant tumors, with healthy mice of the same age used as controls. The distant tumors, spleens, and blood were harvested for analysis on day 80. Peripheral blood and splenocytes were collected to analyze memory T cells (Tem (CD3+CD8+CD44+CD62L−)) using flow cytometry. Splenocytes were further used in specific killing assays. For this, splenocytes were cultured overnight with TDPs, then co-cultured with TC-1 cells at a ratio of 10:1 for 24 h. The CCK-8 assay was used to calculate the percentage of specific killing.
Quantification and statistical analysis
Data are represented as the mean ± standard deviation (SD), with a minimum of 3 independent experiments performed for each in vitro study. All statistical analyses were carried out using SPSS software, version 22.0. Differences among multiple groups were examined using one-way analysis of variance and Tukey post hoc tests. Kaplan-Meier curves were scrutinized using two-sided log rank tests. Scatter charts and histograms were plotted using GraphPad Prism 7. The data obtained from flow cytometry, WB, and laser scanning confocal microscopy were analyzed using NovoExpress Software, ImageJ Lab v6.1, and NIS-Elements Viewer respectively. NS, not significant; ∗p < 0.05; ∗∗p < 0.01; ∗∗∗p < 0.001; ∗∗∗∗p < 0.0001.
Published: April 14, 2025
Footnotes
Supplemental information can be found online at https://doi.org/10.1016/j.xcrm.2025.102078.
Contributor Information
Guangjun Nie, Email: niegj@nanoctr.cn.
Keman Cheng, Email: chengkm@nanoctr.cn.
Funan Liu, Email: fnliu@cmu.edu.cn.
Supplemental information
References
- 1.Shalhout S.Z., Miller D.M., Emerick K.S., Kaufman H.L. Therapy with oncolytic viruses: progress and challenges. Nat. Rev. Clin. Oncol. 2023;20:160–177. doi: 10.1038/s41571-022-00719-w. [DOI] [PubMed] [Google Scholar]
- 2.Lawler S.E., Speranza M.C., Cho C.F., Chiocca E.A. Oncolytic Viruses in Cancer Treatment: A Review. JAMA Oncol. 2017;3:841–849. doi: 10.1001/jamaoncol.2016.2064. [DOI] [PubMed] [Google Scholar]
- 3.Lin D., Shen Y., Liang T. Oncolytic virotherapy: basic principles, recent advances and future directions. Signal Transduct. Target. Ther. 2023;8:156. doi: 10.1038/s41392-023-01407-6. [DOI] [PMC free article] [PubMed] [Google Scholar]
- 4.Huang Z., Guo H., Lin L., Li S., Yang Y., Han Y., Huang W., Yang J. Application of oncolytic virus in tumor therapy. J. Med. Virol. 2023;95 doi: 10.1002/jmv.28729. [DOI] [PubMed] [Google Scholar]
- 5.Touchefeu Y., Vassaux G., Harrington K.J. Oncolytic viruses in radiation oncology. Radiother. Oncol. 2011;99:262–270. doi: 10.1016/j.radonc.2011.05.078. [DOI] [PubMed] [Google Scholar]
- 6.Gállego Pérez-Larraya J., Garcia-Moure M., Labiano S., Patiño-García A., Dobbs J., Gonzalez-Huarriz M., Zalacain M., Marrodan L., Martinez-Velez N., Puigdelloses M., et al. Oncolytic DNX-2401 Virus for Pediatric Diffuse Intrinsic Pontine Glioma. N. Engl. J. Med. 2022;386:2471–2481. doi: 10.1056/NEJMoa2202028. [DOI] [PubMed] [Google Scholar]
- 7.Todo T., Ito H., Ino Y., Ohtsu H., Ota Y., Shibahara J., Tanaka M. Intratumoral oncolytic herpes virus G47Δ for residual or recurrent glioblastoma: a phase 2 trial. Nat. Med. 2022;28:1630–1639. doi: 10.1038/s41591-022-01897-x. [DOI] [PMC free article] [PubMed] [Google Scholar]
- 8.Todo T., Ino Y., Ohtsu H., Shibahara J., Tanaka M. A phase I/II study of triple-mutated oncolytic herpes virus G47Δ in patients with progressive glioblastoma. Nat. Commun. 2022;13:4119. doi: 10.1038/s41467-022-31262-y. [DOI] [PMC free article] [PubMed] [Google Scholar]
- 9.Fares J., Ahmed A.U., Ulasov I.V., Sonabend A.M., Miska J., Lee-Chang C., Balyasnikova I.V., Chandler J.P., Portnow J., Tate M.C., et al. Neural stem cell delivery of an oncolytic adenovirus in newly diagnosed malignant glioma: a first-in-human, phase 1, dose-escalation trial. Lancet Oncol. 2021;22:1103–1114. doi: 10.1016/s1470-2045(21)00245-x. [DOI] [PMC free article] [PubMed] [Google Scholar]
- 10.van Putten E.H.P., Kleijn A., van Beusechem V.W., Noske D., Lamers C.H.J., de Goede A.L., Idema S., Hoefnagel D., Kloezeman J.J., Fueyo J., et al. Convection Enhanced Delivery of the Oncolytic Adenovirus Delta24-RGD in Patients with Recurrent GBM: A Phase I Clinical Trial Including Correlative Studies. Clin. Cancer Res. 2022;28:1572–1585. doi: 10.1158/1078-0432.Ccr-21-3324. [DOI] [PMC free article] [PubMed] [Google Scholar]
- 11.Shimizu Y., Gumin J., Gao F., Hossain A., Shpall E.J., Kondo A., Parker Kerrigan B.C., Yang J., Ledbetter D., Fueyo J., et al. Characterization of patient-derived bone marrow human mesenchymal stem cells as oncolytic virus carriers for the treatment of glioblastoma. J. Neurosurg. 2022;136:757–767. doi: 10.3171/2021.3.Jns203045. [DOI] [PMC free article] [PubMed] [Google Scholar]
- 12.Shirakawa Y., Tazawa H., Tanabe S., Kanaya N., Noma K., Koujima T., Kashima H., Kato T., Kuroda S., Kikuchi S., et al. Phase I dose-escalation study of endoscopic intratumoral injection of OBP-301 (Telomelysin) with radiotherapy in oesophageal cancer patients unfit for standard treatments. Eur. J. Cancer. 2021;153:98–108. doi: 10.1016/j.ejca.2021.04.043. [DOI] [PubMed] [Google Scholar]
- 13.Monga V., Miller B.J., Tanas M., Boukhar S., Allen B., Anderson C., Stephens L., Hartwig S., Varga S., Houtman J., et al. Intratumoral talimogene laherparepvec injection with concurrent preoperative radiation in patients with locally advanced soft-tissue sarcoma of the trunk and extremities: phase IB/II trial. J. Immunother. Cancer. 2021;9 doi: 10.1136/jitc-2021-003119. [DOI] [PMC free article] [PubMed] [Google Scholar]
- 14.Sun K., Xu Y., Zhang L., Niravath P., Darcourt J., Patel T., Teh B.S., Farach A.M., Guerrero C., Mathur S., et al. A Phase 2 Trial of Enhancing Immune Checkpoint Blockade by Stereotactic Radiation and In Situ Virus Gene Therapy in Metastatic Triple-Negative Breast Cancer. Clin. Cancer Res. 2022;28:4392–4401. doi: 10.1158/1078-0432.Ccr-22-0622. [DOI] [PMC free article] [PubMed] [Google Scholar]
- 15.Kieran M.W., Goumnerova L., Manley P., Chi S.N., Marcus K.J., Manzanera A.G., Polanco M.L.S., Guzik B.W., Aguilar-Cordova E., Diaz-Montero C.M., et al. Phase I study of gene-mediated cytotoxic immunotherapy with AdV-tk as adjuvant to surgery and radiation for pediatric malignant glioma and recurrent ependymoma. Neuro Oncol. 2019;21:537–546. doi: 10.1093/neuonc/noy202. [DOI] [PMC free article] [PubMed] [Google Scholar]
- 16.Hartiala P., Suominen S., Suominen E., Kaartinen I., Kiiski J., Viitanen T., Alitalo K., Saarikko A.M. Phase 1 Lymfactin(Ⓡ) Study: Short-term Safety of Combined Adenoviral VEGF-C and Lymph Node Transfer Treatment for Upper Extremity Lymphedema. J. Plast. Reconstr. Aesthet. Surg. 2020;73:1612–1621. doi: 10.1016/j.bjps.2020.05.009. [DOI] [PubMed] [Google Scholar]
- 17.Bilusic M., McMahon S., Madan R.A., Karzai F., Tsai Y.T., Donahue R.N., Palena C., Jochems C., Marté J.L., Floudas C., et al. Phase I study of a multitargeted recombinant Ad5 PSA/MUC-1/brachyury-based immunotherapy vaccine in patients with metastatic castration-resistant prostate cancer (mCRPC) J. Immunother. Cancer. 2021;9 doi: 10.1136/jitc-2021-002374. [DOI] [PMC free article] [PubMed] [Google Scholar]
- 18.Zhang X., Wang Y., Lv X., Wang F., Zhou Q., Zhang F., Zhang M., Chen J. Intratumoral injection of oncolytic virus (H101) in combination with concurrent chemoradiotherapy for locally advanced cervical cancer. Int. J. Gynecol. Cancer. 2023;33:1051–1056. doi: 10.1136/ijgc-2022-003914. [DOI] [PubMed] [Google Scholar]
- 19.Hou X., Zaks T., Langer R., Dong Y. Lipid nanoparticles for mRNA delivery. Nat. Rev. Mater. 2021;6:1078–1094. doi: 10.1038/s41578-021-00358-0. [DOI] [PMC free article] [PubMed] [Google Scholar]
- 20.Kansız S., Elçin Y.M. Advanced liposome and polymersome-based drug delivery systems: Considerations for physicochemical properties, targeting strategies and stimuli-sensitive approaches. Adv. Colloid Interface Sci. 2023;317 doi: 10.1016/j.cis.2023.102930. [DOI] [PubMed] [Google Scholar]
- 21.Lee C.H., Kasala D., Na Y., Lee M.S., Kim S.W., Jeong J.H., Yun C.O. Enhanced therapeutic efficacy of an adenovirus-PEI-bile-acid complex in tumors with low coxsackie and adenovirus receptor expression. Biomaterials. 2014;35:5505–5516. doi: 10.1016/j.biomaterials.2014.03.060. [DOI] [PubMed] [Google Scholar]
- 22.Choi J.W., Nam J.P., Nam K., Lee Y.S., Yun C.O., Kim S.W. Oncolytic Adenovirus Coated with Multidegradable Bioreducible Core-Cross-Linked Polyethylenimine for Cancer Gene Therapy. Biomacromolecules. 2015;16:2132–2143. doi: 10.1021/acs.biomac.5b00538. [DOI] [PubMed] [Google Scholar]
- 23.Yang X., Wei Y., Zheng L., You J., Li H., Gao L., Gong C., Yi C. Polyethyleneimine-based immunoadjuvants for designing cancer vaccines. J. Mater. Chem. B. 2022;10:8166–8180. doi: 10.1039/d2tb01358d. [DOI] [PubMed] [Google Scholar]
- 24.Wang Z., Guo Y., Shen M., Wang Y., Shi X. Hyperbranched Polymer-Based Vaccines for Cancer Immunotherapy. Macromol. Biosci. 2023;23 doi: 10.1002/mabi.202300188. [DOI] [PubMed] [Google Scholar]
- 25.Duan S., Wang S., Qiao L., Yu X., Wang N., Chen L., Zhang X., Zhao X., Liu H., Wang T., et al. Oncolytic Virus-Driven Biotherapies from Bench to Bedside. Small. 2023;19 doi: 10.1002/smll.202206948. [DOI] [PubMed] [Google Scholar]
- 26.Chen L., Ma Z., Xu C., Xie Y., Ouyang D., Song S., Zhao X., Liu F. Progress in oncolytic viruses modified with nanomaterials for intravenous application. Cancer Biol. Med. 2023;20:830–855. doi: 10.20892/j.issn.2095-3941.2023.0275. [DOI] [PMC free article] [PubMed] [Google Scholar]
- 27.Goins W.F., Hall B., Cohen J.B., Glorioso J.C. Retargeting of herpes simplex virus (HSV) vectors. Curr. Opin. Virol. 2016;21:93–101. doi: 10.1016/j.coviro.2016.08.007. [DOI] [PMC free article] [PubMed] [Google Scholar]
- 28.Ayer M., Klok H.A. Cell-mediated delivery of synthetic nano- and microparticles. J. Control. Release. 2017;259:92–104. doi: 10.1016/j.jconrel.2017.01.048. [DOI] [PubMed] [Google Scholar]
- 29.Pottanam Chali S., Ravoo B.J. Polymer Nanocontainers for Intracellular Delivery. Angew. Chem. Int. Ed. Engl. 2020;59:2962–2972. doi: 10.1002/anie.201907484. [DOI] [PMC free article] [PubMed] [Google Scholar]
- 30.Large D.E., Abdelmessih R.G., Fink E.A., Auguste D.T. Liposome composition in drug delivery design, synthesis, characterization, and clinical application. Adv. Drug Deliv. Rev. 2021;176 doi: 10.1016/j.addr.2021.113851. [DOI] [PubMed] [Google Scholar]
- 31.Kim P.H., Sohn J.H., Choi J.W., Jung Y., Kim S.W., Haam S., Yun C.O. Active targeting and safety profile of PEG-modified adenovirus conjugated with herceptin. Biomaterials. 2011;32:2314–2326. doi: 10.1016/j.biomaterials.2010.10.031. [DOI] [PubMed] [Google Scholar]
- 32.Hill C., Carlisle R. Achieving systemic delivery of oncolytic viruses. Expert Opin. Drug Deliv. 2019;16:607–620. doi: 10.1080/17425247.2019.1617269. [DOI] [PubMed] [Google Scholar]
- 33.Ban W., Guan J., Huang H., He Z., Sun M., Liu F., Sun J. Emerging systemic delivery strategies of oncolytic viruses: A key step toward cancer immunotherapy. Nano Res. 2022;15:4137–4153. doi: 10.1007/s12274-021-4031-6. [DOI] [PMC free article] [PubMed] [Google Scholar]
- 34.Wychowaniec J.K., Brougham D.F. Emerging Magnetic Fabrication Technologies Provide Controllable Hierarchically-Structured Biomaterials and Stimulus Response for Biomedical Applications. Adv. Sci. 2022;9 doi: 10.1002/advs.202202278. [DOI] [PMC free article] [PubMed] [Google Scholar]
- 35.Zhao Z., Ukidve A., Kim J., Mitragotri S. Targeting Strategies for Tissue-Specific Drug Delivery. Cell. 2020;181:151–167. doi: 10.1016/j.cell.2020.02.001. [DOI] [PubMed] [Google Scholar]
- 36.Xiao W., Zhao L., Sun Y., Yang X., Fu Q. Stimuli-Responsive Nanoradiosensitizers for Enhanced Cancer Radiotherapy. Small Methods. 2024;8 doi: 10.1002/smtd.202301131. [DOI] [PubMed] [Google Scholar]
- 37.Liu J., Jia B., Li Z., Li W. Reactive oxygen species-responsive polymer drug delivery systems. Front. Bioeng. Biotechnol. 2023;11 doi: 10.3389/fbioe.2023.1115603. [DOI] [PMC free article] [PubMed] [Google Scholar]
- 38.Ma N., Li Y., Xu H., Wang Z., Zhang X. Dual redox responsive assemblies formed from diselenide block copolymers. J. Am. Chem. Soc. 2010;132:442–443. doi: 10.1021/ja908124g. [DOI] [PubMed] [Google Scholar]
- 39.Kroeze S.G.C., Pavic M., Stellamans K., Lievens Y., Becherini C., Scorsetti M., Alongi F., Ricardi U., Jereczek-Fossa B.A., Westhoff P., et al. Metastases-directed stereotactic body radiotherapy in combination with targeted therapy or immunotherapy: systematic review and consensus recommendations by the EORTC-ESTRO OligoCare consortium. Lancet Oncol. 2023;24:e121–e132. doi: 10.1016/s1470-2045(22)00752-5. [DOI] [PubMed] [Google Scholar]
- 40.Herrera F.G., Romero P., Coukos G. Lighting up the tumor fire with low-dose irradiation. Trends Immunol. 2022;43:173–179. doi: 10.1016/j.it.2022.01.006. [DOI] [PubMed] [Google Scholar]
- 41.Huang R.X., Zhou P.K. DNA damage response signaling pathways and targets for radiotherapy sensitization in cancer. Signal Transduct. Target. Ther. 2020;5:60. doi: 10.1038/s41392-020-0150-x. [DOI] [PMC free article] [PubMed] [Google Scholar]
- 42.Tian W., Zhang Y., Liu H., Jin H., Sun T. LINC01123 potentially correlates with radioresistance in glioma through the miR-151a/CENPB axis. Neuropathology. 2022;42:3–15. doi: 10.1111/neup.12764. [DOI] [PubMed] [Google Scholar]
- 43.Kuo I.Y., Huang Y.L., Lin C.Y., Lin C.H., Chang W.L., Lai W.W., Wang Y.C. SOX17 overexpression sensitizes chemoradiation response in esophageal cancer by transcriptional down-regulation of DNA repair and damage response genes. J. Biomed. Sci. 2019;26:20. doi: 10.1186/s12929-019-0510-4. [DOI] [PMC free article] [PubMed] [Google Scholar]
- 44.Huang J., Meng Q., Liu R., Li H., Li Y., Yang Z., Wang Y., Wanyan C., Yang X., Wei J. The development of radioresistant oral squamous carcinoma cell lines and identification of radiotherapy-related biomarkers. Clin. Transl. Oncol. 2023;25:3006–3020. doi: 10.1007/s12094-023-03169-7. [DOI] [PubMed] [Google Scholar]
- 45.Shin S.C., Lee K.M., Kang Y.M., Kim K., Lim S.A., Yang K.H., Kim J.Y., Nam S.Y., Kim H.S. Differential expression of immune-associated cancer regulatory genes in low- versus high-dose-rate irradiated AKR/J mice. Genomics. 2011;97:358–363. doi: 10.1016/j.ygeno.2011.01.005. [DOI] [PubMed] [Google Scholar]
- 46.Ponzoni M., Issa S., Batchelor T.T., Rubenstein J.L. Beyond high-dose methotrexate and brain radiotherapy: novel targets and agents for primary CNS lymphoma. Ann. Oncol. 2014;25:316–322. doi: 10.1093/annonc/mdt385. [DOI] [PMC free article] [PubMed] [Google Scholar]
- 47.Narayan R.S., Gasol A., Slangen P.L.G., Cornelissen F.M.G., Lagerweij T., Veldman H.Y.Y.E., Dik R., van den Berg J., Slotman B.J., Würdinger T., et al. Identification of MEK162 as a Radiosensitizer for the Treatment of Glioblastoma. Mol. Cancer Ther. 2018;17:347–354. doi: 10.1158/1535-7163.Mct-17-0480. [DOI] [PubMed] [Google Scholar]
- 48.Bruyere D., Roncarati P., Lebeau A., Lerho T., Poulain F., Hendrick E., Pilard C., Reynders C., Ancion M., Luyckx M., et al. Human papillomavirus E6/E7 oncoproteins promote radiotherapy-mediated tumor suppression by globally hijacking host DNA damage repair. Theranostics. 2023;13:1130–1149. doi: 10.7150/thno.78091. [DOI] [PMC free article] [PubMed] [Google Scholar]
- 49.Tan Z., Xiao L., Tang M., Bai F., Li J., Li L., Shi F., Li N., Li Y., Du Q., et al. Targeting CPT1A-mediated fatty acid oxidation sensitizes nasopharyngeal carcinoma to radiation therapy. Theranostics. 2018;8:2329–2347. doi: 10.7150/thno.21451. [DOI] [PMC free article] [PubMed] [Google Scholar]
- 50.Lee J.H., Choi S.I., Kim R.K., Cho E.W., Kim I.G. Tescalcin/c-Src/IGF1Rβ-mediated STAT3 activation enhances cancer stemness and radioresistant properties through ALDH1. Sci. Rep. 2018;8 doi: 10.1038/s41598-018-29142-x. [DOI] [PMC free article] [PubMed] [Google Scholar]
- 51.Zhong Z., Harmston N., Wood K.C., Madan B., Virshup D.M. A p300/GATA6 axis determines differentiation and Wnt dependency in pancreatic cancer models. J. Clin. Investig. 2022;132 doi: 10.1172/jci156305. [DOI] [PMC free article] [PubMed] [Google Scholar]
- 52.Stoyanov G.S., Lyutfi E., Georgieva R., Georgiev R., Dzhenkov D., Petkova L., Ivanov B.D., Kaprelyan A., Ghenev P. Diaph3 underlines tumor cell heterogeneity in glioblastoma with implications for treatment modalities resistance. J. Neuro Oncol. 2022;157:523–531. doi: 10.1007/s11060-022-03996-8. [DOI] [PubMed] [Google Scholar]
- 53.El-Saghire H., Vandevoorde C., Ost P., Monsieurs P., Michaux A., De Meerleer G., Baatout S., Thierens H. Intensity modulated radiotherapy induces pro-inflammatory and pro-survival responses in prostate cancer patients. Int. J. Oncol. 2014;44:1073–1083. doi: 10.3892/ijo.2014.2260. [DOI] [PMC free article] [PubMed] [Google Scholar]
- 54.Qi X., Yan Q., Shang Y., Zhao R., Ding X., Gao S.J., Li W., Lu C. A viral interferon regulatory factor degrades RNA-binding protein hnRNP Q1 to enhance aerobic glycolysis via recruiting E3 ubiquitin ligase KLHL3 and decaying GDPD1 mRNA. Cell Death Differ. 2022;29:2233–2246. doi: 10.1038/s41418-022-01011-1. [DOI] [PMC free article] [PubMed] [Google Scholar]
- 55.Wen J., Liu H., Wang L., Wang X., Gu N., Liu Z., Xu T., Gomez D.R., Komaki R., Liao Z., Wei Q. Potentially Functional Variants of ATG16L2 Predict Radiation Pneumonitis and Outcomes in Patients with Non-Small Cell Lung Cancer after Definitive Radiotherapy. J. Thorac. Oncol. 2018;13:660–675. doi: 10.1016/j.jtho.2018.01.028. [DOI] [PMC free article] [PubMed] [Google Scholar]
- 56.Ran Q., Jin F., Xiang Y., Xiang L., Wang Q., Li F., Chen L., Zhang Y., Wu C., Zhou L., et al. CRIF1 as a potential target to improve the radiosensitivity of osteosarcoma. Proc. Natl. Acad. Sci. USA. 2019;116:20511–20516. doi: 10.1073/pnas.1906578116. [DOI] [PMC free article] [PubMed] [Google Scholar]
- 57.Lei G., Zhang Y., Koppula P., Liu X., Zhang J., Lin S.H., Ajani J.A., Xiao Q., Liao Z., Wang H., Gan B. The role of ferroptosis in ionizing radiation-induced cell death and tumor suppression. Cell Res. 2020;30:146–162. doi: 10.1038/s41422-019-0263-3. [DOI] [PMC free article] [PubMed] [Google Scholar]
- 58.van Bijsterveldt L., Durley S.C., Maughan T.S., Humphrey T.C. The Challenge of Combining Chemo- and Radiotherapy with Checkpoint Kinase Inhibitors. Clin. Cancer Res. 2021;27:937–962. doi: 10.1158/1078-0432.Ccr-20-3358. [DOI] [PubMed] [Google Scholar]
- 59.Qiu Z., Oleinick N.L., Zhang J. ATR/CHK1 inhibitors and cancer therapy. Radiother. Oncol. 2018;126:450–464. doi: 10.1016/j.radonc.2017.09.043. [DOI] [PMC free article] [PubMed] [Google Scholar]
- 60.Connell C.M., Shibata A., Tookman L.A., Archibald K.M., Flak M.B., Pirlo K.J., Lockley M., Wheatley S.P., McNeish I.A. Genomic DNA damage and ATR-Chk1 signaling determine oncolytic adenoviral efficacy in human ovarian cancer cells. J. Clin. Investig. 2011;121:1283–1297. doi: 10.1172/JCI43976. [DOI] [PMC free article] [PubMed] [Google Scholar]
- 61.Fan J., Du X., Chen M., Xu Y., Xu J., Lu L., Zhou S., Kong X., Xu K., Zhang H. Critical role of checkpoint kinase 1 in spinal cord injury-induced motor dysfunction in mice. Int. Immunopharmacol. 2024;138 doi: 10.1016/j.intimp.2024.112521. [DOI] [PubMed] [Google Scholar]
- 62.Zhou J., Gao Q., Chen G., Huang X., Lu Y., Li K., Xie D., Zhuang L., Deng J., Ma D. Novel oncolytic adenovirus selectively targets tumor-associated polo-like kinase 1 and tumor cell viability. Clin. Cancer Res. 2005;11:8431–8440. doi: 10.1158/1078-0432.CCR-05-1085. [DOI] [PubMed] [Google Scholar]
- 63.Mohammadi E., Sadoughi F., Younesi S., Karimian A., Asemi Z., Farsad-Akhtar N., Jahanbakhshi F., Jamilian H., Yousefi B. The molecular mechanism of nuclear signaling for degradation of cytoplasmic DNA: Importance in DNA damage response and cancer. DNA Repair. 2021;103 doi: 10.1016/j.dnarep.2021.103115. [DOI] [PubMed] [Google Scholar]
- 64.Pitts T.M., Davis S.L., Eckhardt S.G., Bradshaw-Pierce E.L. Targeting nuclear kinases in cancer: development of cell cycle kinase inhibitors. Pharmacol. Ther. 2014;142:258–269. doi: 10.1016/j.pharmthera.2013.12.010. [DOI] [PubMed] [Google Scholar]
- 65.McLaughlin M., Patin E.C., Pedersen M., Wilkins A., Dillon M.T., Melcher A.A., Harrington K.J. Inflammatory microenvironment remodelling by tumour cells after radiotherapy. Nat. Rev. Cancer. 2020;20:203–217. doi: 10.1038/s41568-020-0246-1. [DOI] [PubMed] [Google Scholar]
- 66.Citrin D.E. Recent Developments in Radiotherapy. N. Engl. J. Med. 2017;377:1065–1075. doi: 10.1056/NEJMra1608986. [DOI] [PubMed] [Google Scholar]
- 67.Ngwa W., Irabor O.C., Schoenfeld J.D., Hesser J., Demaria S., Formenti S.C. Using immunotherapy to boost the abscopal effect. Nat. Rev. Cancer. 2018;18:313–322. doi: 10.1038/nrc.2018.6. [DOI] [PMC free article] [PubMed] [Google Scholar]
- 68.Thambi T., Hong J., Yoon A.R., Yun C.O. Challenges and progress toward tumor-targeted therapy by systemic delivery of polymer-complexed oncolytic adenoviruses. Cancer Gene Ther. 2022;29:1321–1331. doi: 10.1038/s41417-022-00469-y. [DOI] [PMC free article] [PubMed] [Google Scholar]
- 69.Suk J.S., Xu Q., Kim N., Hanes J., Ensign L.M. PEGylation as a strategy for improving nanoparticle-based drug and gene delivery. Adv. Drug Deliv. Rev. 2016;99:28–51. doi: 10.1016/j.addr.2015.09.012. [DOI] [PMC free article] [PubMed] [Google Scholar]
- 70.Bulavin D.V., Amundson S.A., Fornace A.J. p38 and Chk1 kinases: different conductors for the G(2)/M checkpoint symphony. Curr. Opin. Genet. Dev. 2002;12:92–97. doi: 10.1016/s0959-437x(01)00270-2. [DOI] [PubMed] [Google Scholar]
- 71.Sanchez Y., Wong C., Thoma R.S., Richman R., Wu Z., Piwnica-Worms H., Elledge S.J. Conservation of the Chk1 checkpoint pathway in mammals: linkage of DNA damage to Cdk regulation through Cdc25. Science. 1997;277:1497–1501. doi: 10.1126/science.277.5331.1497. [DOI] [PubMed] [Google Scholar]
- 72.Dent P. Investigational CHK1 inhibitors in early phase clinical trials for the treatment of cancer. Expert Opin. Investig. Drugs. 2019;28:1095–1100. doi: 10.1080/13543784.2019.1694661. [DOI] [PubMed] [Google Scholar]
- 73.Maugeri-Saccà M., Bartucci M., De Maria R. Checkpoint kinase 1 inhibitors for potentiating systemic anticancer therapy. Cancer Treat Rev. 2013;39:525–533. doi: 10.1016/j.ctrv.2012.10.007. [DOI] [PubMed] [Google Scholar]
- 74.McNeely S., Beckmann R., Bence Lin A.K. CHEK again: revisiting the development of CHK1 inhibitors for cancer therapy. Pharmacol. Ther. 2014;142:1–10. doi: 10.1016/j.pharmthera.2013.10.005. [DOI] [PubMed] [Google Scholar]
- 75.Kuai R., Ochyl L.J., Bahjat K.S., Schwendeman A., Moon J.J. Designer vaccine nanodiscs for personalized cancer immunotherapy. Nat. Mater. 2017;16:489–496. doi: 10.1038/nmat4822. [DOI] [PMC free article] [PubMed] [Google Scholar]
- 76.Xu C., Cheng K., Wang X., Liu J., Liang J., Liu G., Lu Y., Tang M., Qian D., Chen L., et al. Antigen-capturing oncolytic adenoviruses along with IDO blockade for improved tumor immunotherapy. Nano Today. 2023;51 doi: 10.1016/j.nantod.2023.101922. [DOI] [Google Scholar]
- 77.Holterman L., Vogels R., van der Vlugt R., Sieuwerts M., Grimbergen J., Kaspers J., Geelen E., van der Helm E., Lemckert A., Gillissen G., et al. Novel replication-incompetent vector derived from adenovirus type 11 (Ad11) for vaccination and gene therapy: low seroprevalence and non-cross-reactivity with Ad5. J. Virol. 2004;78:13207–13215. doi: 10.1128/jvi.78.23.13207-13215.2004. [DOI] [PMC free article] [PubMed] [Google Scholar]
- 78.Wong H.H., Jiang G., Gangeswaran R., Wang P., Wang J., Yuan M., Wang H., Bhakta V., Müller H., Lemoine N.R., Wang Y. Modification of the Early Gene Enhancer-promoter Improves the Oncolytic Potency of Adenovirus 11. Mol. Ther. 2023;31:300. doi: 10.1016/j.ymthe.2022.11.016. [DOI] [PMC free article] [PubMed] [Google Scholar]
- 79.Wei K., Kodym R., Jin C. Radioresistant cell strain of human fibrosarcoma cells obtained after long-term exposure to x-rays. Radiat. Environ. Biophys. 1998;37:133–137. doi: 10.1007/s004110050106. [DOI] [PubMed] [Google Scholar]
- 80.Pearce A.G., Segura T.M., Rintala A.C., Rintala-Maki N.D., Lee H. The generation and characterization of a radiation-resistant model system to study radioresistance in human breast cancer cells. Radiat. Res. 2001;156:739–750. doi: 10.1667/0033-7587(2001)156[0739:tgacoa]2.0.co;2. [DOI] [PubMed] [Google Scholar]
Associated Data
This section collects any data citations, data availability statements, or supplementary materials included in this article.
Supplementary Materials
Data Availability Statement
-
•
Data: The RNA-seq data and proteomics data reported in this paper have been deposited in the National Center for Biotechnology Information (NCBI) and the integrated proteome resources (IPROX) databases, under BioProject accession numbers PRJNA1215939 and IPX0010992000, respectively. All other relevant detailed data could be available upon reasonable request from the lead contact.
-
•
Code: No custom computer codes are reported in this paper. The code for data analysis is available upon request.
-
•
Any additional information required to reanalyze the data reported in this work paper is available from the lead contact upon request.