

SUMMARY
Pathogenic variants in the RAD51C gene confer an elevated risk of breast and ovarian cancer, while individuals homozygous for specific RAD51C alleles may develop Fanconi Anaemia. Importantly, of all RAD51C variants reported in ClinVar, >50% are classified as variants of uncertain significance (VUS). Using saturation genome editing (SGE) we functionally assess 9,188 unique variants, including >99.5% of all possible coding sequence single nucleotide alterations. By computing changes in variant abundance and Gaussian Mixture Modelling (GMM) we functionally classify 3,094 variants to be disruptive and by comparison to truth sets of variants reveal an accuracy/concordance of variant classification >99.9%. Since cell fitness over time was the primary assay readout in our study, we were able to observe a phenomenon where specific missense variants exhibit distinct depletion kinetics potentially suggesting they represent hypomorphic alleles. We further explored our exhaustive map of variant function revealing functionally critical residues on the RAD51C structure and by resolving the role of VUS across exemplar, cancer-segregating kindred. Furthermore, through interrogation of the UK Biobank and a large multi-centre ovarian cancer cohort we find significant associations between SGE depleted variants and cancer diagnoses.
Graphical Abstract

INTRODUCTION
Individuals with a strong family history of cancer may undergo sequence analysis with the purpose of identifying potentially causal germline variants. This analysis may involve a panel of relevant genes, whole exome or whole genome studies, with subsequent cascade testing of clinically relevant variants in other members of the family1,2. Importantly, interpretation and classification of the large number of variants detected by these approaches represents a significant burden since the contribution of most variants to cancer risk is unknown3. Ultimately this means that despite potentially arduous assembly and manual review of relevant data, for a major fraction of variants there is insufficient evidence to allow confident classification as pathogenic or benign, meaning that many variants are classified as a variant of uncertain significance (VUS). A VUS is not merely an uninformative outcome to genetic testing, the ambiguity elicited can actively complicate medical management of patients4. In some conditions, such as Fanconi Anaemia and pediatric metabolic disorders, direct measurement of a relevant functional readout in a patient has routinely been used to help define the contribution to the disease process of an identified rare variant, but patient-level assays are not available for most conditions. Ex-vivo assays have also been developed to measure a relevant cellular function, but such approaches have to date been laborious and low-throughput. Multiplex assays of variant effect (MAVEs) allow for the functional characterization of large numbers of variants in a single experiment5. Using DNA sequencing, thousands of variants can be quantitatively scored for their potential pathogenicity by comparison to variants of known effect/clinical significance, which facilitates clinical interpretation when used in conjunction with other information such as tumour type, disease penetrance and disease presentation6. Saturation Genome Editing (SGE) is one type of MAVE that has been successfully applied to accurately classify nearly all single-nucleotide variants (SNVs) present in 13 exons of BRCA17, 3 exons of CARD118, as well as all coding exons of DDX3X9. Each SGE experiment involves the introduction of a Cas9/sgRNA complex and a homology variant repair library into human near-haploid (HAP1) cells. The sgRNA targets the genomic region to be edited, such that Cas9 induces a double strand break (DSB), which will then be repaired by homologous recombination (HR) using the variant library as a template. As a result, each cell will carry a single variant from the variant repair library such that deleterious alleles in essential loci will deplete over time, allowing the calculation of function scores for each variant, which can then be used to contribute evidence of pathogenicity (Fig. 1a).
Figure 1: RAD51C is amenable to SGE, and variant abundance differs between mutational consequences:
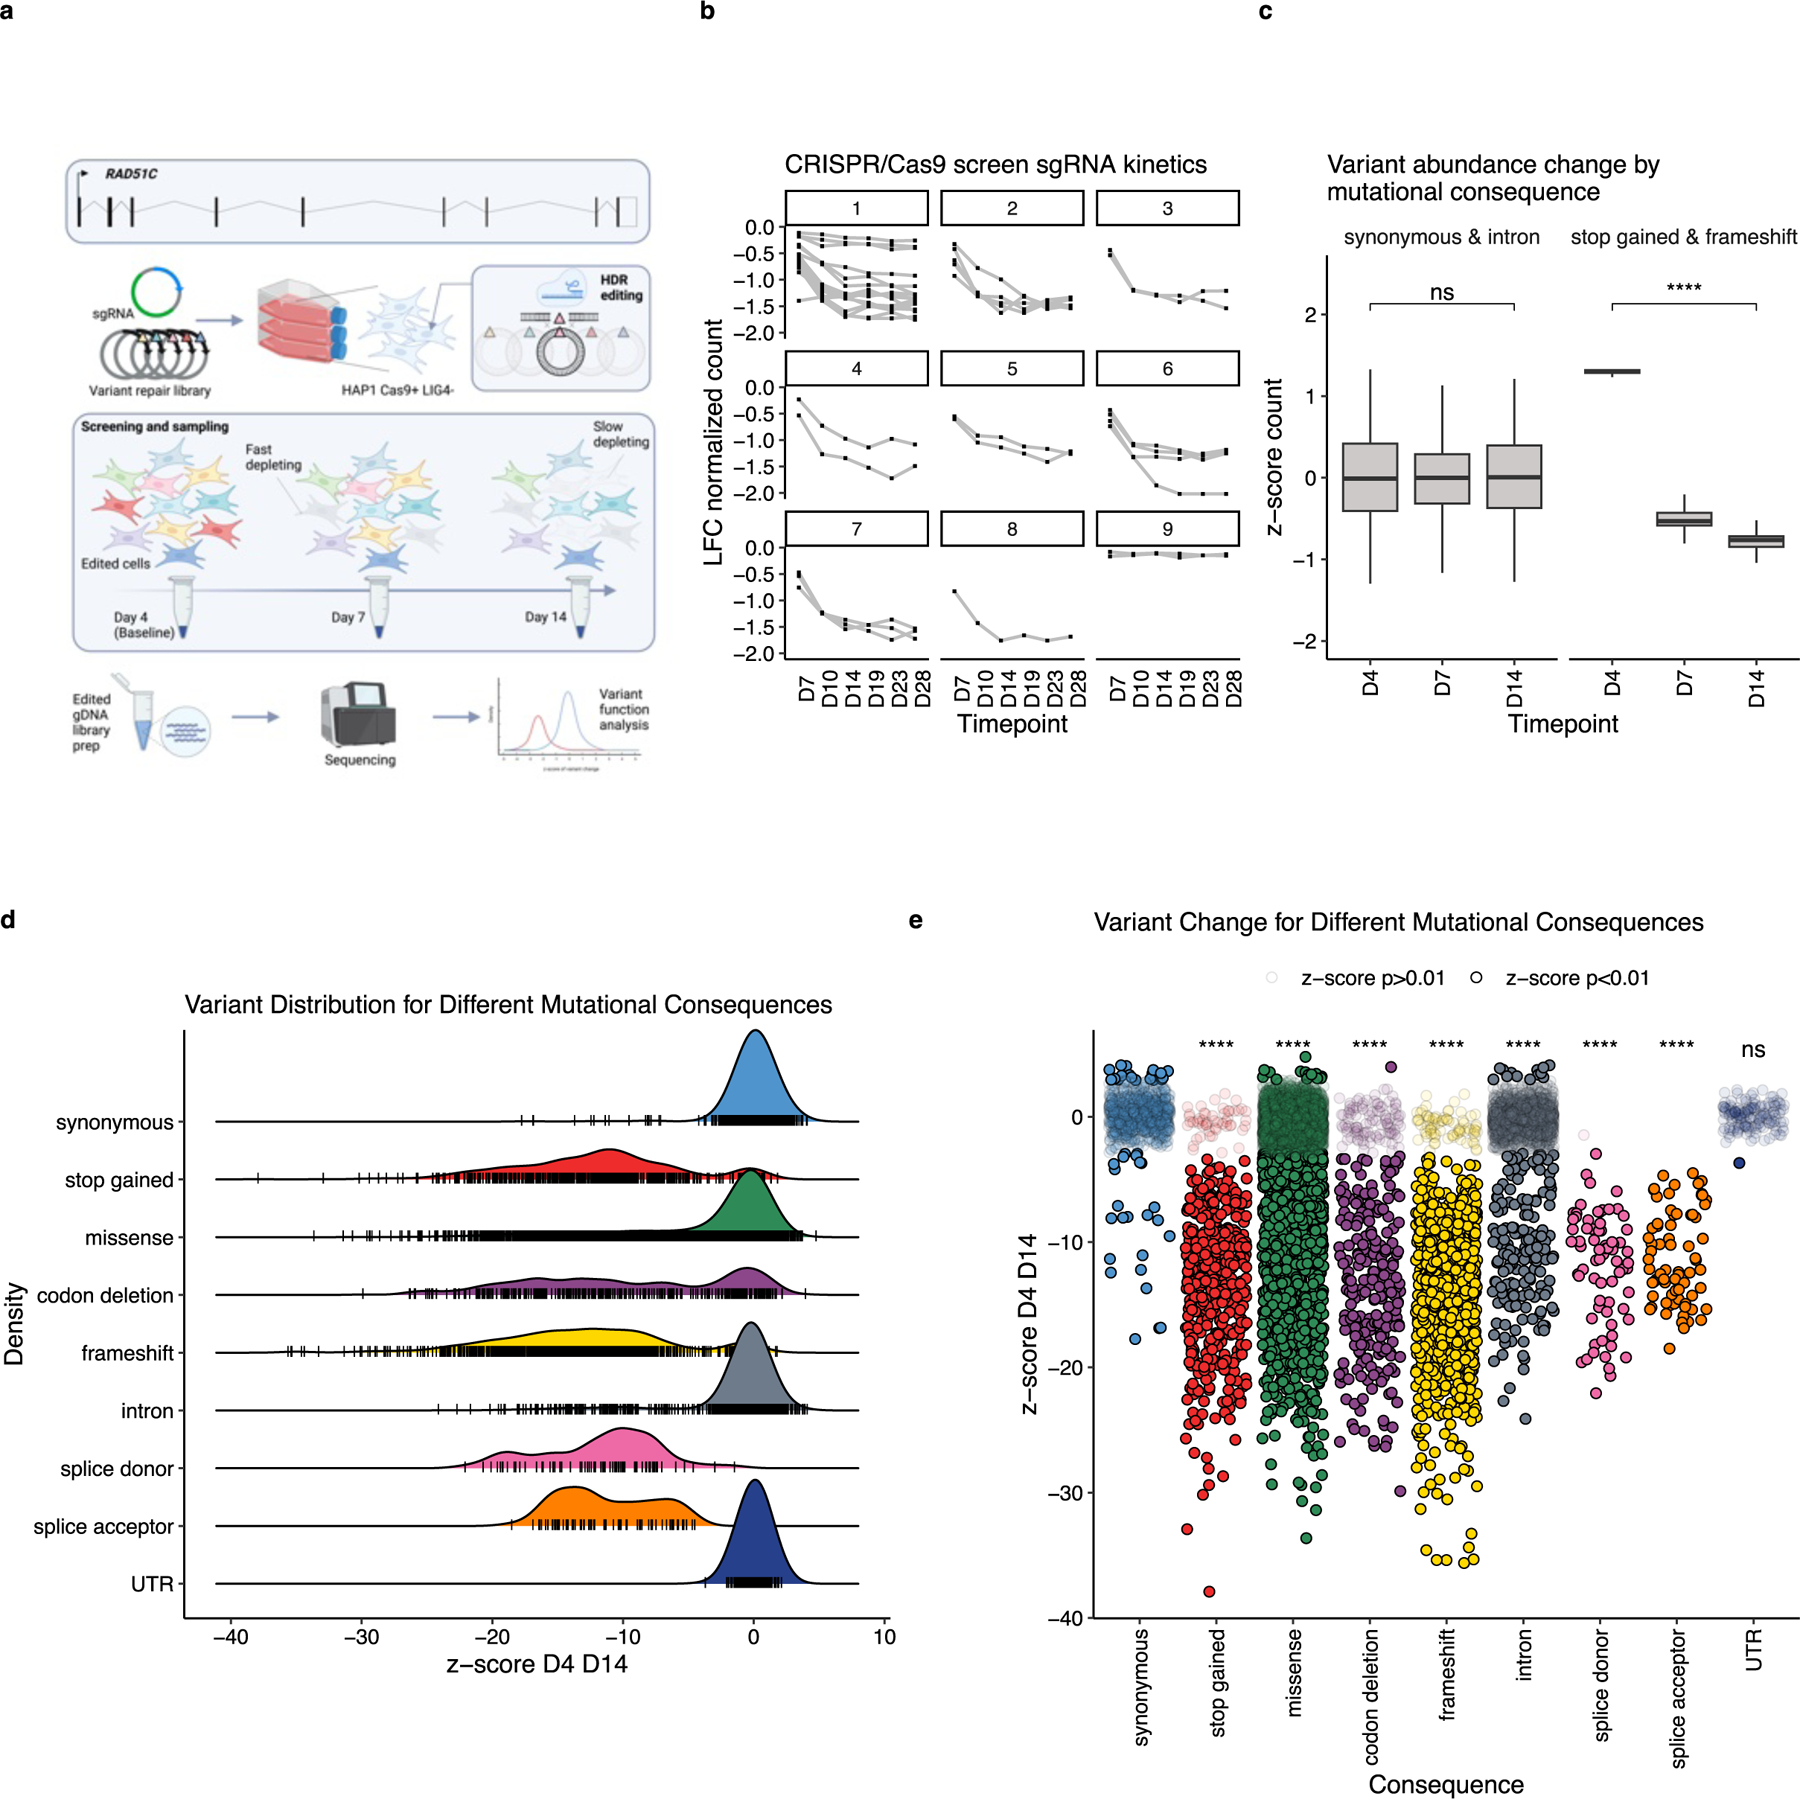
a) RAD51C MANE transcript ENST00000337432.9 was targeted with sgRNA and HDR repair libraries at all 9 exons, in HAP1 cells null for LIG4 with endogenous Cas9 expression, known as the HAP1-A5 cell line. Transfections were performed in triplicate, with cells sampled for edited genomic DNA (gDNA) by sequencing at Days 4, 7 and 14. LFC; log-fold change between the baseline and each timepoint. b) A targeted CRISPR/Cas9 screen was performed in HAP1-A5 cells, with sgRNA depletion observed, indicating RAD51C essentiality in the cell model, consistent with a previous study25. c) All ‘synonymous and intron’, and ‘stop gained and frameshift’ variant counts (regularized log transformed counts scaled across all variants in a target region) were scaled separately across timepoints Day (D) 4, 7 and 14. As expected, synonymous and intronic variant abundance change is not significant (ns) overtime (p=0.6), whereas stop gained and frameshift is (****, p<0.0001), as measured by two-sided Mann-Whitney-Wilcoxon Test. Box shows interquartile range, horizontal line the median z-score of variant abundance, whiskers show maximum and minimum values. d) Density plot showing z-scores for variant change between D4 and D14 for all unique variants assayed for shown mutational consequences (n=8,799), coloured by Ensembl variant effect predictor29 (VEP) mutational consequence. Black tick marks represent single variant values. e) Jitter plot showing z-scores for all variants assayed for selected VEP mutational consequence categories (n=8,799), median z-scores are different between categories as measured by Kruskal-Wallis test (p<0.0001). Data points which have a z-score with an FDR≥0.01 are semi-transparent, the median synonymous z-score differs significantly to all other categories (Dunn’s FDR, **** p<2.2e-16), except UTR variants (not significant, ns, p=0.63). For all Dunn’s non-parametric pairwise multiple comparisons procedure values, see Supplementary Table 1.
Pathogenic variants in genes involved in DNA repair/HR have been demonstrated to confer an increased risk of developing cancer, particularly of the breast and ovary10,11 with variants in BRCA1 and BRCA2 contributing to around 25% of all hereditary breast and ovarian cancers (HBOCs); a further 15% of cases are attributable to variants in PALB2, BRIP1, RAD51C, RAD51D, among others12,13. Additionally, disruptive biallelic variants in HR-pathway genes may cause a severe condition termed Fanconi Anaemia, a rare disorder characterized by chromosomal breakage, developmental anomalies, bone marrow failure, and susceptibility to leukaemia development and other cancers14,15. As above, RAD51C germline predisposition variants (GPVs) are predominantly associated with an elevated risk of ovarian cancer (OC)16–18 and to a lesser extent breast cancer (BC)19,20, particularly triple negative disease. Therefore, RAD51C has been recommended for genetic testing in individuals suspected of susceptibility to these malignancies19. RAD51C GPVs have also been observed in pancreatic cancer kindred21, correlations with acute myeloid leukemia (AML) have also been described22, and carriers of disruptive variants in the gene have been reported to develop gastric cancer23. Of note, of 1,885 RAD51C variants submitted to ClinVar24 as of December 2023, 50.61% (954) are classified as variants of uncertain significance; therefore, knowing the possible pathogenic effect of all gene variants would greatly aid clinical interpretation. Here we employ SGE to evaluate the functional consequences of all SNVs in the nine exons of RAD51C to predict the pathogenicity of VUS. In addition, we included a spectrum of multivariant allele types to assess biological function and to facilitate sequence-function comparisons.
RESULTS
RAD51C saturation editing
We performed SGE across the 9 coding sequence exons of RAD51C, targeting the MANE transcript ENST00000337432.9 in the HAP1-A5 cell line (Fig. 1a). HAP1-A5 has a highly active stable integration of Cas9, is null for LIG4, and is sorted for high haploidy. We elected to phenotype disruptive and non-disruptive variants through changes in variant abundance read out as cell fitness over three time points: Day (D) 4, 7 and 14, performing transfections in triplicate (Fig. 1a).
RAD51C has previously been reported to be an essential gene25,26, however, to confirm this phenotype in HAP1-A5 we performed a targeted CRISPR/Cas9 screen transducing a library in which there were 37 sgRNAs against RAD51C (Fig. 1b). Analysis revealed that 32/37 sgRNAs were depleted, with the majority plateauing from D14 onwards, allowing us to both confirm RAD51C essentiality and to select a terminal timepoint for SGE screening (Fig.1b).
Variant repair libraries were designed based on GRCh38 coordinates and included all coding (CDS) and exon-flanking intron/UTR sequence of RAD51C. Variant sequences were generated using VaLiAnT27, synthesised, and cloned into homology arm vectors. High quality oligonucleotide synthesis lengths are limited to <300bp, however, exons 2,3 and 5 are longer targets, so we tiled libraries across these regions. As such, 12 variant repair libraries were used for RAD51C SGE: 1, 2.1, 2.2, 3.1, 3.2, 4, 5.1, 5.2, 6, 7, 8 and 9. Each variant repair library has a corresponding sgRNA to cut the genome to allow for variant library-based HDR. sgRNAs were selected based on previously reported selection criteria27. Target regions 2.1 and 2.2 used the same sgRNA, resulting in 11 sgRNAs used for screening. Two PAM/Protospacer Protection Edits (PPEs) were incorporated into each library at the corresponding sgRNA target site. These are synonymous variants present in every sequence in the library, which are refractory to sgRNA/Cas9 cutting, preventing cleavage of incorporated repair tracts which increases the edited cell fraction.
The variant repair libraries were created to contain saturating alleles for Single Nucleotide Variants (SNVs), 1bp deletions, in-frame deletions of codons, an alanine and a stop codon scan, and tandem intronic deletions to remove splice donor/acceptor sites. RAD51C clinical and population-observed variants from the ClinVar24 and gnomAD28 databases were also incorporated into libraries, as well as variants reported by Yang et al. (2020)19 in a study of OC and BC risk for female carriers of GPVs in RAD51C and RAD51D.
Variant repair libraries contained a median of 928 variants, ranging from 632 to 1,250. To maintain complex variant representation through a 14-day screen and in samples, 5 million cells were cultured and sampled. Genomic DNA (gDNA) from each replicate-timepoint was processed and sequenced with next-generation amplicon sequencing. Sequencing reads were processed through the QUANTS pipeline (https://github.com/cancerit/QUANTS) to obtain variant counts detected in samples at each timepoint and replicate. A high editing rate of ~50% was achieved for all timepoint-replicate gDNA libraries (Supplementary Data Fig. 1a). In total 108 timepoint-replicate gDNA libraries were processed, generating >168 million reads that mapped to desired variants, giving an average sequencing depth of >1,500x for each variant.
Distribution of variant effects
Variants were annotated for mutational consequence using the Ensembl Variant Effect Predictor29 (VEP). We calculated an observed/expected ratio of variant incorporation, by dividing D4 counts/repair library counts, observing that mutational consequence does not bias variant representation at D4 (e.g., stop-gained counts are not under-represented compared to synonymous counts), confirming that D4 is an appropriate baseline timepoint (Supplementary Data Fig. 1b). Furthermore, we observe limited positional effects in editing. As expected, we observed that counts for synonymous and intronic variants do not deplete significantly between D4 and D14 (p=0.6, two-sided Mann-Whitney-Wilcoxon Test), whereas stop-gained and frameshift variant counts do (p<0.0001, Fig. 1c).
Log2 Fold Changes (LFCs) between D4 and D7, and between D4 and D14 were calculated using the DESeq230 package. LFCs were then scaled by the median LFC of synonymous and intronic variants, which are not expected to change over time. LFCs for variants assayed twice in over-lapping sections of tiled target regions in exons 2, 3 and 5, were combined using an inverse-weighted mean to produce a single value for each variant, such that 9,188 unique nucleotide variants have a D4 vs D7 and a D4 vs D14 LFC value. To allow for comparisons between target regions, median-scaled LFCs were converted to z-scores by dividing by the standard error. p-values were calculated using a two-tailed z-test and adjusted for the False Discovery Rate (FDR) using the Benjamini-Hochberg (BH) method.
Our data show different distributions of z-scores between D4 and D14 (D4 D14) for different mutational consequence categories. Stop-gained, frameshift and splice donor/acceptor variants show negative z-scores (median= −12.4), and synonymous, intron and UTR variants have a unimodal distribution of z-scores centred at 0 (median = −0.1) (Fig. 1d). Codon deletions and missense variants show a spectrum of z-score change, with the majority centred at 0. Of note, 25/975 synonymous and 166/1,596 intronic variants deplete, and 55/512 stop-gained variants do not, suggesting possible cryptic splicing events and/or exon-skipping and escape of nonsense mediated decay (NMD), respectively. The average z-score D4 D14 for synonymous variants is significantly different to all other mutational consequences (except for UTR variants), as determined by Dunn’s non-parametric pairwise multiple comparisons procedure (p<0.0001 for all comparisons, except synonymous and UTR p=0.6, for pairwise comparison p-values see Supplementary Table 1) (Fig.1e).
Functional classification of variant effect and analysis of depletion kinetics
We next used z-scores and FDR values to assign variants into distinct functional classifications. Variants which had an FDR≥0.01 were classified as ‘unchanged’. Variants with an FDR<0.01 and a negative z-score between D4 and D14 were classified as ‘depleted’, and those with an FDR<0.01 and positive z-score between D4 and D14 as ‘enriched’.
To capture potentially meaningful kinetics of variant change beyond unchanged, depleted, and enriched, the depleted classification was further refined into ‘slow depleted’ and ‘fast depleted’ classifications by comparing D4 vs D7 and D4 vs D14 z-scores. To do this we used a Gaussian Mixture Model (GMM), using an ‘ellipsoidal, equal volume and equal shape’ (EEV) approach, determined as appropriate through Bayesian information criterion (BIC) analysis, as previously reported9. Both fast and slow depleted variants are significantly depleted between D4 and D14, with ‘fast depleted’ variants depleted strongly by D7 and ‘slow depleted’ not depleted strongly until D14 (Fig.2a). Most of the 9,188 variants analysed were classed as unchanged: 6,045 in total. Of those depleted, 2,254 were classed as ‘fast depleted’ and 840 as ‘slow depleted’. Forty-nine variants were classed as ‘enriched’. Fast depleted variants exhibit a distinct unimodal z-score distribution, centred at a z-score lower than most slow depleted variants, which exhibit a broader spectrum of negative change (Fig.2b). Fast depleted and slow depleted variants may have similar z-scores between the baseline and terminal timepoints (D4 and D14), with the kinetics of depletion between D4 and D7 being the principal determinant for a fast or slow designation (Fig. 2a-c). Full nucleotide-level and amino acid-level maps showing functional classifications are provided in Supplementary Fig. 2 and Supplementary Fig. 3, respectively.
Figure 2: Analysis of variant kinetics reveals a novel classification of effect:
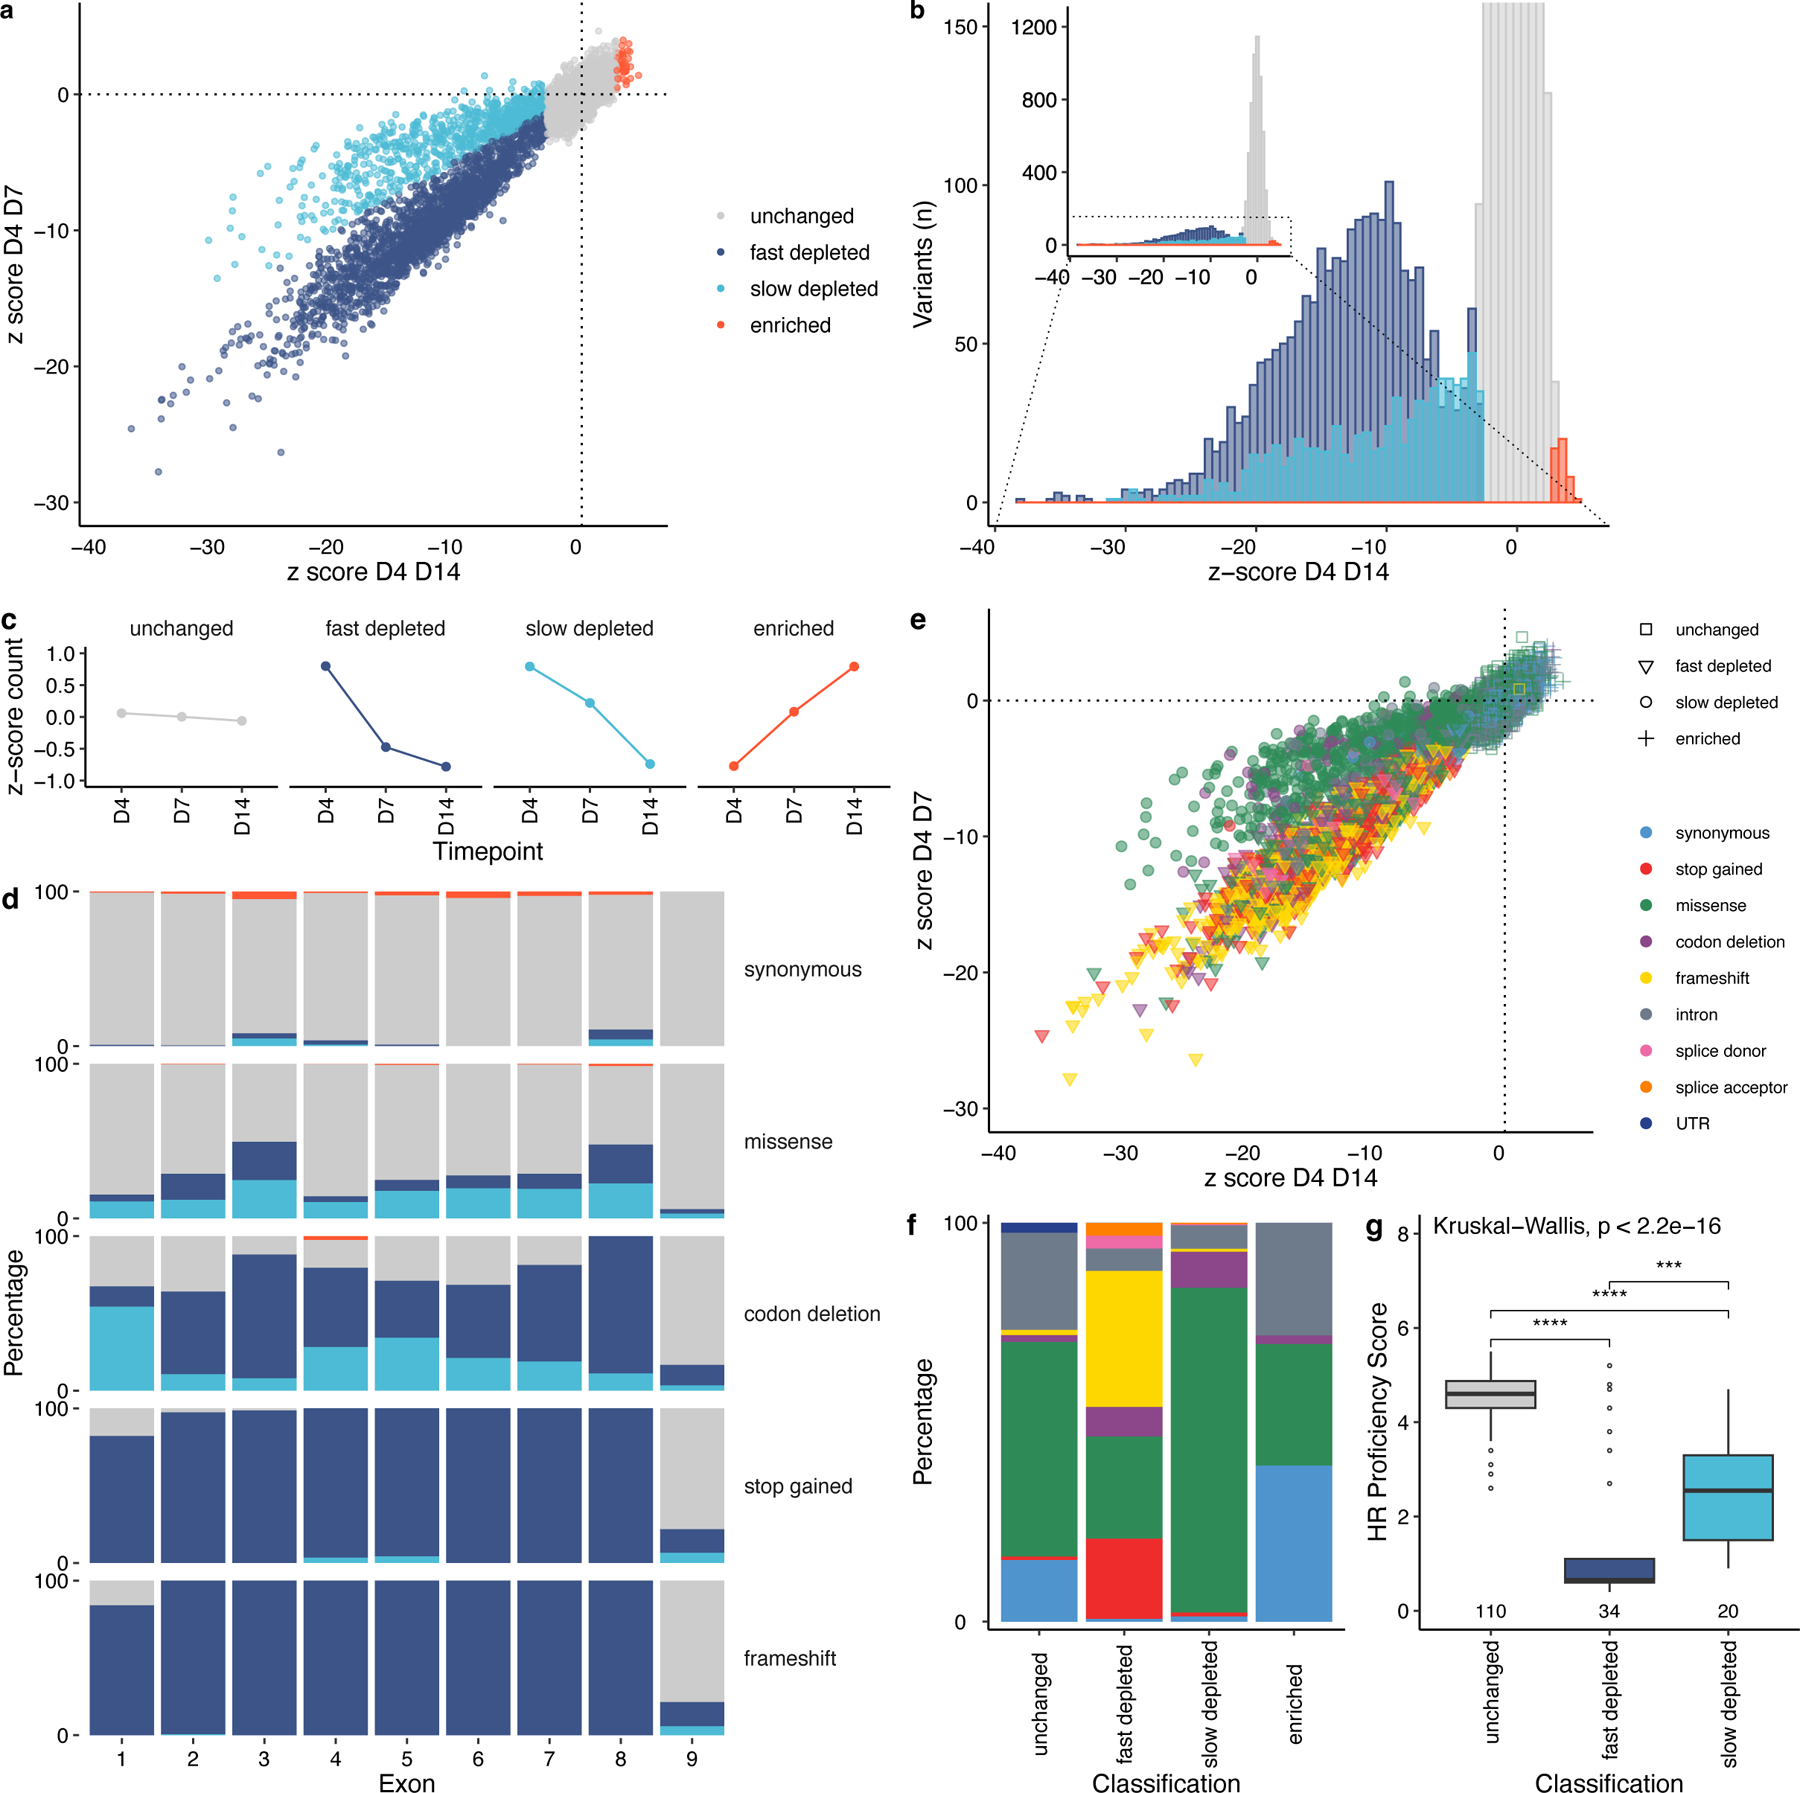
a) comparison of z-score D4 D7 and z-score D4 D14 values, followed by Gaussian Mixture Modelling, identifies two distinct classes of depletion, slow and fast. Slow-depleted variants are less depleted by D7, but become significantly depleted by D14, fast-depleted variants are depleted by D7. 8,836/9,188 variants (n=352 PPE codons removed) b) Same variants as in ‘a’ distributed across 75 x-axis intervals of z-score D4 D14. Most variants are classed as unchanged, with those that are depleted exhibiting a unimodal negative z-score for fast-depleted and a spectrum of negative z-score D4 D14 for slow-depleted variants. c) The kinetics of change at D7 describes the difference between the two classifications. Unchanged variants do not change in abundance, enriched variants increase between the three timepoints. d) The proportion of functional classifications differs between exons and between mutational consequences, a Chi-Squared test of frequency of fast depleted variants by exon reveals the frequencies are significantly different (χ2 = 507.28, p<2.2e-16). Synonymous variants are mostly unchanged across all exons, stop gained and frameshift variants deplete in all exons, with some variants classed as unchanged in exons 1 and 9, explained through an alternative translation initiation codon at M10 (see Supplementary Fig.4), and escape of NMD, respectively. Missense and codon deletion mutational consequence categories have proportionally more slow-depleted variants, compared with other categories. e) A scatterplot of z-score D4 D7 against z-score D4 D14, coloured by mutational consequence highlights that fast-depleted variants (triangle) are predominantly stop gained (red) and frameshift variants (yellow), whilst slow-depleted variants (circle) are predominantly missense (green). n=8,799. f) Slow-depleted variants are mostly composed of missense variants, the fast-depleted classification has proportionally more stop gained and frameshift variants, with some missense. Unchanged and enriched classifications are composed of missense, synonymous and intronic variants. Colours as in ‘e’. g) A boxplot showing the comparison between an orthogonal HR assay and SGE-based functional classification for missense variants tested in Hu et al.32, A low HR Proficiency Score indicates defective HR; consistent with this, unchanged variants have a high score, fast depleted a low score, and slow depleted a significantly higher score than fast depleted and a significantly lower score than unchanged variant classifications (***p<0.001, ****p<0.0001, two-sided Mann-Whitney-Wilcoxon Test). Box shows interquartile range, horizontal line the median HR Proficiency Score, whiskers show maximum and minimum values that are not outliers. Outlier points are shown.
The relative proportion of functional classifications differ across the 9 exons of RAD51C (Fig. 2d). The average z-score D4 D14 also differs between exons at p<0.0001 (H = 459.66), as measured by Kruskal-Wallis rank sum test. For all exons, most synonymous variants are unchanged (931/975). For exons 2–8 most stop-gained (392/400) and frameshift variants (671/674) are observed to be fast depleted. A subset of stop-gained (40/51) and frameshift variants (62/80) in the terminal exon 9 (3’ of D348) are classified as unchanged, suggesting an escape of NMD. Also, a subset of stop-gained (11/61) and frameshift variants (19/110), in exon 1 are classified as unchanged, this is an unexpected finding as these variants are not predicted to escape NMD due to the presence of 3’ introns in the remaining CDS. These variants are present between two methionine residues in the CDS, one at position 1 and one at position 10. M1:M10 is not well conserved across evolution, however R2:M10 is identical between humans and chimpanzees, suggesting that M1 is dispensable. (Supplementary Fig. 4a). Notably, in addition to stop-gained and frameshift variants, no variants deplete between these positions (M1:E9) in exon 1 (Supplementary Fig. 4b-c) suggesting M10 is the first translated amino acid in ENST00000337432.9, or that any compromising effect of disruption at M1 is obviated through alternative translation from M10.
Notably, >80% (683/840) of slow depleted variants exhibit a missense mutational consequence, compared to just 26% (581/2,254) of fast depleted variants (Chi Squared; χ2=8.231, p<0.005). Furthermore, 99% of depleted stop-gained and frameshift variants (n=1,240) are classified as fast depleted (n=1,224) (Fig. 2e and f). Taken together, this suggests a subset (n=581) of missense variants have similar depletion kinetics to putative null alleles, with a larger subset (n=683) exhibiting a more moderate, hypomorphic effect. Of note, two studies31,32 which employed assays that report on the homologous recombination activity of cells carrying RAD51C variants generated values that correlate with the fast, slow, and unchanged classifications obtained from SGE, with slow depleted missense variants having intermediate HR proficiency scores (Fig. 2g & Supplementary Fig. 5a-b). This is important, as most clinically observed missense variants are classified as VUS, and missense variants in our screen can be classified distinctly and quantitatively based on their compromising effect.
Moreover, alternative assays to SGE are low-throughput, provide semi-quantitative readouts, do not capture effects on processes such as splicing (Supplementary Fig. 5c), while SGE is exhaustive in scale and provides a quantitative readout.
Functional classifications correlate with protein domain architecture and conservation
SGE data highlights that intolerance to variation in RAD51C is more concentrated in certain regions of the gene/protein. A greater number of missense variants with low z-score D4 D14 values were observed in two sections of the protein (ENSP00000336701.4), amino acids 100 to 185 (100:185) and 235 to 345 (235:345) (Fig. 3a). Variants in regions 100:185 and 235:345 have a significantly lower average D4 D14 z-score compared with the remainder of the protein (p=5.499011e-122 and 8.051893e-38 Dunn’s BH FDR, respectively). Functional classifications of fast and slow depleted are also concentrated in these regions, which are more highly conserved between RAD51C orthologues than regions of the protein with more unchanged variants (Fig. 3b and c). Indeed, there is a significant, positive correlation between conservation–as measured by percentage orthologue identity–and the proportion of depleted classifications for missense variants at each amino acid position over the length of the protein (Spearman’s rank, rs=0.61, p<2.2e-16).
Figure 3: Functional classification correlates with evolutionary conservation and mutability:
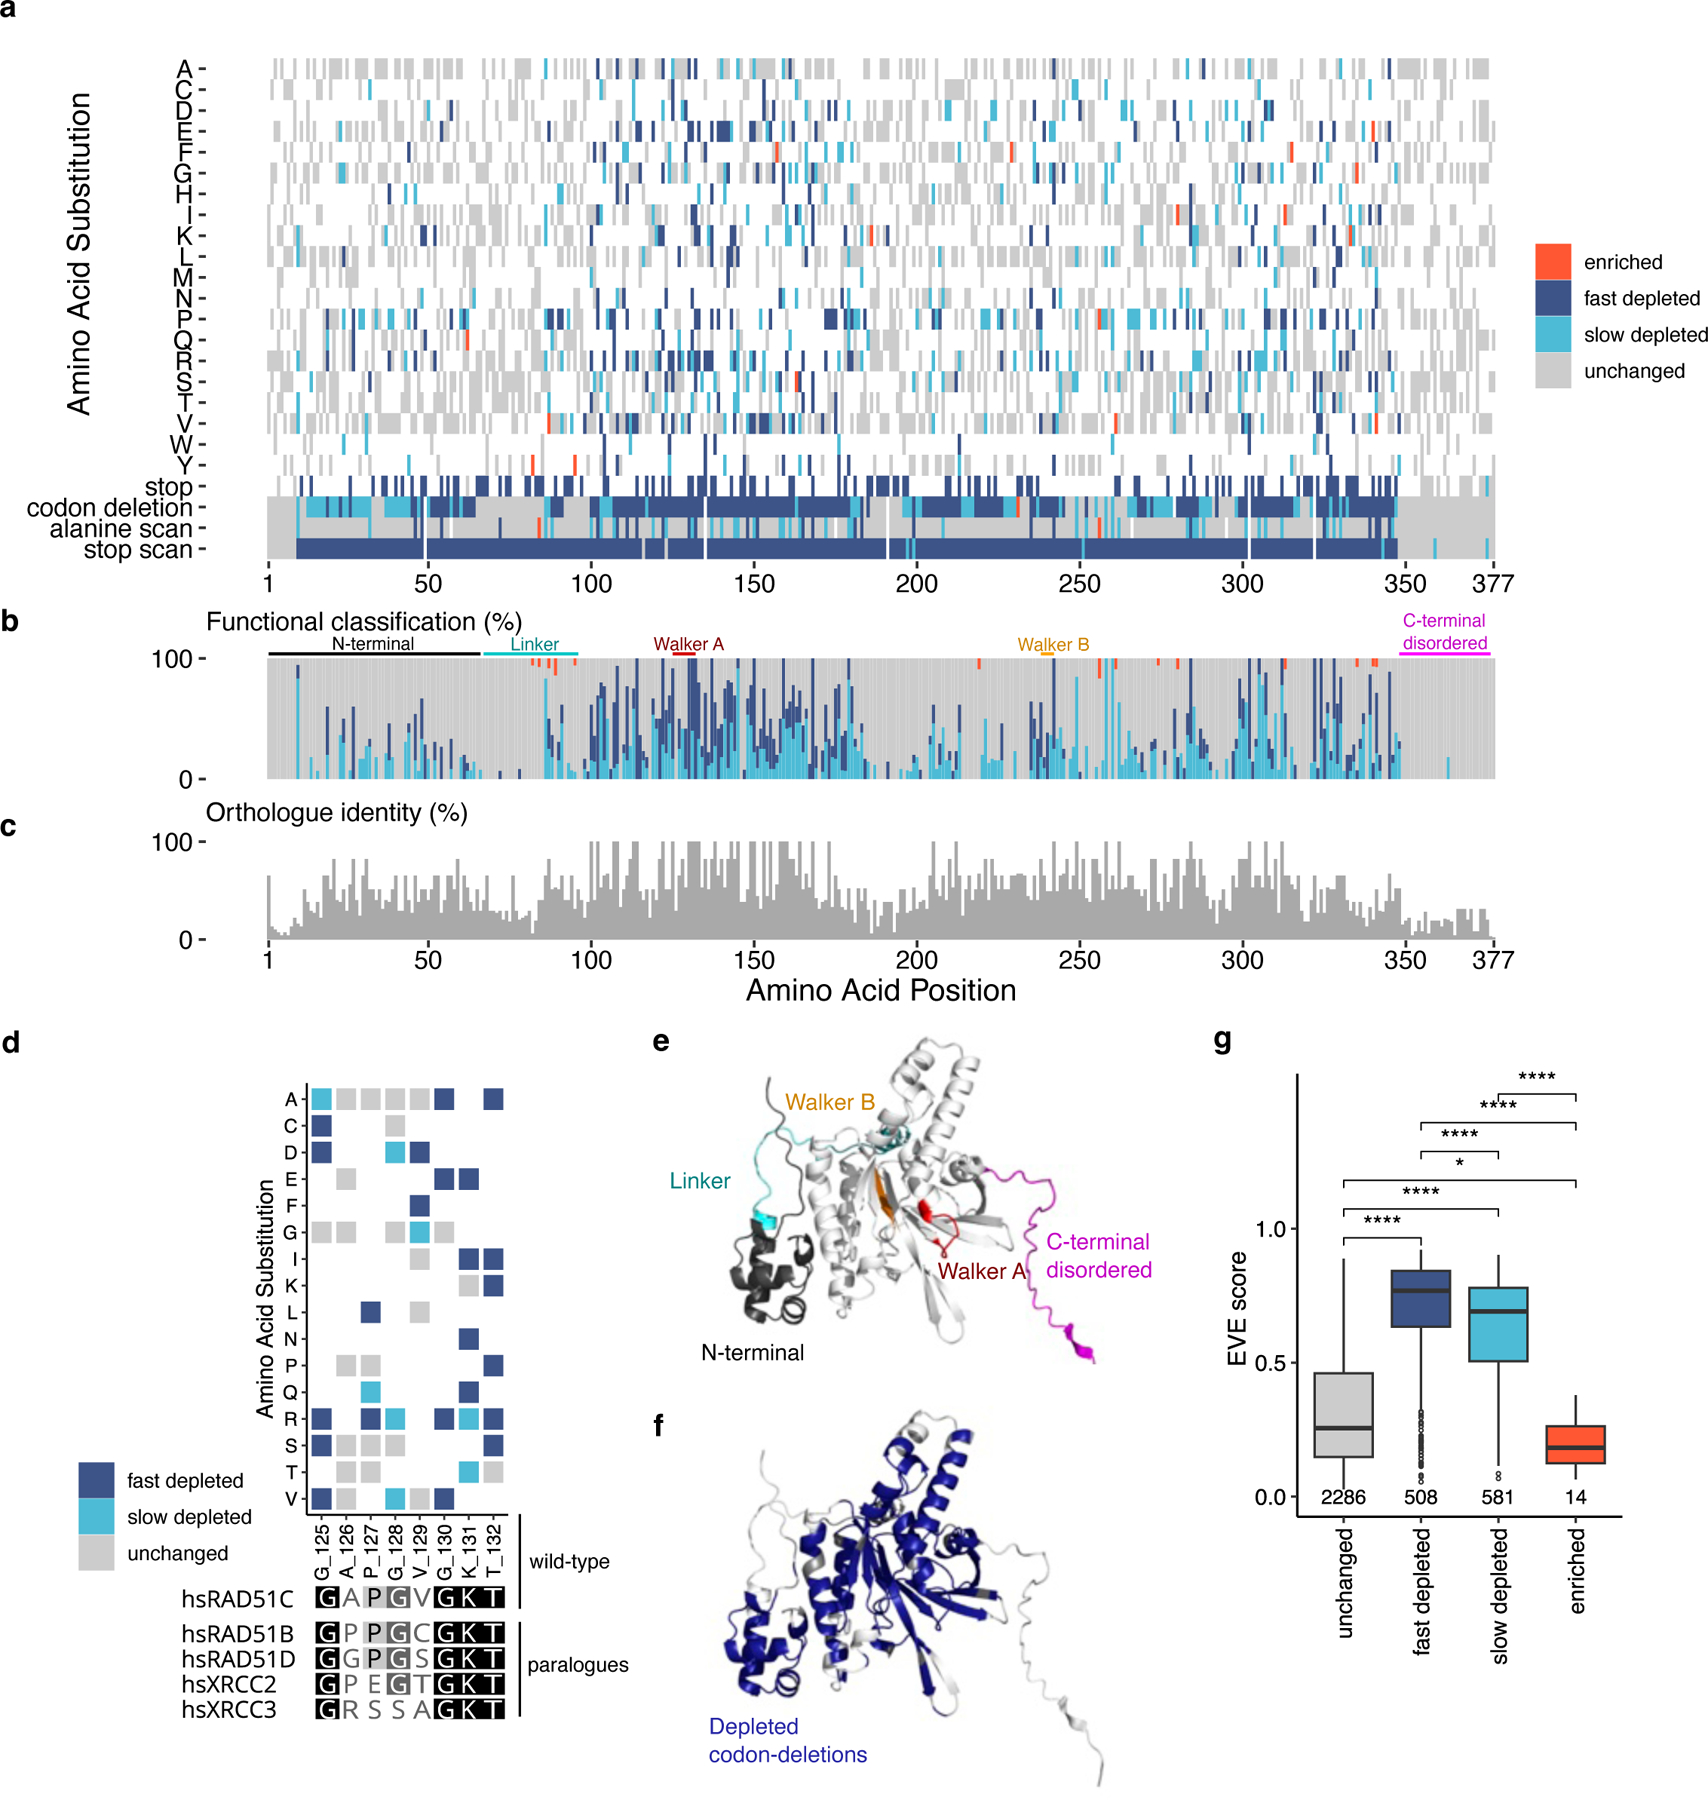
a) Protein-level heatmap of functional classification for 3,756 variants shows distinct areas are more intolerant to variation, it is noteworthy that codon deletions delineate such regions, missense changes produced through SNVs alone (n=2,493) are shown (the few variants with differing classifications between redundant alleles were excluded, n=25). b) Distinct regions with a have a greater number of fast/slow depletion classifications, the Walker A motif which is part of the ATPase catalytic core of the protein is within a region of greater mutational intolerance. Stacked bar chart showing composition of functional classifications at each protein position for missense changes only. c) Regions of intolerance seen in ‘a’ and ‘b’ are observed to align with conserved regions between 10 RAD51C orthologues (see Supplementary Fig.4a for global alignment and orthologues aligned). d) Critical residues of the Walker A motif, ‘G-X1-X2-X3-X4-G-K-T’, conserved between paralogues are completely intolerant to change, some variants in the X2-X3-X4 (any change) range are intolerant in HAP1 cells (for Walker B motif see Supplementary Fig.5a). e) Alpha-fold model of RAD51C, highlighting key domains/regions as in ‘b’. f) Alpha-fold model coloured by depleted (both fast and slow) codon deletions, shows that the linker and the C-terminal disordered region of the protein are tolerant to in-frame codon deletions, whereas the ATPase core and alpha-helix interfacing section of the N-terminal domain are intolerant (Supplementary Fig.4d for distinction between fast and slow depleted codons). g) EVE scores were available for 3,389 missense variants out of a total of 4,558 missense nucleotide variants assayed, 224 variants in PPE codons were excluded. A higher EVE score denotes higher conservation across evolution. Functional classifications have significantly different EVE scores (Kruskal-Wallis p<0.0001). Unchanged variants are less conserved than fast depleted variants. Slow depleted variants are less conserved than fast depleted variants. Interestingly, enriched variants are less conserved than unchanged variants, suggesting that they may be more mutable across evolution. (*p<0.05, ****p<0.0001, two-sided Mann-Whitney-Wilcoxon Test). Box shows interquartile range, horizontal line the median EVE score, whiskers show maximum and minimum values that are not outliers, outliers shown as points.
No missense variants are tolerated within key residues of the Walker A motif that have 100% conserved identity between RAD51 paralogues, with only synonymous changes tolerated at G125, G130, K131 and T132 (Fig. 3d). This is consistent with the known Walker A motif pattern: ‘G-X1-X2-X3-X4-G-K-T, in which ‘X’ denotes any amino acid. Interestingly, 9/18 missense changes are not tolerated at X2,3,4 positions, highlighting potential destabilizing and/or allosteric effects of some residue sidechains in the RAD51C Walker A motif (Fig. 3d).
Stop codon scanning reveals that depletion occurs at 333/372 non-split codons. There are 377 codons in total in RAD51C, 5 are split between exons, which precludes SGE editing of the complete triplet code in unison. As above, codons 1:9 are tolerant to all variation, including stop codon scanning (Supplementary Fig. 4a-c). In addition, 27/34 of codons in exon 9 (ignoring wild-type stop, at codon 35) are tolerant to stop-gained mutations, from D348 until the end of the protein at L376 (except T359 and E375, which are slow depleting variants). This suggests an escape of NMD and/or that the C-terminal region of the protein is dispensable in HAP1 cells (Fig. 3a and Supplementary Fig. 3). D348 is the most terminal residue showing a high degree of conservation among RAD51C orthologues, so it is perhaps not surprising that protein truncations 3’ of this region do not compromise function.
As has been previously reported9, the functional classification of SGE-based in-frame codon deletions delineates known domains accurately; RAD51C codons 1:9, linker and C-terminal disordered regions are classified as unchanged, and the N-terminal domain, and the ATPase catalytic core around the Walker A and Walker B motifs, are classified as depleted in our data (Fig. 3e and f). Interestingly, few slow depleting in-frame codon deletions are observed in the ATPase core (where most are fast depleting), with a higher instance in the 5’ region of the N-terminal domain and regions distal to the ATPase core, suggesting in-frame codon deletions result in a relatively limited effect on structural integrity in these regions (Supplementary Fig. 4c-d). Furthermore, low z-scores for in-frame codon deletions are correlated with regions of missense intolerance and conservation (Fig. 3a and c).
We observed a higher fraction of fast depleted missense variants in exon 2 and 3 compared with other exons (p<2.2e-16, Chi-Squared test of exon against frequency of fast depleted variants, with positive residuals for exons 2 and 3, negative residuals for all other exons). This is particularly evident within key residues of a highly conserved region of exon 2 surrounding the Walker A motif (Fig. 3b and d). To investigate the relative conservation of fast and slow depleted variants throughout the course of evolution we compared missense variants in each functional classification, across all 9 exons, with Evolutionary model of Variant Effect (EVE)33 scores, which can be used as a measure of conservation (Fig. 3g). We find that fast and slow depleted missense variants have significantly different EVE scores (p<0.0001, two-sided Mann-Whitney-Wilcoxon Test), indicating that fast depleted variant substitutions are observed less over the course of evolution. Interestingly, enriched missense variants have a significantly lower EVE score compared with unchanged variants (p<0.05, two-sided Mann-Whitney-Wilcoxon Test), suggesting that enriched substitutions may be hyper-complementing34 and under positive selection in evolution.
We conclude that as slow depleting variants are predominantly missense (Fig. 2e and f), are less conserved (Fig. 3g) and are associated with moderately compromised HR activity in orthogonal assays (Fig. 2g and Supplementary Fig.5b), that they represent potentially hypomorphic alleles. Furthermore, as the effect size in orthogonal assays is correlated with SGE classification (Fig. 2g and Supplementary Fig.5b), it is likely that the cell-viability phenotype assayed in SGE is a direct readout of HR proficiency. It interesting to observe that we find that SpliceAI values for depleted synonymous and intronic variants are significantly higher than unchanged synonymous and intronic variants, a correlation that is not seen for missense variants (Supplementary Fig.5c). This suggests, as expected, that in aggregate synonymous and intronic variants are more likely to compromise gene function through aberrant splicing than missense variants. Importantly, SGE is sensitive to detect such variants, which is not possible with cDNA-based deep mutational scanning.
SGE data are highly sensitive and specific for clinical variant associations
We next sought to assess the value of SGE data for clinical classification, with particular emphasis on VUS interpretation. Clinical variants reported in ClinVar (as of 7th Nov 2021) were explicitly incorporated into our variant repair libraries, allowing us to observe their behaviour in our screen. Firstly, we observed that the distribution of z-score D4 D14 is bimodal and variants that have been submitted with a ‘Pathogenic/Likely pathogenic’ ClinVar clinical classification have a negative z-score, with known ‘Benign/Likely benign’ variants centred around 0 (Fig. 4a). Variants of uncertain significance have a bimodal distribution of z-scores, consistent with ambiguity in their clinical classification. Variants with a ‘conflicting interpretation’ are mostly centred at 0, with some exhibiting a negative z-score. Next, we used variants ascribed pathogenic or benign ClinVar classifications to build a classifier to test the predictive power of SGE data. From the set of variants in ClinVar with ‘Pathogenic’ and ‘Benign’ clinical classifications we excluded any variants that fell within PPE codons, resulting in 92 ‘pathogenic’ and 271 ‘benign’ variants, which for the purposes of this analysis we used as true positive and true negative datasets, respectively. A list of these variants and a breakdown of their VEP classifications is provided in Supplementary Table 2. We then used the z-score D4 D14 values for these variants to model a Receiver Operating Characteristic (ROC) curve (Fig. 4b). We observe 100% sensitivity, >98% specificity, with an Area Under the Curve (AUC) value of >0.99, indicating a classification error rate close to zero. We thus find that SGE functional classifications offer an opportunity to inform clinical pathogenicity assessment of the impact of alleles in the VUS and conflicting interpretation variant categories. Of note, 28% (180/633) of VUS and 24% (12/50) of conflicting variants are classified as depleted by SGE, indicating that these alleles are likely to compromise RAD51C function (Fig. 4c).
Figure 4: Functional scores are highly accurate and can be used to evaluate clinical classifications:

a) A histogram of functional score, z-score D4 D14, across 75 intervals on the x-axis, coloured by observation status/ClinVar classification. 8,836/9,188 variants assayed are shown (PPE codons removed, n=352), with a magnified section to highlight the relatively smaller contribution of variants observed in ClinVar. ClinVar variants ascribed a Pathogenic/Likely pathogenic classification have a unimodal negative functional score. Benign/Likely benign variants are centred around 0. Uncertain and conflicting ClinVar classifications show a bimodal distribution and spectrum of change, respectively, consistent with ambiguity for variants with these classifications. The z-score D4 D14 threshold calculated in ‘b’ (below which maximum specificity and sensitivity is achieved) is shown by the vertical dashed line. b) A ROC curve calculated using functional scores (z-score D4 D14) in comparison to 92 and 271 variants designated pathogenic or benign, respectively, which for the purposes of this comparison were used as true positive and true negative variants (See Supplementary Table 2). We observe 100% sensitivity, 98.15% specificity, with an Area Under the Curve (AUC) value of 0.9974. The threshold of maximum specificity and sensitivity is achieved at z-score D4 D14 –3.5926 (red point). c) Functional classification proportions for 1,099/1,143 variants observed in ClinVar (PPE variants n=44 removed) with clinical classifications and assayed by SGE. Most variants classified as Pathogenic/Likely pathogenic are depleted and most Benign/Likely benign are classed as unchanged by SGE. Conflicting interpretation and Uncertain significance classifications have similar proportions of unchanged and depleted classifications. d) Variants seen in ClinVar only have proportionally more depleted variants than variants seen in gnomAD only. 8,836/9,188 variants shown (PPE variants removed n=352). e) Associations between variant subsets (masks) and UKBB cancer diagnoses in all cancers combined and in female hormone sensitive cancers. Fast depleted non-synonymous variants (missense and PTVs fast depleted in SGE, grey) are significantly associated with a cancer diagnosis in both phenotypic classes. All fast depleted variants (purple), regardless of mutational consequence are significantly associated with female, hormone sensitive cancers.
It should be noted that both slow and fast depletion variants have a significantly negative z-score D4 D14, so both classifications may provide evidence towards clinical pathogenicity. However, for slow depleted variants the correlation with clinical data is much weaker and thus this readout may reflect more intermediate clinical effects (or for some variants an indeterminate assay readout). Accordingly, until more quantitative and nuanced mechanisms are available for clinical classification of variants of reduced penetrance, for clinical purposes, slow depletion can be viewed as an intermediate readout not providing evidence towards either pathogenicity or benignity. Enriched variants do not compromise the function of RAD51C through a loss-of-function (LoF) mechanism and are therefore unlikely to be pathogenic. Interestingly, one variant defined as ‘Pathogenic/Likely pathogenic’ in ClinVar is unchanged, this variant is a frameshift (c.28del) allele at protein position 9, upstream of M10, the likely start codon in ENST00000337432.9, as outlined above. Six out of 274 ‘Benign/Likely benign’ variants are classified as fast/slow depleted, four are synonymous variants and two are intronic. Three out of four synonymous variants are in the first codon of exon 8 (protein position 323), suggestive of aberrant splicing, with the other synonymous variant in exon 3 (protein position 153) possibly propagating a cryptic splicing event, although this variant (c.459T>G) is not predicted to be disruptive by SpliceAI35 (Acceptor loss/gain Δ=0.02/0, Donor loss/gain Δ=0.03/0). As expected, more depleting functional classifications are observed in ClinVar (as of 15th Jan 2022), compared to gnomAD (V3) repositories, with the latter containing variants from population-ascertained individuals most of whom have not had a cancer diagnosis (Fig. 4d).
Clinical classification of variants using ACMG-AMP framework
The method used above suggests high sensitivity and accuracy for our data for clinical associations. We combined the 201536 ACMG-AMP framework guidelines and the statistical framework for assay validation described by Brnich et al.37 in order to evaluate applicable strength for codes PS3 (towards pathogenicity) and BS3 (towards benignity). We sought to consider validation of missense variants, which comprise the majority of VUSs on account of being the variant type most typically lacking sufficient data to enable classification as pathogenic or benign. As detailed in full in the Methods, we built pathogenicity “truthsets” firstly comprising missense variants classified as (likely) pathogenic in ClinVar: there were too few of these for clinical validation of the assay, so we therefore also incorporated stop-gained variants. Our benignity “truthset” comprised missense variants only. Against the 2015 framework the predictive likelihood ratios towards pathogenicity and benignity were, respectively, 25 and 32, equating to ‘strong’ evidence for PS3 and BS3 (Table 1). Of note, we only evaluated the extent to which observation of fast depletion predicted pathogenicity, therefore ascribing as indeterminate/intermediate the small number of truthset variants exhibiting slow depletion. The slow-depleting variants may, in fact, represent pathogenic variants of reduced penetrance, but orthogonally validated truthsets for such variants are lacking.
Table 1. Quantitation of evidence for clinical variant classification of missense variants using ACMG-AMP framework.
Assay performance was assessed for the relative number of observed fast-depleting (FD) and unchanged/enriched (U/E) variants against truthsets of variants classified as pathogenic or benign, using the methodology described by Brnich et al. Four approaches to truthset assembly were considered: (i) previously classified ClinVar variants of ≥2* rating; (ii) previously classified ClinVar variants of ≥1* rating; (iii) nonsense variants as pathogenic and missense variants assigned as benign using systematic classifications based on current ACMG-AMP requirements (two evidence items towards benignity unless BA1 is met); and (iv) nonsense variants as pathogenic and missense variants assigned as benign using systematic classifications based on proposed new ACMG-AMP requirements which are more permissive (only one evidence item towards benignity required).
| Cohort | #Path. | #Ben. | Assay readout (Pathogenics) |
Assay readout (Benigns) |
LRPath | PS3 | LRBen | BS3 | ||||
|---|---|---|---|---|---|---|---|---|---|---|---|---|
| FD | SD | U/E | FD | SD | U/E | |||||||
| (i) ClinVar 2* | 5 | 2 | 3 | 2 | 0 | 0 | 0 | 2 | 1.2 | nil | 5 | BS3_sup |
|
| ||||||||||||
| (ii) ClinVar 1* | 8 | 3 | 6 | 2 | 0 | 0 | 0 | 3 | 2.25 | PS3_sup | 8 | BS3_mod |
|
| ||||||||||||
| (iii) ACMG (current) | 135 | 26 | 131 | 1 | 3 | 0 | 1 | 25 | 25.23 | PS3 | 32.45 | BS3 |
|
| ||||||||||||
| (iv) ACMG (permissive) | 135 | 1509 | 131 | 1 | 3 | 43 | 86 | 1380 | 33.28 | PS3 | 30.86 | BS3 |
Of the 633 VUS in ClinVar (as of 15th Jan 2022, PPE variant codons excluded, n=38), 446/633 exhibited an assay result for which ‘strong’ evidence of benignity (BS3 as calculated above) might be awarded and enable a final classification of (likely) benign. 103/633 exhibited fast depletion, for which ‘strong’ evidence of pathogenicity (PS3 as calculated above) might be awarded and thus contribute to a final classification of (likely) pathogenic (Fig. 4c). Thirty-eight of 50 conflicting interpretations had a conflict between benign and VUS classifications: of these 35 exhibited functional/normal assay results (BS3, strong evidence towards a benignity classification). Twelve of 50 had conflicts between pathogenic and VUS classifications: of these 8 exhibited fast depletion (PS3, strong evidence towards a pathogenicity classification).
Analysis of UK Biobank data and an ovarian cancer case-control cohort using SGE functional classifications
We next performed association tests with UK Biobank (UKBB) data using a case-control method previously described9. Whole-exome sequencing (WES) data from 421,064 individuals was used to identify RAD51C SGE variants38. In total, 55 SGE-fast depleted, 39 SGE-slow depleted, 5 SGE-enriched and 379 SGE-unchanged variants with 440, 552, 233 and 30,248 carriers respectively, were identified. We focused on fast/slow depleted variants only. We grouped variants into several variant masks (defined as a set of variants grouped by variables such as mutation consequence and depletion class), and stratified data across phenotypic cancer classes to investigate specific associating pairs of variant and phenotype (Fig. 4e). We find that SGE ‘fast depleted non-synonymous variants’ (missense and high-confidence protein truncating variants (HC-PTVs)) are significantly associated with a cancer diagnosis, across all cancer types combined in females (p=0.00767). This is also true of ‘fast depleted non-synonymous variants’ in hormone sensitive cancers in females (p=0.00279). In addition, all variants classified as fast depleted are significantly associated (p=0.0199) with this type of cancer phenotype (Fig. 4e). Of note, the variant mask ‘missense CADD>25 + HC PTVs’ is a class of variants analogous to ‘fast depleted non-synonymous variants’, with the former created without consideration of SGE data. We find that the latter SGE-based mask is significantly associated with a cancer diagnosis suggesting enhanced sensitivity of SGE compared with CADD classifications (Supplementary Table 3). To further explore our RAD51C SGE classifications we pooled data across cohorts containing 20,519 controls and 8,166 ovarian cancer cases (see Methods). We observed a strong association between depleted SGE loss-of-function variants (stop-gained and frameshift) and risk of epithelial ovarian cancer (Odds Ratio (OR)=8.15, 95% Confidence Interval (CI)=3.95 – 16.82, p=1.4 x 10⁻⁸) with a slightly bigger effect for the high-grade serous histotype (OR=9.55, 95% CI=4.38 – 20.8, p=1.4 x 10⁻⁸). As expected, there was little evidence of association for carriers of unchanged missense variants (OR=1.1, 95% CI=0.72 – 1.68, p=0.66). Notably, depleted missense variants were associated with a moderately increased risk (OR=2.08, 95% CI=1.08 – 4.02, p=0.029). The OR was slightly greater for high-grade serous disease (2.13 vs 2.08). These findings were consistent across the datasets; dataset specific associations are given in Supplementary Table 4. Importantly, these associations demonstrate that SGE classification of RAD51C missense variants–which are predominantly VUS–is sensitive and specific, at least for ovarian cancer.
RAD51C VUS in cancer-segregating kindred
Five exemplar pedigrees carrying RAD51C VUS (four missense variants and one splice donor variant) were obtained through the Inherited Cancer Registry (ICARE). Two of these variants, c.145+2_145+3insTT in intron 1 and c.835G>C (p.A279P) in exon 5, deplete significantly in our screen. The variant c.145+2_145+3insTT was found in a 62-year-old female with a recent diagnosis of triple negative breast cancer (TNBC) (prior site specific BRCA2 testing for all known familial BRCA2 variants was negative) (Fig. 5a) and is classified as a fast-depleted variant (Fig. 5b). p.A279P was found in a 44-year-old female with a diagnosis TNBC at age 43 (Fig. 5c) and is also classified as a fast depleted variant (Fig. 5d). SGE analysis showed that the remaining missense variants, c.784T>G (p.L262V) in exon 5, c.252G>T (p.K84N) in exon 2 and c.922G>T (p.A308S) in exon 7, were classified as unchanged, and are therefore unlikely to be disruptive (Supplementary Fig.6). These VUS were found in carrier individuals without a cancer diagnosis: a 44-year-old female (Supplementary Fig.6a and b) and in two males, a 76-year-old (Supplementary Fig.6c and d) and 57-year-old (Supplementary Fig.6e and f), respectively. Thus, SGE data can be used, along with the ACMG guidelines, to understand variant function and by extension to aid clinical decision making.
Figure 5: SGE functional classification resolves cancer kindred:

a) Pedigree showing the segregation of disease over multiple generations in a family of French Huguenot/Scottish and German descent. The proband (arrow, variant in red text), presented with breast cancer at age 62 and was found to have an intronic VUS, c.145+2_145+3insTT. Of note, individuals within this pedigree also carry a pathogenic BRCA2 allele (BRCA2+) that segregates independently. “+” and “-” indicate the results of genotyping of this pathogenic BRCA2 allele. b) c.145+2_145+3insTT significantly depletes between D4 and D14 and is classed as a fast depleted variant. c) Pedigree showing segregation of disease over 2 generations, the proband (arrow, variant in red text), presented with triple negative breast cancer (TNBC) at age 43 and was found to have a missense variant in exon 5 of RAD51C c.835G>C (p.A279P). d) c.835G>C is classified as fast depleted variant by SGE.
Analysis of RAD51C protein structure and variant classification
As above our deep SGE analysis provides unprecedented insight into residues that are critical for RAD51C function in the context of RAD51 paralog complexes. These complexes are ssDNA stimulated ATPases that promote homologous recombination by assisting RAD51 recombinase filament formation on ssDNA. We mapped SGE data onto recently reported structures of RAD51C complexes; BCDX2, composed of RAD51B-RAD51C-RAD51D-XRCC2, and CX3, composed of RAD51C-XRCC3 (Supplementary Fig. 7) 31,39–41). An in-depth analysis is shown in Supplementary Figs. 7–11. We find that depleted residues in the SGE analysis fall into several classes: those mapping to interaction surfaces with RAD51 paralogs, ATP or ssDNA, and those important for RAD51C structural integrity. While some variants might be expected to impact RAD51C function based on their structural positions in the RAD51C complexes, inaccurate conclusions can be drawn when predictions are based on structural analyses alone (Supplementary Fig. 12). SGE analysis identified previously uncharacterized, surface-exposed residues critical for function. This suggests that such residues interact with unidentified protein partners, and/or are sites for phosphorylation (Supplementary Fig.11). Interestingly, some enriched variants (K84A and H82Y) are predicted to enhance known interactions (Supplementary Fig.9a), consistent with a hyper-complementing effect and lower EVE scores compared to unchanged variants. Thus, these SGE analyses are expected to lead to further molecular insights into RAD51C activity and regulation.
DISCUSSION
In this study we have applied SGE to functionally classify all possible SNVs and other classes of multivariant alleles in the nine exons of RAD51C to predict variant pathogenicity and aid precision medicine. We have generated functional scores for 9,188 variants across all 9 coding exons of RAD51C and flanking intronic and UTR sequences. Using clinically observed alleles of known pathogenicity, we found that our SGE functional score provides 100% sensitivity and >98% specificity, with a negligible error rate. This suggests that SGE data for RAD51C could be used to re-evaluate the designation of VUS and variants with conflicting interpretation, and indeed to designate variants yet to be clinically observed, a fraction which comprises >87% of our data (n=8,045 variants).
Comparisons of variant abundance between days 4, 7 and 14 allowed us to classify function within a spectrum of compromising variant effects. As above, we classified 4,558 missense variants: 581 as fast depleted, 683 as slow depleted, 15 as enriched, and 3,279 as unchanged along with other variant types such as nonsense and frameshift alleles. We find that variants with a slow depletion classification are less conserved through evolution than more compromising fast depleted variants. The slow depleted variant fraction is mostly composed of missense variants, which suggests that this subset of variants exert deleterious effects through a hypomorphic process; reducing the function of the protein and possibly resulting in DNA damage being accrued over time, ultimately resulting in a genotoxic effect. It is notable that a slow depleted variant, p.R258H, is the only reported RAD51C variant associated with Fanconi Anaemia15. This variant is partially functional in cellular analyses31 and predicted to be hypomorphic. Consistent with this, p.R258H is homozygous in FA patients suggesting the allele retains some functionality since RAD51C is essential for survival.
Functional characterization of select RAD51C variants has previously been performed with the focus being missense variants, which represent the largest proportion of VUS, and where the major clinical challenge remains (Supplementary Table 5)17,31,32,42–45. An initial report from Meindl et al.17 examined 10 RAD51C germline missense variants found in German hereditary BC and BC/OC families. Since then, a number of other studies have been performed, including a large study that characterized 56 missense variants from various sources31. These studies typically assay HR or correlates of HR, including sensitivity to chemotherapeutics such as crosslinking agents and PARP inhibitors, and provide a baseline with which to compare our SGE results. Of note, Prakash et al.31 examined cell rescue in an assay that provides a close correlate to the endpoint used in our SGE analysis. More recently a heroic study by Chunling Hu et al.32 analysed 173 variants, representing around 15% of all VUS in RAD51C. Of these, 9 variants fall within PPE codons in our study, leaving 164 variants which we can compare directly based on nucleotide-level change. All (29/29) overlapping variants defined in Hu et al. as deleterious (Del) using a HR assay were defined by SGE to be depleted. Of these, 26 were fast depleted and 3 slow depleted. All 6 variants defined as intermediate in Hu et al. 32, were found to be slow depleted in our study, suggesting these may represent hypomorphic alleles. Of the remaining 129 variants that were defined by Hu et al. as neutral, 110 were defined by SGE as being unchanged, and thus both assays define these as not disruptive/benign. Collectively, this analysis reveals a concordance of 85%. Of note of the 19 variants that didn’t concur, all were defined by SGE as being depleted, with 8 being fast depleted. Since our SGE study was saturating for all nucleotide changes we were able to ask if different nucleotide changes that generated the same amino acid change were concordant, to orthogonally validate our variant scores/assignment. In this way, 16/19 variants classed as unchanged by Hu et al. that were classed as depleted in SGE, were concordantly classed as depleted in SGE when an alternative nucleotide variant for the same missense change was examined. For c.71G>T, c.331C>T and c.440G>A, classed as depleted by SGE and unchanged by Hu et al., alternative nucleotide variants in SGE were discordantly classified as unchanged. It is noteworthy that c.71G>T, c.331C>T and c.440G>A have z-score D4 D14 values of: −3.06, −3.07, −3.34, respectively, these are just above the z-score threshold of maximum sensitivity and specificity calculated by ROC analysis which is −3.5926. This suggests these measurements are at the threshold of assay sensitivity and should be interpreted with caution. We have added a column to the final dataset (Supplementary Table 6 & 7) that flags such depleted variants; 95.2% of depleted classifications are below this threshold (2,945 out of 3,094 total fast/slow depleted). In addition, to avoid possible positional effects at PPE codons in analyses we removed 352/9,188 variants that occur in the same codon as a PPE variant (where stated). However, as positional effects were found to be minimal in most cases, data for such variants (which are flagged in the final dataset) can still be considered but should be interpreted with caution. It therefore follows, that careful appraisal of variant functional scores, with consideration of degree of depletion, when used alongside the ACMG guidelines36, can greatly inform clinical decision making.
In this study we have exhaustively interrogated the RAD51C locus through SGE. We envisage that the 9,188 variant functional scores and classifications we have generated will aid interpretation and clinical management of patient/families and inform evolutionary and structural studies into RAD51C protein-complex interactions. Of note, it would be interesting to investigate the relative functionality of conserved residues between paralogues, through the production of further SGE datasets, for example of RAD51D. This would likely give insight into functional redundancy with nucleotide-level resolution and would also inform on the accuracy of imputation for conserved residues as a means to obviate experimentation for highly conserved sequences. Furthermore, the production of functional maps containing missense variants generated through multiple, alternative codons allows for possible separation of nucleotide/protein-level functional aberrations, which when coupled with RNA sampling and analysis, may be able to expand our understanding of the functional effects of missense variants and other variants at scale, a key challenge in genetic research.
STAR★METHODS
RESOURCES AVAILABILITY
Lead contact
Further information and requests for resources and reagents should be directed to and will be fulfilled by the lead contact, David J Adams (da1@sanger.ac.uk) or Andrew J. Waters (aw28@sanger.ac.uk).
Material availability
Please contact corresponding authors for reagents.
Data and code availability
Analysis code, functional scores and classification data is available here: https://github.com/team113sanger/RAD51C_SGE
FASTQ files generated in this study for HDR plasmid libraries and edited genomic DNA libraries will be made available through a European Nucleotide Archive (ENA) accession.
Raw counts generated through the QUANTS pipeline, and VaLiAnT and VEP annotation files, will be made available through a BioStudies accession.
Mapped counts, experimental and bioinformatics methods will be made accessible through a MaveDB accession.
EXPERIMENTAL MODEL AND SUBJECT DETAILS
Cell lines
HAP1-A5 cells were used in this study. These cells contain a 10bp loss-of-function deletion in the DNA Ligase 4 (LIG4) gene and contain a Cas9 integration produced through transduction with ‘pKLV2-EF1aBsdCas9-W’ (Addgene, 67978), which confers blasticidin resistance. Cells were sorted for 1n ploidy and confirmed through Karyotype analysis.
METHOD DETAILS
Evaluation of RAD51C essentiality in HAP1-A5 cells
RAD51C has previously been shown to be essential in the HAP1 cell line25,26. Additionally, we demonstrated RAD51C essentiality in HAP1 cells through a CRISPR/Cas9 screen. For sgRNAs targeting RAD51C, the largest change in depletion generally occurs between day 7 and day 14, therefore our SGE screen was limited to 14 days (Fig. 1b). Due to position or ability to change the PAM/protospacer codons to contain a synonymous change, some but not all sgRNAs assayed were appropriate for use in SGE experiments. All sgRNAs used in the SGE screen are detailed in Supplementary Table 8.
sgRNA cloning
Complementary sgRNA oligos were synthesised (Sigma-Aldrich) for each target region (for exon 2, one sgRNA targets both 2.1 and 2.2 target regions). Oligos were phosphorylated and annealed in a reaction with 1 μl of oligo 1 (100 μM), 1 μl of oligo 2 (100 μM), 1 μL of 10x T4 Ligation Buffer (NEB), 0.5 μl of T4 PNK (NEB) and 6.5 μl of water at 37°C for 30 min, then 95°C for 5 min and finally ramped down to 25°C at 5°C/min. Annealed oligos were then ligated into a BbsI-digested pMin9 vector. Ligation reactions were performed with 1.6 μl of BbsI-digested plasmid (50ng/ μl), 1 μl of phosphorylated and annealed oligo duplex (1:200 dilution with water), 5 μl of 2X Quick Ligation Buffer, 0.8 μl of Quick Ligase (NEB) and 2.4 μl of water. The reaction was incubated at room temperature for 30 min and the ligated products were diluted 1:4 (2 μl ligation + 8 μl water). Commercial E. coli One Shot TOP10 Chemically Competent cells (Thermo Fisher Scientific) were subsequently transformed: 1 μl of diluted ligation was added to 25 μl of cells. Cells were incubated for 30 mins on ice, heat shocked for 30 seconds at 42°C and incubated again on ice for 2 min; after which, 125 μl of SOC media was added and cells were left for 45 min at 37°C in the shaking incubator. Pre-warmed ampicillin plates were inoculated with 100 μl of reaction and left at 37°C overnight. The next day three colonies were picked and resuspended in 5 mL of LB media with ampicillin at 100ug/ml in three tubes, respectively; tubes were incubated at 37°C in shaking incubator for 14–16 hours. For each tube, 500 μl of bacteria culture was mixed with 500 μl of glycerol and stored at −80°C. sgRNA plasmids were purified using the QIAprep Spin Miniprep Kit (Qiagen) and subsequently confirmed as correct by Sanger sequencing (Eurofins). After sequencing, clones were re-cultured using 5 μl of glycerol stock, 125 mL of LB media and 125 μl of ampicillin (100 μg/mL final concentration). Conical flasks were incubated at 37°C in a shaking incubator for 14–16 hours and sgRNA plasmids were purified using the QIAGEN Plasmid Plus Maxi Kit.
SGE library design and amplification of variant pools
SGE is performed by the introduction of all possible SNVs into the gene of interest, one target region at a time. A target region generally consists of an exon coding sequence and a flanking intronic/UTR sequence. Currently, given that up to 300 nucleotides can be synthesised at once, three out of nine exons of RAD51C (exons 2, 3 and 5) needed to be divided into two partially overlapping target regions, meaning that SGE of RAD51C was performed using 12 target regions. For each target region, a variant library was designed and generated in silico with VaLiAnT27. Both libraries only differ in the sgRNA, the protospacer adjacent motif (PAM), and protospacer protection edits design. One sgRNA per target region was selected based on the CRISPR/Cas9 screen (outlined above) and by the gRNA cutting position (since some of the guides had fewer off targets). To improve HDR efficiency, silent protospacer site protection mutations were incorporated into each target region sequence to prevent the Cas9 enzyme from recutting the incorporated oligo. SNVs, inframe deletions, an alanine and stop-codon scan, 1 base-pair deletions and tandem deletions in exon flanking intronic/UTR sequence were introduced into the library. Additionally, RAD51C variants observed in ClinVar24 (downloaded 7th Nov 2021) and gnomAD28 (V3) databases, as well as those identified in a study by Yang et al.19 to estimate age-specific risks for BC and OC in carriers of pathogenic variants in RAD51C and RAD51D, were incorporated. Outputs were composed of nucleotide sequences of ~245–300 bp in length for each target region and library sizes were around 1000 variants. Each target region was appended with universal adapter sequences (Illumina P5 and P7), to amplify the entire synthesised target region pool. From this library pool, amplification of the target region library is possible due the incorporation of adapter sequences at each end of the target region. Library oligo pools were synthesized by Twist Bioscience and resuspended in TE buffer at 10 ng/μl and amplified with P5 and P7 primers (Sigma-Aldrich). Amplified oligo pools were then digested with the ExoI (Thermofisher) enzyme to remove primers and ssDNA from the Twist library to reduce cloning artefacts; this was performed in a 60 μL reaction: 50 μl of PCR product, 5 μl of ExoI and 5 μl of ExoI buffer at 37°C for 20 min and then 80°C for 20 min. The PCR products were then purified using the MinElute PCR Purification Kit (Qiagen). The 12 RAD51C SGE library target regions were amplified and subsequently purified using the MinElute PCR Purification Kit (Qiagen). All PCR conditions are detailed in Supplementary Table 8.
RAD51C WT HDR plasmids
A RAD51C WT HDR plasmid contains the unedited target region and flanking genomic sequence within a plasmid backbone. To generate the homology backbone, pMin was amplified via PCR using 1 μl of plasmid diluted 1:1000, 0.75 μl of F and R primers (Sigma-Aldrich, Supplementary Table 8), 12.5 μl of KAPA and 10 μl of water. PCR conditions are detailed in Supplementary Table 8. Post-PCR, pMin was digested with DpnI restriction enzyme (New England BioLabs) to remove bacterial plasmid template. The reaction used 1 μl of DpnI and 5 μl of cut-smart buffer; it was incubated for 1 hour at 37°C in a PCR machine and subsequently heat inactivated for 20 mins at 80°C. The product was then run in a 1% agarose-TAE gel, the corresponding band was extracted and subsequently purified using QIAquick Gel Extraction Kit (Qiagen). RAD51C homology arms were amplified from HAP1 genomic DNA using exon-specific primers (Sigma-Aldrich, Supplementary Table 8). Exons 3 and 8 were amplified extracting first a larger genomic section and then using the target region-specific primers. For exons 2, 5 and 7, two sets of primers were used, with adapters and without adapters. Exons 1, 4 and 9 were amplified using one set of primers. PCR conditions for each exon are detailed in Supplementary Table 8. The products were run in a 1% agarose-TAE gel, with the correct band excised and subsequently purified with QIAquick Gel Extraction Kit (Qiagen). Next, RAD51C homology arms were ligated with the homology backbone via Gibson assembly, using the NEBuilder HiFi DNA Assembly Master Mix (New England, BioLabs). This reaction included 50 ng of digested backbone, 50ng of gDNA amplicon and water up to 10 μl. Following this, 10 μl of NEBuilder HiFi DNA Assembly Master Mix (New England, BioLabs) was added and the reaction was incubated for 1 hour at 50°C in a PCR machine. Next, 5 μl of the reaction was diluted in 15 μl of water (1:4 dilution). A vial of 50 μl of E. coli One Shot TOP10 Chemically Competent cells (Thermo Fisher Scientific) was thawed on ice and 2 μl of diluted Gibson reaction added. Cells were incubated for 30 mins on ice, heat shocked for 30 seconds at 42°C in a water bath and incubated again on ice for 2 min; after that, 950 μl of SOC media was added and cells were left for 40 min at 37°C in a shaking incubator. Pre-warmed ampicillin plates were spread with 100 μl and left at 37°C overnight. The next day five colonies were inoculated into separate test tubes containing 5 mL of LB media with ampicillin (100 μg/mL); tubes were incubated at 37°C in a shaking incubator for 14–16 hours. For each tube, 500 μl of bacteria culture was mixed with 500 μl of glycerol and stored at −80°C. Homology arm plasmids were isolated from the remaining culture using the QIAprep Spin Miniprep Kit (Qiagen) and Sanger sequencing was performed to confirm insert (Eurofins).
Library cloning
Inverse PCR was performed to linearize homology arm plasmids using target region-specific primers (Sigma-Aldrich, Supplementary Table 8). The reaction used 10 pg of wild-type HDR plasmids as template, 1.5 μl of both 5’ and 3’ primers, 25 μl of KAPA and 21 μl of water. Each target region required different PCR conditions which are detailed in Supplementary Table 8. Following this, plasmids were DpnI digested to limit undesired carry-over of wild-type HDR plasmid template (same conditions as previously described), run on a 1% agarose-TAE gel, excised and purified using QIAquick Gel Extraction Kit (Qiagen). Linearized homology arms were subsequently ligated with variant oligos via Gibson assembly (same conditions as previously described) to form 12 plasmid libraries containing variants and extended homology arms. Ligation reactions (containing multiple products each with a different variant present in the target region) were purified using the MinElute PCR Purification Kit (Qiagen) and then cloned en masse into Lucigen Endura™ electrocompetent cells via electroporation following manufacturer’s protocol48. Transformed cells were grown in LB media with ampicillin (100 μg/mL) for 14–16 hours, glycerol stocks were made (as previously described) and plasmids were purified using the Plasmid Plus Maxi Kit (Qiagen). Nanodrop absorbance at 230 nm and 280 nm was evaluated to ensure high purity.
Sequencing plasmid libraries preparation
Plasmid libraries were then processed to add Illumina primary adapters and dual indexes for sequencing on Illumina platforms. Each of the 12 target region HDR repair libraries were expanded to give 3 technical replicates, resulting in 36 samples (PCR conditions are detailed in Supplementary Table 8). The reaction was then purified using the QIAquick PCR purification Kit (Qiagen) and the DNA was eluted by 30 μl of EB buffer. The purified DNA was then digested in a 30 μl reaction with 1 μl of ExoI and 3 μl of ExoI buffer at 37°C for 20 min and then 80°C for 20 min. The digested DNA was purified using the MinElute PCR Purification Kit (Qiagen) and eluted by 12 μl of EB buffer. Following this, an indexing PCR was performed to allow all 36 samples/replicates to be pooled and sequenced together. Two index sequences (eight bases long), i7 and i5, were added to DNA samples. The PCR reaction was performed in a 96 well PCR plate and included 5 μl of the PCR amplicons (5 ng/μl), 1.5 μl of i5, 1.5 μl of i7 and 17 μl of water; conditions are detailed in Supplementary Table 8. After this, Ampure bead purification was performed; 45 μl of Ampure XP resuspended beads (Beckman Coulter) were added to the 50 μl PCR reaction and the samples were incubated for 15 minutes at room temperature. The PCR plate was placed on a magnetic stand for five minutes to separate the beads from the supernatant. Next, 30 μl of the supernatant were removed from the top and the plate was spun at 1000 RPM for 20 sec. The plate was placed again on the magnetic stand and after 5 minutes all the solution was removed. Then, 200 μl of 80% freshly prepared ethanol were added to the plate while in the magnetic stand and after incubation at room temperature for 30 seconds, the supernatant was removed (this step was repeated once for a total of two washes). The plate was spun at 1000 RPM for 20 sec placed again on the magnetic stand to remove traces of ethanol with a long reach p10 pipette tip. The beads were air dried for 2 minutes and then the plate was removed from the magnetic stand. Beads were eluted by adding 33 μl of EB buffer and incubated for 10 minutes at room temperature. The plate was placed on the magnetic stand until the solution was clear and 30 μl were transferred to a new plate. Dilutions 10 ng/μl library in a 15 μl volume with EB buffer were prepared for each library. Next, 8 μl of the diluted library were run in a 2% agarose-TAE gel to check for a single band at ~400 bp. After that, 5 μl of each diluted library was pooled into one tube and sequenced on a HiSeq2500 rapid-run to confirm the presence of SGE target region inserts within the RAD51C homology arms and to assess the library coverage and complexity. Plasmid variant count data is available here: https://github.com/team113sanger/RAD51C_SGE
SGE screens
SGE screens were performed over a 14-day time-course in HAP1-A5 cells. Cells were thawed, passaged and expanded 9 days before transfection. Culture media (noAB media) was composed of Iscove’s Modified Dulbecco’s Medium (IMDM, Thermo Fisher Scientific), with 10% Fetal Bovine Serum (FBS, Thermo Fisher Scientific) and 1% Penicillin-Streptomycin (P/S, Thermo Fisher Scientific) and cells were incubated at 37°C with 5% CO2. Two million cells were seeded three days before transfection (day -3) in T75 flasks (Corning) with 15 mL of noAB media and 10 μg/mL blasticidin in triplicate for each target region. On day 0, media was changed an hour before transfection (noAB media) and a 750 μl transfection complex mix was prepared with 7.5 μg of sgRNA, 15 μg of the corresponding library, and the appropriate volume of Xfect buffer (Takara Bio); then 13.5 μl (0.6 μl per μg of DNA) of Xfect™ Transfection Reagent (Takara Bio) was added and the reaction was incubated at room temperature for 10 minutes. After this time, the transfection complex mix reaction was added dropwise to the T75 flasks. Cells were incubated for 4 hours and media was then aspirated and replaced with 15 mL of fresh noAB media. Selection was performed for 48 hours after transfection (day 1 and 2, respectively). On each day, media was aspirated and replaced with 15 mL of noAB media with 3 μg/mL puromycin (for sgRNA selection) and 10 μg/mL of blasticidin (for continued selection of endogenous Cas9). Untransfected HAP1-A5 cells were used as a negative control for selection. On day 3, media was aspirated and cells were washed twice with 5 mL of Dulbecco’s phosphate buffered saline (DPBS, Thermo Fisher Scientific) PBS, 1.5 mL of TrypLE™ Express (Thermo Fisher Scientific) was added and cells were incubated at 37°C for four minutes. Next, 1.5 mL of noAB media was added to stop the reaction and detached cells were transferred to a 15 mL Falcon tube. Then, ~66% of the cell suspension (4 ml) and 10 mL of blasticidin media were transferred to a T75 flask labelled as D4 (day 4); the remaining 4 mL of cell suspension (~33%) and 35 mL of blasticidin media were transferred to a T175 flask labelled as D7 (day 7) and cells were placed in incubator. On the next day, the first time point (D4) was sampled. The D4 flask was washed with 5 mL of PBS and 1.5 mL of TrypLE™ was added and cells were incubated at 37°C for four minutes. After that, 1.5 mL of media was added and cells were transferred to a 15 mL Falcon tube. The flask was then washed with 5 mL of PBS that was transferred to a Falcon tube (8 mL in total). Subsequently, 6 μl of the cell solution was mixed with 6 μl of Trypan Blue (Thermo Fisher) and 10 μl from that solution was used to count cells in the Invitrogen Countess 3 FL. Cells were then centrifuged at 300g for 3 minutes and calculations were made to determine the PBS volume needed to give a concentration of 5 million cells/ml. Next, 1 mL of cells were aliquoted in 1.5 mL Eppendorf tubes (up to 3 Eppendorfs per sample). Cells were centrifuged at 300g for 3 minutes; PBS was removed, and pellets were stored at −80°C. On D4, media was changed in the D7 flask. On D7 cells were dissociated and sampled as on D4, with the exception that cells were washed with 10 mL of PBS and 3 mL of TrypLE™ was used. 5 million cells from the suspension were seeded into a T175 flask labelled as D11 (day 11) in 35 mL of blasticidin media. On D11, cells were dissociated as before, not sampled and 5 million of cells seeded in a T175 flask labelled as D14. Final timepoint was sampled on day 14, with cells sampled as before. Cell pellets were stored at −80°C.
Sequencing library preparation
A pellet containing 5M sampled cells was thawed for each sample and gDNA was extracted using the DNeasy Blood & Tissue Kit (Qiagen). DNA was eluted in 100 μl of buffer AE. PCR sampling was performed to amplify regions edited through SGE. At least one of the primers (Sigma-Aldrich, Supplementary Table 8) was outside the homology arm region to ensure amplification of the edited region and not residual HDR plasmid. PCR conditions are detailed in Supplementary Table 8. The reaction was then purified using the QIAquick PCR purification Kit (Qiagen) and the DNA was eluted into 40 μl of EB buffer. The purified DNA was then digested in a 100 μl reaction with 5 μl of ExoI and 10 μl of ExoI buffer at 37°C for 20 min and then 80°C for 20 min. The digested DNA was purified using the MinElute PCR Purification Kit (Qiagen) and eluted using 15 μl of EB buffer. DNA concentration was measured using a Nanodrop and dilutions of 10ng/μl were prepared for each sample. PCR was performed for each sample to add Illumina adapters and amplify smaller amplicon from the larger primary amplified pool (PCR conditions are detailed in Supplementary Table 8). The reaction was then purified using the QIAquick PCR purification Kit (Qiagen) and the DNA was eluted using 30 μl of EB buffer. The purified DNA was digested in a 30 μl reaction with 1 μl of ExoI and 3 μl of ExoI buffer at 37°C for 20 min and then heat-inactivated at 80°C for 20 min. The digested DNA was then purified using the MinElute PCR Purification Kit (Qiagen) and eluted using 12 μl of EB buffer. Following this, indexing PCR and Ampure bead purification was performed for each sample (same protocol as with plasmid libraries for both procedures). The DNA concentration was measured using a Nanodrop. Dilutions of 10 ng/μl library in a 15 μl volume with EB buffer were prepared for each amplicon; 8 μl of each dilution were run in a 2% agarose-TAE gel (120 V, 400 mA, 15 minutes) to check for a single band at ~400 bp. After that, 5 μl of each edited amplicon for a particular target region were pooled into one tube; all target region samples were then pooled and sequenced on HiSeq2500 rapid runs and data analysed to calculate the depletion kinetics of the variants within target regions.
HR Proficiency scores
These data were derived from two studies Hu et al.32, and Prakash et al31. The scores from Prakash et al. 31 were used as provided in the paper. For Hu et al.32, the GFP+ cell number percentages of each variant were extracted from the paper. Results for the p.L138F variant construct were scaled to 1 and for the wildtype construct to 5. Based on the GFP+ cell number percentage results for each variant a HR score was calculated between p.L138F(HDR score:1) and WT(HDR score:5). p.L138F is a variant known to be disruptive of RAD51C function and thus represents a positive control.
QUANTIFICATION AND STATISTICAL ANALYSIS
Sequencing data analysis
High throughput sequencing outputs in the form of demultiplexed CRAM files and metadata in the form of SGE oligonucleotide library sequences were taken as inputs to an informatic pipeline (QUANTS, https://github.com/cancerit) developed within the Adams Lab, as previously reported. One of the principal functions of QUANTS is to generate counts for each expected oligonucleotide sequence (i.e., desired edits) detected in sequences sample pools. Library specific counts generated for each indexed timepoint and replicate are combined, together with plasmid library counts into a data frame. Oligos having fewer than 10 counts in total were removed from the data frame. This data frame was merged with metadata produced as an output of VaLiAnT27 at the time of library generation and with VEP29 expanded annotations, to generate comprehensive metadata information for each oligo observed.
Counts were used as inputs to DESeq230, which calculates log2-fold changes (LFC) between timepoints and computes p-values and standard error. DESeq2 is usually used for RNA-Seq data, however SGE data is similar in that differential counts may be compared to gain biological insight.
Each target region was analysed through DESeq2 separately. A data frame of raw counts for each desired edit was created and any variants with less than 10 counts over all time-point replicates removed. A subset of counts for variants not expected to change significantly over time, namely synonymous and intronic variants, were used to create size factors. This is a modification to DESeq2 to allow SGE analysis, as the default size factor calculation (median ratio normalization) is appropriate for RNA-Seq analysis, which assumes most reads do not change between conditions, in SGE we expect much more relative change between timepoints. Therefore, we define variants not expected to change, which allows for the analysis to account for differences more accurately in counts due to sequencing depth/bias.
DESeq2 can be run in discrete mode in which each baseline timepoint (Day 4 for this experiment) for a library is compared to each other timepoint (e.g., LFC of ‘Day 4 vs. Day 7’ and LFC of ‘Day 4 vs. Day 14’). DESeq2 can also be run in continuous mode, in which time is considered a continuous variable, giving one LFC for three timepoints (Day 4, Day 7 and Day 14); this captures both the magnitude and speed of depletion in one metric. Both discrete LFCs and the continuous LFC values were generated for each variant counted. LFCs were adjusted by median scaling to reduce sequencing depth bias between timepoints and replicates. The median LFC for synonymous and intronic variants was calculated for each comparison and then subtracted from each variant LFC.
All LFCs were compiled into one data frame and any variants analysed twice in overlapping regions of tiled target regions, combined to produce a single LFC by an inverse-weighted mean calculation (weighted by standard error, such that the measurement with higher standard error contributed less to the mean value).
To assess variant changes between different target regions–the calculated LFCs of which derive from different negative binomial distributions, as DESeq2 was run separately for each target region–scores must be calculated which account for the deviation from the median for each variant within the target region dataset. In other words, the scores indicate not only the degree of change but also where the value lies in the distribution for each target region. Each variant LFC was converted to a z-score by dividing by the standard error value. z-scores form the basis of global analyses, such as clustering approaches for variant classification.
z-scores were used to calculate p-values for each variant using a two-tailed z-test. To reduce false positive SGE classifications, p-values were subsequently adjusted for the false discovery rate using BH FDR correction across all unique variants. Variants with a FDR<0.01 at D4 vs D14 and a negative z-score was classified as ‘depleted’, and p<0.01 and a positive z-score ‘enriched’. Unchanged variants have FDR≥0.01. Clustering was performed depleted variants. MClust49 software was used to fit a Gaussian mixture model (EEV), with 2 clusters.
Nine thousand, one hundred and eighty-eight (9,188) unique nucleotide variant species were obtained after experimentation and analysis (Supplementary Table 6). Where single base-pair deletions occur in polynucleotide tracts the same variant species is produced with different ‘chrom_pos_ref_alt’ annotations; to facilitate searching by all identifiers we have provided a dataset with expanded annotations (n=12,295 variants, Supplementary Table 7). Importantly these data have been processed as unique events including FDR calculation and functional classification, and re-annotated with the necessary multiple identifiers, meaning the data in this expanded dataset is equally accurate as the completely unique variant dataset.
Both DESeq2, MClust and post-QUANTS processes were run with R version 4.1.3, within R Studio Version 1.4.1106.
Analysis of UK Biobank data
We used the whole-exome sequencing data from 454,787 individuals in UK Biobank to identify the RAD51C variants in UKBB38. The WES data was stored as population-level VCF files that were aligned to GRCh38 and provided via UKBB RAP (Research Access Platform). We performed several QC procedures. Firstly, we used bcftools52 to split the multiallelic sites and left correct and normalise Indels. Then, we filtered out the variants that failed with our QC categories: 1) read depth <7, 2) genotype quality <20, 3) the binomial test p-value for the reads of alternate allele versus the reads of reference allele <=0.001 for heterozygous genotypes. For the Indel genotypes, we only kept the variants with read depth >= 10 and genotype quality >= 20. The variants that didn’t pass the QC categories were set as null. After filtering, for a given variant, if more than 50% of its genotypes were missing, the variant was excluded from our downstream analyses. We applied VEP v10229 to annotate all variants and assigned each variant to a gene based on the primary MANE select v0.9753 transcript with the most severe consequence. We restricted our analyses to primarily European genetic ancestry and excluded the individuals who withdrew consent from the study. Finally, we included 421,064 individuals in our further analysis.
We then identified the variants found in UK Biobank with SGE consequences. In total, we identified 55 SGE-fast depleted, 39 SGE-slow depleted, 5 SGE-enriched and 379 SGE-unchanged variants with 440, 552, 233 and 30,248 carriers respectively. In our analysis, we focused on the phenotypic consequences of depleted variants. We created several rare variant burden test masks. Which includes; ‘all depleted variants’ (all variants classified as depleted), ‘depleted HC PTVs’ (high confidence protein-truncating variants classified as depleted), ‘depleted missense variants’ (missense variants classified as depleted), ‘all fast depleted variants’ (all variants classified as fast depleted), ‘fast depleted missense variants’ (missense variants classified as fast depleted), ‘fast depleted non-synonymous variants’ (missense variants and HC PTVs classified as fast depleted), ‘all slow depleted variants’ (all variants classified as slow depleted) and ‘slow depleted missense variants’ (missense variants classified as slow depleted). To make a comparison to in silico classification, we also created masks without consideration of SGE data, including: ‘HC PTVs’ (variants predicted to be HC PTVs), ‘missense CADD>25 + HC PTVs’ (missense variants with a CADD score >25 and HC PTVs) and ‘missense CADD>25’ (missense variants with a CADD score >25).
For the phenotypes, we mainly focused on the cancers queried from cancer registry data. To evaluate the association between RAD51C variants and overall cancer risk, we generated the following phenotypic variables: all cancer combined, all cancers combined excluding blood cancers, all cancers combined excluding skin cancers, all cancers combined excluding blood and skin cancers and hormone sensitive cancers for females only. We applied the regression models called from ‘statsmodels’ package54 implemented in python v3.7 with family set to ‘binomial’. For all regression models, we included age, age^2, sex, WES sequencing batch, and the first ten genetic principal components described by Bycroft et al.55 (Supplementary Table 3).
All the above-mentioned analyses were performed on UKBB RAP. All codes and scripts can be found from: https://github.com/mrcepid-rap
Analysis of Ovarian cancer cohorts
Our ovarian cancer cohort was composed of 20,519 controls, 8,166 cases, of which 5,286 patients had been histologically diagnosed with high-grade serous OC. These cohorts were assembled from the ovarian cancer association consortium (set A & B), the UK Biobank, 100,000 Genomes Project, in addition to a collection sequenced at the Strangeways Research Laboratory with further details available in Supplementary Table 456–58. All cases were analysed by whole genome or exome sequencing. We carried out variant calling and QC using standard pipelines56. Small indels predicted to cause a frameshift, single nucleotide nonsense variants and single nucleotide variants predicted to affect splicing were classified as loss-of-function variants. Missense variants were classified as depleted or unchanged as described above. Individuals were then classified as non-carriers of each type of variant. Logistic regression stratified by data set was used to evaluate associations between carrier status and ovarian cancer and to estimate the odds ratio and 95% confidence limits.
Quantitation of evidence for clinical variant classification using 2015 ACMG-AMP variant classification framework
For this analysis we required truthsets of pathogenic and benign variants against which to apply the statistical framework for assay validation described by Brnich et al.36,37. Using truthsets comprising only ClinVar-classified pathogenic and benign variants yielded evidence strengths from assay validation of at most PS3_supporting and BS3_moderate respectively for pathogenicity and benignity, illustrating the very limited power for assay validation where there are small numbers of available true positives and negatives, in particular as the statistical correction within the Brnich et al.37 methodology is particularly punitive.
Due to the paucity of RAD51C missense variants with existing classifications in ClinVar, we sought to generate more systematically additional classifications of benignity using methods described below. This approach, based on the 2015 ACMG-AMP framework, enabled generation of a “benignity truthset” of 26 variants. In the forthcoming updates of the ACMG-AMP framework, it has been proposed that a single item of evidence towards benignity of “supporting” strength may be accepted as sufficient for classification of a variant as ‘likely benign’; we therefore also explored using this more permissive threshold, generating a benignity truthset of 1509 variants.
As per recent proposals relating to assay validation for genes for which (i) there is a paucity of ClinVar-classified pathogenic variants (ii) mechanism of action of deleterious missense variants is predicted to be loss-of-function and (iii) there is a case control signal for missense variants as a group exhibiting deleterious assay results, we used as our pathogenicity truthset all stop-gain (nonsense) variants lying 5’ of the terminal RAD51C exon (n = 138), of which 135 were encompassed by our assay59. Using the benignity truthset of 26 variants based on current ACMG-AMP requirement for 2 benignity evidence items (or BA1 standalone), the predictive likelihood ratios towards pathogenicity and benignity were, respectively, 25 and 32, equating to ‘strong’ evidence for PS3 and BS3 (Table 1). Exploring a more permissive approach potentially to be included in the forthcoming updated ACMG-AMP framework, by which we had increased our benignity truthset to 1509 variants, the predictive likelihood ratios towards pathogenicity and benignity were respectively 33 and 31, again equating to ‘strong’ evidence for PS3 and BS3. We only evaluated the extent to which observation of fast depletion predicted pathogenicity, therefore ascribing as indeterminant/intermediate the small number of truthset variants exhibiting slow depletion.
Derivation of maximum tolerated allele frequency (MTAF) for RAD51C
To quantify the threshold for minor allele frequency above which the BA1 and BS1 evidence codes for population frequency could be applied, as per standard approaches by ClinGen Variant Curation Expert Panels (VCEPs), we derived an MTAF for RAD51C using the methods described by Whiffin et al.60. We estimated the lifetime risk of ovarian cancer in women to be 1 in 50 women61,62. We estimated the penetrance for ovarian cancer in carriers of pathogenic variants in RAD51C to be 10%18,19. Based on observed frequency of pathogenic RAD51C variants in unselected ovarian cancer, 11/1915 in largest published unselected series, the genetic heterogeneity was estimated at 0.6%. We used conservative estimates that an individual newly identified allele would account for 100% (BA1), 10% (BS1) or 5% (BS1_supporting) of all pathogenic alleles. These values generated MTAF thresholds of 5.22 x 10⁻⁴, 5.22 x 10⁻⁵ and 2.61 x 10⁻⁵ for application of BA1, BS1 and BS1_supporting, respectively.
Construction of RAD51C benign missense variant truthsets
We constructed benignity truthsets of missense variants based on ACMG-AMP framework population frequency evidence codes BA1 and BS1 (using MTAFs above) and in silico evidence code BP4, using the REVEL missense meta-prediction tool, a widely used tool in clinical diagnostics following multiple between-tool comparisons, applying the thresholds recently published by Pejaver et al. and the ClinGen Sequence Variant Interpretation Working Group for defining strong, moderate and supporting evidence for BP463–66.
We first generated a list of all possible missense variants for the RAD51C transcript NM_058216.1 (ENST00000337432). From this exhaustive set of 2,443 missense variants, we observed that 2,345 were covered by our assay. Counts of these variants in female individuals were extracted from the final July 2022 UK Biobank38 (UKBB) exome data release, and gnomAD28 exomes v2.1.1. Variants were counted if identified in an individual with a single listed ethnicity (in UKB) or an individual in the non-cancer component (in gnomAD).
Variants were annotated with SpliceAI scores, REVEL scores and ClinVar classifications (April 2023). Variants were excluded as “non-benign” where they had evidence of splicing effect (SpliceAI score ≥0.2), deleterious protein effect (REVEL score ≥0.644), signal of case-control association with breast or ovarian cancer in UK Biobank (OR ≥2 with p ≤0.05) or if classified as Pathogenic/Likely pathogenic in ClinVar with ≥1*. This left 2,109 missense variants potentially eligible for classification into our benignity truthsets.
The number of heterozygous and homozygous variant observations across gnomAD and UKB were then tallied and stratified according to participant ethnicity. For each variant and non-founder subpopulation, a maximum tolerated allele count (MTAC) was calculated using the above BA1, BS1 and BS1_supporting MTAFs based on the effective subpopulation size, which equalled the number of individuals in whom the variant position was covered by >10 sequencing reads). The returned MTAC equalled the 95% upper confidence interval limit of a Poisson distribution of sample size k, where k = effective subpopulation size, and expected rate of occurrences l, where l = the pre-defined RAD51C MTAF. If the number of observations of the variant exceeded the corresponding MTAC (and was >1) in any subpopulation, the variant was flagged as passing BA1/BS1/BS1_supporting, as appropriate.
For inclusion in the “current” ACMG benignity truthset (n = 26), (i) allele count must exceed BA1 MTAC in one or more non-founder subpopulations, OR (ii) allele count must exceed BS1_supporting MTAC in one or more non-founder subpopulations AND REVEL score must lie below the threshold for BP5_supporting (≤0.290). For inclusion in the benignity truthset based on the more “permissive” forthcoming ACMG-AMP thresholds (n = 1509), either (i) allele count must exceed BS1_supporting MTAC in one or more non-founder subpopulations, OR (ii) REVEL score must lie below the threshold for BP5_supporting (≤0.290).
SpliceAI score analysis
We adapted SpliceAI source code (https://github.com/Illumina/SpliceAI) to compute the scores of multi-nucleotide variation. In addition, we made the necessary changes in the code to extract scores for reference and alternative nucleotides along with acceptor and donor gains and losses. All SpliceAI scores for different variants are generated with a window range of 500, mask value set at 0, and GRCh38 used for reference genome and annotations. We share the customized SpliceAI code here: https://github.com/team113sanger/RAD51C_SGE.
Analysis of SGE data in the context of RAD51C structures
AlphaFold2 structures of BCDX2 and CX3 (from Prakash et al.31) were generated through AlphaFold2 v2.1.050 and are available through ModelArchive (modelarchive.org) with the following accession codes: ma-a54ps (BCDX2) and ma-52hi1 (CX3). Sequences of RAD51B, RAD51C, RAD51D, XRCC2 and XRCC3 were from the Uniprot Database67. The AlphaFold2 structures were compared with cryo-EM structures of BCDX2 (apo PDB:8FAZ, ssDNA bound structure PDB:8GBJ40; transition state PDB:8OUZ, ground state PDB:8OUY39) and crystal structure of Alvinella pompejana CX3 (apCX3, PDB:8GJA)41. In the analysis below, we focussed on missense variants that were fast or slow depleted in the SGE data. Proline missense variants were excluded since they were only tested for some residues. Missense variants with contradictory SGE depletion profiles (fast or slow and unchanged) for different codons of the same amino acid were also excluded in the analysis.
Supplementary Figs. 7–11 were generated using ChimeraX51. The Matchmaker tool in ChimeraX was used to model ATP molecules in the two ATP binding pockets of RAD51C. The RAD51 presynaptic structure (PDB:5H1B) was used to model ATP molecules into the two ATP binding pockets of RAD51C; the structure of the ATP bound between RAD51C and RAD51D fits well with that in the cryo-EM structure PDB:8OUZ. Solvent accessible surface areas (SASA) of each residue were calculated in PyMol (https://pymol.org/2/) using the AlphaFold2 BCDX2 and CX3 complex structures. SASA values describe what percentage of a residue is exposed to solvent relative to its full surface area, such that a value of 0 represents fully buried and 100 represents fully exposed. Residues with a SASA value greater than 10% were annotated as solvent exposed. To find potential interactions and contacts between residues in the BCDX2 and CX3 complexes, the structure analysis tool in ChimeraX was used to find clashes/contacts. Inter-residue atoms with VDW (van der Waals) overlap greater than or equal to −0.4 Å were selected and the type of interaction was subsequently analyzed.
Supplementary Material
Supplementary Figure 1: Summary of RAD51C sequencing data QC. a) Shown is an analysis of edited genome library composition for all target regions with the proportion of sequences carrying the desired edits shown in green, undesired but expected edits include; wild-type GRCh38 reference sequence (grey), sequences containing only PPEs and no other variant (yellow) and unmapped sequences such as partial edits and NHEJ indels (brown). b) The distribution of editing rate across each target region (including exon CDS and flanking intron) coloured by mutational consequence. Overlapping target regions 2.1/2.2, 3.1/3.2 and 5.1/5.2 are shown. The relative incorporation of variants at the baseline D4 is normalized for HDR repair library plasmid composition (D4 SGE Counts/Plasmid Counts, mean of three replicates each). As expected, variants in PPE codons (marked with +) are outliers to editing rate trends, reverting synonymous PPE codons back to wild-type, or creating missense variants with restored NGG PAM sites, allowing recutting of edited tracts, and therefore reducing editing efficiency. Black line shows locally estimated scatterplot smoothing (LOESS) regression for all variants. Note, there is no strong bias in the incorporation of the different mutational consequences.
Supplementary Figure 2: Analysis of RAD51C variants by position and consequence. These data represent the z-score D4 D14 with fast depleted, slow depleted, enriched and unchanged variants (shape) for variants with shown mutational consequences (colour) n=8,799/9,188 (n=352 PPE codon variants removed, n=37 variants with other mutational consequences not shown). Statistical significance (FDR<0.01) is indicated by opacity of the symbol (FDR≥0.01 datapoints are transparent). The data is presented for all 9 CDS exons and CDS-flanking intron/UTR sequence of RAD51C.
Supplementary Figure 3: Gene-wide map of amino acid change consequences for all nine exons of RAD51C. These data are presented by amino acid position with the colour of each box indicating the functional classification. As multiple SNVs can lead to the same missense change, those with a discordant classification of missense alleles were excluded (n=25). In addition to amino acid changes, data for codon deletions, an alanine scan and a stop scan are shown. 3,746 protein-level changes are shown, including 2,493 missense changes. White space are positions/changes not assayed.
Supplementary Figure 4: Analysis of the N-terminus of RAD51C and the correlation between HR proficiency score and variant type. a) Shown is an amino acid alignment of human RAD51C and 10 RAD51C orthologues across other species. Methionine positions at 1 and 10 for the human sequence are indicated. Shading indicates degree of conservation across the alignment. b) Shown is the effect of SGE performed on the N-terminal region of RAD51C revealing that none of the first nine amino acids are required for RAD51C essentiality. c) Amino acid level map of the N-terminal region of RAD51C. Note, no disruptive variation in positions 1:9, with completely intolerant disruption at M10. Codon deletions are mostly slow depleted from M10 until the end of the exon. d) A structural map of RAD51C (Q92560 processed through AlphaFold Monomer v2.0 pipeline) with the position of fast and slow depleted codon deletions shown. Note, M10 is slow depleted.
Supplementary Figure 5: Variant behaviours in a known motif, an orthogonal assay, and a splicing predictor a) RAD51C Walker B motif ‘LVIVD’. The highly conserved D242 residue which interacts with ATP-Mg2+ is intolerant to all substitutions. I240L has discordant classifications depending on the nucleotide sequence; c.718A>C is fast depleted and c.718A>T and c.718delinsCTG are both unchanged, suggesting c.718A>C may be detrimental to function due to nucleotide-level effects rather than at the protein-level. b) A boxplot showing the comparison between an orthogonal HR assay and SGE-based functional classification for missense variants tested in U2OS cells in Prakash et al.31. 33/36 variants tested are shown, P21A, P21S and R312W were excluded as they fall in PPE codons, other variants were matched between studies by HGVSc. A low HR Proficiency Score indicates defective HR; consistent with this, unchanged variants have a high score, fast depleted a low score, and slow depleted a significantly higher score than fast depleted and a significantly lower score than unchanged variant classifications (*p<0.05, **p<0.01, ****p<0.0001, two-sided Mann-Whitney-Wilcoxon Test). Box shows interquartile range, horizontal line the median HR Proficiency Score, whiskers show maximum and minimum values that are not outliers. Labelled outlier variants are shown; D108Y created by c.322G>T is fast depleted in SGE but is functional in the HR assay (an alternative codon change for D108Y, not used by Prakash et al.31: c.322_324delinsTAC, is unchanged in SGE, consistent with the HR assay). G125S (c.373G>A) is classed as fast depleted, but intermediate by HR assay (an alternative codon, c.373_375delinsAGC, is slow depleted, consistent with the HR assay). G130A (c.389G>C) is classed as fast depleted in SGE (by two alternative codons), and detrimental in the HR assay, but an outlier to the median HR proficiency score. V140G (c.419T>G) is unchanged in SGE, and detrimental in the HR (an alternative codon c.419_420delinsGC is fast depleted, consistent with the HR assay). c) SpliceAI values are significantly higher for fast and slow depleted synonymous and intron variants compared with unchanged synonymous and intron variants (two-sided Mann-Whitney-Wilcoxon Test, ****p<0.0001, ***p<0.001). Enriched synonymous variants do not have significantly different SpliceAI scores from unchanged synonymous variants, whereas enriched intron variants do have significantly higher SpliceAI scores than unchanged intron variants (**p<0.01). Non-splice region missense variants (VEP Consequence of ‘missense variant’) do not have significantly different SpliceAI scores between the different functional classifications. n=6,699/6,956 variants for specific VEP Consequences shown (n=257 PPE codon variants removed).
Supplementary Figure 6: SGE of RAD51C can be used to resolve the functional impact of variants identified in cancer kindred. Shown are three pedigrees and corresponding nucleotide-level maps (a-f) where the variant shown was assessed functionally by SGE. Phenotypes collated from each family are indicated on the pedigree with colours denoting the type of cancer reported in individuals in the family. The proband (arrow, variant in red text) is indicated. The variants found in all three of these families were determined to be non-disruptive. Several disruptive variants were also identified and subsequently resolved by SGE (Fig. 5).
Supplementary Figure 7: SGE depleted RAD51C missense variants map to approximately half of the RAD51C residues (175/376) encompassing all three domains: the N-terminal domain (NTD, residues 1–71), short linker (72–97) and ATPase domain (98–376). a,b) Residues with SGE depleted missense variants (red) in the BCDX2 complex: RAD51B-RAD51C-RAD51D-XRCC2, in this order with RAD51B at the bottom, (a) and the CX3 complex: RAD51C-XRCC3, (b). c) SGE depleted codon deletions map to a larger number of residues in comparison with depleted missense variants, because deletion of an amino acid is more likely to perturb the complex structure and/or because the missense variants tested do not cover all possible amino acid substitutions. In-frame codon deletions were not possible at split-exons, where single triplet codons span two exons, and are therefore ‘not examined’.
Supplementary Figure 8: RAD51C NTD: interactions with other RAD51 paralogues and important solvent exposed residues. 20/ 71 residues in the RAD51C NTD domain are depleted in the SGE analysis. 10 residues (L14, L19, V23, L27, L38, L46, V50, I52, A57, I64) appear to be important to maintain the structure of the four short alpha helices that pack together in the NTD domain, primarily through hydrophobic interactions between helices. Overall, they have low solvent accessible surface areas (SASA, see Star Methods) (average: 3.40 ± 4.48). Note that the RAD51C NTD is predicted to pack differently in the BCDX2 and CX3 complexes (Supplementary Fig. 7a,b). a-c) Missense variants deplete in 8 RAD51C NTD residues which interact with RAD51D (5) (a), XRCC2 (1) (b) and XRCC3 (3) (c). (R24 interacts with both RAD51D and XRCC2.) Residues in the RAD51C NTD are also predicted to interact with the RAD51B NTD, but these are not essential for viability in the SGE analysis, possibly because RAD51B is the only non-essential RAD51 paralogue46. Specific interactions are as follows: RAD51C NTD with RAD51D NTD + ATPase domains: C-NTD:D-NTD, RAD51C G31, F32:RAD51D V3; RAD51C E37:RAD51D R5. C-NTD:D-ATPase, RAD51C M10:RAD51D R186; RAD51C R24:RAD51D E222 (a). RAD51C NTD with XRCC2 ATPase domain: RAD51C R24:XRCC2 V160 (b). Predicted interaction of RAD51C NTD with XRCC3 NTD. Since the NTD of RAD51C packs differently in the BCDX2 and CX3 complexes in the AlphaFold2 structures, the NTD of RAD51C associates with RAD51B and XRCC3 differently: RAD51C P43, S44:XRCC3 E7; RAD51C K54:XRCC3 E4 (c). It is noteworthy that the apCX3 crystal structure does not show density for the RAD51C NTD and limited proteolysis of human CX3 demonstrates that the RAD51C NTD is flexible, although this does not rule out the possibility that RAD51 NTD could transiently interact with XRCC3 in a manner similar to the AlphaFold2 prediction41. d) Critical RAD51C NTD solvent exposed residues. Five solvent exposed NTD residues in RAD51C (P43, S44, K48, E49, K54) in the context of the BCDX2 complex were identified as critical by SGE, suggesting unidentified interactors.
Supplementary Figure 9: Hydrophobic interactions between RAD51 paralogues at the linker region. a) The RAD51C linker region can be divided into two parts, a region without structural elements (residues 72–86) and an alpha helix (residues 87–96). Four of the helical residues have depleted variants in the SGE analysis and form a hydrophobic interface with RAD51D ATPase domain residues (C-linker: A87, L88, L90, L91; D-ATPase: L141, A143, L146, L147, L164, I167, V169) (a). In RAD51, the motif involved in its polymerization (FXTA) extends upstream of this helix to a phenylalanine in a beta strand. While both the threonine (T86) and alanine (A87) are conserved in RAD51C, the critical hydrophobic contacts involving the RAD51 phenylalanine are not recapitulated. Instead, the cognate residue is charged (K84), implying that the RAD51 polymerization motif cannot be directly applied to RAD51C. Interestingly, the variant K84A is enriched in the SGE analysis, suggesting that increasing hydrophobicity upstream of the helix may lead to enhanced interaction with RAD51D and thus activity. Consistent with this, the more hydrophobic variant H82Y is also enriched. b-d). Hydrophobic interactions similar to those in the RAD51C linker-RAD51D ATPase interaction can be observed for other paralogue interfaces. At the second nucleotide pocket in RAD51C, critical RAD51C ATPase domain residues are predicted to form a hydrophobic pocket for the RAD51B and XRCC3 linker helices (B-linker: A67, Y68, I70, R74; C-ATPase: F164, M165, V166, V169, L205, I208, Y210) (b) Similar interfaces are observed for the RAD51D linker with the XRCC2 ATPase domain (D-linker: G68, A69, L71, Y72, E73; X2-ATPase: F87, M89, L90, V93, I108, K109, L112, G113, F115) (c) and for the XRCC3 linker with the RAD51C ATPase domain (X3-linker: A65, L66, L68; C-ATPase: F164, V166, V169, L205, I208, Y210) (d). Although the B-linker:RAD51C ATPase interface is not observed in the cryo-EM structures of BCDX2, it is predicted to occur in the active state of the complex39. Mutational analysis of the other paralogues would verify the importance of these residues in the other paralogues.
Supplementary Figure 10: Missense variants in 149 of the 279 residues in the RAD51C ATPase domain were depleted in the SGE analysis. In the ATPase domain, depleted missense variants map to 149 of the 279 residues (see Supplementary Fig. 7a,b). These residues are important for maintaining the structure of the protein, binding ATP at two sites, interacting with other paralogues, and interacting with ssDNA. Of the 149 critical residues, 63 appear to be critical for maintaining the domain structure, primarily through hydrophobic interactions. Most of these structural residues are of low solvent exposed surface area (SASA) (average: 2.12 ± 3.63) and are in internal beta strands or alpha helices. The 63 structural residues are: I100, T102, C104, L107, L111, G112, G114-P116, T120, T121, I123, C124, L134-V142, I144, A155-T160, L172, A173, A175, C176, L180, C213, V223, L226, V236, L238, V239, I240, V241, I244, A245, P247, F248, L252, L265, M269, L272, A279, V280, I281, W305, G306, L313, F315, A324, T325, L326, F339, G345 and F346. In addition to the linker helix interactions described above, RAD51C has additional interactions with the other paralogues. For RAD51B, the following interactions are expected to be important, given that variants at the RAD51C residues are depleted: RAD51C P127:RAD51B P276, H302; RAD51C Q133:RAD51B S325, P326; RAD51C Q285:RAD51B H302; RAD51C T287:RAD51B D27; RAD51C K342:RAD51B H348; RAD51C G162, S163:RAD51B N305, P326; RAD51C R260:RAD51B E37. Additional interactions with RAD51B are noted for RAD51C residues G162, A221, and Y224. RAD51D interactions are as follows: RAD51C K119:RAD51D T142; RAD51C E303:RAD51D R253; RAD51C R260:RAD51D Q220; RAD51C H307:RAD51D H250, P109. RAD51C associates with the RAD51B and XRCC3 ATPase domains in similar manners based on the AlphaFold2 prediction, with 7 of the same RAD51C residues functioning as interacting residues with XRCC3, in particular, RAD51C Q133:XRCC3 P321; RAD51C Q285:XRCC3 N290 and RAD51C S162, G163:XRCC3 S293, P321; RAD51C R260:XRCC3 E34; and RAD51C A221, Y224 form a hydrophobic pocket that interacts with XRCC3 and this interaction is recapitulated in RAD51B. Two unique interactions for RAD51C and XRCC3 are: RAD51C R249:XRCC3 Q236, N290; RAD51C R322:XRCC3 P325. a,b) ATP binding/hydrolysis. In the BCDX2 complex, ATP is sandwiched between both RAD51B:RAD51C, where it is hydrolyzed, and RAD51C:RAD51D, where it remains unhydrolyzed39,40. RAD51C has 17 critical residues at the ATP interface with RAD51B: G125, P127, G128, V129, G130, K131, T132, Q133, E161, S163, R168, D242, G243, T283, Q285, R322 and I341 (a). These include residues within the Walker A (G125, G130, K131, T132) and Walker B (D242) motifs; no amino acid change is tolerated for these residues, except for G125. This is unlike many other critical residues in which some conservative substitutions are tolerated. For example, at the catalytic residue E161, which activates a water molecule for nucleophilic attack on the gamma phosphate of ATP, the two E161D codon variants are tolerated, whereas other missense variants are depleted. Two of the 17 residues, G125 and V129, are buried residues that also interact with residues that constitute the ATP interacting surface. These 17 residues would be expected to be important also at the XRCC3:RAD51C interface binding ATP. For RAD51C:RAD51D, 8 residues deemed critical in the SGE analysis form an ATP interacting surface (H307, A308, A309, T310, K328, S329, P330, K333) (b). Among these are three residues that form a potential CDK1 phosphorylation motif (S329P330XXK333; scansite4.mit.edu), providing a possible regulatory site, although it is notable that a S329A missense variant is tolerated in the SGE analysis. S329, P330 and K333 have high SASA in the context of BCDX2 complex. c) ssDNA binding. RAD51C contacts with ssDNA are more difficult to determine. A cryo-EM structure of BCDX2 with polyC has been solved, although only a few structured nucleotides are in contact with RAD51C40. The structure of ssDNA in the RAD51 pre-synaptic filament has also been determined, although it appears to be configured differently than in the BCDX2 complex40. With these caveats, 14 critical residues in the SGE analysis are predicted to form a ssDNA binding surface (R249, R258, R260, L262, N263, G264, T287, T288, K289, A300, L301, G302, S304, R312). Basic residues R249, R258, R260, R312 are identified as especially critical in the SGE analysis, with no substitutions tolerated for R258, R260, and R312. Mutations at both R258 and R312 have been shown biochemically to reduce ssDNA binding40. G302 also could not be substituted to any other observed amino acid. R312 is part of the conserved triad of R312-E122-N28431, and all of the missense variants at E122 and N284 were also depleted, as with R312. While R312 is solvent exposed (SASA value, 14), E122 and N284 are buried (SASA values of 1 and 2, respectively), so interactions with other factors are unlikely. Two orientations of the RAD51C structure in the context of BCDX2 are shown here and for Supplementary Fig. 11, highlighting the discussed residues as surface representations.
Supplementary Figure 11: Missense variants at residues at several patches in the RAD51C ATPase domain in BCDX2 suggest potential interaction with other factors. Variant depletion was observed at residues that have much higher solvent exposure and are within patches on the surface (32 residues), suggesting that they may interact with other factors that are currently unidentified. Two patches involve a helix extrusion in RAD51C that is not found in the other RAD51 paralogues. In patch 1, depleted variants are at residues I101, F103, S105, D108, G113, F148, H179, I183, D348 (SASA average 18.75 ± 11.08), with, H179, L180 and I183 specifically from the helix extrusion. In patch 2, residues I177 and Q181 (SASA average 27.5 ± 20.5) are on the unique extruding helix, but on the opposite face from those in patch 1. Residue E191, which has a very high SASA (74), is just past this helix. Patch 3 is composed of 14 residues (L117, Q143, P145, G149, G150, V151, A152, G153, E154, F199, I204, H207, Y209, K235; SASA average 19.92 ± 16.76), with two of these residues showing no tolerance to any missense variants analysed in SGE (P145, G150). One side of the patch consists of charged residues, while the other is composed of hydrophobic residues with a relatively low SASA. Patch 4 is composed of six residues (M286, V298, P299, E303, G306, R312; SASA average 16.50 ± 11.80). Although hydrophobic, M286, V298, P299, and G306 have a high SASA (average 16.75 ± 12.54). This patch is right next to the DNA binding patch and includes R312 which has been shown to be important in ssDNA binding, such that variants at these residues may also affect ssDNA binding residues. Patch 5 consists of three hydrophobic residues (I110, C335 and V337; SASA average 16.00 ± 8.60). While this patch is close to RAD51D, it does not interact with RAD51D, suggesting potential interactions with other factors. Finally, missense and truncating variants are not depleted at any residue past the last conserved patch of amino acids ending at residue D348. A nuclear localization signal was previously identified in the extreme C-terminus47; however, it appears to be non-essential.
Supplementary Figure 12: SGE classification of missense variants predicted to affect RAD51C structure, interactions, or function based on the BCDX2 cryo-EM structure39. While many of the predictions are in variants that are fast and/or slow depleting, 48 of the 115 variants assessed (42%) are unchanged in the SGE analysis, indicating that they do not affect the essential function of the RAD51C, which is well correlated with HR levels. It remains possible that they affect a non-essential function of RAD51C. 10 variants are not included in the graph because different codons for the missense change had conflicting classifications in the SGE analysis.
KEY RESOURCES TABLE
| REAGENT or RESOURCE | SOURCE | IDENTIFIER |
|---|---|---|
| Bacterial and virus strains | ||
| E. coli One Shot TOP10 Chemically Competent cells | Thermo Fisher | C404010 |
| Endura™ electrocompetent cells | Lucigen48 | 60242–2 |
| Chemicals, peptides, and recombinant proteins | ||
| KAPA HiFi HotStart ReadyMix | Roche | KK2602 |
| Exonuclease I | Thermo Fisher | EN0582 |
| T4 Polynucleotide Kinase | NEB | M0201L |
| Quick ligase | NEB | M2200L |
| BbsI-HF | NEB | R3539L |
| DpnI | NEB | R0176S |
| Xfect™ Transfection Reagent | TAKARA | 631318 |
| NEBuilder HiFi DNA Assembly Master Mix | NEB | E2621L |
| Ampure XP | Beckman Coulter | A63882 |
| Iscove’s Modified Dulbecco’s Medium | Thermo Fisher | 12440–053 |
| Fetal Bovine Serum | Thermo Fisher | 10437–028 |
| TrypLE™ Express | Thermo Fisher | 12604–013 |
| Critical commercial assays | ||
| QIAquick PCR purification Kit | Qiagen | 28106 |
| MinElute PCR Purification Kit | Qiagen | 28006 |
| QIAprep Spin Miniprep Kit | Qiagen | 27106 |
| QIAquick Gel Extraction Kit | Qiagen | 28704 |
| Plasmid Plus Maxi Kit | Qiagen | 12963 |
| Dneasy Blood & Tissue Kit | Qiagen | 69506 |
| Deposited data | ||
| ClinVar | Landrum et al., 202024 | https://www.ncbi.nlm.nih.gov/clinvar/ |
| gnomAD | Karczewski et al., 202028 | https://gnomad.broadinstitute.org/ |
| Variant Effect Predictor GRCh38.p13 | McLaren et al., 201629 | https://www.ensembl.org/info/docs/tools/vep/script/vep_cache.html |
| Sequencing files | This paper | |
| Processed sequencing data and code | This paper | |
| Experimental models: Cell lines | ||
| HAP1 cell line | Horizon Discovery | HZGHC000759c005 |
| Oligonucleotides | ||
| sgRNA oligos | Sigma-Aldrich | Supplementary Table 8 |
| Library oligo pools | Twist Biosciences | Supplementary Table 8 |
| P5 and P7 generic primers for library pool amplification | Sigma-Aldrich | Supplementary Table 8 |
| Primers for amplification of specific target regions | Sigma-Aldrich | Supplementary Table 8 |
| Primers for amplification of homology backbone | Sigma-Aldrich | Supplementary Table 8 |
| Primers for amplification of homology arms | Sigma-Aldrich | Supplementary Table 8 |
| Primers for linearization of HDR plasmids | Sigma-Aldrich | Supplementary Table 8 |
| Primers for amplification of edited region | Sigma-Aldrich | Supplementary Table 8 |
| Primer for addition of Illumina adapters and sampling of smaller amplicons | Sigma-Aldrich | Supplementary Table 8 |
| Primers for indexing PCR (i5 and i7) | Sigma-Aldrich | Supplementary Table 8 |
| Recombinant DNA | ||
| pMin-U6-ccdb-hPGK-puro (pMin) | Radford et al., 20239 | |
| Software and algorithms | ||
| VaLiAnT | Barbon et al., 202227 | https://github.com/cancerit/VaLiAnT |
| QUANTS pipeline | Adams Lab | https://github.com/cancerit/QUANTS |
| DESeq2 | Love et al., 201430 | http://www.bioconductor.org/packages/release/bioc/html/DESeq2.html. |
| Mclust | Scrucca et al. 201649 | https://journal.r-project.org/archive/2016/RJ-2016-021/index.html |
| Ensembl Variant Effect Predictor | McLaren et al. 201629 | https://github.com/Ensembl/ensembl-vep |
| SpliceAI | Jaganathan et al. 201935 | https://github.com/Illumina/SpliceAI |
| AlphaFold2 v2.1.0 | Jumper et al. 202150 | https://github.com/deepmind/alphafold |
| ChimeraX | Pettersen et al. 202151 | https://www.rbvi.ucsf.edu/chimerax/ |
| Other | ||
ACKNOWLEDEMENTS
This work was supported by the Cancer Research UK CG-MAVE programme and the Wellcome Trust. R.O-L. was supported by a Wellcome Trust Sanger Institute M.Phil Scholarship. Work in the lab of M.J. is supported by NIH R35 CA253174.
Footnotes
DECLARATION OF INTERESTS
None declared.
ETHICS STATEMENT
All pedigrees and data shown in this paper are provided with the explicit written consent of the patients following IRB approval.
REFERENCES
- 1.Dorling L et al. Breast Cancer Risk Genes — Association Analysis in More than 113,000 Women. New England Journal of Medicine 384, 428–439 (2021). [DOI] [PMC free article] [PubMed] [Google Scholar]
- 2.Chang TC, Xu K, Cheng Z & Wu G Somatic and Germline Variant Calling from Next-Generation Sequencing Data. in Advances in Experimental Medicine and Biology vol. 1361 37–54 (Springer, 2022). [DOI] [PubMed] [Google Scholar]
- 3.Iancu I-F et al. Prioritizing variants of uncertain significance for reclassification using a rule-based algorithm in inherited retinal dystrophies. NPJ Genom Med 6, 18 (2021). [DOI] [PMC free article] [PubMed] [Google Scholar]
- 4.Sanoguera-Miralles L et al. Comprehensive Functional Characterization and Clinical Interpretation of 20 Splice-Site Variants of the RAD51C Gene. Cancers (Basel) 12, 3771 (2020). [DOI] [PMC free article] [PubMed] [Google Scholar]
- 5.Gasperini M, Starita L & Shendure J The power of multiplexed functional analysis of genetic variants. Nat Protoc 11, 1782–1787 (2016). [DOI] [PMC free article] [PubMed] [Google Scholar]
- 6.Starita LM et al. Variant Interpretation: Functional Assays to the Rescue. The American Journal of Human Genetics 101, 315–325 (2017). [DOI] [PMC free article] [PubMed] [Google Scholar]
- 7.Findlay GM et al. Accurate classification of BRCA1 variants with saturation genome editing. Nature 562, 217–222 (2018). [DOI] [PMC free article] [PubMed] [Google Scholar]
- 8.Meitlis I et al. Multiplexed Functional Assessment of Genetic Variants in CARD11. Am J Hum Genet 107, 1029–1043 (2020). [DOI] [PMC free article] [PubMed] [Google Scholar]
- 9.Radford EJ et al. Saturation genome editing of DDX3X clarifies pathogenicity of germline and somatic variation. Nat Commun 14, 7702 (2023). [DOI] [PMC free article] [PubMed] [Google Scholar]
- 10.Motegi A, Masutani M, Yoshioka K & Bessho T Aberrations in DNA repair pathways in cancer and therapeutic significances. Semin Cancer Biol 58, 29–46 (2019). [DOI] [PubMed] [Google Scholar]
- 11.Boni J et al. A decade of RAD51C and RAD51D germline variants in cancer. Hum Mutat 43, 285–298 (2022). [DOI] [PubMed] [Google Scholar]
- 12.Schubert S et al. The identification of pathogenic variants in BRCA1/2 negative, high risk, hereditary breast and/or ovarian cancer patients: High frequency of FANCM pathogenic variants. Int J Cancer 144, 2683–2694 (2019). [DOI] [PubMed] [Google Scholar]
- 13.Hodgson A & Turashvili G Pathology of Hereditary Breast and Ovarian Cancer. Front Oncol 10, (2020). [DOI] [PMC free article] [PubMed] [Google Scholar]
- 14.Nielsen FC, van Overeem Hansen T & Sørensen CS Hereditary breast and ovarian cancer: new genes in confined pathways. Nat Rev Cancer 16, 599–612 (2016). [DOI] [PubMed] [Google Scholar]
- 15.Vaz F et al. Mutation of the RAD51C gene in a Fanconi anemia–like disorder. Nat Genet 42, 406–409 (2010). [DOI] [PubMed] [Google Scholar]
- 16.Suszynska M, Ratajska M & Kozlowski P BRIP1, RAD51C, and RAD51D mutations are associated with high susceptibility to ovarian cancer: mutation prevalence and precise risk estimates based on a pooled analysis of ~30,000 cases. J Ovarian Res 13, 50 (2020). [DOI] [PMC free article] [PubMed] [Google Scholar]
- 17.Meindl A et al. Germline mutations in breast and ovarian cancer pedigrees establish RAD51C as a human cancer susceptibility gene. Nat Genet 42, 410–414 (2010). [DOI] [PubMed] [Google Scholar]
- 18.Loveday C et al. Germline RAD51C mutations confer susceptibility to ovarian cancer. Nature Genetics 2012 44:5 44, 475–476 (2012). [DOI] [PubMed] [Google Scholar]
- 19.Yang X et al. Ovarian and Breast Cancer Risks Associated With Pathogenic Variants in RAD51C and RAD51D. JNCI: Journal of the National Cancer Institute 112, 1242–1250 (2020). [DOI] [PMC free article] [PubMed] [Google Scholar]
- 20.Hu C et al. A Population-Based Study of Genes Previously Implicated in Breast Cancer. New England Journal of Medicine 384, 440–451 (2021). [DOI] [PMC free article] [PubMed] [Google Scholar]
- 21.Yurgelun MB et al. Germline cancer susceptibility gene variants, somatic second hits, and survival outcomes in patients with resected pancreatic cancer. Genetics in Medicine 21, 213–223 (2019). [DOI] [PMC free article] [PubMed] [Google Scholar]
- 22.Lu C et al. Patterns and functional implications of rare germline variants across 12 cancer types. Nat Commun 6, 10086 (2015). [DOI] [PMC free article] [PubMed] [Google Scholar]
- 23.Sahasrabudhe R et al. Germline Mutations in PALB2, BRCA1, and RAD51C, Which Regulate DNA Recombination Repair, in Patients With Gastric Cancer. Gastroenterology 152, 983–986.e6 (2017). [DOI] [PMC free article] [PubMed] [Google Scholar]
- 24.Landrum MJ et al. ClinVar: Improvements to accessing data. Nucleic Acids Res 48, D835–D844 (2020). [DOI] [PMC free article] [PubMed] [Google Scholar]
- 25.Hart T et al. Evaluation and design of genome-wide CRISPR/SpCas9 knockout screens. G3: Genes, Genomes, Genetics 7, 2719–2727 (2017). [DOI] [PMC free article] [PubMed] [Google Scholar]
- 26.Blomen VA et al. Gene essentiality and synthetic lethality in haploid human cells. Science (1979) 350, 1092–1096 (2015). [DOI] [PubMed] [Google Scholar]
- 27.Barbon L et al. Variant Library Annotation Tool (VaLiAnT): an oligonucleotide library design and annotation tool for saturation genome editing and other deep mutational scanning experiments. Bioinformatics 38, 892–899 (2022). [DOI] [PMC free article] [PubMed] [Google Scholar]
- 28.Karczewski KJ et al. The mutational constraint spectrum quantified from variation in 141,456 humans. Nature 581, 434–443 (2020). [DOI] [PMC free article] [PubMed] [Google Scholar]
- 29.McLaren W et al. The Ensembl Variant Effect Predictor. Genome Biol 17, 122 (2016). [DOI] [PMC free article] [PubMed] [Google Scholar]
- 30.Love MI, Huber W & Anders S Moderated estimation of fold change and dispersion for RNA-seq data with DESeq2. Genome Biol 15, 1–21 (2014). [DOI] [PMC free article] [PubMed] [Google Scholar]
- 31.Prakash R et al. Homologous recombination-deficient mutation cluster in tumor suppressor RAD51C identified by comprehensive analysis of cancer variants. (2022) doi: 10.1073/pnas. [DOI] [PMC free article] [PubMed] [Google Scholar]
- 32.Hu C et al. Functional and clinical characterization of variants of uncertain significance identifies a hotspot for inactivating missense variants in RAD51C. Cancer Res (2023) doi: 10.1158/0008-5472.CAN-22-2319. [DOI] [PMC free article] [PubMed] [Google Scholar]
- 33.Frazer J et al. Disease variant prediction with deep generative models of evolutionary data. Nature 599, 91–95 (2021). [DOI] [PubMed] [Google Scholar]
- 34.van Loggerenberg W et al. Systematically testing human HMBS missense variants to reveal mechanism and pathogenic variation. bioRxiv (2023) doi: 10.1101/2023.02.06.527353. [DOI] [PMC free article] [PubMed] [Google Scholar]
- 35.Jaganathan K et al. Predicting Splicing from Primary Sequence with Deep Learning. Cell 176, 535–548.e24 (2019). [DOI] [PubMed] [Google Scholar]
- 36.Richards S et al. Standards and guidelines for the interpretation of sequence variants: a joint consensus recommendation of the American College of Medical Genetics and Genomics and the Association for Molecular Pathology. Genet Med 17, 405–424 (2015). [DOI] [PMC free article] [PubMed] [Google Scholar]
- 37.Brnich SE et al. Recommendations for application of the functional evidence PS3/BS3 criterion using the ACMG/AMP sequence variant interpretation framework. Genome Med 12, 1–12 (2019). [DOI] [PMC free article] [PubMed] [Google Scholar]
- 38.Backman JD et al. Exome sequencing and analysis of 454,787 UK Biobank participants. Nature 599, 628–634 (2021). [DOI] [PMC free article] [PubMed] [Google Scholar]
- 39.Greenhough LA et al. Structure and function of the RAD51B–RAD51C–RAD51D–XRCC2 tumour suppressor. Nature 2023 1–8 (2023) doi: 10.1038/s41586-023-06179-1. [DOI] [PMC free article] [PubMed] [Google Scholar]
- 40.Rawal Y et al. Structural insights into BCDX2 complex function in homologous recombination. Nature 1–10 (2023) doi: 10.1038/s41586-023-06219-w. [DOI] [PMC free article] [PubMed] [Google Scholar]
- 41.Longo MA et al. RAD51C-XRCC3 structure and cancer patient mutations define DNA replication roles. Nat Commun 14, 4445 (2023). [DOI] [PMC free article] [PubMed] [Google Scholar]
- 42.Osorio A et al. Predominance of pathogenic missense variants in the RAD51C gene occurring in breast and ovarian cancer families. Hum Mol Genet 21, 2889–2898 (2012). [DOI] [PubMed] [Google Scholar]
- 43.Clague J et al. RAD51C Germline Mutations in Breast and Ovarian Cancer Cases from High-Risk Families. PLoS One 6, e25632 (2011). [DOI] [PMC free article] [PubMed] [Google Scholar]
- 44.Gayarre J et al. Characterisation of the novel deleterious RAD51C p.Arg312Trp variant and prioritisation criteria for functional analysis of RAD51C missense changes. Br J Cancer 117, 1048–1062 (2017). [DOI] [PMC free article] [PubMed] [Google Scholar]
- 45.Kolinjivadi AM et al. Functional analysis of germline RAD51C missense variants highlight the role of RAD51C in replication fork protection. Hum Mol Genet 32, 1401–1409 (2023). [DOI] [PubMed] [Google Scholar]
- 46.Garcin EB et al. Differential Requirements for the RAD51 Paralogs in Genome Repair and Maintenance in Human Cells. PLoS Genet 15, e1008355 (2019). [DOI] [PMC free article] [PubMed] [Google Scholar]
- 47.French CA, Tambini CE & Thacker J Identification of Functional Domains in the RAD51L2 (RAD51C) Protein and Its Requirement for Gene Conversion. Journal of Biological Chemistry 278, 45445–45450 (2003). [DOI] [PubMed] [Google Scholar]
- 48.Lucigen Corporation. Endura™ Chemically Competent and Electrocompetent Cells. https://biosearchtech.a.bigcontent.io/v1/static/manual_COMCEL-002_Endura-Competent-Cells (2018).
- 49.Scrucca L, Fop M, Murphy T, Brendan & Raftery, A. mclust 5: Clustering, Classification and Density Estimation Using Gaussian Finite Mixture Models. R J 8, 289 (2016). [PMC free article] [PubMed] [Google Scholar]
- 50.Jumper J et al. Highly accurate protein structure prediction with AlphaFold. Nature 596, 583–589 (2021). [DOI] [PMC free article] [PubMed] [Google Scholar]
- 51.Pettersen EF et al. UCSF ChimeraX: Structure visualization for researchers, educators, and developers. Protein Sci 30, 70–82 (2021). [DOI] [PMC free article] [PubMed] [Google Scholar]
- 52.Li H A statistical framework for SNP calling, mutation discovery, association mapping and population genetical parameter estimation from sequencing data. Bioinformatics 27, 2987–2993 (2011). [DOI] [PMC free article] [PubMed] [Google Scholar]
- 53.Morales J et al. A joint NCBI and EMBL-EBI transcript set for clinical genomics and research. Nature 604, 310–315 (2022). [DOI] [PMC free article] [PubMed] [Google Scholar]
- 54.Seabold S & Perktold J Statsmodels: Econometric and Statistical Modeling with Python. in Proceedings of the 9th Python in Science Conference 92–96 (SciPy, 2010). doi: 10.25080/Majora-92bf1922-011. [DOI] [Google Scholar]
- 55.Bycroft C et al. The UK Biobank resource with deep phenotyping and genomic data. Nature 562, 203–209 (2018). [DOI] [PMC free article] [PubMed] [Google Scholar]
- 56.Song H et al. Contribution of Germline Mutations in the RAD51B, RAD51C, and RAD51D Genes to Ovarian Cancer in the Population. J Clin Oncol 33, 2901–7 (2015). [DOI] [PMC free article] [PubMed] [Google Scholar]
- 57.Ezquina SAM et al. Rare germline genetic variation in PAX8 transcription factor binding sites and susceptibility to epithelial ovarian cancer. medRxiv 2023.03.22.23287587 (2023) doi: 10.1101/2023.03.22.23287587. [DOI] [PMC free article] [PubMed] [Google Scholar]
- 58.Allen NE et al. Prospective study design and data analysis in UK Biobank. Sci Transl Med 16, eadf4428 (2024). [DOI] [PMC free article] [PubMed] [Google Scholar]
- 59.Allen S et al. Workshop Report: The Clinical Application of data from multiplex assays of variant effect (MAVEs), 12 July 2023. Preprint at 10.5281/zenodo.10669761 (2024). [DOI] [PMC free article] [PubMed] [Google Scholar]
- 60.Whiffin N et al. Using high-resolution variant frequencies to empower clinical genome interpretation. Genetics in Medicine 19, 1151–1158 (2017). [DOI] [PMC free article] [PubMed] [Google Scholar]
- 61.Huntley C et al. Utility of polygenic risk scores in UK cancer screening: a modelling analysis. Lancet Oncol 24, 658–668 (2023). [DOI] [PubMed] [Google Scholar]
- 62.Public Health England. National Cancer Registration and Analysis Service (NCRAS). (2018). [Google Scholar]
- 63.Cubuk C et al. Clinical likelihood ratios and balanced accuracy for 44 in silico tools against multiple large-scale functional assays of cancer susceptibility genes. Genet Med 23, 2096–2104 (2021). [DOI] [PMC free article] [PubMed] [Google Scholar]
- 64.Gunning AC et al. Assessing performance of pathogenicity predictors using clinically relevant variant datasets. J Med Genet 58, 547–555 (2021). [DOI] [PMC free article] [PubMed] [Google Scholar]
- 65.Ioannidis NM et al. REVEL: An Ensemble Method for Predicting the Pathogenicity of Rare Missense Variants. Am J Hum Genet 99, 877–885 (2016). [DOI] [PMC free article] [PubMed] [Google Scholar]
- 66.Pejaver V et al. Calibration of computational tools for missense variant pathogenicity classification and ClinGen recommendations for PP3/BP4 criteria. Am J Hum Genet 109, 2163–2177 (2022). [DOI] [PMC free article] [PubMed] [Google Scholar]
- 67.UniProt Consortium, T. UniProt: the universal protein knowledgebase. Nucleic Acids Res 46, 2699–2699 (2018). [DOI] [PMC free article] [PubMed] [Google Scholar]
Associated Data
This section collects any data citations, data availability statements, or supplementary materials included in this article.
Supplementary Materials
Supplementary Figure 1: Summary of RAD51C sequencing data QC. a) Shown is an analysis of edited genome library composition for all target regions with the proportion of sequences carrying the desired edits shown in green, undesired but expected edits include; wild-type GRCh38 reference sequence (grey), sequences containing only PPEs and no other variant (yellow) and unmapped sequences such as partial edits and NHEJ indels (brown). b) The distribution of editing rate across each target region (including exon CDS and flanking intron) coloured by mutational consequence. Overlapping target regions 2.1/2.2, 3.1/3.2 and 5.1/5.2 are shown. The relative incorporation of variants at the baseline D4 is normalized for HDR repair library plasmid composition (D4 SGE Counts/Plasmid Counts, mean of three replicates each). As expected, variants in PPE codons (marked with +) are outliers to editing rate trends, reverting synonymous PPE codons back to wild-type, or creating missense variants with restored NGG PAM sites, allowing recutting of edited tracts, and therefore reducing editing efficiency. Black line shows locally estimated scatterplot smoothing (LOESS) regression for all variants. Note, there is no strong bias in the incorporation of the different mutational consequences.
Supplementary Figure 2: Analysis of RAD51C variants by position and consequence. These data represent the z-score D4 D14 with fast depleted, slow depleted, enriched and unchanged variants (shape) for variants with shown mutational consequences (colour) n=8,799/9,188 (n=352 PPE codon variants removed, n=37 variants with other mutational consequences not shown). Statistical significance (FDR<0.01) is indicated by opacity of the symbol (FDR≥0.01 datapoints are transparent). The data is presented for all 9 CDS exons and CDS-flanking intron/UTR sequence of RAD51C.
Supplementary Figure 3: Gene-wide map of amino acid change consequences for all nine exons of RAD51C. These data are presented by amino acid position with the colour of each box indicating the functional classification. As multiple SNVs can lead to the same missense change, those with a discordant classification of missense alleles were excluded (n=25). In addition to amino acid changes, data for codon deletions, an alanine scan and a stop scan are shown. 3,746 protein-level changes are shown, including 2,493 missense changes. White space are positions/changes not assayed.
Supplementary Figure 4: Analysis of the N-terminus of RAD51C and the correlation between HR proficiency score and variant type. a) Shown is an amino acid alignment of human RAD51C and 10 RAD51C orthologues across other species. Methionine positions at 1 and 10 for the human sequence are indicated. Shading indicates degree of conservation across the alignment. b) Shown is the effect of SGE performed on the N-terminal region of RAD51C revealing that none of the first nine amino acids are required for RAD51C essentiality. c) Amino acid level map of the N-terminal region of RAD51C. Note, no disruptive variation in positions 1:9, with completely intolerant disruption at M10. Codon deletions are mostly slow depleted from M10 until the end of the exon. d) A structural map of RAD51C (Q92560 processed through AlphaFold Monomer v2.0 pipeline) with the position of fast and slow depleted codon deletions shown. Note, M10 is slow depleted.
Supplementary Figure 5: Variant behaviours in a known motif, an orthogonal assay, and a splicing predictor a) RAD51C Walker B motif ‘LVIVD’. The highly conserved D242 residue which interacts with ATP-Mg2+ is intolerant to all substitutions. I240L has discordant classifications depending on the nucleotide sequence; c.718A>C is fast depleted and c.718A>T and c.718delinsCTG are both unchanged, suggesting c.718A>C may be detrimental to function due to nucleotide-level effects rather than at the protein-level. b) A boxplot showing the comparison between an orthogonal HR assay and SGE-based functional classification for missense variants tested in U2OS cells in Prakash et al.31. 33/36 variants tested are shown, P21A, P21S and R312W were excluded as they fall in PPE codons, other variants were matched between studies by HGVSc. A low HR Proficiency Score indicates defective HR; consistent with this, unchanged variants have a high score, fast depleted a low score, and slow depleted a significantly higher score than fast depleted and a significantly lower score than unchanged variant classifications (*p<0.05, **p<0.01, ****p<0.0001, two-sided Mann-Whitney-Wilcoxon Test). Box shows interquartile range, horizontal line the median HR Proficiency Score, whiskers show maximum and minimum values that are not outliers. Labelled outlier variants are shown; D108Y created by c.322G>T is fast depleted in SGE but is functional in the HR assay (an alternative codon change for D108Y, not used by Prakash et al.31: c.322_324delinsTAC, is unchanged in SGE, consistent with the HR assay). G125S (c.373G>A) is classed as fast depleted, but intermediate by HR assay (an alternative codon, c.373_375delinsAGC, is slow depleted, consistent with the HR assay). G130A (c.389G>C) is classed as fast depleted in SGE (by two alternative codons), and detrimental in the HR assay, but an outlier to the median HR proficiency score. V140G (c.419T>G) is unchanged in SGE, and detrimental in the HR (an alternative codon c.419_420delinsGC is fast depleted, consistent with the HR assay). c) SpliceAI values are significantly higher for fast and slow depleted synonymous and intron variants compared with unchanged synonymous and intron variants (two-sided Mann-Whitney-Wilcoxon Test, ****p<0.0001, ***p<0.001). Enriched synonymous variants do not have significantly different SpliceAI scores from unchanged synonymous variants, whereas enriched intron variants do have significantly higher SpliceAI scores than unchanged intron variants (**p<0.01). Non-splice region missense variants (VEP Consequence of ‘missense variant’) do not have significantly different SpliceAI scores between the different functional classifications. n=6,699/6,956 variants for specific VEP Consequences shown (n=257 PPE codon variants removed).
Supplementary Figure 6: SGE of RAD51C can be used to resolve the functional impact of variants identified in cancer kindred. Shown are three pedigrees and corresponding nucleotide-level maps (a-f) where the variant shown was assessed functionally by SGE. Phenotypes collated from each family are indicated on the pedigree with colours denoting the type of cancer reported in individuals in the family. The proband (arrow, variant in red text) is indicated. The variants found in all three of these families were determined to be non-disruptive. Several disruptive variants were also identified and subsequently resolved by SGE (Fig. 5).
Supplementary Figure 7: SGE depleted RAD51C missense variants map to approximately half of the RAD51C residues (175/376) encompassing all three domains: the N-terminal domain (NTD, residues 1–71), short linker (72–97) and ATPase domain (98–376). a,b) Residues with SGE depleted missense variants (red) in the BCDX2 complex: RAD51B-RAD51C-RAD51D-XRCC2, in this order with RAD51B at the bottom, (a) and the CX3 complex: RAD51C-XRCC3, (b). c) SGE depleted codon deletions map to a larger number of residues in comparison with depleted missense variants, because deletion of an amino acid is more likely to perturb the complex structure and/or because the missense variants tested do not cover all possible amino acid substitutions. In-frame codon deletions were not possible at split-exons, where single triplet codons span two exons, and are therefore ‘not examined’.
Supplementary Figure 8: RAD51C NTD: interactions with other RAD51 paralogues and important solvent exposed residues. 20/ 71 residues in the RAD51C NTD domain are depleted in the SGE analysis. 10 residues (L14, L19, V23, L27, L38, L46, V50, I52, A57, I64) appear to be important to maintain the structure of the four short alpha helices that pack together in the NTD domain, primarily through hydrophobic interactions between helices. Overall, they have low solvent accessible surface areas (SASA, see Star Methods) (average: 3.40 ± 4.48). Note that the RAD51C NTD is predicted to pack differently in the BCDX2 and CX3 complexes (Supplementary Fig. 7a,b). a-c) Missense variants deplete in 8 RAD51C NTD residues which interact with RAD51D (5) (a), XRCC2 (1) (b) and XRCC3 (3) (c). (R24 interacts with both RAD51D and XRCC2.) Residues in the RAD51C NTD are also predicted to interact with the RAD51B NTD, but these are not essential for viability in the SGE analysis, possibly because RAD51B is the only non-essential RAD51 paralogue46. Specific interactions are as follows: RAD51C NTD with RAD51D NTD + ATPase domains: C-NTD:D-NTD, RAD51C G31, F32:RAD51D V3; RAD51C E37:RAD51D R5. C-NTD:D-ATPase, RAD51C M10:RAD51D R186; RAD51C R24:RAD51D E222 (a). RAD51C NTD with XRCC2 ATPase domain: RAD51C R24:XRCC2 V160 (b). Predicted interaction of RAD51C NTD with XRCC3 NTD. Since the NTD of RAD51C packs differently in the BCDX2 and CX3 complexes in the AlphaFold2 structures, the NTD of RAD51C associates with RAD51B and XRCC3 differently: RAD51C P43, S44:XRCC3 E7; RAD51C K54:XRCC3 E4 (c). It is noteworthy that the apCX3 crystal structure does not show density for the RAD51C NTD and limited proteolysis of human CX3 demonstrates that the RAD51C NTD is flexible, although this does not rule out the possibility that RAD51 NTD could transiently interact with XRCC3 in a manner similar to the AlphaFold2 prediction41. d) Critical RAD51C NTD solvent exposed residues. Five solvent exposed NTD residues in RAD51C (P43, S44, K48, E49, K54) in the context of the BCDX2 complex were identified as critical by SGE, suggesting unidentified interactors.
Supplementary Figure 9: Hydrophobic interactions between RAD51 paralogues at the linker region. a) The RAD51C linker region can be divided into two parts, a region without structural elements (residues 72–86) and an alpha helix (residues 87–96). Four of the helical residues have depleted variants in the SGE analysis and form a hydrophobic interface with RAD51D ATPase domain residues (C-linker: A87, L88, L90, L91; D-ATPase: L141, A143, L146, L147, L164, I167, V169) (a). In RAD51, the motif involved in its polymerization (FXTA) extends upstream of this helix to a phenylalanine in a beta strand. While both the threonine (T86) and alanine (A87) are conserved in RAD51C, the critical hydrophobic contacts involving the RAD51 phenylalanine are not recapitulated. Instead, the cognate residue is charged (K84), implying that the RAD51 polymerization motif cannot be directly applied to RAD51C. Interestingly, the variant K84A is enriched in the SGE analysis, suggesting that increasing hydrophobicity upstream of the helix may lead to enhanced interaction with RAD51D and thus activity. Consistent with this, the more hydrophobic variant H82Y is also enriched. b-d). Hydrophobic interactions similar to those in the RAD51C linker-RAD51D ATPase interaction can be observed for other paralogue interfaces. At the second nucleotide pocket in RAD51C, critical RAD51C ATPase domain residues are predicted to form a hydrophobic pocket for the RAD51B and XRCC3 linker helices (B-linker: A67, Y68, I70, R74; C-ATPase: F164, M165, V166, V169, L205, I208, Y210) (b) Similar interfaces are observed for the RAD51D linker with the XRCC2 ATPase domain (D-linker: G68, A69, L71, Y72, E73; X2-ATPase: F87, M89, L90, V93, I108, K109, L112, G113, F115) (c) and for the XRCC3 linker with the RAD51C ATPase domain (X3-linker: A65, L66, L68; C-ATPase: F164, V166, V169, L205, I208, Y210) (d). Although the B-linker:RAD51C ATPase interface is not observed in the cryo-EM structures of BCDX2, it is predicted to occur in the active state of the complex39. Mutational analysis of the other paralogues would verify the importance of these residues in the other paralogues.
Supplementary Figure 10: Missense variants in 149 of the 279 residues in the RAD51C ATPase domain were depleted in the SGE analysis. In the ATPase domain, depleted missense variants map to 149 of the 279 residues (see Supplementary Fig. 7a,b). These residues are important for maintaining the structure of the protein, binding ATP at two sites, interacting with other paralogues, and interacting with ssDNA. Of the 149 critical residues, 63 appear to be critical for maintaining the domain structure, primarily through hydrophobic interactions. Most of these structural residues are of low solvent exposed surface area (SASA) (average: 2.12 ± 3.63) and are in internal beta strands or alpha helices. The 63 structural residues are: I100, T102, C104, L107, L111, G112, G114-P116, T120, T121, I123, C124, L134-V142, I144, A155-T160, L172, A173, A175, C176, L180, C213, V223, L226, V236, L238, V239, I240, V241, I244, A245, P247, F248, L252, L265, M269, L272, A279, V280, I281, W305, G306, L313, F315, A324, T325, L326, F339, G345 and F346. In addition to the linker helix interactions described above, RAD51C has additional interactions with the other paralogues. For RAD51B, the following interactions are expected to be important, given that variants at the RAD51C residues are depleted: RAD51C P127:RAD51B P276, H302; RAD51C Q133:RAD51B S325, P326; RAD51C Q285:RAD51B H302; RAD51C T287:RAD51B D27; RAD51C K342:RAD51B H348; RAD51C G162, S163:RAD51B N305, P326; RAD51C R260:RAD51B E37. Additional interactions with RAD51B are noted for RAD51C residues G162, A221, and Y224. RAD51D interactions are as follows: RAD51C K119:RAD51D T142; RAD51C E303:RAD51D R253; RAD51C R260:RAD51D Q220; RAD51C H307:RAD51D H250, P109. RAD51C associates with the RAD51B and XRCC3 ATPase domains in similar manners based on the AlphaFold2 prediction, with 7 of the same RAD51C residues functioning as interacting residues with XRCC3, in particular, RAD51C Q133:XRCC3 P321; RAD51C Q285:XRCC3 N290 and RAD51C S162, G163:XRCC3 S293, P321; RAD51C R260:XRCC3 E34; and RAD51C A221, Y224 form a hydrophobic pocket that interacts with XRCC3 and this interaction is recapitulated in RAD51B. Two unique interactions for RAD51C and XRCC3 are: RAD51C R249:XRCC3 Q236, N290; RAD51C R322:XRCC3 P325. a,b) ATP binding/hydrolysis. In the BCDX2 complex, ATP is sandwiched between both RAD51B:RAD51C, where it is hydrolyzed, and RAD51C:RAD51D, where it remains unhydrolyzed39,40. RAD51C has 17 critical residues at the ATP interface with RAD51B: G125, P127, G128, V129, G130, K131, T132, Q133, E161, S163, R168, D242, G243, T283, Q285, R322 and I341 (a). These include residues within the Walker A (G125, G130, K131, T132) and Walker B (D242) motifs; no amino acid change is tolerated for these residues, except for G125. This is unlike many other critical residues in which some conservative substitutions are tolerated. For example, at the catalytic residue E161, which activates a water molecule for nucleophilic attack on the gamma phosphate of ATP, the two E161D codon variants are tolerated, whereas other missense variants are depleted. Two of the 17 residues, G125 and V129, are buried residues that also interact with residues that constitute the ATP interacting surface. These 17 residues would be expected to be important also at the XRCC3:RAD51C interface binding ATP. For RAD51C:RAD51D, 8 residues deemed critical in the SGE analysis form an ATP interacting surface (H307, A308, A309, T310, K328, S329, P330, K333) (b). Among these are three residues that form a potential CDK1 phosphorylation motif (S329P330XXK333; scansite4.mit.edu), providing a possible regulatory site, although it is notable that a S329A missense variant is tolerated in the SGE analysis. S329, P330 and K333 have high SASA in the context of BCDX2 complex. c) ssDNA binding. RAD51C contacts with ssDNA are more difficult to determine. A cryo-EM structure of BCDX2 with polyC has been solved, although only a few structured nucleotides are in contact with RAD51C40. The structure of ssDNA in the RAD51 pre-synaptic filament has also been determined, although it appears to be configured differently than in the BCDX2 complex40. With these caveats, 14 critical residues in the SGE analysis are predicted to form a ssDNA binding surface (R249, R258, R260, L262, N263, G264, T287, T288, K289, A300, L301, G302, S304, R312). Basic residues R249, R258, R260, R312 are identified as especially critical in the SGE analysis, with no substitutions tolerated for R258, R260, and R312. Mutations at both R258 and R312 have been shown biochemically to reduce ssDNA binding40. G302 also could not be substituted to any other observed amino acid. R312 is part of the conserved triad of R312-E122-N28431, and all of the missense variants at E122 and N284 were also depleted, as with R312. While R312 is solvent exposed (SASA value, 14), E122 and N284 are buried (SASA values of 1 and 2, respectively), so interactions with other factors are unlikely. Two orientations of the RAD51C structure in the context of BCDX2 are shown here and for Supplementary Fig. 11, highlighting the discussed residues as surface representations.
Supplementary Figure 11: Missense variants at residues at several patches in the RAD51C ATPase domain in BCDX2 suggest potential interaction with other factors. Variant depletion was observed at residues that have much higher solvent exposure and are within patches on the surface (32 residues), suggesting that they may interact with other factors that are currently unidentified. Two patches involve a helix extrusion in RAD51C that is not found in the other RAD51 paralogues. In patch 1, depleted variants are at residues I101, F103, S105, D108, G113, F148, H179, I183, D348 (SASA average 18.75 ± 11.08), with, H179, L180 and I183 specifically from the helix extrusion. In patch 2, residues I177 and Q181 (SASA average 27.5 ± 20.5) are on the unique extruding helix, but on the opposite face from those in patch 1. Residue E191, which has a very high SASA (74), is just past this helix. Patch 3 is composed of 14 residues (L117, Q143, P145, G149, G150, V151, A152, G153, E154, F199, I204, H207, Y209, K235; SASA average 19.92 ± 16.76), with two of these residues showing no tolerance to any missense variants analysed in SGE (P145, G150). One side of the patch consists of charged residues, while the other is composed of hydrophobic residues with a relatively low SASA. Patch 4 is composed of six residues (M286, V298, P299, E303, G306, R312; SASA average 16.50 ± 11.80). Although hydrophobic, M286, V298, P299, and G306 have a high SASA (average 16.75 ± 12.54). This patch is right next to the DNA binding patch and includes R312 which has been shown to be important in ssDNA binding, such that variants at these residues may also affect ssDNA binding residues. Patch 5 consists of three hydrophobic residues (I110, C335 and V337; SASA average 16.00 ± 8.60). While this patch is close to RAD51D, it does not interact with RAD51D, suggesting potential interactions with other factors. Finally, missense and truncating variants are not depleted at any residue past the last conserved patch of amino acids ending at residue D348. A nuclear localization signal was previously identified in the extreme C-terminus47; however, it appears to be non-essential.
Supplementary Figure 12: SGE classification of missense variants predicted to affect RAD51C structure, interactions, or function based on the BCDX2 cryo-EM structure39. While many of the predictions are in variants that are fast and/or slow depleting, 48 of the 115 variants assessed (42%) are unchanged in the SGE analysis, indicating that they do not affect the essential function of the RAD51C, which is well correlated with HR levels. It remains possible that they affect a non-essential function of RAD51C. 10 variants are not included in the graph because different codons for the missense change had conflicting classifications in the SGE analysis.
Data Availability Statement
Analysis code, functional scores and classification data is available here: https://github.com/team113sanger/RAD51C_SGE
FASTQ files generated in this study for HDR plasmid libraries and edited genomic DNA libraries will be made available through a European Nucleotide Archive (ENA) accession.
Raw counts generated through the QUANTS pipeline, and VaLiAnT and VEP annotation files, will be made available through a BioStudies accession.
Mapped counts, experimental and bioinformatics methods will be made accessible through a MaveDB accession.