

ABSTRACT
Mild traumatic brain injury (mTBI) caused by sports‐related incidents in children and youth often leads to prolonged cognitive impairments but remains difficult to diagnose. In order to identify clinically relevant imaging and behavioral biomarkers associated concussion, a closed‐head mTBI was induced in adolescent pigs. Twelve (n = 4 male and n = 8 female), 16‐week old Yucatan pigs were tested; n = 6 received mTBI and n = 6 received a sham procedure. T1‐weighted imaging was used to assess volumetric alterations in different regions of the brain and diffusion tensor imaging (DTI) to examine microstructural damage in white matter. The pigs were imaged at 1‐ and 3‐month post‐injury. Neuropsychological screening for executive function and anxiety were performed before and in the months after the injury. The volumetric analysis showed significant longitudinal changes in pigs with mTBI compared with sham, which may be attributed to swelling and neuroinflammation. Fractional anisotropy (FA) values derived from DTI images demonstrated a 21% increase in corpus callosum from 1 to 3 months in mTBI pigs, which is significantly higher than in sham pigs (4.8%). Additionally, comparisons of the left and right internal capsules revealed a decrease in FA in the right internal capsule for mTBI pigs, which may indicate demyelination. The neuroimaging results suggest that the injury had disrupted the maturation of white and gray matter in the developing brain. Behavioral testing showed that compare to sham pigs, mTBI pigs exhibited 23% increased activity in open field tests, 35% incraesed escape attempts, along with a 65% decrease in interaction with the novel object, suggesting possible memory impairments and cognitive deficits. The correlation analysis showed an associations between volumetric features and behavioral metrics. Furthermore, a machine learning model, which integrated FA, volumetric features and behavioral test metrics, achieved 67% accuracy, indicating its potential to differentiate the two groups. Thus, the imaging biomarkers were indicative of long‐term behavioral impairments and could be crucial to the clinical management of concussion in youth.
Keywords: biomarkers, concussion, MRI, pig, recovery, sports injuries, trauma, white matter, youth
We developed a translational, closed‐head, mild traumatic brain injury in adolescent pigs. DTI and volumetric analysis showed abnormalities in the integrity and volume of white and gray matter structures. Behavioral testing for memory and anxiety also indicated behavioral deficits after injury.

Abbreviations
- ad
axial diffusivity
- AI
asymmetry index
- ANTs
advanced normalization tools
- CC
corpus callosum
- CCI
controlled cortical impact
- DTI
diffusion tensor imaging
- FA
fractional anisotropy
- FLAIR
fluid‐attenuated inversion recovery
- FPI
fluid percussion injury
- GRE
axial gradient‐echo
- LFB
luxol fast blue
- LH
left hippocampus
- LIC
left internal capsule
- MD
mean diffusivity
- mTBI
mild traumatic brain injury
- NOR
novel object recognition
- OFT
open field test
- PCA
principal component analysis
- PCS
post‐concussion syndrome
- RD
radial diffusivity
- RH
right hippocampus
- RIC
right internal capsule
- ROI
region of interest
- SI
severity index
- SRC
sports related concussion
- SVMs
support vector machines
1. Introduction
Traumatic brain injury (TBI) constitutes a significant global public health challenge, posing severe and widespread implications for neurological health and healthcare systems worldwide. TBI often results from exposure to blasts, falls, motor vehicle accidents, sports‐related injuries, or combat situations. Globally, TBI is a significant contributor to the loss of disability‐adjusted life years. TBI affects millions, including children, leading to significant cognitive deficits and fatality. Annually, 475,000 children in the United States experience traumatic brain injuries, leading to 37,000 hospitalizations and 2685 deaths, with the highest emergency room visits and death rates in children under 4 years [1].
Mild TBI (mTBI) is synonymous with concussion [2] and is most prevalent in children and youth due to their active participation in sports [3]. Symptoms of mTBI can include nausea, headaches, and possible loss of consciousness for several minutes. Because these symptoms often resolve rapidly, mTBI diagnosis remains challenging. A substantial number of children (25.3% in the mTBI group [4]) experience persistent post‐concussion syndrome (PCS) [5, 6]. PCS symptoms, which include headaches, dizziness, fatigue, anxiety, depression, difficulty concentrating, and memory problems, can last for weeks, months, or even years after a concussion [7]. The severity of PCS symptoms was correlated with objectively measurable deficits in neurocognitive function, indicating that mTBI can have long‐term consequences and that PCS is not merely a transient condition [8]. The study found that a significant proportion of TBI patients reported persistent symptoms 1 month after the injury and an even greater number of patients reported persistent symptoms a year later [9]. Even among mTBI patients, 44% had three or more symptoms 1 year after the injury, indicating higher rates of persistent symptoms than commonly believed [10]. Repeated mTBIs sustained in contact sports are strongly linked to the onset of chronic traumatic encephalopathy, a progressive neurodegenerative disorder marked by the pathological accumulation of tau protein within the brain [11, 12].
Although standardized evaluation tools are helpful for medical management of mTBI, the progression and timeline of recovery from mTBI or sports related concussion (SRC) remains unclear [13, 14]. Consequently, non‐invasive techniques such as MRI and CT scans have become standard tools for evaluating clinical outcomes and identifying biomarkers [15]. mTBI is a multifaceted condition that significantly impacts brain function. Although the precise mechanisms are still under investigation, the pathophysiology of mTBI likely involves a combination of mechanical forces, biochemical changes, and functional consequences [16]. Mild injuries can lead to axonal damage, which may later result in axonal separation. Mechanical forces during trauma that damage the axonal cytoskeleton. Initially, this disruption impairs axonal transport, leading to axonal swelling [17] and ultimately causing Wallerian degeneration, which can progress over months to years, post‐injury. Demyelination is also an important feature of axonal damage, which refers to the gradual death and damage of myelin sheaths of axons disrupted from the trauma or the external force in mTBI.
Anatomical MRI and diffusion tensor imaging (DTI) [18] provide means to assess white matter pathology based on regional volumes and microstructural integrity [19, 20, 21]. The DTI parameters include fractional anisotropy (FA), mean diffusivity (MD), axial diffusivity (AD), and radial diffusivity (RD) [22], which provide valuable measurements of white matter integrity. For example, previous studies suggest that FA values increase with axonal density and myelination while axonal swelling and reductions in extracellular water decrease MD [23]. Changes in ad and RD have been associated with axonal and myelin injuries [24, 25].
Numerous studies have explored DTI analysis following mTBI, employing methods such as region‐of‐interest (ROI) and whole‐brain or voxel‐based approaches [26]. While ROI analysis is widely used and advantageous, it has limitations for TBI research due to the diffuse nature of axonal injury. However, abnormalities in diffusion and diffusion anisotropy in mTBI are frequently too minor to be identified through whole‐brain histogram analysis [27].
To unravel the complexities of mTBI, researchers turn to animal models, which enable a reduction in heterogeneity, longitudinal studies to assess test interventions, which together facilitate understanding of pathophysiological mechanisms and identify therapeutic targets [28, 29, 30]. Rodent models of injury, including the weight drop [31, 32, 33], fluid percussion injury (FPI) [34], controlled cortical impact (CCI) [21, 35, 36, 37, 38], closed head impact model of engineered rotational acceleration (CHIMERA) [39], and blast TBI [40], have significantly added to the understanding of cellular and systemic mechanisms associated with injury. The pig became an established experimental model for head injury [41, 42, 43, 44, 45, 46, 47, 48], recapitulating many of the important behavioral and pathophysiological changes experienced by humans and allowing for longitudinal neuroimaging with neurocognitive and physiological screening. Previously, we characterized the cognitive and behavioral performance of Yucatan minipigs throughout their development, which is essential to serve as a reference point for behavioral function [49]. Here, we developed a closed head mTBI model in adolescent minipigs. An electromagnetically driven impactor delivered an injury with a clinically relevant magnitude. T1‐based MRI contrast and DTI were used to characterize post‐concussive gray and white matter integrity in the months after the mTBI. In addition, neuropsychological screening for executive function and anxiety was performed a week prior to the injury and in the months following the injury. The results demonstrate DTI and volumetric abnormalities in pigs that underwent mTBI even months after the injury. The behavioral testing revealed that the mTBI pigs exhibited significant increases in anxiety and decreases in executive function. The anatomical changes detected by MRI may be contributing to long‐lasting functional deficits. This work could aid in developing better diagnostic tools and treatments for mTBI in youth.
2. Methods
2.1. mTBI Model
All procedures were approved by the Institutional Animal Care and Use Committee at Michigan State University.
Sixteen‐week‐old male (n = 4) and female (n = 8) Yucatan miniature pigs were used in this study, with six pigs in the sham group (4 female, 2 male) and six pigs in the mTBI group (4 female, 2 male). Pigs were housed in an enriched environment, fed nutritionally complete feed twice per day, with unrestricted access to water, while on a 12‐h (7:00 a.m. to 7:00 p.m.) light cycle. Each cohort included four individuals, two who underwent the mTBI procedure and two who underwent the sham procedure. Each cohort was housed together throughout the study. Midazolam (0.2 mg/kg) and butorphanol (0.2–0.4 mg/kg) were delivered intramuscularly as a premedicant. Then, an intravenous catheter was placed in a peripheral ear vein. The pig was than induced with ketamine at 5–10 mg/kg intravenously and orotracheally intubated. Sevoflurane and oxygen were used to maintain a surgical plane of general anesthesia. End‐tidal CO2 were maintained between 35 and 45 mmHg. End‐tidal CO2, oxygen saturation, blood pressure, and core body temperature were monitored throughout the duration of the surgical procedure and any abnormalities were corrected. Once a surgical plane of anesthesia was achieved, a skin and periosteal flap was created over the right coronal and sagittal suture. A custom designed sterile 3D printed disk (made of a digital blend of Vero Clear and Agilus30 [Stratasys]) was placed on the skull to protect the skull from fracture upon impact. Following impact, the periosteum and skin were closed in separate layers. Inhalant anesthesia was discontinued, and the pigs were extubated after they showed signs of recovering from anesthesia. Sham‐control pigs were anesthetized and intubated for the same duration of the injury protocol and underwent the same skin and periosteal incision and closure and received the same perioperative and operative medications. Pigs were pain scored after their surgical procedure to determine if additional analgesics were needed.
We developed an electromagnetically driven impactor to deliver highly controlled, reproducible impacts to the pigs' heads utilizing a linear motor (PS01‐37X120F‐HP‐C, LinMot USA Inc., WI, USA). This device enables precise adjustment of injury severity, as quantified by the severity index (SI), to simulate and study the mechanical forces involved in mTBI. The impactor (12.55 mm in diameter and 600 g in mass) was placed on the right side of the exposed skull at Bregma 0. Ultra‐high‐speed camera (Phantom V2512 Series) was used to record the impact kinematics and subsequent subject's movement at 20,000 frames per second with a spatial resolution of 1024 × 1024 pixels. An in‐house Matlab (R2018b) code was built to track specific features of interest in the frame utilizing a region growing algorithm approach. In order to visualize the linear momentum effects upon impact, the impactor tip and subject's eye were utilized as features of interest. The head displacement was measured by fitting a 4th‐order polynomial function. The velocity and acceleration were obtained with its 1st and 2nd derivatives, respectively.
2.2. MRI Data Acquisition
MRI was performed at 1 and 3 months after mTBI. Pigs underwent anesthesia as described above, and while in the MRI, they were maintained on a continuous intravenous infusion of propofol and inhaled oxygen. All data were acquired on a Siemens 1.5T system. The protocol included axial T2‐weighted fluid‐attenuated inversion recovery (FLAIR), DTI, axial gradient‐echo (GRE), and 3D axial T1‐weighted scans. The 3D‐T1 scan was acquired using the following parameters: TE/TR = 3.02/2400 ms, FA = 8°, NEX = 2, TI = 854 ms, FOV = 250 mm, matrix = 192 × 256; voxel size = 0.9766 × 0.9766 × 1 mm3, and acquisition time of 15.4 min. The DTI sequence was acquired in the axial plane, using 64 directions with b = 1000 s/mm2 and one B0 scan with the following parameters: TE/TR = 127/7900 ms, NEX = 1, FOV = 230 mm, matrix = 114 × 114, voxel size = 2 × 2 × 2 mm3, 40 slices, and acquisition time of 8.72 min. Two DTI scans were acquired: one with phase encoding from anterior to posterior and the other from posterior to anterior. This DTI sequence employs echo planar imaging (EPI) with a 2D acquisition approach and B0 reference images. Axial T2 fluid‐attenuated inversion recovery (FLAIR) (TR/TE/TI = 6520/82/2129.6 ms, FA = 150°, NEX = 2, FOV = 140 mm, voxel size = 0.7 × 0.5 × 3.0 mm3, and 30 slices). Axial gradient‐echo (GRE) (TR/TE = 1060/26 ms, FA = 20°, NEX = 2, FOV = 140 mm, voxel size = 0.7 × 0.5 × 3.0 mm3, and 30 slices) were acquired as well.
2.3. MRI Analysis
Manual brain skull stripping: The FSL package (Analysis Group, FMRIB, Oxford, UK) was used to create brain masks and registration. Brain extractions were performed by a single evaluator to minimize variability, without prior image intensity normalization before manual extraction. Representative brain masks are shown in Figure 1.
FIGURE 1.

T1‐weighted MRI scans. (A) T1‐weighted MRI scans of pig brains illustrating manual brain skull stripping across different planes (from left to right, sagittal, coronal, and axial plane, respectively). The planes show the brain with the manually drawn mask overlay used for skull stripping. The mask highlights the brain's boundaries, excluding the surrounding skull and non‐brain tissues. (B) Visualization of ROIs from the registered pig brain atlas (T1‐weighted) after transforming them to our T1 space. A subset of these ROIs is shown overlaid for reference, including the corpus callosum (yellow), cortex (brown), internal capsule (light blue), thalamus (green), hippocampus (dark blue), medulla (yellow), left caudate (red), olfactory bulb (teal), and pons (light blue).
2.4. Image Processing and Analysis
Initially, all diffusion images underwent preprocessing using FSL and MRtrix. This preprocessing encompassed several sequential steps: denoising to reduce noise from diffusion‐weighted images, followed by Gibbs ringing removal. Subsequently, motion and distortion and eddy current corrections were performed, brain masks were generated and applied to extract brain data from the preprocessed images. Finally, the diffusion tensor was computed, along with metrics including FA, MD, RD, and ad. Our methodology utilizes an automated, atlas‐driven approach, which minimizes the inconsistencies linked with manual region selection and improves reliability. We used a pig brain atlas [50] to examine changes in regional volume and DTI metrics in this study. The atlas is based on group‐averaged MR images of the pig brain and provides a parcellation map for major gray and matter structures. Registration of the atlas to the T1 scans were performed using the “antsRegistration” program from the advanced normalization tools (ANTs). The ROIs in the atlas were applied to co‐registered T1 and DTI data using the “antsApplyTransforms” program to measure structural volumes and mean FA, MD, RD, and ad values within each ROI.
2.5. Behavioral Testing
Behavioral testing began a week prior to the surgical procedure and continued for 8 weeks after the injury. The testing was conducted in a dedicated behavioral suite adjacent to the housing room. The experiments took place in an open behavior chamber measuring 1.83 m × 1.83 m. The structure consisted of walls made of PVC board which measured 1 m in height. A camera was suspended overhead to record activity and behavior. The concrete floor of the chamber was cleaned with water between subjects. Each test was administered once a week, except for week five because of the imaging procedure occurring at that time.
Open field test (OFT): Pigs were brought individually to the behavioral chamber. The pig was allowed to explore the chamber for 10 min while activity was recorded. Motion tracking and analysis were conducted using DeepLabCut [51]. The software was first trained to identify the pig's snot, both ears, neck, and tail, in multiple poses. This trained model was then used to analyze all open field recordings, and the movement coordinates were extracted [52, 53]. The coordinates were imported to RStudio where the distance was calculated using a custom‐written series of code as we described previously in Netzley et al. [49, 54].
Escapes: The number of escape attempts pigs made during the 10‐min open field was counted. These behaviors included rooting at the bottom or pushing against the walls of the chamber and jumping or rearing up against the walls. This behavior could indicate anxiety levels.
Novel object recognition (NOR): The test was conducted in two parts: the habituation phase and the test phase. In the habituation phase, pigs were led individually to the behavioral chamber and exposed to two identical objects. Pigs were allowed to explore the objects for the 10‐min testing period, and all activity was recorded. Each pig was then returned to the housing room for an hour. Following this interval, the pig was again led to the behavioral chamber and presented with one familiar object from the habituation phase and one new object that it had not seen before. The pig was allowed to explore the objects for 10 min, after which the pigs were returned to the housing room. The number of contacts the pig made with both objects was counted, and the percent number of contacts the pig made with the new object was calculated.
2.6. Histopathology
At the endpoint, the brains were removed and placed overnight in 4% PFA. Eight brains were used for the analysis: n = 4 mTBI pigs and n = 4 sham pigs. Ten sections of 4 μm brain sections were obtained from the frontal cortex every 500 mm. Staining for luxol fast blue (LFB) was performed according to [21]. For each individual, the right and left brain sections at the corpus callosum level were analyzed. An ROI was selected in the radiatio corporis callosi (RCC). The average intensity of the ROI indicating cellular uptake of stain was calculated using a custom macro with ImageJ (NIH) for each image. ROI intensity was averaged across group. A two‐tailed Student's t‐test was used for statistical analysis.
2.7. Statistical Analysis
Analyses of DTI parameters, along with variations in white matter and gray matter volumes, were executed using statistical modules available in GraphPad Prism. We hypothesized that individuals with mTBI demonstrate white matter tract damage, evidenced by changes in FA and volume, relative to the sham group at the 1‐month and 3‐month time points. To test this hypothesis, cross‐sectional comparisons were conducted with two sample t‐tests for each respective time point. Furthermore, to explore longitudinal changes within each cohort, we employed paired comparisons or paired t‐tests for both the mTBI and sham groups. All the tests were conducted as two‐tailed. Moreover, to control for Type I error, p‐values were adjusted using the Bonferroni correction method, accounting for the number of tests conducted in the multiple comparisons of the volumetric analysis. To investigate the impact of gender, we performed a mixed model analysis. This method enables us to consider fixed effects, such as gender, group, and time point, while also accounting for subject variation as random effects. For the behavioral data, we conducted unpaired parametric t‐tests between groups. All data were tested for normality using the Shapiro–Wilk test to assess their distribution.
2.8. Classification Model
A machine learning approach to build a reliable model to classify pigs into two groups: mTBI and sham. The features that were selected to be included in the model were those who demonstrated significance in the previous analysis, specifically, the FA and the volume of white matter structures and the behavioral outcomes obtained from the three behavioral tests. Together, there were 12 MRI related features and three behavior features. The support vector machine (SVM), which is considered to be well suited for small to medium data sets, was used for classification. SVM is a supervised machine learning algorithm primarily used for classification tasks. It works by finding the optimal hyperplane that best separates the classes in the feature space. We used a polynomial kernel because our dataset is likely not linearly separable.
3. Results
3.1. Kinematics of Injury
Full displacement of the subject and impactor was recorded to characterize the impact kinematics and mechanical response upon impact in one individual. Tracking the impactor showed that it reached a peak speed of 3.7 m/s with an average 30 g acceleration. Using the pig's eye as a marker, its displacement and velocity were derived to obtain an experienced maximum acceleration of approximately 15 g. Experimental data demonstrating the eye's displacement, velocity, and acceleration due to the impact of three trials is illustrated in Figure 2.
FIGURE 2.

Kinematics of head injury. Kinematics of injury for head's rigid motion using the eye as tracking marker. Displacements were calculated with a MATLAB custom‐built code for image processing, applying a polynomial fit and then derived for velocity and acceleration. The graphs depict the results of three tests in one individual (T1, T2, and T3).
3.2. Volumetric Analysis
The volume of the brain region can be an important indicator of abnormal function associated with brain trauma. For the volumetric analysis, both white matter and gray matter regions were examined. Table 1 shows the results of the volumetric analysis.
TABLE 1.
Volume changes in mTBI and sham pigs across brain regions: 1‐ and 3‐month analysis with percentage change and t‐test results .
| Region of interest | mTBI | Sham | mTBI vs. sham | |||||||
|---|---|---|---|---|---|---|---|---|---|---|
| 1‐month (mean ± SD) mm3 | 3‐month (mean ± SD) mm3 | % of change | p value | 1‐month (mean ± SD) mm3 | 3‐month (mean ± SD) mm3 | % of change | p value | p value (1‐month) | p value (3‐month) | |
| Corpus callosum | 1104 ± 102 | 1228 ± 91 | 11.23 | 0.001** | 1059 ± 158.0 | 1182 ± 169.9 | 11.61 | 0.059 | 0.58 | 0.58 |
| Left internal capsule | 1672 ± 152 | 1822 ± 154 | 8.97 | 0.006* | 1657 ± 168.5 | 1839 ± 236.1 | 10.98 | 0.049* | 0.87 | 0.88 |
| Right internal capsule | 1728 ± 139 | 1904 ± 197 | 10.19 | 0.007* | 1698 ± 188.2 | 1882 ± 202.2 | 10.84 | 0.039* | 0.76 | 0.85 |
| Left cortex | 37,140 ± 2747 | 39,411 ± 2820 | 6.11 | 0.008* | 37,071 ± 4532.6 | 40,312 ± 6125.6 | 8.74 | 0.089 | 0.98 | 0.75 |
| Right cortex | 36,638 ± 2503 | 39,191 ± 3070 | 6.97 | 0.004* | 36,430 ± 3908 | 39,576 ± 6042 | 8.64 | 0.085 | 0.91 | 0.89 |
| Left hippocampus | 1122 ± 181 | 1226 ± 180 | 9.27 | 0.0056* | 1112 ± 122 | 1158 ± 163.9 | 4.14 | 0.576 | 0.92 | 0.51 |
| Right hippocampus | 1131 ± 148 | 1232 ± 135 | 8.93 | 0.0016* | 1121 ± 149 | 1174 ± 239.5 | 4.73 | 0.507 | 0.91 | 0.62 |
| Cerebellum | 15,331 ± 101 | 15,934 ± 904 | 3.93 | 0.099 | 15,287 ± 2380 | 14,539 ± 2495.1 | 4.89 | 0.463 | 0.97 | 0.22 |
| Thalamus | 2843 ± 167 | 2994 ± 127 | 5.31 | 0.01* | 2856 ± 269 | 2972 ± 314.7 | 4.06 | 0.449 | 0.92 | 0.88 |
The volume of the corpus callosum in mTBI pigs was found to significantly increase between 1 and 3 months after injury. The data in the table indicate that all white matter regions, including the left and right internal capsule, exhibited volume increases over time in both mTBI and sham groups. However, the increase was more pronounced in the mTBI group.
In addition, the majority of gray matter regions in the left and right cortex, left and right hippocampus, and thalamus exhibited a notable increase in volume in the mTBI groups. In contrast, the cerebellum did not demonstrate any volumetric changes in either the mTBI or sham groups (Figure 3).
FIGURE 3.

Volumetric analysis. Displays representative maps of the white and gray matter regions alongside their corresponding group analysis results (mTBI, n = 6; sham, n = 6; avg ± SEM; Student's t‐test, *p < 0.05; **significant at p < 0.003).
We conducted an additional comparison to compare volume changes between the left and right internal capsules in pigs with mTBI compared with sham. Consistent with the DTI results, volume alterations were observed solely in the mTBI pigs at both 1 and 3 months. Notably, the volume of the right internal capsule seemed to increase more than that of the left as shown in Figure 4.
FIGURE 4.
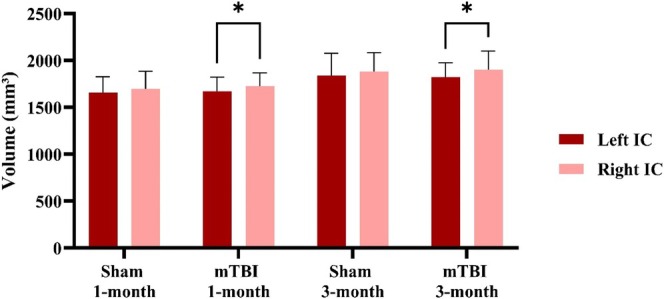
Volumetric differences in left and right internal capsule post‐mTBI. This volumetric comparison of the left and right internal capsule. The results demonstrate that in the mTBI group there were significant differences between the left and the right internal capsule at both time points after injury (mTBI, n = 6; sham, n = 6; avg ± SEM; Student's t‐test, *p < 0.05).
While several significant changes in volume were observed within each group at the different time points, no significant difference was found between mTBI and sham groups at the specific time points. In addition, no noticeable changes were detected in either the FLAIR or GRE images.
3.3. Volumetric Asymmetry Index (AI)
In order to quantify the asymmetry between left and right hippocampus and left and right internal capsule similar to few studies [55, 56]. This index can help detecting abnormalities such as those caused by brain injuries or developmental conditions. A relative volumetric AI was calculated using this formula.
VAI = (Vleft − Vright / Vmean)where Vleft represents the left hemisphere volume, Vright corresponds to the right hemisphere volume, and Vmean is the mean between the left and right volumes. The AI is provided for the internal capsule and hippocampus in Table 2.
TABLE 2.
AI in of brain structures in mTBI and control pigs. The mean volume (mm3) and asymmetry index (%) are assessed at two time points. AI measures the volumetric differences between the left and right hemispheres, with data presented as group averages.
| Brain structure | mTBI (n = 6) | Sham (n = 6) | |||
|---|---|---|---|---|---|
| Mean volume (mm3) | AI (%) | Mean volume (mm3) | AI (%) | ||
| Hippocampus | Left (1‐month) | 1121.84 | −0.79 | 1112.46 | −0.74 |
| Right (1‐month) | 1130.74 | 1120.73 | |||
| Left 3‐month) | 1226.43 | −0.44 | 1157.76 | −1.42 | |
| Right (3‐month) | 1231.83 | 1174.29 | |||
| Internal capsule | Left (1‐month) | 1672.43 | −3.24 | 1657.33 | −2.44 |
| Right (1‐month) | 1727.58 | 1698.18 | |||
| Left (3‐month) | 1821.84 | −4.39 | 1839.00 | −2.3 | |
| Right (3‐month) | 1903.69 | 1881.76 | |||
In agreement with the volumetric and the FA results, the AI of the internal capsule is higher in the mTBI group compared with the control group, which means greater asymmetry. In both groups, the negative AI suggests that the right hemisphere is larger than the left. The AI of the hippocampus showed minimal differences between the groups.
3.4. DTI Results
FA maps are shown in Figure 5 for both mTBI and sham pigs.
FIGURE 5.
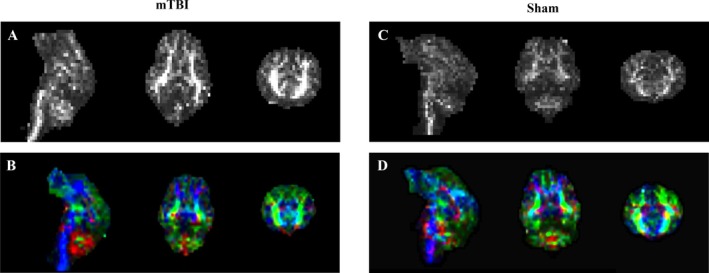
FA maps in grayscale and color‐coded orientations. Left: FA maps (A) in grayscale (sagittal, transverse, and coronal planes, respectively), and FA maps (B) in color code for one mTBI pig. Right: FA maps (C) in grayscale, and FA map (D) in color code for a sham pig. Color codes for orientation are as follows: red indicates left to right, green represents anterior to posterior, and blue denotes superior to inferior.
Table 3 shows the DTI parameters of white matter integrity that were calculated for each subject at 1‐and 3‐month post‐injury.
TABLE 3.
DTI parameters of white matter tracts for the mTBI and sham groups at 1 and 3 months after injury including p‐values for group comparisons and within‐group comparisons between 1‐ and 3‐month time points (mTBI, n = 6; sham, n = 6).
| Structure and parameters | mTBI | Sham | mTBI vs. sham | |||||
|---|---|---|---|---|---|---|---|---|
| 1‐month (mean ± SD) | 3‐month (mean ± SD) | p‐value | 1‐month (mean ± SD) | 3‐month (mean ± SD) | p‐value | p‐value (1‐month) | p‐value (3‐ month) | |
| Corpus callosum | ||||||||
| FA | 0.19 ± 0.02 | 0.23 ± 0.03 | 0.037 a | 0.21 ± 0.01 | 0.22 ± 0.02 | 0.7 | 0.05 | 0.52 |
| ad (10−3 mm2/s) | 1.95 ± 0.35 | 1.47 ± 0.35 | 0.04 a | 1.88 ± 0.28 | 1.42 ± 0.26 | 0.02 a | 0.71 | 0.81 |
| RD (10−3 mm2/s) | 1.53 ± 0.29 | 1.12 ± 0.31 | 0.046 a | 1.44 ± 0.24 | 1.08 ± 0.20 | 0.02 a | 0.58 | 0.80 |
| MD (10−3 mm2/s) | 1.67 ± 0.31 | 1.24 ± 0.32 | 0.04 a | 1.59 ± 0.25 | 1.20 ± 0.22 | 0.02 a | 0.62 | 0.81 |
| Left internal capsule | ||||||||
| FA | 0.56 ± 0.06 | 0.56 ± 0.04 | 0.75 | 0.53 ± 0.05 | 0.54 ± 0.03 | 0.68 | 0.42 | 0.24 |
| ad (10−3 mm2/s) | 1.20 ± 0.06 | 1.14 ± 0.07 | 0.16 | 1.16 ± 0.06 | 1.16 ± 0.09 | 0.91 | 0.22 | 0.70 |
| RD (10−3 mm2/s) | 0.47 ± 0.08 | 0.43 ± 0.04 | 0.27 | 0.48 ± 0.06 | 0.47 ± 0.04 | 0.59 | 0.85 | 0.20 |
| MD (10−3 mm2/s) | 0.72 ± 0.07 | 0.67 ± 0.04 | 0.18 | 0.71 ± 0.05 | 0.76 ± 0.17 | 0.51 | 0.80 | 0.27 |
| Right internal capsule | ||||||||
| FA | 0.53 ± 0.07 | 0.52 ± 0.06 | 0.75 | 0.54 ± 0.07 | 0.52 ± 0.04 | 0.68 | 0.43 | 0.24 |
| ad (10−3 mm2/s) | 1.17 ± 0.06 | 1.16 ± 0.07 | 0.58 | 1.12 ± 0.05 | 1.15 ± 0.09 | 0.60 | 0.17 | 0.96 |
| RD (10−3 mm2/s) | 0.48 ± 0.09 | 0.49 ± 0.07 | 0.75 | 0.46 ± 0.06 | 0.49 ± 0.03 | 0.23 | 0.58 | 0.93 |
| MD (10−3 mm2/s) | 0.71 ± 0.07 | 0.71 ± 0.06 | 0.93 | 0.68 ± 0.04 | 0.71 ± 0.04 | 0.098 | 0.36 | 0.92 |
DTI parameters of white matter tracts for the mTBI and sham groups at 1 and 3 months after injury including p‐values for group comparisons and within‐group comparisons between 1‐ and 3‐month time points (mTBI, n = 6; sham, n = 6; Student's t‐test, *p < 0.05).
Results indicate that mTBI pigs show a significant increase in FA values of the corpus callosum at 3 months compared with 1 month (paired t‐test, p = 0.037). Sham pigs did not show any difference in FA values over this time period (Figure 6A). Analysis of MD, RD, and ad values demonstrated that there is a significant decrease between 1‐ and 3‐month post procedure, in both mTBI and sham animals, suggesting that these variables reflect changes in brain maturation occurring across all groups.
FIGURE 6.
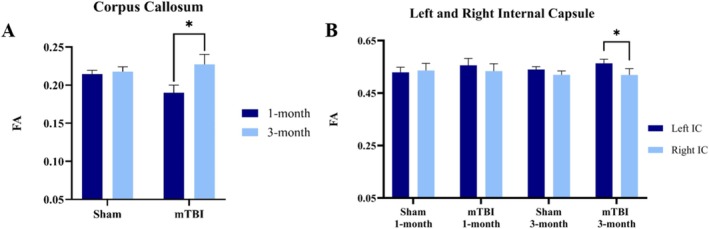
FA changes in corpus callosum and internal capsule post‐mTBI. (A) FA changes in the corpus callosum between 1‐ and 3‐month post‐injury. The graphs depict the mean differences between mTBI and sham groups at the two time points. mTBI group shows a significant increase in FA from 1‐ to 3‐month post‐injury. (B) The comparison of FA values between left and right internal capsule for both group and each time point. At 3‐month post injury, the FA values in the right internal capsule are significantly lower compared with the left one in the mTBI group (mTBI, n = 6; sham, n = 6; avg ± SEM; Student's t‐test, *p < 0.05).
The DTI variables were calculated for the right and left internal capsule, which is part of the corticospinal pathway. The results show that there was a significant difference in FA values between the right and the left internal capsule at 3 months after injury in mTBI pigs and is illustrated in Figure 6B. Specifically, the right internal capsule showed lower FA values compared with the left one, which is consistent with the location of the TBI impact to be over the right frontal cortex.
Similar to the volumetric analysis, although several significant changes in FA were observed within each group at the different time points, no significant difference was found between mTBI and sham groups at the specific time points.
The mixed model analysis that was performed indicated that the interaction between gender and group was not significant (p > 0.05) for both the corpus callosum and the left and right internal capsule, suggesting that gender does not have an effect on the results.
3.5. Behavioral Analysis
The behavioral testing started a week prior to the injury in order to obtain a baseline for each individual animal. After the procedure, each behavioral test was administered once a week, and the values were normalized according to the baseline values for each individual. The OFT showed that mTBI pigs traveled a significantly greater distance compared with the sham pigs (t‐test, p = 0.0004). The number of escape attempts performed by the pigs during 10 min in the open field enclosure showed that mTBI pigs made significantly more attempts (t‐test, p = 0.0015). The NOR test showed that mTBI pigs were less likely to engage with novel objects (t‐test, p = 0.0033). The disinterest that the mTBI pigs showed in this test may indicate memory defects and potential signs of depression. The distribution of temporal data and the group means for each cognitive test is presented in Figure 7.
FIGURE 7.

Behavioral assessment of mTBI and sham pigs. The results from the open field test revealed that mTBI pigs traveled a significantly greater distance than sham pigs. (A) The normalized distance traveled by the pigs over a 10‐min period in the weeks following the injury. (B) Displays the group mean distance walked. (C) The normalized number of escape attempts in the weeks following the injury. (D) Group means for the number of escape attempts show a significant increase in mTBI pigs. (E) The novel object recognition test recorded the number of interactions with a novel object for each pig, normalized to the pre‐injury baseline. (F) Shows a substantial decrease in group means for mTBI pigs (n = 6 mTBI, n = 6 sham control, average ± SEM, **p < 0.005, ***p < 0.0005).
3.6. Predictive Modeling and Exploratory Associations
We conducted an exploratory Pearson correlation analysis to examine potential associations between brain imaging features and behavioral outcomes, guided by prior studies [57]. Imaging variables included FA and volume measurements from the corpus callosum and left/right internal capsules, along with hippocampal volumes, assessed at both 1 and 3 months. Behavioral measures were derived from the OFT, escape test, and NOR test. Notably, a significant positive correlation was found between the distance traveled in the OFT and the volume of the right hippocampus at 1 month (p < 0.05). Other variables, such as corpus callosum volume at 1 and 3 months, showed trends toward significance (e.g., p = 0.05) but did not meet conventional thresholds. These results are visualized in Figure 8 as a Pearson correlation heatmap annotated with individual p‐values.
FIGURE 8.

Correlation heatmap of behavioral test outcomes with imaging data. The heatmap illustrates the Pearson correlation analysis between behavioral test and other imaging features like FA and volume from brain regions corpus callosum, left and right hemispheres of internal capsule and hippocampus at 1‐ and 3‐month post injury using R‐squared (R 2), which indicates the proportion of variance in one variable explained by others. The color gradient represents the strength of the R 2, where darker shades indicate stronger correlations and lighter shades represent weaker or no correlation. Significant p‐values (p < 0.05) are highlighted with an asterisk (*) to indicate meaningful correlation that meet the threshold for statistical significance. The x‐axis lists the target features, while the y‐axis lists the contributing features.
We then used SVM to build a reliable model to classify pigs into two groups: mTBI and sham. The results of the SVM over 100 iterations showed that it was possible to classify mTBI and sham control pigs with 67% accuracy. The confusion matrix further elucidates the model's performance by quantifying the distribution of true positives (TP), false positives (FP), true negatives (TN), and false negatives (FN). The visualization of this analysis is presented in Figure 9.
FIGURE 9.

SVM model with polynomial kernel. (A) The contour plot (as shown in our results) illustrate how different feature combinations influence classification. The red and blue regions represent the model's decision areas for mTBI and control groups, respectively. The contour lines show areas where the model is uncertain or where class boundaries lie. The circles are the individual pigs classified into mTBI (red) or control (blue). There were four misclassified cases where some blue points fall into the red region (or vice versa). (B) The confusion matrix helps assess the accuracy and error types of the classifier, showing the balance between correct and incorrect predictions for both classes.
3.7. Histology
Post‐mortem histology of LFB, an indicator of white matter, has been performed. Figure 10 shows representative LFB staining on 4 μm brain slice obtained from the frontal cortex. An area within the RCC was analyzed depicted by the yellow circle in Figure 10, and the results indicate that mTBI pigs showed a significant decrease of 3.24% in LFB staining compared with sham (mTBI, n = 4; sham n = 4; Student's t‐test, p < 0.05).
FIGURE 10.

Histological analysis. Luxol fast blue histology. Left: Pig anatomical atlas overlayed on the LFB histology. An image of 4‐μm thick brain slice stained for LFB showing the area of the RCC that was analyzed to evaluate myelin in the pig's brain. Right: A 40× magnification of the area shows myelin architecture with high resolution.
4. Discussion
The characteristics of the closed‐head mTBI model in adolescent pigs mimicked an injury with a clinically relevant magnitude, comparable to mTBI in pig models reported by other groups [58], and coincides with the magnitude of injury reported in youth sports [59, 60, 61]. The model induced long‐term changes in the integrity of white matter tracts and brain structures that may be clinically translational. A longitudinal study that incorporates age‐comparable reference data offers insights into the maturation of white matter over time, which is important for assessing MRI data from children due to their developing brain [62]. Our study's use of a youth animal model with a unique image acquisition timeline minimizes age‐related variability in the results [63]. This work demonstrate that mTBI in the pig model induces both neuroimaging changes and neurocognitive deficits.
In this study, we focused on the internal capsule and corpus callosum, consistent with previous research [64]. The corpus callosum is particularly susceptible to traumatic injury, regardless of biomechanical factors or injury severity [65, 66, 67].
Previous research has documented a rise in FA values in the corpus callosum approximately 3 days post‐injury in adults and 6 days post‐injury in young children [68]. Increased anisotropic diffusion can be more pronounced and prolonged in youth mTBI [69]. A study that replicated their earlier results found higher anisotropic diffusion and lower RD in the genu of the corpus callosum [70]. The observed increase in FA values is likely due to axonal swelling, extended mild cytotoxic edema [71], neuroinflammation, occurring during the sub‐acute phase of injury [72]. Secondary cerebral swelling; axonal injury; and inflammation and regeneration also contribute to secondary injury in infants. In current research, FA in the corpus callosum for the mTBI pigs increased over time from 1 to 3 months indicating callosal damage [73]. While an increase in FA might suggest a normal myelination process over time [74, 75], the changes observed in the sham group imply that the FA alterations may not be attributable to typical axonal development in the youth brain. Studies have detected unusually high FA in the corpus callosum [76] and internal capsule [64], which is thought to result from an influx of intracellular water or changes in the concentration of extracellular water restricting the diffusion [77] more frequently observed in a developing brain. Another study has evaluated it as reorganization of WM tract due to plasticity [78] An upward trend in FA is frequently observed in athletes or individuals with sports‐related concussions. This trend is hypothesized to result from processes such as axonal budding [79] and growth, or the formation of glial scar [80]. Research utilizing neurite orientation dispersion and density imaging parameters further supports the hypothesis that there is an increase in neurite density following injury [81].
Within the mTBI groups, changes in internal capsules were not significant over time. However, a temporal effect was observed, as FA decreased over time in the right internal capsule compared with the left in the mTBI group indicative of injured white matter area. The reduction in FA values in the right internal capsule compared with the left at 3 months post injury is likely attributable to the impact affecting the ipsilateral side of the internal capsule significantly. Such reduction in FA during late post injury may reflect disruption in axonal transport, axonal swelling, demyelination or Wallerian degeneration. Results showed significant differences in diffusion characteristics between affected white matter regions and contralateral homologous regions (left and right internal capsule) in patients with mTBI [82]. The current findings also indicate that the decrease in FA over the 3 months after the injury could be indicative of Wallerian degeneration in the affected neurons.
Different trends in diffusion changes associated with mTBI have been documented; in human youth mTBI, both higher [83] and lower FA [84] following injury were found. In the present study, we did not detect a group effect. Indeed, previous research has shown minimal differences between mTBI and sham groups, suggesting that the TBI group was only mildly affected, with subtle changes in white matter structure [27]. Unlike our findings, other ROI‐based studies have identified significant group differences in several brain areas associated with mTBI. Notable differences were observed in the genu and splenium of the corpus callosum and the posterior limb of the internal capsule [84]. Additionally, differences were found in the anterior corona radiata, uncinate fasciculus, and cortico‐spinal tract, as well as in the sagittal stratum and superior longitudinal fasciculus [85, 86, 87]. However, null findings have also been reported, revealing no differences between groups in 20 white matter tracts [88], corpus callosum [86], voxel‐based morphometry (VBM) analysis [89], and tract‐based spatial statistics (TBSS) study on athletic concussion [90]. Therefore, the current findings offer evidence of diffusion abnormalities.
Another study on closed head injury animal models emphasized the dominance of cellular edema during acute period of post‐injury [91]. A case study of an infant observed a transient increase in both FA and MD in gray matter regions reflecting complex interaction between cytotoxic and vasogenic edema [92]. Sometimes the higher FA is believed to be due to restricting the sample to voxels with more homogeneous fiber orientation [93]. Another study examining the longitudinal changes in the corpus callosum microstructure in children found a significant increase in FA only in the sham group, supporting the notion of abnormal white matter maturation in children with mTBI [73].
In examining brain volume alterations in mTBI, regions like the corpus callosum, thalamus, hippocampus, hypothalamus, and cerebellum are regarded as particularly susceptible due to their extensive connections with other brain areas. Studies specifically focusing on hippocampal volume are scarce, but any observed changes in this region could be significant for understanding the long‐term impacts of mTBI [94]. For the thalamus, while most research indicates atrophy, a study by Munivenkatappa et al. [95] reported an increase in thalamic volume at a three‐month follow‐up. Similarly, Obermann et al. [96], suggested that increases in gray matter in the thalamus and cerebellum might result from adjustments in pain tolerance following injury. Conversely, although general brain atrophy is commonly observed, some studies have found abnormal enlargement in subcortical regions like the thalamus, amygdala, and hippocampus, potentially due to hyperactivity, hypertrophy, and neuroinflammation [97].
The present study did not identify any significant group‐level differences in white or gray matter volumes related to mTBI but showed longitudinal in‐group changes. Previous research has reported changes in white matter volume in youth from post‐acute scans, but no changes in gray matter volume [18]. Volumetric analysis shows a significant increase in brain volume for the corpus callosum only in the mTBI group supports the theory that traumatic brain edema causes swelling and increases brain tissue water content [98, 99]. The white matter areas such as the left and right internal capsules, mTBI pigs showed more significant volume changes over time compared with sham. Additionally, only mTBI pigs exhibited a significant expansion in volume in gray matter regions, including the cortex, thalamus, and hippocampus, likely due to brain edema. Quantitative analyses have shown significant atrophy in gray matter regions such as the cerebral cortex, thalamus, and hippocampus within 2 months to 1‐year post‐injury in rats [37, 100]. A longitudinal study found that TBI leads to ongoing atrophy in the corpus callosum, thalamus, and hippocampus for up to 1–5 years, with an increase in ventricular volume, indicating a prolonged impact on brain volumes [101]. However, some studies reported no significant volume loss in these gray matter regions, as well as in white matter regions like the internal capsule and corpus callosum.
Similar to our analysis, several studies [56, 102] have reported different asymmetry in hippocampal volume in individuals with disorders. Incorporating such asymmetrical MR volumetry into clinical workflows improves the accuracy and clinical utility of detecting hippocampal atrophy [103].
This work was designed to identify if neuroimaging could be used to predict neurobehavioral deficits associated with injury. Both preinjury and postinjury behavioral data were acquired. This is important because preinjury adaptive behavioral skills may be a predictor of personality changes and psychiatric complications after TBI in children and youth [104, 105]. Often in children a preinjury report is missing. This work provided the opportunity to acquire a full and comprehensive report of preinjury behavioral function for the experimental population, which allowed to assess individual changes in cognitive performance. The results show that mTBI pigs demonstrated significant changes in their behavior immediately after mTBI and in the weeks and months following it. OFT has been used for evaluating exploratory behavior and overall activity in animals [106] especially in rats and mice [107]. The OFT measures more than just motor activity, encompassing factors like curiosity (exploratory drive) and anxiety. A great body of literature demonstrates that TBI in rats results in significant behavioral changes in this test [108, 109]. Our OFT revealed enhanced locomotor activity in mTBI pigs, which aligns with findings from a previous study using a pediatric rat model [36], potentially indicating anxiety or fear as they attempt to escape. Behavioral measures in the OFT are valuable for assessing pigs' emotionality and welfare [110]. A memory test was performed using the NOR test [111, 112] once a week. The results indicated that mTBI pigs exhibit significantly less interest in interacting with new toys, a possible sign of memory impairment and depression. Similar to our study, another study of rats with mTBI showed a deficit in the NOR test indicating long‐term cognitive impairments [113, 114]. Because the impact was delivered over the frontal cortex, it is expected that the executive functions are going to be implicated [115]. Importantly, we found that the imaging data were associated with the behavior data. Specifically, the white matter tracks and abnormal hippocampus volume could be related to the impaired memory measured with the NOR in the mTBI pigs. Indeed, previous research has demonstrated associations between decreased FA in several ROIs, such as the corpus callosum, internal capsule, and centrum semiovale, and impairments in cognitive functions, including attention and memory [85, 86]. Additionally, studies have revealed an association between the volume of brain regions and cognitive functions like memory in TBI patients [116]. Other studies have emphasized the relationship between memory deficits and MRI‐derived volumetric measures, especially hippocampal size, even up to 30 years post‐TBI [117]. Several studies have also identified neurological deficits linked to trauma‐related MRI abnormalities in the frontal lobe, commonly associated with mTBI and cognitive dysfunction [118]. The behavioral changes detected in this study are also well‐documented in athletes who suffered a cuncussion [119]. The results from the pig mTBI model align with those documented in human patients, and this model could be valuable to continue and determine the impact of white matter damage on cognitive abilities and assess long lasting cognitive deficits after concussion in children and youth.
We utilized a supervised machine learning model, SVM with a polynomial kernel, and used principal component analysis (PCA) for feature reduction to classify mTBI and control subjects, achieving a moderate accuracy of 67%. While the confusion matrix provided insights into the model performance, the results underscore the need for further refinement. Additionally exploratory correlation anlysis identified potential association between MRI metrics and behavioral outcomes. Given the limited sample size and the exploratory nature of the study, multiple comparisons correction was not applied, as such methods could be overly conservative and risk obscuring meaningful patterns in underpowered datasets. Only one correlation reached statistical significance without correction. Therefore, uncorrected p‐values are reported to minimize Type II error and to facilitate hypothesis generation for future, larger‐scale studies. Furthermore, the identification of high‐value biomarkers, including fluid, tissue, and imaging markers, such as glial fibrillary acidic protein (GFAP) [120], could significantly enhance predictive modeling for TBI outcomes. These biomarkers, as demonstrated in large dataset studies like AUS‐TBI [121], offer strong predictive value, with their clinical utility being influenced by factors like sample timing and context, suggesting they could complement MRI and behavioral data in refining TBI diagnosis and prognosis.
Future studies with increased sample size may reveal DTI changes that have been too subtle to be identified here. The use of representative regions rather than the whole white matter structures may have introduced some bias into the results. The limited group size may have not captured the full natural variability across individuals as may be suggested by the high variability in volume size measured in the sham group. Furthermore, ROI analyses can be problematic due to the low resolution of DTI maps and the unavoidable partial volume effects. The corpus callosum is especially susceptible to partial volume effect due to adjacent cerebrospinal fluid, with this effect being more pronounced when DTI voxels have bigger size along the z‐axis [122]. Thus, this method may diminish sensitivity to small lesions. It will be important to obtain pre‐injury DTI metrics to identify intra‐individual changes. The use of varying approaches can occasionally lead to inconsistencies in the results. This highlights the sensitivity of DTI to white matter damage during both the sub‐acute and chronic phases, underscoring the importance of conducting longitudinal studies or follow‐up assessments post‐injury. A study found that in children with mTBI, abnormal white matter maturation in the corpus callosum was resolved within 6–8 months, suggesting the need for more research into white matter recovery and the developing brain's vulnerability to mTBI [73].
In conclusion, this work shows that long term cognitive impairments after concussion in a pig model can be visualized with MRI biomarkers. This translational model is important both for diagnostic purposes and for clinical management of patients.
5. Transparency, Rigor, and Reproducibility Summary
Rigor and reproducibility: The design and statistical analysis associated with this project was performed with a biostatistician. p‐values were corrected by multiple testing using Bonferroni correction. Basic statistical inference was performed in all points of measurements. To determine statistical significance between mean of groups, we used t‐test (for experiments with two categories). mTBI sequela effects was tested by gender as a variable. The statistics was done with R and GraphPad prism. Randomization: Pigs were randomly assigned to experimental and sham groups. Both genders were included. Blinding: Each cohort of pigs included both experimental and sham animals. The veterinary staff who performed the surgical procedures kept the health records for each individual and assigned a code. Apart from the injury itself, both experimental and sham‐control pigs underwent similar surgical procedures and received similar post‐operative treatment. This eliminated the ability for blinded observers to easily tell which pig has received an impact. The investigators who perform the MRI imaging analysis received only the code for each subject and were blinded to the group it belongs to. The power analysis was based on preliminary data consisting of mTBI and control groups. The preliminary data showed that the interindividual variation is higher than the residual variance and a sample size of n = 6 experimental pigs, and n = 6 control pigs is needed to reach a power of 0.8 and a significance level of 0.05 (2‐sides).
Data Availability Statement
The data that support the findings of this study are available from the corresponding author upon reasonable request.
References
- 1. Araki T., Yokota H., and Morita A., “Pediatric Traumatic Brain Injury: Characteristic Features, Diagnosis, and Management,” Neurologia Medico‐Chirurgica 57, no. 2 (2017): 82–93, 10.2176/nmc.ra.2016-0191. [DOI] [PMC free article] [PubMed] [Google Scholar]
- 2. Ruff R. M., Iverson G. L., Barth J. T., Bush S. S., Broshek D. K., and Committee NPaP , “Recommendations for Diagnosing a Mild Traumatic Brain Injury: A National Academy of Neuropsychology Education Paper,” Archives of Clinical Neuropsychology 24, no. 1 (2009): 3–10, 10.1093/arclin/acp006. [DOI] [PubMed] [Google Scholar]
- 3. Centers for Disease Control and Prevention , “Nonfatal Traumatic Brain Injuries Related to Sports and Recreation Activities Among Persons Aged ≤19 Years—United States, 2001–2009,” MMWR. Morbidity and Mortality Weekly Report 60, no. 39 (2011): 1337–1342. [PubMed] [Google Scholar]
- 4. Fried E., Balla U., Catalogna M., et al., “Persistent Post‐Concussive Syndrome in Children After Mild Traumatic Brain Injury Is Prevalent and Vastly Underdiagnosed,” Scientific Reports 12, no. 1 (2022): 4364, 10.1038/s41598-022-08302-0. [DOI] [PMC free article] [PubMed] [Google Scholar]
- 5. Ewing‐Cobbs L., Cox C. S., Clark A. E., Holubkov R., and Keenan H. T., “Persistent Postconcussion Symptoms After Injury,” Pediatrics 142, no. 5 (2018): e20180939, 10.1542/peds.2018-0939. [DOI] [PMC free article] [PubMed] [Google Scholar]
- 6. Barlow K. M., Crawford S., Stevenson A., Sandhu S. S., Belanger F., and Dewey D., “Epidemiology of Postconcussion Syndrome in Pediatric Mild Traumatic Brain Injury,” Pediatrics 126, no. 2 (2010): e374–e381, 10.1542/peds.2009-0925. [DOI] [PubMed] [Google Scholar]
- 7. Ponsford J., Nguyen S., Downing M., et al., “Factors Associated With Persistent Post‐Concussion Symptoms Following Mild Traumatic Brain Injury in Adults,” Journal of Rehabilitation Medicine 51, no. 1 (2019): 32–39, 10.2340/16501977-2492. [DOI] [PubMed] [Google Scholar]
- 8. Sterr A., Herron K. A., Hayward C., and Montaldi D., “Are Mild Head Injuries as Mild as We Think? Neurobehavioral Concomitants of Chronic Post‐Concussion Syndrome,” BMC Neurology 6, no. 7 (2006), 10.1186/1471-2377-6-7. [DOI] [PMC free article] [PubMed] [Google Scholar]
- 9. Machamer J., Temkin N., Dikmen S., et al., “Symptom Frequency and Persistence in the First Year After Traumatic Brain Injury: A TRACK‐TBI Study,” Journal of Neurotrauma 39, no. 5–6 (2022): 358–370, 10.1089/neu.2021.0348. [DOI] [PMC free article] [PubMed] [Google Scholar]
- 10. Dikmen S., Machamer J., Fann J. R., and Temkin N. R., “Rates of Symptom Reporting Following Traumatic Brain Injury,” Journal of the International Neuropsychological Society 16, no. 3 (2010): 401–411, 10.1017/S1355617710000196. [DOI] [PubMed] [Google Scholar]
- 11. Bieniek K. F., Ross O. A., Cormier K. A., et al., “Chronic Traumatic Encephalopathy Pathology in a Neurodegenerative Disorders Brain Bank,” Acta Neuropathologica 130, no. 6 (2015): 877–889, 10.1007/s00401-015-1502-4. [DOI] [PMC free article] [PubMed] [Google Scholar]
- 12. Blennow K., Brody D. L., Kochanek P. M., et al., “Traumatic Brain Injuries,” Nature Reviews. Disease Primers 2 (2016): 16084, 10.1038/nrdp.2016.84. [DOI] [PubMed] [Google Scholar]
- 13. Kamins J., Bigler E., Covassin T., et al., “What Is the Physiological Time to Recovery After Concussion? A Systematic Review,” British Journal of Sports Medicine 51, no. 12 (2017): 935–940, 10.1136/bjsports-2016-097464. [DOI] [PubMed] [Google Scholar]
- 14. McCrory P., Meeuwisse W., Dvořák J., et al., “Consensus Statement on Concussion in Sport—The 5th International Conference on Concussion in Sport Held in Berlin, October 2016,” British Journal of Sports Medicine 51, no. 11 (2017): 838–847, 10.1136/bjsports-2017-097699. [DOI] [PubMed] [Google Scholar]
- 15. Saatman K. E., Duhaime A. C., Bullock R., et al., “Classification of Traumatic Brain Injury for Targeted Therapies,” Journal of Neurotrauma 25, no. 7 (2008): 719–738, 10.1089/neu.2008.0586. [DOI] [PMC free article] [PubMed] [Google Scholar]
- 16. Dixon K. J., “Pathophysiology of Traumatic Brain Injury,” Physical Medicine and Rehabilitation Clinics of North America 28, no. 2 (2017): 215–225, 10.1016/j.pmr.2016.12.001. [DOI] [PubMed] [Google Scholar]
- 17. Smith D. H., Chen X. H., Nonaka M., et al., “Accumulation of Amyloid Beta and Tau and the Formation of Neurofilament Inclusions Following Diffuse Brain Injury in the Pig,” Journal of Neuropathology and Experimental Neurology 58, no. 9 (1999): 982–992, 10.1097/00005072-199909000-00008. [DOI] [PubMed] [Google Scholar]
- 18. Königs M., Pouwels P. J., Ernest van Heurn L. W., et al., “Relevance of Neuroimaging for Neurocognitive and Behavioral Outcome After Pediatric Traumatic Brain Injury,” Brain Imaging and Behavior 12, no. 1 (2018): 29–43, 10.1007/s11682-017-9673-3. [DOI] [PMC free article] [PubMed] [Google Scholar]
- 19. Hunter J. V., Wilde E. A., Tong K. A., and Holshouser B. A., “Emerging Imaging Tools for Use With Traumatic Brain Injury Research,” Journal of Neurotrauma 29, no. 4 (2012): 654–671, 10.1089/neu.2011.1906. [DOI] [PMC free article] [PubMed] [Google Scholar]
- 20. Niogi S. N. and Mukherjee P., “Diffusion Tensor Imaging of Mild Traumatic Brain Injury,” Journal of Head Trauma Rehabilitation 25, no. 4 (2010): 241–255, 10.1097/HTR.0b013e3181e52c2a. [DOI] [PubMed] [Google Scholar]
- 21. Li N., Yang Y., Glover D. P., et al., “Evidence for Impaired Plasticity After Traumatic Brain Injury in the Developing Brain,” Journal of Neurotrauma 31, no. 4 (2014): 395–403, 10.1089/neu.2013.3059. [DOI] [PMC free article] [PubMed] [Google Scholar]
- 22. Mori S. and Zhang J., “Principles of Diffusion Tensor Imaging and Its Applications to Basic Neuroscience Research,” Neuron 51, no. 5 (2006): 527–539, 10.1016/j.neuron.2006.08.012. [DOI] [PubMed] [Google Scholar]
- 23. Jain B., Das A. K., Agrawal M., Babal R., and Purohit D. K., “Implications of DTI in Mild Traumatic Brain Injury for Detecting Neurological Recovery and Predicting Long‐Term Behavioural Outcome in Paediatric and Young Population—A Systematic Review,” Child's Nervous System 37, no. 8 (2021): 2475–2486, 10.1007/s00381-021-05240-6. [DOI] [PubMed] [Google Scholar]
- 24. Mac Donald C. L., Dikranian K., Song S. K., Bayly P. V., Holtzman D. M., and Brody D. L., “Detection of Traumatic Axonal Injury With Diffusion Tensor Imaging in a Mouse Model of Traumatic Brain Injury,” Experimental Neurology 205, no. 1 (2007): 116–131, 10.1016/j.expneurol.2007.01.035. [DOI] [PMC free article] [PubMed] [Google Scholar]
- 25. Hulkower M. B., Poliak D. B., Rosenbaum S. B., Zimmerman M. E., and Lipton M. L., “A Decade of DTI in Traumatic Brain Injury: 10 Years and 100 Articles Later,” AJNR. American Journal of Neuroradiology 34, no. 11 (2013): 2064–2074, 10.3174/ajnr.A3395. [DOI] [PMC free article] [PubMed] [Google Scholar]
- 26. Bendlin B. B., Ries M. L., Lazar M., et al., “Longitudinal Changes in Patients With Traumatic Brain Injury Assessed With Diffusion‐Tensor and Volumetric Imaging,” NeuroImage 42, no. 2 (2008): 503–514, 10.1016/j.neuroimage.2008.04.254. [DOI] [PMC free article] [PubMed] [Google Scholar]
- 27. Inglese M., Makani S., Johnson G., et al., “Diffuse Axonal Injury in Mild Traumatic Brain Injury: A Diffusion Tensor Imaging Study,” Journal of Neurosurgery 103, no. 2 (2005): 298–303, 10.3171/jns.2005.103.2.0298. [DOI] [PubMed] [Google Scholar]
- 28. Lv W., Wang Z., Wu H., Zhang W., Xu J., and Chen X., “mTBI‐Induced Systemic Vascular Dysfunction in a Mouse mTBI Model,” Brain Sciences 12, no. 2 (2022): 232, 10.3390/brainsci12020232. [DOI] [PMC free article] [PubMed] [Google Scholar]
- 29. Ma X., Aravind A., Pfister B. J., Chandra N., and Haorah J., “Animal Models of Traumatic Brain Injury and Assessment of Injury Severity,” Molecular Neurobiology 56, no. 8 (2019): 5332–5345, 10.1007/s12035-018-1454-5. [DOI] [PubMed] [Google Scholar]
- 30. Shultz S. R., McDonald S. J., Vonder Haar C., et al., “The Potential for Animal Models to Provide Insight Into Mild Traumatic Brain Injury: Translational Challenges and Strategies,” Neuroscience and Biobehavioral Reviews 76, no. Pt B (2017): 396–414, 10.1016/j.neubiorev.2016.09.014. [DOI] [PubMed] [Google Scholar]
- 31. Feeney D. M., Boyeson M. G., Linn R. T., Murray H. M., and Dail W. G., “Responses to Cortical Injury: I. Methodology and Local Effects of Contusions in the Rat,” Brain Research 211, no. 1 (1981): 67–77, 10.1016/0006-8993(81)90067-6. [DOI] [PubMed] [Google Scholar]
- 32. Flierl M. A., Stahel P. F., Beauchamp K. M., Morgan S. J., Smith W. R., and Shohami E., “Mouse Closed Head Injury Model Induced by a Weight‐Drop Device,” Nature Protocols 4, no. 9 (2009): 1328–1337, 10.1038/nprot.2009.148. [DOI] [PubMed] [Google Scholar]
- 33. Marmarou A., Foda M. A., van den Brink W., Campbell J., Kita H., and Demetriadou K., “A New Model of Diffuse Brain Injury in Rats. Part I: Pathophysiology and Biomechanics,” Journal of Neurosurgery 80, no. 2 (1994): 291–300, 10.3171/jns.1994.80.2.0291. [DOI] [PubMed] [Google Scholar]
- 34. McIntosh T. K., Vink R., Noble L., et al., “Traumatic Brain Injury in the Rat: Characterization of a Lateral Fluid‐Percussion Model,” Neuroscience 28, no. 1 (1989): 233–244, 10.1016/0306-4522(89)90247-9. [DOI] [PubMed] [Google Scholar]
- 35. Shin S. S., Krishnan V., Stokes W., et al., “Transcranial Magnetic Stimulation and Environmental Enrichment Enhances Cortical Excitability and Functional Outcomes After Traumatic Brain Injury,” Brain Stimulation 11, no. 6 (2018): 1306–1313, 10.1016/j.brs.2018.07.050. [DOI] [PMC free article] [PubMed] [Google Scholar]
- 36. Lu H., Kobilo T., Robertson C., Tong S., Celnik P., and Pelled G., “Transcranial Magnetic Stimulation Facilitates Neurorehabilitation After Pediatric Traumatic Brain Injury,” Scientific Reports 5 (2015): 14769, 10.1038/srep14769. [DOI] [PMC free article] [PubMed] [Google Scholar]
- 37. Dixon C. E., Clifton G. L., Lighthall J. W., Yaghmai A. A., and Hayes R. L., “A Controlled Cortical Impact Model of Traumatic Brain Injury in the Rat,” Journal of Neuroscience Methods 39, no. 3 (1991): 253–262, 10.1016/0165-0270(91)90104-8. [DOI] [PubMed] [Google Scholar]
- 38. Lighthall J. W., “Controlled Cortical Impact: A New Experimental Brain Injury Model,” Journal of Neurotrauma 5, no. 1 (1988): 1–15, 10.1089/neu.1988.5.1. [DOI] [PubMed] [Google Scholar]
- 39. Raghupathi R. and Margulies S. S., “Traumatic Axonal Injury After Closed Head Injury in the Neonatal Pig,” Journal of Neurotrauma 19, no. 7 (2002): 843–853, 10.1089/08977150260190438. [DOI] [PubMed] [Google Scholar]
- 40. Bauman R. A., Ling G., Tong L., et al., “An Introductory Characterization of a Combat‐Casualty‐Care Relevant Swine Model of Closed Head Injury Resulting From Exposure to Explosive Blast,” Journal of Neurotrauma 26, no. 6 (2009): 841–860, 10.1089/neu.2008.0898. [DOI] [PubMed] [Google Scholar]
- 41. Duhaime A. C., Hunter J. V., Grate L. L., et al., “Magnetic Resonance Imaging Studies of Age‐Dependent Responses to Scaled Focal Brain Injury in the Piglet,” Journal of Neurosurgery 99, no. 3 (2003): 542–548, 10.3171/jns.2003.99.3.0542. [DOI] [PubMed] [Google Scholar]
- 42. Grate L. L., Golden J. A., Hoopes P. J., Hunter J. V., and Duhaime A. C., “Traumatic Brain Injury in Piglets of Different Ages: Techniques for Lesion Analysis Using Histology and Magnetic Resonance Imaging,” Journal of Neuroscience Methods 123, no. 2 (2003): 201–206. [DOI] [PubMed] [Google Scholar]
- 43. Pareja J. C., Keeley K., Duhaime A. C., and Dodge C. P., “Modeling Pediatric Brain Trauma: Piglet Model of Controlled Cortical Impact,” Methods in Molecular Biology 1462 (2016): 345–356, 10.1007/978-1-4939-3816-2_19. [DOI] [PubMed] [Google Scholar]
- 44. Dobbing J. and Sands J., “Comparative Aspects of the Brain Growth Spurt,” Early Human Development 3, no. 1 (1979): 79–83. [DOI] [PubMed] [Google Scholar]
- 45. Friess S. H., Ichord R. N., Owens K., et al., “Neurobehavioral Functional Deficits Following Closed Head Injury in the Neonatal Pig,” Experimental Neurology 204, no. 1 (2007): 234–243, 10.1016/j.expneurol.2006.10.010. [DOI] [PMC free article] [PubMed] [Google Scholar]
- 46. Karlsson M., Yang Z., Chawla S., et al., “Evaluation of Diffusion Tensor Imaging and Fluid Based Biomarkers in a Large Animal Trial of Cyclosporine in Focal Traumatic Brain Injury,” Journal of Neurotrauma 38 (2021): 1870–1878, 10.1089/neu.2020.7317. [DOI] [PubMed] [Google Scholar]
- 47. Atlan L. S. and Margulies S. S., “Frequency‐Dependent Changes in Resting State Electroencephalogram Functional Networks After Traumatic Brain Injury in Piglets,” Journal of Neurotrauma 36, no. 17 (2019): 2558–2578, 10.1089/neu.2017.5574. [DOI] [PMC free article] [PubMed] [Google Scholar]
- 48. Kinder H. A., Baker E. W., Wang S., et al., “Traumatic Brain Injury Results in Dynamic Brain Structure Changes Leading to Acute and Chronic Motor Function Deficits in a Pediatric Piglet Model,” Journal of Neurotrauma 36, no. 20 (2019): 2930–2942, 10.1089/neu.2018.6303. [DOI] [PubMed] [Google Scholar]
- 49. Netzley A. H., Hunt R. D., Franco‐Arellano J., et al., “Multimodal Characterization of Yucatan Minipig Behavior and Physiology Through Maturation,” Scientific Reports 11, no. 1 (2021): 22688, 10.1038/s41598-021-00782-w. [DOI] [PMC free article] [PubMed] [Google Scholar]
- 50. Fil J. E., Joung S., Zimmerman B. J., Sutton B. P., and Dilger R. N., “High‐Resolution Magnetic Resonance Imaging‐Based Atlases for the Young and Adolescent Domesticated Pig (Sus scrofa),” Journal of Neuroscience Methods 354 (2021): 109107, 10.1016/j.jneumeth.2021.109107. [DOI] [PubMed] [Google Scholar]
- 51. Mathis A., Mamidanna P., Cury K. M., et al., “DeepLabCut: Markerless Pose Estimation of User‐Defined Body Parts With Deep Learning,” Nature Neuroscience 21, no. 9 (2018): 1281–1289, 10.1038/s41593-018-0209-y. [DOI] [PubMed] [Google Scholar]
- 52. Hunt R. D., Ashbaugh R. C., Reimers M., et al., “Swimming Direction of the Glass Catfish Is Responsive to Magnetic Stimulation,” PLoS ONE 16, no. 3 (2021): e0248141, 10.1371/journal.pone.0248141. [DOI] [PMC free article] [PubMed] [Google Scholar]
- 53. VanBuren T., Cywiak C., Telgkamp P., Mallett C. L., and Pelled G., “Establishing an Octopus Ecosystem for Biomedical and Bioengineering Research,” Journal of Visualized Experiments 175 (2021): e62705, 10.3791/62705. [DOI] [PMC free article] [PubMed] [Google Scholar]
- 54. Netzley A. H. and Pelled G., “The Pig as a Translational Animal Model for Biobehavioral and Neurotrauma Research,” Biomedicines 11, no. 8 (2023): 2165, 10.3390/biomedicines11082165. [DOI] [PMC free article] [PubMed] [Google Scholar]
- 55. Szabo C. A., Xiong J., Lancaster J. L., Rainey L., and Fox P., “Amygdalar and Hippocampal Volumetry in Control Participants: Differences Regarding Handedness,” AJNR. American Journal of Neuroradiology 22, no. 7 (2001): 1342–1345. [PMC free article] [PubMed] [Google Scholar]
- 56. Pusparani Y., Lin C. Y., Jan Y. K., et al., “Hippocampal Volume Asymmetry in Alzheimer Disease: A Systematic Review and Meta‐Analysis,” Medicine (Baltimore) 104, no. 10 (2025): e41662, 10.1097/MD.0000000000041662. [DOI] [PMC free article] [PubMed] [Google Scholar]
- 57. Missault S., Anckaerts C., Blockx I., et al., “Neuroimaging of Subacute Brain Inflammation and Microstructural Changes Predicts Long‐Term Functional Outcome After Experimental Traumatic Brain Injury,” Journal of Neurotrauma 36, no. 5 (2019): 768–788, 10.1089/neu.2018.5704. [DOI] [PubMed] [Google Scholar]
- 58. Mayer A. R., Ling J. M., Patton D. A., et al., “Non‐Linear Device Head Coupling and Temporal Delays in Large Animal Acceleration Models of Traumatic Brain Injury,” Annals of Biomedical Engineering 50, no. 6 (2022): 728–739, 10.1007/s10439-022-02953-w. [DOI] [PMC free article] [PubMed] [Google Scholar]
- 59. Reynolds B. B., Patrie J., Henry E. J., et al., “Quantifying Head Impacts in Collegiate Lacrosse,” American Journal of Sports Medicine 44, no. 11 (2016): 2947–2956, 10.1177/0363546516648442. [DOI] [PMC free article] [PubMed] [Google Scholar]
- 60. Sandmo S. B., McIntosh A. S., Andersen T. E., Koerte I. K., and Bahr R., “Evaluation of an In‐Ear Sensor for Quantifying Head Impacts in Youth Soccer,” American Journal of Sports Medicine 47, no. 4 (2019): 974–981, 10.1177/0363546519826953. [DOI] [PubMed] [Google Scholar]
- 61. Kerwin J., Yucesoy A., Vidhate S., et al., “Sulcal Cavitation in Linear Head Acceleration: Possible Correlation With Chronic Traumatic Encephalopathy,” Frontiers in Neurology 13 (2022): 832370, 10.3389/fneur.2022.832370. [DOI] [PMC free article] [PubMed] [Google Scholar]
- 62. Duhaime A. C., Holshouser B., Hunter J. V., and Tong K., “Common Data Elements for Neuroimaging of Traumatic Brain Injury: Pediatric Considerations,” Journal of Neurotrauma 29, no. 4 (2012): 629–633, 10.1089/neu.2011.1927. [DOI] [PMC free article] [PubMed] [Google Scholar]
- 63. Pfefferbaum A., Sullivan E. V., Hedehus M., Lim K. O., Adalsteinsson E., and Moseley M., “Age‐Related Decline in Brain White Matter Anisotropy Measured With Spatially Corrected Echo‐Planar Diffusion Tensor Imaging,” Magnetic Resonance in Medicine 44, no. 2 (2000): 259–268, . [DOI] [PubMed] [Google Scholar]
- 64. Lo C., Shifteh K., Gold T., Bello J. A., and Lipton M. L., “Diffusion Tensor Imaging Abnormalities in Patients With Mild Traumatic Brain Injury and Neurocognitive Impairment,” Journal of Computer Assisted Tomography 33, no. 2 (2009): 293–297, 10.1097/RCT.0b013e31817579d1. [DOI] [PubMed] [Google Scholar]
- 65. Arenth P. M., Russell K. C., Scanlon J. M., Kessler L. J., and Ricker J. H., “Corpus Callosum Integrity and Neuropsychological Performance After Traumatic Brain Injury: A Diffusion Tensor Imaging Study,” Journal of Head Trauma Rehabilitation 29, no. 2 (2014): E1–E10, 10.1097/HTR.0b013e318289ede5. [DOI] [PMC free article] [PubMed] [Google Scholar]
- 66. Wallace E. J., Mathias J. L., and Ward L., “Diffusion Tensor Imaging Changes Following Mild, Moderate and Severe Adult Traumatic Brain Injury: A Meta‐Analysis,” Brain Imaging and Behavior 12, no. 6 (2018): 1607–1621, 10.1007/s11682-018-9823-2. [DOI] [PubMed] [Google Scholar]
- 67. Reeves T. M., Phillips L. L., and Povlishock J. T., “Myelinated and Unmyelinated Axons of the Corpus Callosum Differ in Vulnerability and Functional Recovery Following Traumatic Brain Injury,” Experimental Neurology 196, no. 1 (2005): 126–137, 10.1016/j.expneurol.2005.07.014. [DOI] [PubMed] [Google Scholar]
- 68. Wilde E. A., McCauley S. R., Hunter J. V., et al., “Diffusion Tensor Imaging of Acute Mild Traumatic Brain Injury in Adolescents,” Neurology 70, no. 12 (2008): 948–955, 10.1212/01.wnl.0000305961.68029.54. [DOI] [PubMed] [Google Scholar]
- 69. Mayer A. R., Ling J. M., Yang Z., Pena A., Yeo R. A., and Klimaj S., “Diffusion Abnormalities in Pediatric Mild Traumatic Brain Injury,” Journal of Neuroscience 32, no. 50 (2012): 17961–17969, 10.1523/JNEUROSCI.3379-12.2012. [DOI] [PMC free article] [PubMed] [Google Scholar]
- 70. Ling J. M., Peña A., Yeo R. A., et al., “Biomarkers of Increased Diffusion Anisotropy in Semi‐Acute Mild Traumatic Brain Injury: A Longitudinal Perspective,” Brain 135, no. Pt 4 (2012): 1281–1292, 10.1093/brain/aws073. [DOI] [PMC free article] [PubMed] [Google Scholar]
- 71. Rosenblum W. I., “Cytotoxic Edema: Monitoring Its Magnitude and Contribution to Brain Swelling,” Journal of Neuropathology and Experimental Neurology 66, no. 9 (2007): 771–778, 10.1097/nen.0b013e3181461965. [DOI] [PubMed] [Google Scholar]
- 72. Liu A. Y., Maldjian J. A., Bagley L. J., Sinson G. P., and Grossman R. I., “Traumatic Brain Injury: Diffusion‐Weighted MR Imaging Findings,” AJNR. American Journal of Neuroradiology 20, no. 9 (1999): 1636–1641. [PMC free article] [PubMed] [Google Scholar]
- 73. Van Beek L., Vanderauwera J., Ghesquière P., Lagae L., and De Smedt B., “Longitudinal Changes in Mathematical Abilities and White Matter Following Paediatric Mild Traumatic Brain Injury,” Brain Injury 29, no. 13–14 (2015): 1701–1710, 10.3109/02699052.2015.1075172. [DOI] [PubMed] [Google Scholar]
- 74. Hermoye L., Saint‐Martin C., Cosnard G., et al., “Pediatric Diffusion Tensor Imaging: Normal Database and Observation of the White Matter Maturation in Early Childhood,” NeuroImage 29, no. 2 (2006): 493–504, 10.1016/j.neuroimage.2005.08.017. [DOI] [PubMed] [Google Scholar]
- 75. Schneider J. F., Il'yasov K. A., Hennig J., and Martin E., “Fast Quantitative Diffusion‐Tensor Imaging of Cerebral White Matter From the Neonatal Period to Adolescence,” Neuroradiology 46, no. 4 (2004): 258–266, 10.1007/s00234-003-1154-2. [DOI] [PubMed] [Google Scholar]
- 76. Lipton M. L., Kim N., Park Y. K., et al., “Robust Detection of Traumatic Axonal Injury in Individual Mild Traumatic Brain Injury Patients: Intersubject Variation, Change Over Time and Bidirectional Changes in Anisotropy,” Brain Imaging and Behavior 6, no. 2 (2012): 329–342, 10.1007/s11682-012-9175-2. [DOI] [PubMed] [Google Scholar]
- 77. Peled S., “New Perspectives on the Sources of White Matter DTI Signal,” IEEE Transactions on Medical Imaging 26, no. 11 (2007): 1448–1455, 10.1109/TMI.2007.906787. [DOI] [PMC free article] [PubMed] [Google Scholar]
- 78. Yu C., Shu N., Li J., Qin W., Jiang T., and Li K., “Plasticity of the Corticospinal Tract in Early Blindness Revealed by Quantitative Analysis of Fractional Anisotropy Based on Diffusion Tensor Tractography,” NeuroImage 36, no. 2 (2007): 411–417, 10.1016/j.neuroimage.2007.03.003. [DOI] [PubMed] [Google Scholar]
- 79. Churchill N., Hutchison M., Richards D., Leung G., Graham S., and Schweizer T. A., “Brain Structure and Function Associated With a History of Sport Concussion: A Multi‐Modal Magnetic Resonance Imaging Study,” Journal of Neurotrauma 34, no. 4 (2017): 765–771, 10.1089/neu.2016.4531. [DOI] [PubMed] [Google Scholar]
- 80. Budde M. D., Janes L., Gold E., Turtzo L. C., and Frank J. A., “The Contribution of Gliosis to Diffusion Tensor Anisotropy and Tractography Following Traumatic Brain Injury: Validation in the Rat Using Fourier Analysis of Stained Tissue Sections,” Brain 134, no. Pt 8 (2011): 2248–2260, 10.1093/brain/awr161. [DOI] [PMC free article] [PubMed] [Google Scholar]
- 81. Churchill N. W., Caverzasi E., Graham S. J., Hutchison M. G., and Schweizer T. A., “White Matter Microstructure in Athletes With a History of Concussion: Comparing Diffusion Tensor Imaging (DTI) and Neurite Orientation Dispersion and Density Imaging (NODDI),” Human Brain Mapping 38, no. 8 (2017): 4201–4211, 10.1002/hbm.23658. [DOI] [PMC free article] [PubMed] [Google Scholar]
- 82. Arfanakis K., Haughton V. M., Carew J. D., Rogers B. P., Dempsey R. J., and Meyerand M. E., “Diffusion Tensor MR Imaging in Diffuse Axonal Injury,” AJNR. American Journal of Neuroradiology 23, no. 5 (2002): 794–802. [PMC free article] [PubMed] [Google Scholar]
- 83. Henry L. C., Tremblay J., Tremblay S., et al., “Acute and Chronic Changes in Diffusivity Measures After Sports Concussion,” Journal of Neurotrauma 28, no. 10 (2011): 2049–2059, 10.1089/neu.2011.1836. [DOI] [PubMed] [Google Scholar]
- 84. Miles L., Grossman R. I., Johnson G., Babb J. S., Diller L., and Inglese M., “Short‐Term DTI Predictors of Cognitive Dysfunction in Mild Traumatic Brain Injury,” Brain Injury 22, no. 2 (2008): 115–122, 10.1080/02699050801888816. [DOI] [PubMed] [Google Scholar]
- 85. Niogi S. N., Mukherjee P., Ghajar J., et al., “Extent of Microstructural White Matter Injury in Postconcussive Syndrome Correlates With Impaired Cognitive Reaction Time: A 3T Diffusion Tensor Imaging Study of Mild Traumatic Brain Injury,” American Journal of Neuroradiology 29, no. 5 (2008): 967–973, 10.3174/ajnr.A0970. [DOI] [PMC free article] [PubMed] [Google Scholar]
- 86. Kraus M. F., Susmaras T., Caughlin B. P., Walker C. J., Sweeney J. A., and Little D. M., “White Matter Integrity and Cognition in Chronic Traumatic Brain Injury: A Diffusion Tensor Imaging Study,” Brain 130, no. Pt 10 (2007): 2508–2519, 10.1093/brain/awm216. [DOI] [PubMed] [Google Scholar]
- 87. Niogi S. N., Mukherjee P., Ghajar J., et al., “Structural Dissociation of Attentional Control and Memory in Adults With and Without Mild Traumatic Brain Injury,” Brain 131, no. Pt 12 (2008): 3209–3221, 10.1093/brain/awn247. [DOI] [PubMed] [Google Scholar]
- 88. Ware A. L., Shukla A., Goodrich‐Hunsaker N. J., et al., “Post‐Acute White Matter Microstructure Predicts Post‐Acute and Chronic Post‐Concussive Symptom Severity Following Mild Traumatic Brain Injury in Children,” NeuroImage: Clinical 25 (2020): 102106, 10.1016/j.nicl.2019.102106. [DOI] [PMC free article] [PubMed] [Google Scholar]
- 89. Messé A., Caplain S., Paradot G., et al., “Diffusion Tensor Imaging and White Matter Lesions at the Subacute Stage in Mild Traumatic Brain Injury With Persistent Neurobehavioral Impairment,” Human Brain Mapping 32, no. 6 (2011): 999–1011, 10.1002/hbm.21092. [DOI] [PMC free article] [PubMed] [Google Scholar]
- 90. Cubon V. A., Putukian M., Boyer C., and Dettwiler A., “A Diffusion Tensor Imaging Study on the White Matter Skeleton in Individuals With Sports‐Related Concussion,” Journal of Neurotrauma 28, no. 2 (2011): 189–201, 10.1089/neu.2010.1430. [DOI] [PMC free article] [PubMed] [Google Scholar]
- 91. Barzó P., Marmarou A., Fatouros P., Hayasaki K., and Corwin F., “Contribution of Vasogenic and Cellular Edema to Traumatic Brain Swelling Measured by Diffusion‐Weighted Imaging,” Journal of Neurosurgery 87, no. 6 (1997): 900–907, 10.3171/jns.1997.87.6.0900. [DOI] [PubMed] [Google Scholar]
- 92. Field A. S., Hasan K., Jellison B. J., Arfanakis K., and Alexander A. L., “Diffusion Tensor Imaging in an Infant With Traumatic Brain Swelling,” AJNR. American Journal of Neuroradiology 24, no. 7 (2003): 1461–1464. [PMC free article] [PubMed] [Google Scholar]
- 93. Pfefferbaum A. and Sullivan E. V., “Increased Brain White Matter Diffusivity in Normal Adult Aging: Relationship to Anisotropy and Partial Voluming,” Magnetic Resonance in Medicine 49, no. 5 (2003): 953–961, 10.1002/mrm.10452. [DOI] [PubMed] [Google Scholar]
- 94. Bigler E. D., “Volumetric MRI Findings in Mild Traumatic Brain Injury (mTBI) and Neuropsychological Outcome,” Neuropsychology Review 33, no. 1 (2023): 5–41, 10.1007/s11065-020-09474-0. [DOI] [PubMed] [Google Scholar]
- 95. Munivenkatappa A., Devi B. I., Shukla D. P., and Rajeswaran J., “Role of the Thalamus in Natural Recovery of Cognitive Impairment in Patients With Mild Traumatic Brain Injury,” Brain Injury 30, no. 4 (2016): 388–392, 10.3109/02699052.2015.1089599. [DOI] [PubMed] [Google Scholar]
- 96. Obermann M., Nebel K., Schumann C., et al., “Gray Matter Changes Related to Chronic Posttraumatic Headache,” Neurology 73, no. 12 (2009): 978–983, 10.1212/WNL.0b013e3181b8791a. [DOI] [PubMed] [Google Scholar]
- 97. Ross D. E., Seabaugh J. D., Seabaugh J. M., et al., “Patients With Chronic Mild or Moderate Traumatic Brain Injury Have Abnormal Brain Enlargement,” Brain Injury 34, no. 1 (2020): 11–19, 10.1080/02699052.2019.1669074. [DOI] [PubMed] [Google Scholar]
- 98. Marmarou A., Fatouros P. P., Barzó P., et al., “Contribution of Edema and Cerebral Blood Volume to Traumatic Brain Swelling in Head‐Injured Patients,” Journal of Neurosurgery 93, no. 2 (2000): 183–193, 10.3171/jns.2000.93.2.0183. [DOI] [PubMed] [Google Scholar]
- 99. Marmarou A., Signoretti S., Fatouros P. P., Portella G., Aygok G. A., and Bullock M. R., “Predominance of Cellular Edema in Traumatic Brain Swelling in Patients With Severe Head Injuries,” Journal of Neurosurgery 104, no. 5 (2006): 720–730, 10.3171/jns.2006.104.5.720. [DOI] [PubMed] [Google Scholar]
- 100. Smith D. H., Chen X. H., Pierce J. E., et al., “Progressive Atrophy and Neuron Death for One Year Following Brain Trauma in the Rat,” Journal of Neurotrauma 14, no. 10 (1997): 715–727, 10.1089/neu.1997.14.715. [DOI] [PubMed] [Google Scholar]
- 101. Jacquens A., Delmotte P. R., Gourbeix C., et al., “MRI Volumetry and Diffusion Tensor Imaging for Diagnosis and Follow‐Up of Late Post‐Traumatic Injuries,” Annals of Physical and Rehabilitation Medicine 67, no. 2 (2024): 101783, 10.1016/j.rehab.2023.101783. [DOI] [PubMed] [Google Scholar]
- 102. Jahanshahi A. R., Naghdi Sadeh R., and Khezerloo D., “Atrophy Asymmetry in Hippocampal Subfields in Patients With Alzheimer's Disease and Mild Cognitive Impairment,” Experimental Brain Research 241, no. 2 (2023): 495–504, 10.1007/s00221-022-06543-z. [DOI] [PubMed] [Google Scholar]
- 103. Farid N., Girard H. M., Kemmotsu N., et al., “Temporal Lobe Epilepsy: Quantitative MR Volumetry in Detection of Hippocampal Atrophy,” Radiology 264, no. 2 (2012): 542–550, 10.1148/radiol.12112638. [DOI] [PMC free article] [PubMed] [Google Scholar]
- 104. Max J. E., Robertson B. A., and Lansing A. E., “The Phenomenology of Personality Change Due to Traumatic Brain Injury in Children and Adolescents,” Journal of Neuropsychiatry and Clinical Neurosciences 13, no. 2 (2001): 161–170, 10.1176/jnp.13.2.161. [DOI] [PubMed] [Google Scholar]
- 105. Adcock S. J., Martin G. M., and Walsh C. J., “The Stress Response and Exploratory Behaviour in Yucatan Minipigs (Sus scrofa): Relations to Sex and Social Rank,” Physiology & Behavior 152, no. Pt A (2015): 194–202, 10.1016/j.physbeh.2015.09.033. [DOI] [PubMed] [Google Scholar]
- 106. Walsh R. N. and Cummins R. A., “The Open‐Field Test: A Critical Review,” Psychological Bulletin 83, no. 3 (1976): 482–504. [PubMed] [Google Scholar]
- 107. Gould T.D., Dao D.T., and Kovacsics C.E., “The Open Field Test,” in Mood and Anxiety Related Phenotypes in Mice: Characterization Using Behavioral Tests, ed. Gould T.D. (Humana Press/Springer Nature, 2009), 1–20, 10.1007/978-1-60761-303-9_1 [DOI] [Google Scholar]
- 108. Liu Y., Wang T., Zhang C., and Cai J., “Rat Model of Closed‐Head Mild Traumatic Injury and Its Validation,” Journal of Visualized Experiments 199 (2023): e65849, 10.3791/65849. [DOI] [PubMed] [Google Scholar]
- 109. Tseitlin L., Richmond‐Hacham B., Vita A., Schreiber S., Pick C. G., and Bikovski L., “Measuring Anxiety‐Like Behavior in a Mouse Model of mTBI: Assessment in Standard and Home Cage Assays,” Frontiers in Behavioral Neuroscience 17 (2023): 1140724, 10.3389/fnbeh.2023.1140724. [DOI] [PMC free article] [PubMed] [Google Scholar]
- 110. Donald R. D., Healy S. D., Lawrence A. B., and Rutherford K. M., “Emotionality in Growing Pigs: Is the Open Field a Valid Test?,” Physiology & Behavior 104, no. 5 (2011): 906–913, 10.1016/j.physbeh.2011.05.031. [DOI] [PubMed] [Google Scholar]
- 111. Haigh A., Chou J. Y., and O'Driscoll K., “Variations in the Behavior of Pigs During an Open Field and Novel Object Test,” Frontiers in Veterinary Science 7 (2020): 607, 10.3389/fvets.2020.00607. [DOI] [PMC free article] [PubMed] [Google Scholar]
- 112. Antunes M. and Biala G., “The Novel Object Recognition Memory: Neurobiology, Test Procedure, and Its Modifications,” Cognitive Processing 13, no. 2 (2012): 93–110, 10.1007/s10339-011-0430-z. [DOI] [PMC free article] [PubMed] [Google Scholar]
- 113. Rachmany L., Tweedie D., Rubovitch V., et al., “Cognitive Impairments Accompanying Rodent Mild Traumatic Brain Injury Involve p53‐Dependent Neuronal Cell Death and Are Ameliorated by the Tetrahydrobenzothiazole PFT‐α,” PLoS ONE 8, no. 11 (2013): e79837, 10.1371/journal.pone.0079837. [DOI] [PMC free article] [PubMed] [Google Scholar]
- 114. Feng Y., Li K., Roth E., et al., “Repetitive Mild Traumatic Brain Injury in Rats Impairs Cognition, Enhances Prefrontal Cortex Neuronal Activity, and Reduces Pre‐Synaptic Mitochondrial Function,” Frontiers in Cellular Neuroscience 15 (2021): 689334, 10.3389/fncel.2021.689334. [DOI] [PMC free article] [PubMed] [Google Scholar]
- 115. Tinney E. M., Ai M., España‐Irla G., Hillman C. H., and Morris T. P., “Physical Activity and Frontoparietal Network Connectivity in Traumatic Brain Injury,” Brain and Behavior: A Cognitive Neuroscience Perspective 14, no. 9 (2024): e70022, 10.1002/brb3.70022. [DOI] [PMC free article] [PubMed] [Google Scholar]
- 116. Gale S. D., Johnson S. C., Bigler E. D., and Blatter D. D., “Nonspecific White Matter Degeneration Following Traumatic Brain Injury,” Journal of the International Neuropsychological Society 1, no. 1 (1995): 17–28, 10.1017/s1355617700000060. [DOI] [PubMed] [Google Scholar]
- 117. Himanen L., Portin R., Isoniemi H., Helenius H., Kurki T., and Tenovuo O., “Cognitive Functions in Relation to MRI Findings 30 Years After Traumatic Brain Injury,” Brain Injury 19, no. 2 (2005): 93–100, 10.1080/02699050410001720031. [DOI] [PubMed] [Google Scholar]
- 118. Hughes D. G., Jackson A., Mason D. L., Berry E., Hollis S., and Yates D. W., “Abnormalities on Magnetic Resonance Imaging Seen Acutely Following Mild Traumatic Brain Injury: Correlation With Neuropsychological Tests and Delayed Recovery,” Neuroradiology 46, no. 7 (2004): 550–558, 10.1007/s00234-004-1227-x. [DOI] [PubMed] [Google Scholar]
- 119. Kerr Z. Y., Collins C. L., Mihalik J. P., Marshall S. W., Guskiewicz K. M., and Comstock R. D., “Impact Locations and Concussion Outcomes in High School Football Player‐to‐Player Collisions,” Pediatrics 134, no. 3 (2014): 489–496, 10.1542/peds.2014-0770. [DOI] [PubMed] [Google Scholar]
- 120. Abdelhak A., Foschi M., Abu‐Rumeileh S., et al., “Blood GFAP as an Emerging Biomarker in Brain and Spinal Cord Disorders,” Nature Reviews. Neurology 18, no. 3 (2022): 158–172, 10.1038/s41582-021-00616-3. [DOI] [PubMed] [Google Scholar]
- 121. Bagg M. K., Hellewell S. C., Keeves J., et al., “The Australian Traumatic Brain Injury Initiative: Systematic Review of Predictive Value of Biological Markers for People With Moderate‐Severe Traumatic Brain Injury,” Journal of Neurotrauma (2024), 10.1089/neu.2023.0464. [DOI] [PubMed] [Google Scholar]
- 122. Sidaros A., Engberg A. W., Sidaros K., et al., “Diffusion Tensor Imaging During Recovery From Severe Traumatic Brain Injury and Relation to Clinical Outcome: A Longitudinal Study,” Brain 131, no. Pt 2 (2008): 559–572, 10.1093/brain/awm294. [DOI] [PubMed] [Google Scholar]
Associated Data
This section collects any data citations, data availability statements, or supplementary materials included in this article.
Data Availability Statement
The data that support the findings of this study are available from the corresponding author upon reasonable request.