

Abstract
Background
This study aimed to compare amino acid concentrations in pregnant patients with obesity and gestational diabetes mellitus (GDM) to those in healthy pregnant women at different stages of pregnancy.
Material/Methods
The study group consisted of 50 pregnant women with obesity (body mass index [BMI] >30 kg/m2) diagnosed with GDM in the first half of pregnancy. The control group included 25 healthy pregnant women with a BMI <25 kg/m2. Blood samples were collected at visit V1 (no later than 20 weeks of gestation) and V2 (between weeks 37 and 39). The amino acid profiles were determined using a hybrid triple quadrupole/linear ion trap mass spectrometer coupled with a liquid chromatography instrument.
Results
Of the 30 measured amino acids, 23 serum concentrations differed significantly in patients with obesity. Proline (P<0.001), leucine (P=0.001), valine (P=0.001), and isoleucine (P=0.001) were higher in the obesity group than the control group. Conversely, glutamine (P=0.001), taurine (P=0.008), and asparagine (P=0.001) were significantly lower in obesity group than control group during both observation periods. Changes in isoleucine (P=0.023), tyrosine (P=0.011), taurine (0.032), and phenylalanine (P=0.009) concentrations were associated with patients’ weight gain during pregnancy.
Conclusions
Research on amino acids offers a detailed understanding of the metabolic interactions that play a crucial role. Metabolomics has emerged as a technology with significant potential for early detection of GDM and for enhancing our understanding of the pathogenesis and impact of the disease on both the mother and her offspring.
Keywords: Amino Acids, Peptides, and Proteins; Diabetes, Gestational; Obesity; Pregnancy
Introduction
In the last decade, Poland has seen more than a 40% increase in the number of women aged 19 to 39 years who are classified as having obesity [1]. This significant rise in obesity rates has concurrently led to a marked increase in the incidence of diabetes. As reported by Ford et al (1997), for every kilogram of weight gained, the risk of developing diabetes escalates by 4.5% to 9% [2]. The link between obesity and insulin resistance is likely causal, as human and animal studies indicate that changes in body weight are closely associated with corresponding changes in insulin sensitivity [2].
Obesity and hyperglycemia are linked to various metabolic alterations, leading to multiple complications for both the mother and fetus. Consequently, early diagnosis and treatment are crucial for improving the prognosis of hyperglycemia in pregnancy [3]. Weight gain during pregnancy is also an important element of the course of gestational diabetes mellitus (GDM). Excessive weight gain is associated with a greater risk of complications, including fetal macrosomia [4].
Diagnosis of GDM is mainly based on an oral glucose tolerance test (OGTT), which is conducted between weeks 24 and 28 of pregnancy. For women with risk factors, it should start in the first trimester. In Poland, the recommended test uses 75 g of glucose and assessment of fasting blood glucose 1 h and 2 h after consuming glucose [5].
Metabolomics have offered new perspectives on the etiology of obesity and diabetes and individual variations. The advantage of metabolomics lies in its ability to capture disease-relevant metabolic changes and identify novel biomarkers of disease processes [6]. Obesity, diabetes, and low serum insulin levels are associated with increased circulating levels of several amino acids, including the branched-chain amino acids (BCAAs) isoleucine, leucine, and valine [7]. Animal studies have shown that taurine consumption reduces the risk of obesity, hypertension, and diabetes. A human epidemiological study showed that the daily excretion of taurine in urine, which is an indicator of the daily intake of this amino acid, was inversely proportional to the concentration of cholesterol in the plasma, blood pressure, and body mass index (BMI) [8].
Metabolomic studies have identified numerous changes in metabolites associated with GDM, including alterations in carbohydrates, lipids, fatty acids, acylcarnitines, and amino acids, particularly BCAAs and aromatic amino acids [9,10]. Amino acids, which play a critical role in carbohydrate metabolism, significantly affect the development of hyperglycemia, insulin resistance, and obesity. BCAAs, especially leucine and isoleucine, have been positively correlated with an increased risk of gestational diabetes [11]. Elevated levels of BCAAs are associated with insulin resistance, type 2 diabetes, obesity, and various non-metabolic diseases, including several forms of cancer. Specifically, BCAAs, notably leucine, activate the mechanistic target of rapamycin complex 1, which regulates cell growth, metabolism, glucose metabolism, and several other essential physiological processes [7]. Patients with obesity or diabetes exhibit low plasma glycine levels, and decreasing insulin resistance can increase plasma glycine concentrations. Higher serum glycine levels are associated with a reduced risk of developing type 2 diabetes. Consistently, plasma glycine concentrations are lower in the lean offspring of parents with type 2 diabetes than in those of parents without type 2 diabetes [12].
Maternal obesity disrupts the methionine cycle during pregnancy in primates, providing a mechanism for the epigenetic changes in pregnant women with obesity and suggesting diagnostic and therapeutic options for human pregnancies with obesity [13]. Glutamine, a precursor in gluconeogenic pathways, is widely discussed for its potential effect on reducing glycemia and insulin resistance [14]. Pregnant women with high glycemic values exhibit higher proline concentrations than do those with average glycemic values. Increased proline correlates with diabetes, insulin resistance, and obesity [15]. Citrulline has been tested in animal models for its antidiabetogenic and anti-obesity effects [16]. The relationship between amino acids and insulin resistance has been recognized for decades [17–19]. However, with the advent of comprehensive metabolomic profiling, a more detailed understanding of how amino acids contribute to the progression of diabetes has emerged.
Our study aimed to compare amino acid concentrations in the first half of pregnancy and the peripartum period between pregnant women with obesity and gestational diabetes and pregnant women with appropriate pre-pregnancy body weight. Another objective was to determine whether appropriate diet, lifestyle modifications, and glycemic control influenced changes in amino acid concentrations during pregnancy.
Material and Methods
The research was conducted at the Department of Reproduction of Poznań University of Medical Sciences in Poland, from 2021 to 2023. Before starting the study, consent was obtained from the Bioethics Committee of the Poznań University of Medical Sciences (number 51/20). Each patient participating in the study signed an informed, written consent to participate in the study. The study was based on current guidelines and regulations.
Study Population
Out of 278 patients with GDM receiving care at our clinic, 50 pregnant patients were enrolled in this study. The inclusion criteria were a singleton pregnancy, an age of at least 18 years, a pre-pregnancy BMI of 30.0 kg/m2 or higher, and a diagnosis of hyperglycemia during the first half of pregnancy. Patients with obesity, which in Poland is assumed to be a risk factor for GDM, were screened in the first trimester. The 3-point 75 g OGTT test was performed with fasting glucose measurements 1 h and 2 h after consuming glucose. On this basis, early GDM was diagnosed or excluded. Patients with negative results had the test repeated at 24 to 28 weeks of pregnancy and were not included in this study. Among the 238 patients not included, 200 received a diagnosis of GDM after week 20 of pregnancy, 21 did not meet the obesity criteria as per the American Endocrine Society, and 17 had multiple pregnancies, thus not fulfilling the study’s recruitment criteria.
The control group included 25 healthy pregnant women without any indicators of metabolic syndrome or hyperglycemia, assessed at the same pregnancy stages as the study group (visits V1 and V2). The inclusion criteria for the control group were as follows: a singleton pregnancy, age of at least 18 years, a pre-pregnancy BMI between 18.5 kg/m2 and 24.99 kg/m2, and negative results on the 75 g OGTT between weeks 24 and 28 of gestation. The first trimester fasting blood glucose levels in the control group were within the normal range, eliminating the need for an OGTT during the first trimester.
Research Protocol
The research protocol for the study group included 2 visits: the initial enrollment visit following the diagnosis of hyperglycemia (visit V1), and a second visit scheduled between gestational weeks 37 and 39 (visit V2). These visits were coordinated at the same pregnancy stage for hyperglycemic and control patients. All patients underwent anthropometric measurements, and blood samples were collected. The study design is shown in Figure 1.
Figure 1.
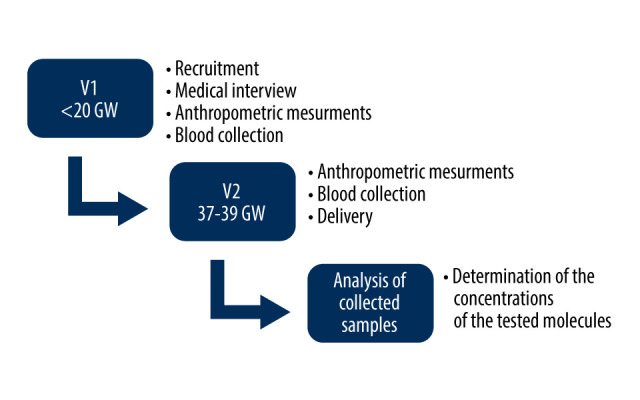
Study design. GW – week of gestation; V1 – visit first half of pregnancy; V2 – visit 37–39 weeks of gestation. Microsoft Power Point version 16.66.1.
Pregnancy hyperglycemia was diagnosed based on criteria from the Polish Diabetes Association (2017) [5], International Association of Diabetes and Pregnancy Study Groups, and World Health Organization. Upon admission, all patients received dietary education and training on glucose self-monitoring. Insulin therapy in a basal-bolus mode was initiated after a few days of observation if fasting glycemia exceeded 90 mg/dL (5.0 mmol/l) or 1-h postprandial glycemia exceeded 140 mg/dL (7.8 mmol/l). Follow-up visits at the outpatient clinic were scheduled every 2 to 3 weeks, with regular check-ups and admissions.
During the first appointment, patients received guidance on a diabetic diet, caloric content of meals, recommended weight gain during pregnancy, conversion of carbohydrate exchangers, and physical activity recommendations. Patients were advised to take at least 5000 steps daily and to aim for a weight gain of 5 to 7 kg, following the International Federation of Gynecology and Obstetrics guidelines based on pre-pregnancy BMI.
Samples and Laboratory Measurements
Blood samples were collected after an overnight fast and immediately transported for analysis. The glycated hemoglobin (HbA1c) level was measured using the Tina-quant Haemoglobin A1c II test on a Cobas c311 analyzer (Roche Diagnostics, Basel, Switzerland), with a standard range of 4.8% to 6.0% (29–42 mmol/mol) for non-pregnant populations. Triglyceride levels were measured with Roche Diagnostics reagents on a Cobas c501 analyzer, with reference values for women being 0.46 to 1.71 mmol/L. Insulin levels at visit V0 were measured using an enzyme immunoassay (DRG Insulin ELISA Kit, DRG Instruments GmbH, Marburg, Germany).
Amino Acid Measurements
The concentration of amino acids in serum samples collected at enrollment and during the perinatal period was analyzed in collaboration with the Department of Inorganic and Analytical Chemistry at Poznań University of Medical Sciences. Samples were stored at −80°C until analysis and processed randomly. The aTRAQ kit (Sciex, Framingham, MA, USA) was used to quantify up to 42 amino acids from physiological fluids, including serum, with internal standards compensating for matrix effects and eluent interferences. Analysis was performed using a 4000 QTRAP mass spectrometer (Sciex) and an LC instrument 1260 Infinity (Agilent Technologies, Santa Clara, CA, USA). Samples were coded and randomized before analysis. Samples were thawed at room temperature and subjected to the following preparation steps: 40 μL of the sample was transferred to a 0.5-mL Eppendorf tube; 10 μL of sulfosalicylic acid was added to precipitate proteins, mixed, and centrifuged; 10 μL of supernatant was transferred to a clean tube, and 40 μL of borate buffer pH 8.5 was added, mixed, and centrifuged. Then, 10 μL of the solution obtained in the previous step was transferred to a clean tube, and 5 μL of amine labelling reagent (aTRAQ Reagent Δ8) was added, mixed, and centrifuged. Samples were incubated for 30 min at room temperature. Then, 5 μL of 1.2% hydroxylamine solution was added, mixed, and centrifuged. Samples were incubated for 15 min at room temperature. Then, 32 μL of the previously prepared internal standard solution was added, mixed, and centrifuged. The contents of the tubes were concentrated using a vacuum concentrator (miVac Duo, Genevac, Stone Ridge, NY, USA) to a volume of about 20 μL (temperature 50°C for about 15 min). Then, 20 μL of ultrapure water was added and mixed, and the contents of the tubes were transferred to autosampler vials. Samples were analyzed by liquid chromatography coupled to tandem mass spectrometry.
The non-proteinogenic amino acids norleucine and norvaline were used to check the labeling efficiency (quality assurance). They were added to each sample at the stage of their preparation for analysis. Norleucine was added with sulfosalicylic acid, while norvaline was added with borate buffer. The presence of an internal standard for each amino acid compensates for matrix effects and improves the precision and accuracy of the determinations. It also increases the specificity of the method, ensuring the correct identification of analytes. The identification of amino acids in physiological samples is based on unique mass transitions for each analyte (multiple reaction monitoring [MRM] mode) and the consistency of the retention times of amino acids and their corresponding internal standards. The quality of the assessments was verified by analyzing commercially available control plasma (QC samples) containing specific levels of selected amino acids, which the manufacturer defines in the certificate, with reference ranges of concentrations. For amino acids separation, the Amino Acid Analyzer C18 Column (5 μm, 4.6×150 mm) was used. The separation of compounds was conducted at a temperature of 50°C, under gradient flow conditions (mobile phase modifiers were provided by the distributor, Sciex) at the flow rate of 0.8 mL/min. Mass spectrometer data acquisition was performed in MRM mode using the scheduled MRM. The mass spectrometer parameters, including MRM transitions for analytes and internal standards (Q1, precursor ion and Q3, product ion masses) recommended by the distributor of the aTRAQ kit (Sciex) were applied. The methodology, instrumentation, and method validation were as described in detail by us earlier [20].
The data were acquired and processed using the manufacturer’s software (Analyst Software, Sciex) and then converted to concentrations (expressed in μM) according to the protocol provided by the reagent supplier.
Statistical Analysis
The statistical methodology of the study was done with PQStat software, version 1.8.2.230 and was based on the methodology of one of our previous studies [4]. The Shapiro-Wilk test assessed normality. The t test was used for normally distributed variables, while Welch’s t test was applied for unequal variances. The Mann-Whitney U test handled non-normally distributed data, and the chi-square test examined differences between nominal variables. ANOVA with Fisher post hoc tests compared multiple groups of normally distributed data, while the Kruskal-Wallis ANOVA with Bonferroni post hoc tests was used for non-normally distributed data. Correlations were assessed using Spearman and Pearson linear correlation. Amino acid concentrations were presented as means and standard deviations. The chosen statistical methods ensured reliable analysis of diverse data types.
All participants provided written informed consent, and the local Bioethics Committee of Poznań University of Medical Sciences approved the study. The study was financed from the grant for young scientists of the Doctoral School of the Medical University of Poznań.
Results
Demographic Data and Basal State Plasma Substrate Concentrations Between the 2 Groups
The patients in the study and control groups did not differ significantly in age. The pre-pregnancy body weight of patients in the study group was significantly higher, following the inclusion criteria for both the study and control groups. Weight gain during pregnancy was substantially more remarkable in the control group (Table 1). The average gestational week of gestational diabetes diagnosis in the study group was 10.5 (±4.7) weeks.
Table 1.
Characteristics data and plasma substrate concentrations in the basal state of the study and control groups.
| Study Group (n=50) | Control Group (n=25) | P | ||
|---|---|---|---|---|
| Age [years] | Mean±SD | 33.1±5.6 | 32.5±5.0 | 0.078a |
| High [cm] | Mean±SD | 1.7±0.05 | 1.7±0.07 | 0.872a |
| Weight before pregnancy [kg] | Median [Q1; Q3] | 103.1 [89; 113.9] | 62.0 [54; 70] | <0.001b |
| Weight before labor [kg] | Median [Q1; Q3] | 108.7 [94; 119.8] | 73.0 [70; 80] | <0.001b |
| Weight gain [kg] | Median [Q1; Q3] | 3.0 [0.1; 7.5] | 12.0 [10; 14] | <0.001b |
| GDM diagnosis [GW] | Mean±SD | 10.5±4.7 | ||
| Beginning of insulin therapy [GW] | Mean±SD | 16.6±6.3 | ||
| 75gOGTT_0 [mg/dL] (SG – first half of pregnancy) CG – 24–28 GW |
Mean±SD | 103.5±10.5 | 82.5±5.0 | <0.001a |
| 75gOGTT_60 [mg/dL] | Mean±SD | 181.3±41.4 | 141.7±16.7 | 0.001a |
| 75gOGTT_120 [mg/dL] | Mean±SD | 169.4±67.1 | 103.1±15.8 | 0.046a |
| Hypertension | n (%) | 15 (30%) | 0 | |
| GDM history | n (%) | 13 (26%) | 0 | |
| Family history of diabetes | n (%) | 42 (84%) | 4 (16%) | 0.016c |
t test;
Mann Whitney test;
chi square test.
Q1 – first quartile; Q3 – third quartile; GDM – gestational diabetes mellitus; GW – gestational week; 75gOGTT – oral 75 g glucose tolerance test; SG – study group; CG – control group.
Patients from the study group were assessed for metabolic parameters: glycated hemoglobin, lipid fraction profile, fasting glucose and insulin levels, and the Homeostatic Model Assessment (HOMA) index (Table 2).
Table 2.
Characteristics of the metabolic parameters in the study group.
| Parameter | ||
|---|---|---|
| HBA1c V1 [%] | Median [Q1; Q3] | 5.3 [5; 5,6]*b |
| TG V1 [mg/dL] | Mean±SD | 162.7±61.1#a |
| CRP V1 [mg/L] | Median [Q1; Q3] | 7.4 [4.3; 13.4]& b |
| HBA1c V2 [%] | Median [Q1; Q3] | 5.5 [5.1; 5.7]* b |
| TG V2 [mg/dL] | Mean±SD | 311.0±132.0#a |
| CRP V2 [mg/L] | Median [Q1; Q3] | 6.3 [3.5; 10.7]& b |
| FBG [mg/dL] | Mean±SD | 76.4±20.8a |
| INS [uU/mL] | Median [Q1; Q3] | 17.1 [13.3; 29.5]b |
| HOMA-IR | Median [Q1; Q3] | 3.2 [2.1; 5.2]b |
| CHOL [mg/dL] | Mean±SD | 214.5±45.6a |
| LDL [mg/dL] | Median [Q1; Q3] | 90.3 [70.4; 106.4]b |
| HDL [mg/dL] | Median [Q1; Q3] | 41 [29.6; 54.4]b |
P=0,001;
P=0,001;
P=0,220;
t test;
Kolmogorov-Smirnow test.
Marks *, # and & relate to p value of comparison samples from visit V1 vs visit V2. Q1 – first quartile; Q3 – third quartile; V1 – visit first half of pregnancy; V2 – visit 37–39 weeks of gestation; HBA1c – glycosylated hemoglobin; HDL – high-density lipoprotein; LDL – low-density lipoprotein; TG – triglyceride; CRP – C-reactive protein; CHOL – cholesterol; FBG – fasting blood glucose; HOMA-IR – Homeostatic Model Assessment for Insulin Resistance.
Comparison of Plasma Amino Acid Concentrations in the 2 Groups
A comparison of the plasma amino acid concentrations between patients in the study group and those in the control group revealed numerous significant differences. Of the 30 measured amino acids, 23 serum concentrations differed significantly in patients with obesity (Table 3). Specifically, glutamine, L-asparagine, and L-methionine were markedly lower at the beginning of the observation period. In contrast, L-serine, glycine, hydroxy-L-proline, ethanolamine, L-aspartic acid, L-threonine, L-histidine, L-glutamic acid, gamma-aminobutyric acid, aminoisobutyric acid, L-arginine, L-proline, L-ornithine, L-lysine, L-valine, L-tyrosine, L-isoleucine, L-leucine, and L-phenylalanine exhibited significantly higher concentrations in the group of pregnant women with obesity and GDM. Studies suggest that the trajectories of multiple metabolites can vary based on BMI, race, ethnicity, and fetal sex [21].
Table 3.
The study group and control group amino acid concentrations at V1 and V2 visits.
| Amino acid | SG V1 |
CG V1 |
P | SG V2 |
CG V2 |
P | SG P (V1 vs V2) |
CG P (V1 vs V2) |
|---|---|---|---|---|---|---|---|---|
| n=50 Mean [μmol/dL] |
n=25 Mean [μmol/dL] |
n=50 Mean [μmol/dL] |
n=25 Mean [μmol/dL] |
|||||
| Taurine | 112.95 | 132.95 | 0.334b | 110.27 | 97.28 | 0.203b | 0.008b | 0.064b |
| L-Asparagine | 59.79 | 86.42 | 0.001a | 43.42 | 75.27 | 0.001a | 0.002a | 0.029a |
| L-Serine | 230.50 | 149.95 | 0.001a | 183.30 | 157.29 | 0.050a | 0.001a | 0.287a |
| Glycine | 242.62 | 193.70 | 0.001b | 204.50 | 187.58 | 0.323b | 0.011b | 0.829b |
| Hydroxy-L-proline | 10.90 | 8.80 | 0.011a | 13.30 | 12.85 | 0.484a | 0.544a | 0.158a |
| Ethanolamine | 10.55 | 9.15 | 0.038a | 10.09 | 10.17 | 0.919a | 0.118a | 0.195a |
| L-Glutamine | 180.65 | 511.45 | 0.001b | 178.20 | 491.50 | 0.001b | 0.861b | 0.008b |
| L-Aspartic acid | 94.30 | 39.10 | 0.000a | 74.08 | 54.85 | 0.005a | 0.009b | 0.015b |
| L-Citrulline | 14.70 | 14.10 | 0.418b | 14.40 | 15.30 | 0.912b | 0.853a | 0.440a |
| L-Threonine | 207.60 | 143.35 | 0.001a | 195.03 | 206.92 | 0.394a | 0.182a | 0.001a |
| L-Sarcosine | 0.50 | 0.50 | 0.823a | 0.40 | 0.40 | 0.580a | 0.509a | 0.046a |
| B-Alanine | 14.35 | 13.05 | 0.251a | 14.50 | 13.35 | 0.034a | 0.310a | 0.763a |
| L-Alanine | 338.33 | 290.44 | 0.120a | 291.84 | 333.38 | 0.079a | 0.055a | 0.313a |
| L-Glutamic acid | 318.96 | 119.29 | 0.001a | 279.68 | 135.39 | 0.001a | 0.015a | 0.227a |
| L-Histidine | 85.60 | 75.50 | 0.010a | 73.16 | 86.90 | 0.002a | 0.001a | 0.042a |
| L-α-Aminoadipic acid | 1.30 | 1.20 | 0.062a | 1.40 | 1.25 | 0.005a | 0.168a | 0.131a |
| γ-Amino-n-butyric acid | 1.20 | 1.00 | 0.002a | 1.10 | 1.00 | 0.019a | 0.723a | 0.608a |
| D, L-α-Aminoisobutyric acid | 1.70 | 1.15 | 0.003a | 1.60 | 1.75 | 0.367a | 0.371a | 0.097a |
| L- -Amino-n-butyric acid | 21.05 | 14.65 | 0.001a | 16.50 | 16.6 | 0.972a | 0.055a | 0.814a |
| L-Arginine | 169.70 | 78.30 | 0.001a | 144.60 | 95.55 | 0.001a | 0.197a | 0.001a |
| L-Proline | 163.00 | 114.05 | 0.000b | 155.40 | 147.05 | 0.433b | 0.875b | 0.087b |
| L-Ornithine | 108.25 | 75.70 | 0.001a | 95.10 | 74.30 | 0.010a | 0.240a | 0.864a |
| L-Lysine | 192.05 | 151.40 | 0.001a | 184.90 | 147.00 | 0.001a | 0.082a | 0.933a |
| L-Methionine | 0.30 | 27.00 | 0.001a | 1.10 | 19.50 | 0.001a | 0.618a | 0.004a |
| L-Valine | 215.25 | 180.55 | 0.001b | 193.00 | 175.70 | 0.076b | 0.003b | 0.451b |
| L-Tyrosine | 60.58 | 47.95 | 0.002b | 50.60 | 49.00 | 0.814b | 0.042b | 0.838b |
| L-Isoleucine | 203.45 | 97.95 | 0.001b | 155.00 | 106.00 | 0.004b | 0.064b | 0.829b |
| L-Leucine | 373.65 | 187.75 | 0.001b | 265.40 | 210.30 | 0.052b | 0.006b | 0.527b |
| L-Phenylalanine | 112.90 | 78.75 | 0.001b | 87.50 | 88.30 | 0.917b | 0.001b | 0.040b |
| L-Tryptophan | 42.09 | 42.41 | 0.899a | 33.60 | 34.70 | 0.803a | 0.001a | 0.008a |
t test;
Mann-Whitney U test.
SG – study group; CG – control group; V1 – visit first half of pregnancy; V2 – visit 37–39 weeks of gestation.
The changes observed during pregnancy revealed that, at the beginning of gestation, amino acids participating in carbohydrate metabolic processes were noticeably higher in pregnancies with obesity than in the control group. Proline and BCAAs are associated with increased insulin resistance. The concentrations of these amino acids decreased significantly during pregnancy (V2 visit). Glutamine, known for its ability to reduce insulin resistance, was consistently lower in the obesity group than in the control group during both observation periods (P=0.001), similar to serine (P=0.001) and asparagine (P=0.001) levels. In the control group, the concentrations of most amino acids remained stable across both visits during pregnancy. This stability suggests that specific inter-pregnancy factors may influence changes in the concentration of certain amino acids (Table 3).
Comparison of Plasma Amino Acid Concentrations Related to Lipid and Carbohydrate Metabolism
In the second part of our analysis, we selected a group of 10 amino acids associated with the metabolism of lipids and carbohydrates, which are known to be involved in the pathophysiology of gestational diabetes and obesity [8,13,15,18]. We analyzed their concentrations during visits V1 and V2 and changes in their concentrations based on groups determined based on metabolic parameters, body weight gain, and physical activity.
Based on the value of HbA1c, we divided the patients from the study group into 2 groups. We set a value of 5.5% as the cut-off point. This concentration was the reported limit of physiological values for HbA1c during pregnancy [22]. There were no significant differences in most amino acid concentrations in the 2 tested subgroups during visits V1 and V2 with HbA1c levels (Tables 4, 5). Significant differences between those 2 periods were found only in changes in the concentrations of phenylalanine (P=0.021), leucine (P=0.003), and isoleucine (P=0.004) (Table 6).
Table 4.
The study group and control group amino acid concentrations at V1 and V2 visits.
| Amino acid | V1 | V1 | P |
|---|---|---|---|
| HbA1c <5.5% | HbA1c >5.5% | ||
| n=27 [μmol/dL] | n=23 [μmol/dL] | ||
| L-Tyrosine | 61.93 | 57.53 | 0.426b |
| SD | 14.28 | 18.04 | |
| L-Phenylalanine | 120.41 | 109.76 | 0.420b |
| SD | 29.05 | 47.90 | |
| L-Citrulline | 16.22 | 16.62 | 0.867a |
| SD | 8.17 | 4.47 | |
| L-Proline | 187.34 | 150.52 | 0.058b |
| SD | 53.07 | 57.19 | |
| L-Glutamine | 181.07 | 209.05 | 0.441b |
| SD | 81.24 | 130.44 | |
| L-Leucine | 395.01 | 338.14 | 0.256b |
| SD | 130.43 | 160.49 | |
| L-Isoleucine | 200.11 | 180.98 | 0.413b |
| SD | 52.68 | 83.51 | |
| L-Valine | 229.73 | 221.23 | 0.651b |
| SD | 50.38 | 59.73 | |
| Glycine | 250.18 | 230.19 | 0.350b |
| SD | 47.19 | 77.17 | |
| Taurine | 121.13 | 111.63 | 0.287b |
| SD | 38.57 | 39.90 |
t test;
Mann-Whitney U test.
V1 – visit first half of pregnancy; V2 – visit 37–39 weeks of gestation; SD – standard deviation; HBA1c – glycosylated hemoglobin.
Table 5.
The study group and control group amino acid concentrations at V1 and V2 visits.
| Amino acid | V1 | V1 | P |
|---|---|---|---|
| HbA1c <5.5% | HbA1c >5.5% | ||
| n=26 [μmol/dL] | n=24 [μmol/dL] | ||
| L-Tyrosine | 52.37 | 53.04 | 0.901b |
| SD | 15.90 | 18.13 | |
| L-Phenylalanine | 85.69 | 95.00 | 0.301b |
| SD | 29.92 | 25.86 | |
| L-Citrulline | 17.35 | 16.27 | 0.682a |
| SD | 9.88 | 5.76 | |
| L-Proline | 170.16 | 168.45 | 0.925b |
| SD | 68.70 | 37.26 | |
| L-Glutamine | 188.60 | 215.01 | 0.430b |
| SD | 114.25 | 92.05 | |
| L-Leucine | 255.25 | 329.50 | 0.078b |
| SD | 110.82 | 152.32 | |
| L-Isoleucine | 145.17 | 186.92 | 0.090b |
| SD | 62.38 | 91.32 | |
| L-Valine | 186.16 | 198.10 | 0.427b |
| SD | 40.56 | 54.61 | |
| Glycine | 203.68 | 207.68 | 0.864b |
| SD | 86.31 | 52.43 | |
| Taurine | 103.21 | 121.17 | 0.456b |
| SD | 32.34 | 40.16 |
t test;
Mann Whitney test.
V1 – visit first half of pregnancy; V2 – visit 37–39 weeks of gestation; SD – standard deviation; HBA1c – glycosylated hemoglobin.
Table 6.
Changes in amino acid concentrations (between V1 and v2) to HbA1c concentration at V2.
| Amino acid | HbA1c ≤5.5% | HbA1c >5.5% | P |
|---|---|---|---|
| Delta V2-V1 | n=16 [μmol/dL] | n=15 [μmol/dL] | |
| L-Tyrosine | −7.48 | −2.33 | 0.460b |
| SD | 21.48 | 16.28 | |
| L-Phenylalanine | −40.69 | −6.72 | 0.021b |
| SD | 37.81 | 39.46 | |
| L-Citrulline | 2.44 | 0.21 | 0.537a |
| SD | 10.81 | 9.18 | |
| L-Proline | −5.22 | 2.57 | 0.697b |
| SD | 65.18 | 41.68 | |
| L-Glutamine | −39.12 | 26.18 | 0.142b |
| SD | 83.77 | 149.77 | |
| L-Leucine | −137.23 | 42.40 | 0.003b |
| SD | 150.65 | 154.27 | |
| L-Isoleucine | −52.66 | 37.38 | 0.004b |
| SD | 69.60 | 90.54 | |
| L-Valine | −46.27 | −3.79 | 0.062b |
| SD | 62.26 | 59.42 | |
| Glycine | −48.97 | −11.42 | 0.201b |
| SD | 88.56 | 69.33 | |
| Taurine | 7.16 | 3.18 | 0.178b |
| SD | 37.55 | 23.17 |
t test;
Mann-Whitney U test.
V1 – visit first half of pregnancy; V2 – visit 37–39 weeks of gestation; SD – standard deviation; HBA1c – glycosylated hemoglobin.
The following analysis (Table 5) was based on dividing patients according to triglyceride (TG) concentration quartiles, 4 ranges from the lowest to the highest concentrations. TG is one of the compounds strongly associated with obesity and insulin resistance. Some studies have demonstrated that plasma levels of BCAAs significantly and independently correlate with dyslipidemia and coronary artery diseases [23].
During visit V1, significant differences in amino acids L-proline (P=0.027), glycine (P=0.016), and proline (P=0.037) were observed primarily between patients in the third and fourth TG quartiles (Table 7). No significant differences were found during visit V2 (Table 8). Changes in concentration differed significantly between quartiles only in the case of proline; its concentration decreased substantially in the group with the highest TG levels during visit V2 (Table 9). However, it is noteworthy that only isoleucine concentration increased during pregnancy in the group with TGs in the highest quartile.
Table 7.
Amino acids concentrations during pregnancy and triglyceride quartile concentrations at V1.
| Amino acid | TG Q1 | TG Q2 | TG Q3 | TG Q4 | P |
|---|---|---|---|---|---|
| V1 | n=12 [μmol/dL] | n=13 [μmol/dL] | n=13 [μmol/dL] | n=12 [μmol/dL] | |
| L-Tyrosine | 61.47 | 61.61 | 54.84 | 64.97 | 0.505b |
| SD | 16.38 | 14.09 | 14.72 | 17.01 | |
| L-Phenylalanine | 127.49 | 123.54 | 93.98 | 127.92 | 0.101b |
| SD | 25.93 | 54.27 | 28.65 | 33.69 | |
| L-Citrulline | 16.79 | 16.09 | 13.24* | 19.51* | 0.163a |
| SD | 5.74 | 6.27 | 4.23 | 8.31 | |
| L-Proline | 174.13 | 174.29 | 139.80* | 203.30* | 0.071b |
| SD | 46.65 | 28.32 | 70.51 | 51.84 | |
| L-Glutamine | 187.28 | 225.99 | 153.89 | 237.19 | 0.353b |
| SD | 74.85 | 144.41 | 86.44 | 144.04 | |
| L-Leucine | 451.97 | 360.83 | 340.20 | 339.60 | 0.258b |
| SD | 49.09 | 174.84 | 137.96 | 161.59 | |
| L-Isoleucine | 233.45* | 191.86 | 177.70 | 172.67* | 0.168b |
| SD | 36.92 | 87.03 | 60.30 | 67.67 | |
| L-Valine | 233.64 | 222.69 | 215.23 | 236.14 | 0.793b |
| SD | 40.70 | 77.61 | 43.59 | 54.28 | |
| Glycine | 275.71* | 245.11 | 203.74* | 252.83* | 0.041b |
| SD | 52.21 | 62.47 | 58.83 | 47.59 | |
| Taurine | 129.93 | 114.63 | 99.83* | 151.67* | 0.057b |
| SD | 42.57 | 40.90 | 33.85 | 53.70 |
ANOVA;
Kruskal-Wallis test;
post hoc analysis P<0.05.
V1 – visit first half of pregnancy; V2 – visit 37–39 weeks of gestation; TG – triglycerides; Q1–4 – quartile 1–4; SD – standard deviation.
Table 8.
Amino acids concentrations during pregnancy and triglyceride quartile concentrations at V2.
| Amino acid | TG Q1 | TG Q2 | TG Q3 | TG Q4 | P |
|---|---|---|---|---|---|
| V2 | n=12 [μmol/dL] | n=13 [μmol/dL] | n=13 [μmol/dL] | n=12 [μmol/dL] | |
| L-Tyrosine | 58.51 | 52.77 | 49.90 | 51.78 | 0.698b |
| SD | 16.88 | 21.99 | 12.13 | 15.24 | |
| L-Phenylalanine | 83.49 | 89.36 | 86.23 | 99.03 | 0.582b |
| SD | 16.63 | 37.46 | 17.21 | 32.10 | |
| L-Citrulline | 19.37 | 14.58 | 15.62 | 17.42 | 0.569a |
| SD | 10.71 | 6.68 | 6.62 | 8.38 | |
| L-Proline | 204.42 | 155.45 | 153.15 | 170.94 | 0.182b |
| SD | 83.86 | 49.06 | 29.40 | 56.11 | |
| L-Glutamine | 191.71 | 218.76 | 162.40 | 202.73 | 0.675b |
| SD | 91.78 | 113.29 | 88.14 | 125.11 | |
| L-Leucine | 268.23 | 242.78 | 290.09 | 335.71 | 0.388b |
| SD | 112.71 | 98.41 | 125.41 | 170.38 | |
| L-Isoleucine | 153.22 | 140.88 | 157.58 | 192.50 | 0.420b |
| SD | 66.20 | 6.79 | 59.40 | 104.76 | |
| L-Valine | 208.27 | 178.08 | 188.84 | 198.91 | 0.516b |
| SD | 40.38 | 39.89 | 31.47 | 67.89 | |
| Glycine | 230.36 | 182.11 | 187.90 | 217.28 | 0.349b |
| SD | 86.12 | 62.41 | 40.11 | 82.50 | |
| Taurine | 114.84 | 100.42 | 114.82 | 111.72 | 0.245b |
| SD | 21.07 | 51.43 | 31.30 | 60.84 |
ANOVA test;
Kruskal-Wallis test.
V1 – visit first half of pregnancy; V2 – visit 37–39 weeks of gestation; TG – triglycerides; Q1–4 – quartile 1–4; SD – standard deviation.
Table 9.
Changes in amino acid concentrations during pregnancy and triglyceride quartile concentrations in the third trimester.
| Amino acid | TG Q1 | TG Q2 | TG Q3 | TG Q4 | P |
|---|---|---|---|---|---|
| Delta V2-V1 | n=12 [μmol/dL] | n=13 [μmol/dL] | n=13 [μmol/dL] | n=12 [μmol/dL] | |
| L-Tyrosine | 2.45 | −8.28 | −1.73 | −12.61 | 0.416b |
| SD | 24.38 | 18.91 | 16.72 | 18.86 | |
| L-Phenylalanine | −35.42 | −35.12 | −4.54 | −25.19 | 0.378b |
| SD | 31.01 | 51.43 | 39.78 | 37.77 | |
| L-Citrulline | 5.12 | −1,26 | 2.96 | −4.29 | 0.251a |
| SD | 12.76 | 10.10 | 8.80 | 10.23 | |
| L-Proline | 51.92* | −16.57 | 1.99* | −33.48* | 0.040b |
| SD | 70.82 | 54.23 | 39.28 | 64.72 | |
| L-Glutamine | −11.28 | −11.13 | 29.58 | −40.93 | 0.664b |
| SD | 100.15 | 110.73 | 64.13 | 171.03 | |
| L-Leucine | −131.27 | −85.70 | −33.36 | −2.68 | 0.462b |
| SD | 94.24 | 126.33 | 209.93 | 201.05 | |
| L-Isoleucine | −57.79 | −29.07 | −7.48 | 21.75 | 0.342b |
| SD | 53.53 | 72.14 | 91.21 | 115.35 | |
| L-Valine | −16.83 | −46.16 | −13.52 | −27.20 | 0.783b |
| SD | 54.84 | 78.68 | 43.60 | 81.55 | |
| Glycine | −15.49 | −53.98 | −13.57 | −43.83 | 0.682b |
| SD | 115.05 | 79.02 | 71.60 | 56.66 | |
| Taurine | −13.13 | −9.72 | 20.24 | −38.31 | 0.196b |
| SD | 39.77 | 73.95 | 49.34 | 60.24 |
ANOVA;
Kruskal-Wallis test;
post hoc analysis P<0.05.
V1 – visit first half of pregnancy; V2 – visit 37–39 weeks of gestation; TG – triglycerides; Q1–4 – quartile 1–4; SD – standard deviation.
In the next step of our study, patients were divided into 3 subgroups based on body weight changes during pregnancy. The first subgroup consisted of patients who lost weight during pregnancy, the second subgroup included patients with the recommended weight gain of 0 to 7 kg, and the third subgroup included patients with excessive weight gain above 7 kg throughout pregnancy. Across the entire cohort, regardless of weight changes during pregnancy, the concentrations of most amino acids associated with promoting insulin resistance decreased at visit V2 (Tables 10–12). Notably, L-glutamine, an amino acid known to improve glucose profiles and positively affect glucose oxidation and insulin resistance, increased in the group that lost weight during pregnancy [24].
Table 10.
Comparison of amino acids concentrations at V1 and V2 in groups with weight gain <0 kg.
| Amino acid | V1 | V1 | P |
|---|---|---|---|
| n=13 [μmol/dL] | n=13 [μmol/dL] | ||
| L-Tyrosine | 171.53 | 136.34 | 0.467b |
| SD | 96.65 | 99.84 | |
| L-Phenylalanine | 365.94 | 199.28 | 0.068b |
| SD | 294.01 | 172.49 | |
| L-Citrulline | 328.24 | 205.60 | 0.832a |
| SD | 177.76 | 361.61 | |
| L-Proline | 23.35 | 23.80 | 0.444b |
| SD | 27.42 | 14.18 | |
| L-Glutamine | 261.63 | 360.52 | 0.744b |
| SD | 202.07 | 132.05 | |
| L-Leucine | 302.81 | 222.37 | 0.035b |
| SD | 186.02 | 187.92 | |
| L-Isoleucine | 94.48 | 76.97 | 0.243b |
| SD | 61.22 | 41.33 | |
| L-Valine | 318.17 | 263.73 | 0.133b |
| SD | 91.17 | 78.25 | |
| Glycine | 560.14 | 398.56 | 0.083b |
| SD | 158.94 | 137.63 | |
| Taurine | 159.05 | 81.00 | 0.132b |
| SD | 84.24 | 79.92 |
t test;
Mann-Whitney U test.
V1 – visit first half of pregnancy; V2 – visit 37–39 weeks of gestation; SD – standard deviation.
Table 11.
Comparison of amino acid concentrations at V1 and V2 in groups with weight gain 0–7 kg.
| Amino acid | V1 | V1 | P |
|---|---|---|---|
| n=24 [μmol/dL] | n=24 [μmol/dL] | ||
| L-Tyrosine | 103.36 | 132.18 | 0.792b |
| SD | 107.05 | 189.67 | |
| L-Phenylalanine | 195.90 | 196.71 | 0.439b |
| SD | 241.56 | 169.99 | |
| L-Citrulline | 183.45 | 172.94 | 0.730a |
| SD | 55.96 | 116.23 | |
| L-Proline | 15.19 | 21.60 | 0.119b |
| SD | 10.86 | 30.01 | |
| L-Glutamine | 181.32 | 147.41 | 0.330b |
| SD | 147.95 | 252.65 | |
| L-Leucine | 157.24 | 191.26 | 0.401b |
| SD | 270.37 | 215.14 | |
| L-Isoleucine | 57.24 | 51.94 | 0.927b |
| SD | 62.37 | 82.48 | |
| L-Valine | 202.25 | 118.96 | 0.782b |
| SD | 257.34 | 170.18 | |
| Glycine | 352.96 | 215.02 | 0.233b |
| SD | 554.38 | 296.85 | |
| Taurine | 97.54 | 88.80 | 0.018b |
| SD | 125.04 | 74.30 |
t test;
Mann-Whitney U test.
V1 – visit first half of pregnancy; V2 – visit 37–39 weeks of gestation; SD – standard deviation.
Table 12.
Comparison of amino acid concentrations at V1 and V2 in groups with weight gain >7 kg.
| Amino acid | V1 | V1 | P |
|---|---|---|---|
| n=13 [μmol/dL] | n=13 [μmol/dL] | ||
| L-Tyrosine | 128.33 | 70.47 | 0.011b |
| SD | 30.46 | 41.09 | |
| L-Phenylalanine | 237.20 | 185.79 | 0.009b |
| SD | 32.21 | 61.90 | |
| L-Citrulline | 220.68 | 187.13 | 0.469a |
| SD | 112.39 | 158.18 | |
| L-Proline | 19.09 | 11.09 | 0.100b |
| SD | 8.93 | 4.59 | |
| L-Glutamine | 192.37 | 144.48 | 0.117b |
| SD | 55.38 | 73.03 | |
| L-Leucine | 214.61 | 173.98 | 0.104b |
| SD | 57.05 | 46.96 | |
| L-Isoleucine | 60.00 | 42.21 | 0.023b |
| SD | 16.23 | 11.88 | |
| L-Valine | 157.89 | 162.80 | 0.870b |
| SD | 40.64 | 56.73 | |
| Glycine | 288.87 | 281.13 | 0.868b |
| SD | 53.10 | 103.08 | |
| Taurine | 114.41 | 84.35 | 0.032b |
| SD | 29.99 | 39.47 |
t test;
Mann-Whitney U test.
V1 – visit first half of pregnancy; V2 – visit 37–39 weeks of gestation; SD – standard deviation.
In the perinatal period, significant differences among the 3 subgroups were observed for tyrosine, valine, and taurine. Concentration changes differed significantly between the groups with average and excessive weight gain (Table 12). Interestingly, in the group of patients with excessive weight gain, the concentration of isoleucine, unlike that of valine in the BCAA group, decreased significantly during pregnancy. Decreases were also noted in tyrosine (P=0.011) and phenylalanine (P=0.009), amino acids known to increase insulin resistance.
In a previous study, we demonstrated that taking at least 4210 steps per day during pregnancy enables patients with obesity to maintain the recommended weight gain [4]. In the present study, 30 patients from our cohort were monitored using pedometers. They were divided into 2 groups: those who walked fewer than 4210 steps per day and those who walked 4210 steps or more. Based on this division, no significant differences in amino acid concentrations were observed between the established subgroups (Tables 13–15).
Table 13.
Concentrations of amino acids at V1 and physical activity during pregnancy.
| Amino acid | <4210 Steps | >4210 Steps | P |
|---|---|---|---|
| n=13 [μmol/dL] | n=17 [μmol/dL] | ||
| L-Tyrosine | 60.77 | 62.16 | 0.858b |
| SD | 14.85 | 17.96 | |
| L-Phenylalanine | 107.60 | 113.32 | 0.676b |
| SD | 12.96 | 34.31 | |
| L-Citrulline | 17.45 | 15.23 | 0.510a |
| SD | 9.09 | 6.63 | |
| L-Proline | 173.80 | 175.77 | 0.947b |
| SD | 43.68 | 71.58 | |
| L-Glutamine | 160.38 | 180.98 | 0.664b |
| SD | 36.50 | 119.91 | |
| L-Leucine | 364.77 | 402.72 | 0.537b |
| SD | 70.18 | 151.96 | |
| L-Isoleucine | 199.50 | 206.09 | 0.806b |
| SD | 37.78 | 65.37 | |
| L-Valine | 207.22 | 227.04 | 0.375b |
| SD | 45.10 | 49.98 | |
| Glycine | 235.52 | 236.14 | 0.982b |
| SD | 26.88 | 68.24 | |
| Taurine | 113.98 | 121.59 | 0.752b |
| SD | 31.08 | 58.94 |
t test;
Mann-Whitney U test.
V1 – visit first half of pregnancy; V2 – visit 37–39 weeks of gestation; SD – standard deviation.
Table 14.
Concentrations of amino acids at V2 and physical activity.
| Amino acid | <4210 Steps | >4210 Steps | P |
|---|---|---|---|
| n=13 [μmol/dL] | n=17 [μmol/dL] | ||
| L-Tyrosine | 53.86 | 58.59 | 0.502b |
| SD | 16.79 | 16.39 | |
| L-Phenylalanine | 83.80 | 92.95 | 0.420b |
| SD | 17.20 | 29.35 | |
| L-Citrulline | 17.44 | 18.45 | 0.808a |
| SD | 11.76 | 8.79 | |
| L-Proline | 166..71 | 184.40 | 0.553b |
| SD | 78.32 | 66.07 | |
| L-Glutamine | 162.54 | 145.49 | 0.628b |
| SD | 111.75 | 67.82 | |
| L-Leucine | 262.07 | 319.55 | 0.351b |
| SD | 94.10 | 158.52 | |
| L-Isoleucine | 141.15 | 183.61 | 0.242b |
| SD | 47.75 | 94.45 | |
| L-Valine | 187.93 | 207.37 | 0.386b |
| SD | 51.13 | 52.78 | |
| Glycine | 213.37 | 215.06 | 0.961b |
| SD | 78.06 | 78.40 | |
| Taurine | 94.23 | 123.87 | 0.134b |
| SD | 42.75 | 46.46 |
t test;
Mann-Whitney U test.
V1 – visit first half of pregnancy; V2 – visit 37–39 weeks of gestation; SD – standard deviation.
Table 15.
Changes of amino acids concentrations during pregnancy and physical activity.
| Amino acid | <4210 Steps | >4210 Steps | P |
|---|---|---|---|
| n=13 [μmol/dL] | n=17 [μmol/dL] | ||
| L-Tyrosine | −3.79 | −1.61 | 0.667b |
| SD | 17.36 | 22.23 | |
| L-Phenylalanine | −22.56 | −19.78 | 0.882b |
| SD | 16.35 | 43.51 | |
| L-Citrulline | −3.04 | 4.23 | 0.202a |
| SD | 15.43 | 10.17 | |
| L-Proline | −12.46 | 11.46 | 0.510b |
| SD | 102.91 | 62.10 | |
| L-Glutamine | −10.22 | −38.33 | 0.648b |
| SD | 108.50 | 132.40 | |
| L-Leucine | −72.33 | −58.85 | 0.872b |
| SD | 84.19 | 193.18 | |
| L-Isoleucine | −40.79 | −6.84 | 0.443b |
| SD | 49.45 | 100.61 | |
| L-Valine | −13.04 | −12.75 | 0.993b |
| SD | 67.33 | 69.65 | |
| Glycine | −40.92 | −15.13 | 0.547b |
| SD | 29.29 | 100.07 | |
| Taurine | −24.27 | 3.04 | 0.378b |
| SD | 49.98 | 66.53 |
t test;
Mann-Whitney U test.
V1 – visit first half of pregnancy; V2 – visit 37–39 weeks of gestation; SD – standard deviation.
The linear correlation between amino acid concentrations and selected metabolic parameters was analyzed. The most interesting results were obtained in relation to OGTT. Statistically significant results are presented in Table 16.
Table 16.
Statistically significant correlations of amino acid concentrations with the OGTT test results.
| Amino acid | OGTT 0 | OGTT 60 | OGTT 120 | P |
|---|---|---|---|---|
| L-Asparagine V1 | 0.521 | 0.222 | 0.321 | 0.009a |
| L-Asparagine V2 | 0.445 | 0.298 | 0.244 | 0.016a |
| L-Glutamine V1 | 0.553 | 0.292 | 0.311 | 0.005b |
| L-Glutamine V2 | 0.499 | 0.337 | 0.485 | 0.006/0.011b |
| L-Aspartic acid V2 | 0.107 | 0.352 | 0.410 | 0.034b |
| L-Threonine V2 | 0.329 | 0.542 | 0.354 | 0.004a |
| L-Sarcosine V2 | −0.335 | −0.128 | −0.424 | 0.035/0.031a |
| L-Methionine V1 | 0.737 | 0.421 | 0.355 | <0.001a |
| L-Methionine V2 | 0.566 | 0.307 | 0.304 | 0.001a |
| L-Valine V1 | 0.450 | 0.079 | 0.349 | 0.028b |
The data in the table are presented as the correlation coefficient r.
Spearman test,
Pearson test.
OGTT – oral 75 g glucose tolerance test; V1 – visit first half of pregnancy; V2 – visit 37–39 weeks of gestation.
Discussion
Despite extensive research, the role of obesity in the development of various disorders and diseases remains incompletely understood. In recent years, the application of “omic” technologies to compare lean and obese individuals has advanced our understanding in this area. This study focused on the altered serum amino acid concentration profiles between pregnant women with obesity and GDM and lean pregnant women to identify correlations between serum amino acid patterns and other metabolic factors.
Our study revealed that the concentrations of many amino acids and biogenic amines changed during pregnancy, in both the study and control groups. Similar relationships have been demonstrated in previous studies [25]. However, the patterns of these concentration changes in the study group were not analogous to those in the control group, suggesting the influence of factors beyond pregnancy itself. In our study group, the effects of GDM, obesity, and the patients’ efforts to achieve and maintain metabolic balance were likely significant contributors.
The study by Yang et al demonstrated that the concentrations of alanine, aspartic acid, and glutamic acid in the first trimester positively correlate with gestational diabetes [26]. In our study group, the concentrations of aspartic acid and glutamic acid in the first half of pregnancy were significantly higher than those in the control group, while the concentration of alanine did not differ significantly. Before delivery, the concentrations of all 3 amino acids were significantly higher in the group of pregnant women with GDM. Similarly, high concentrations of isoleucine, tyrosine, and phenylalanine in the first trimester were positively correlated with the development of GDM. In our study, the concentrations of these molecules were also higher in the study group during the first trimester. In contrast, the concentrations of tyrosine and phenylalanine did not differ between the study and control groups during the perinatal period.
Alanine and glutamic acid belong to the group of gluconeogenic amino acids. Alanine inhibits hepatic autophagy, which is crucial for maintaining blood glucose concentrations [27]. Glutamate and aspartic acid are involved in N-methyl-D-aspartate (NMDA) activation; inhibition of NMDA increases glucose-stimulated insulin secretion, thereby improving glucose tolerance [26]. BCAAs, including isoleucine and aromatic amino acids, such as tyrosine and phenylalanine, play significant roles in carbohydrate metabolism. BCAAs can activate the mammalian target of rapamycin complex (mTOR); and prolonged elevation of BCAA concentrations results in hyperactivation of mTOR signaling and subsequent β-cell dysfunction [28]. An excess of aromatic amino acids, particularly tyrosine, could impair blood glucose clearance and enhance gluconeogenesis [29].
BCAAs are closely associated with obesity, insulin resistance, and type 2 diabetes. Their relationship with obesity and insulin secretion has been recognized since the 1960s [30,31]. Elevated blood BCAA levels have been observed in rodent models of obesity [17]. Cahill et al [31] found highly significant correlations between fasting plasma insulin concentrations and levels of valine, isoleucine, and leucine in a cohort of 20 individuals with and without obesity. Subsequent studies have proposed that higher tissue and blood concentrations of BCAAs in human obesity contribute to or exacerbate insulin resistance through mechanisms involving leucine, which promotes the activation of the mTOR in muscles [32]. There are also reports of changes in BCAA concentrations that occur as a result of glucose consumption during the OGTT [33].
In our study, BCAA concentrations were significantly higher in the group of patients with obesity and GDM than in the group of lean patients without GDM. The concentrations of valine and isoleucine were significantly higher in the study group during the first half of pregnancy when diabetes was diagnosed than in the second half of pregnancy. We associate the decrease in the concentrations of these amino acids with the implementation of dietary and insulin therapy. The patients remained under the constant supervision of a center specializing in GDM treatment, receiving lifestyle recommendations and counseling regarding weight gain during pregnancy. In the control group, we observed an increase in the concentrations of leucine and isoleucine during pregnancy. Insulin treatment likely had a significant impact on reducing BCAA concentrations in the serum of patients with GDM.
The effect of insulin on BCAA plasma levels was first investigated in patients with type 1 diabetes [34,35]. Results indicated that the withdrawal of insulin treatment was associated with a substantial increase in circulating BCAA concentrations. The effect of insulin on leucine flux has been examined in humans using intravenous infusions of insulin combined with [1–13C]- or [1–14C]-leucine tracers. An intravenous insulin infusion in non-diabetic individuals provoked a decline in leucine flux due to reduced protein breakdown without affecting protein synthesis [36,37]. Given that a Western diet is characterized by high fat and protein intake, dietary protein consumption may contribute to changes in plasma BCAA levels. Newgard et al reported that individuals with obesity and insulin resistance consumed more protein than did lean individuals [35].
In the group of pregnant women with GDM and obesity, the introduction of a healthy, low-carbohydrate diet rich in vegetables and unprocessed foods likely contributed to the reduction of BCAA concentrations in the patient’s serum. An interesting finding in the study group was a decrease in the concentrations of leucine and isoleucine in the subgroup of patients whose HBA1c level was below 5.5%. This may indirectly indicate that better metabolic control, which includes a proper diet and effective insulin treatment, reduces the concentration of BCAAs in the serum.
Metabolomics encompasses various methods, analytical platforms, and specimen types, leading to diverse definitions and approaches. Similarly, hyperglycemia in pregnancy is characterized by different diagnostic criteria, cut-off points, and screening tests, alongside a significant gap in understanding long-term maternal and fetal adverse outcomes. The study group presented in this paper was selected from the entire GDM cohort treated in our department; all recruited patients fulfilled the specified criteria. This created a group that was notably cohesive and uniform, enhancing the reliability of our findings. These factors can influence the study quality and, consequently, the expected results. The relatively small size of the study group can be a limiting factor in our study, but the homogeneity of this group allows us to obtain significant results. The dynamic condition of pregnancy can also limit the comparability of our studies.
Conclusions
Our study showed a large number of differences in amino acid concentrations in pregnant patients with obesity and GDM compared with healthy pregnant women. Proline, leucine, valine, and isoleucine were higher in obese pregnancies than in the control group. Conversely, glutamine, taurine, and asparagine were significantly lower in the obesity group than in the control group during both observation periods. Changes in isoleucine, tyrosine, taurine, and phenylalanine concentrations were associated with patients’ weight gain during pregnancy. The observed differences can be the basis for broader studies that will provide more detailed information on the role of amino acids in the etiology of metabolic disorders during pregnancy.
Early identification of women at risk for GDM has been a significant challenge due to the lack of an ideal diagnostic tool. However, in Poland, patients with obesity are diagnosed as early as pregnancy is confirmed. Metabolome studies, including ours, provide a comprehensive overview of metabolic interactions within a given biological system, allowing the simultaneous identification and quantification of numerous analytes in a highly productive and unbiased manner. In this context, metabolomics has emerged as a technology with the potential for the early detection of GDM, in addition to enhancing the understanding of the pathogenesis and impact of the disease on both the mother and her offspring [38].
Abbreviations
- GDM
gestational diabetes mellitus
- BCAAs
branched- chain amino acids
- BMI
body mass index
- V1
visit first half of pregnancy
- V2
visit 37–39 weeks of gestation
- HbA1C
glycated hemoglobin
- OGTT
oral glucose tolerance test
- GW
gestational week
- OGTT
oral glucose tolerance test
- HDL
high-density lipoprotein
- LDL
low-density lipoprotein
- CRP
C-reactive protein
- CHOL
cholesterol
- FBG
fasting blood glucose
- HOMA-IR
Homeostatic Model Assessment for Insulin Resistance
- NMDA
N-methyl-d-aspartate
Footnotes
Conflict of interest: None declared
Publisher’s note: All claims expressed in this article are solely those of the authors and do not necessarily represent those of their affiliated organizations, or those of the publisher, the editors and the reviewers. Any product that may be evaluated in this article, or claim that may be made by its manufacturer, is not guaranteed or endorsed by the publisher
Ethics Approval and Consent to Participate: All patients participating in the study gave written informed consent to participate. The study was approved by the local bioethics committee of the Poznań University of Medical Sciences (number 51/20). Authors confirm that all methods were carried out in accordance with relevant guidelines and regulations.
Department and Institution Where Work Was Done: Department of Reproduction, Chair of Fetomaternal Medicine and Department of Inorganic and Analytical Chemistry, Poznań University of Medical Sciences, Poznań, Poland
Declaration of Figures’ authenticity: All figures submitted have been created by the authors, who confirm that the images are original with no duplication and have not been previously published in whole or part.
Financial support: This study was supported by a grant from the Doctoral School, Poznań University of Medical Sciences, Poznań, Poland
Availability of Data and Materials
The authors make it possible to share the data and materials used to develop and interpret the results. Please contact Łukasz Adamczak, corresponding author.
References
- 1.Bomba-Opon D, Gutaj P, Kedzia M, et al. Guidelines of the Polish Society of Gynecologists and Obstetricians on the obstetric care of women with obesity. Ginekol Pol. 2023;94:1011–29. doi: 10.5603/gpl.97361. [DOI] [PubMed] [Google Scholar]
- 2.Ford ES, Williamson DF, Liu S. Weight change and diabetes incidence: Findings from a national cohort of US adults. Am J Epidemiol. 1997;146:214–22. doi: 10.1093/oxfordjournals.aje.a009256. [DOI] [PubMed] [Google Scholar]
- 3.Leddy MA, Power ML, Schulkin J. The impact of maternal obesity on maternal and fetal health. Rev Obstet Gynecol. 2008;1:170–78. [PMC free article] [PubMed] [Google Scholar]
- 4.Adamczak L, Mantaj U, Sibiak R, et al. Physical activity, gestational weight gain in obese patients with early gestational diabetes and the perinatal outcome – a randomised-controlled trial. BMC Pregnancy Childbirth. 2024;24:104. doi: 10.1186/s12884-024-06296-3. [DOI] [PMC free article] [PubMed] [Google Scholar]
- 5.Wender-Ozegowska E, Bomba-Opon D, Brazert J, et al. Standards of Polish Society of Gynecologists and Obstetricians in management of women with diabetes. Ginekol Pol. 2018;89(6):341–50. doi: 10.5603/GP.a2018.0059. [DOI] [PubMed] [Google Scholar]
- 6.Connor SC, Hansen MK, Corner A, et al. Integration of metabolomics and transcriptomics data to aid biomarker discovery in type 2 diabetes. Mol Biosyst. 2010;6:909–21. doi: 10.1039/b914182k. [DOI] [PubMed] [Google Scholar]
- 7.Cuomo P, Capparelli R, Iannelli A, Iannelli D. Role of branched-chain amino acid metabolism in type 2 diabetes, obesity, cardiovascular disease and non-alcoholic fatty liver disease. Int J Mol Sci. 2022;23:4325. doi: 10.3390/ijms23084325. [DOI] [PMC free article] [PubMed] [Google Scholar]
- 8.Murakami S. Role of taurine in the pathogenesis of obesity. Mol Nutr Food Res. 2015;59:1353–63. doi: 10.1002/mnfr.201500067. [DOI] [PubMed] [Google Scholar]
- 9.Bentley-Lewis R, Huynh J, Xiong G, et al. Metabolomic profiling in the prediction of gestational diabetes mellitus. Diabetologia. 2015;58:1329–32. doi: 10.1007/s00125-015-3553-4. [DOI] [PMC free article] [PubMed] [Google Scholar]
- 10.Rahimi N, Razi F, Nasli-Esfahani E, et al. Amino acid profiling in the gestational diabetes mellitus. J Diabetes Metab Disord. 2017;16:13. doi: 10.1186/s40200-016-0283-1. [DOI] [PMC free article] [PubMed] [Google Scholar]
- 11.Li N, Li J, Wang H, et al. Branched-chain amino acids and their interactions with lipid metabolites for increased risk of gestational diabetes. J Clin Endocrinol Metab. 2022;107:e3058–e65. doi: 10.1210/clinem/dgac141. [DOI] [PMC free article] [PubMed] [Google Scholar]
- 12.Adeva-Andany M, Souto-Adeva G, Ameneiros-Rodríguez E, et al. Insulin resistance and glycine metabolism in humans. Amino Acids. 2018;50:11–27. doi: 10.1007/s00726-017-2508-0. [DOI] [PubMed] [Google Scholar]
- 13.Nathanielsz PW, Yan J, Green R, et al. Maternal obesity disrupts the methionine cycle in baboon pregnancy. Physiol Rep. 2015;3:e12564. doi: 10.14814/phy2.12564. [DOI] [PMC free article] [PubMed] [Google Scholar]
- 14.Darmaun D, Torres-Santiago L, Mauras N. Glutamine and type 1 diabetes mellitus: Is there a role in glycemic control? Curr Opin Clin Nutr Metab Care. 2019;22:91–95. doi: 10.1097/MCO.0000000000000530. [DOI] [PubMed] [Google Scholar]
- 15.Scholtens DM, Muehlbauer MJ, Daya NR, et al. HAPO Study Cooperative Research Group. Metabolomics reveals broad-scale metabolic perturbations in hyperglycemic mothers during pregnancy. Diabetes Care. 2014;37:158–66. doi: 10.2337/dc13-0989. [DOI] [PMC free article] [PubMed] [Google Scholar]
- 16.Bagheripour F, Jeddi S, Kashfi K, Ghasemi A. Anti-obesity and anti-diabetic effects of L-citrulline are sex-dependent. Life Sci. 2024;339:122432. doi: 10.1016/j.lfs.2024.122432. [DOI] [PubMed] [Google Scholar]
- 17.Felig P, Marliss EF, Cahill GF., Jr Plasma amino acid levels and insulin secretion in obesity. N Engl J Med. 1969;281:811–16. doi: 10.1056/NEJM196910092811503. [DOI] [PubMed] [Google Scholar]
- 18.Felig P, Wahren J, Hendler R, Brundin T. Splanchnic glucose and amino acid metabolism in obesity. J Clin Invest. 1974;53:582–90. doi: 10.1172/JCI107593. [DOI] [PMC free article] [PubMed] [Google Scholar]
- 19.Gougeon R, Morais JA, Chevalier S, Pereira S, et al. Determinants of whole-body protein metabolism in subjects with and without type 2 diabetes. Diabetes Care. 2008;31:128–33. doi: 10.2337/dc07-1268. [DOI] [PubMed] [Google Scholar]
- 20.Matysiak J, Dereziński P, Klupczyńska A, et al. Effects of a honeybee sting on the serum free amino acid profile in humans. PLoS One. 2014;9(7):e103533. doi: 10.1371/journal.pone.0103533. [DOI] [PMC free article] [PubMed] [Google Scholar]
- 21.Mitro SD, Wu J, Rahman ML, et al. Longitudinal plasma metabolomics profile in pregnancy – a study in an ethnically diverse U.S. pregnancy cohort. Nutrients. 2021;13:3080. doi: 10.3390/nu13093080. [DOI] [PMC free article] [PubMed] [Google Scholar]
- 22.Yu H, Qi X, Wang X. Application of glycated hemoglobin in the perinatal period. Int J Clin Exp Med. 2014;7:4653–59. [PMC free article] [PubMed] [Google Scholar]
- 23.McGarrah RW, White PJ. Branched-chain amino acids in cardiovascular disease. Nat Rev Cardiol. 2023;20:77–89. doi: 10.1038/s41569-022-00760-3. [DOI] [PMC free article] [PubMed] [Google Scholar]
- 24.Jafari-Vayghan H, Varshosaz P, Hajizadeh-Sharafabad F, et al. A comprehensive insight into the effect of glutamine supplementation on metabolic variables in diabetes mellitus: A systematic review. Nutr Metab (Lond) 2020;17:80. doi: 10.1186/s12986-020-00503-6. [DOI] [PMC free article] [PubMed] [Google Scholar]
- 25.Rahimi N, Razi F, Nasli-Esfahani E, Qorbani M, et al. Amino acid profiling in the gestational diabetes mellitus. J Diabetes Metab Disord. 2017;16:13. doi: 10.1186/s40200-016-0283-1. [DOI] [PMC free article] [PubMed] [Google Scholar]
- 26.Yang J, Wu J, Tekola-Ayele F, et al. Plasma amino acids in early pregnancy and midpregnancy and their interplay with phospholipid fatty acids in association with the risk of gestational diabetes mellitus: Results from a longitudinal prospective cohort. Diabetes Care. 2023;46:722–32. doi: 10.2337/dc22-1892. [DOI] [PMC free article] [PubMed] [Google Scholar]
- 27.Wu G. Amino acids: Metabolism, functions, and nutrition. Amino Acids. 2009;37:1–17. doi: 10.1007/s00726-009-0269-0. [DOI] [PubMed] [Google Scholar]
- 28.Gar C, Rottenkolber M, Prehn C, et al. Serum and plasma amino acids as markers of prediabetes, insulin resistance, and incident diabetes. Crit Rev Clin Lab Sci. 2018;55:21–32. doi: 10.1080/10408363.2017.1414143. [DOI] [PubMed] [Google Scholar]
- 29.Chen T, Ni Y, Ma X, et al. Branched-chain and aromatic amino acid profiles and diabetes risk in Chinese populations. Sci Rep. 2016;6:20594. doi: 10.1038/srep20594. [DOI] [PMC free article] [PubMed] [Google Scholar]
- 30.Zhang S, Li X, Luo H, et al. Role of aromatic amino acids in pathogeneses of diabetic nephropathy in Chinese patients with type 2 diabetes. J Diabetes Complications. 2020;34:107667. doi: 10.1016/j.jdiacomp.2020.107667. [DOI] [PubMed] [Google Scholar]
- 31.Adibi SA. Influence of dietary deprivations on plasma concentration of free amino acids of man. J Appl Physiol. 1968;25:52–57. doi: 10.1152/jappl.1968.25.1.52. [DOI] [PubMed] [Google Scholar]
- 32.Wijekoon EP, Skinner C, Brosnan ME, Brosnan JT. Amino acid metabolism in the Zucker diabetic fatty rat: Effects of insulin resistance and of type 2 diabetes. Can J Physiol Pharmacol. 2004;82:506–14. doi: 10.1139/y04-067. [DOI] [PubMed] [Google Scholar]
- 33.Gao B, Shen Q, Wu Y, et al. Branched-chain and aromatic amino acid levels response to an oral glucose load associated with gestational diabetes mellitus. Sci Rep. 2022;12:12257. doi: 10.1038/s41598-022-16539-y. [DOI] [PMC free article] [PubMed] [Google Scholar]
- 34.Newgard CB, An J, Bain JR, et al. A branched-chain amino acid-related metabolic signature that differentiates obese and lean humans and contributes to insulin resistance. Cell Metab. 2009;9:311–26. doi: 10.1016/j.cmet.2009.02.002. [DOI] [PMC free article] [PubMed] [Google Scholar]
- 35.Nair KS, Garrow JS, Ford C, et al. Effect of poor diabetic control and obesity on whole body protein metabolism in man. Diabetologia. 1983;25:400–3. doi: 10.1007/BF00282518. [DOI] [PubMed] [Google Scholar]
- 36.Nair KS, Ford GC, Ekberg K, et al. Protein dynamics in whole body and in splanchnic and leg tissues in type I diabetic patients. J Clin Invest. 1995;95:2926–37. doi: 10.1172/JCI118000. [DOI] [PMC free article] [PubMed] [Google Scholar]
- 37.Meek SE, Persson M, Ford GC, Nair KS. Differential regulation of amino acid exchange and protein dynamics across splanchnic and skeletal muscle beds by insulin in healthy human subjects. Diabetes. 1998;47:1824–35. doi: 10.2337/diabetes.47.12.1824. [DOI] [PubMed] [Google Scholar]
- 38.Fukagawa NK. Insulin-mediated reduction of whole body protein breakdown. Dose-re sponse effects on leucine metabolism in postabsorptive men. J Clin Invest. 1985;76:2306–11. doi: 10.1172/JCI112240. [DOI] [PMC free article] [PubMed] [Google Scholar]
Associated Data
This section collects any data citations, data availability statements, or supplementary materials included in this article.
Data Availability Statement
The authors make it possible to share the data and materials used to develop and interpret the results. Please contact Łukasz Adamczak, corresponding author.