

Abstract
Cytotoxic accumulation of loosely bound mitochondrial Fe2+ is a hallmark of Friedreich's Ataxia (FA), a rare and fatal neuromuscular disorder with limited therapeutic options. There are no clinically approved medications targeting excess Fe2+ associated with FA or the neurological disorders Parkinson's disease and Multiple System Atrophy. Traditional iron-chelating drugs clinically approved for systemic iron overload that target ferritin-stored Fe3+ for urinary excretion demonstrated limited efficacy in FA and exacerbated ataxia. Poor treatment outcomes reflect inadequate binding to excess toxic Fe2+ or exceptionally high affinities (i.e. ≤10−31) for non-pathologic Fe3+ that disrupts intrinsic iron homeostasis. To understand previous treatment failures and identify beneficial factors for Fe2+-targeted therapeutics, we compared traditional Fe3+ chelators deferiprone (DFP) and deferasirox (DFX) with additional iron-binding compounds including ATH434, DMOG, and IOX3. ATH434 and DFX had moderate Fe2+ binding affinities (Kd’s of 1–4 µM), similar to endogenous iron chaperones, while the remaining had weaker divalent metal interactions. These compounds had low/moderate affinities for Fe3+(0.46–9.59 µM) relative to DFX and DFP. While all compounds coordinated iron using molecular oxygen and/or nitrogen ligands, thermodynamic analyses suggest ATH434 completes Fe2+ coordination using H2O. ATH434 significantly stabilized bound Fe2+ from ligand-induced autooxidation, reducing reactive oxygen species (ROS) production, whereas DFP and DFX promoted production. The comparable affinity of ATH434 for Fe2+ and Fe3+ position it to sequester excess Fe2+ and facilitate drug-to-protein iron metal exchange, mimicking natural endogenous iron binding proteins, at a reduced risk of autooxidation-induced ROS generation or perturbation of cellular iron stores.
Keywords: ATH434, Unique, Iron-Targeting Compound, Treating, Iron, Regulation
Graphical Abstract
Graphical Abstract.
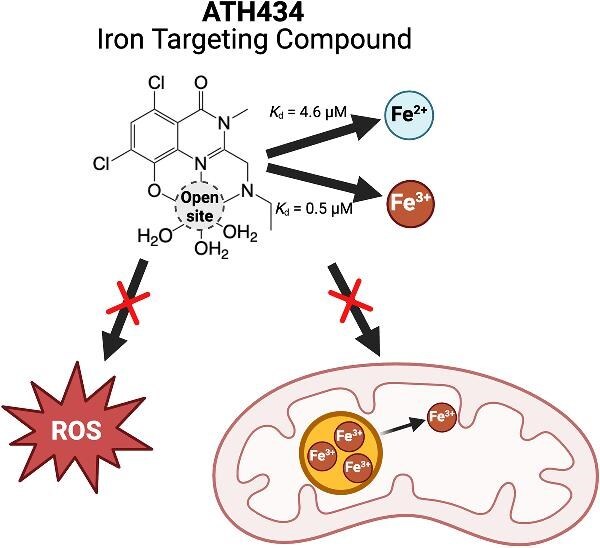
Illustration of the putative binding site of ATH434 and mechanism of iron targeting. ATH434 has affinities similar to endogenous iron binding chaperones, capable of removing excess Fe2+ without stripping ferritin bound Fe3+.
Introduction
Several human disorders, including the thalassemia's, hemochromatosis, and neurodegenerative diseases including PD and MSA, present toxic conditions where cellular iron overload leads to reactive oxygen species (ROS) formation that degrades the cell and reduces its’ viability.1–8 Under normal conditions, ferrous ions brought into the cell are destined for one of several fates, including binding by the poly(rC)-binding proteins (PCBP) for delivery to and loading onto mono- and dinuclear Fe-binding proteins or into ferritin, or being transported into the mitochondrial matrix.9–11 Within the matrix, a major portion of the Fe2+ is utilized by the ISC apparatus to produce the 2Fe-2S clusters required for energy metabolism and in additional essential cellular pathways. Since the ISC pathway also actively controls the only additional Fe-S cluster assembly cellular pathway, located in the cytosol, the production of all eukaryotic cellular Fe-S clusters is dependent upon the ability of the ISC pathway to utilize mitochondrial Fe2+ directed for assembly. As a result, a breakdown in the ISC pathway leads to a cellular deficiency of all Fe-S clusters, and this hinders functions throughout the entire cell.12–15
Iron chelation represents an essential therapy for managing systemic iron overload comorbid with a variety of human diseases. Deferoxamine (DFO), a naturally occurring iron chelator, was the first FDA-approved compound for such clinical use in iron overload disorders with efficacy associated with excretion of metal into urine.16–18 As a siderophore, DFO is a member of a large family of linear and cyclic polyamides produced by several organisms (e.g. bacteria, plants, yeast, and some fungi) that scavenge the limited bioavailable iron found in a cell's aerobic environment at neutral pH.19–21 These naturally occurring siderophores are highly effective scavengers for Fe3+, consistent with their oxygen-rich, typically 6-coordinate ligation that accommodates ferric ions in O2-exposed environments of target cells.22–24 DFO has a Fe3+ scavenging efficacy that reduces [Fe3+]aq in exposed environments to 10−31 M; however, its poor cell permeability limits its use in a clinical setting to injection or infusion.25–27
The search for new robust iron chelators with properties suitable for non-parenteral use led to the development and approval of two orally available synthetic siderophores, deferiprone (DFP, Ferriprox@) and deferasirox (DFX, Exjade@). Like DFO, DFP (3-hydroxy-1,2-dimethylpyridin-4(1H)-one) also provides an oxygen-inclusive ligand field with a high [Fe3+]aq affinity of ca. 10−35 M.28,29 Being a bidentate ligand, it forms an octahedral tris-complex with 6-coordinate Fe3+, similar to what is observed for DFO. DFX (4-[3,5-bis(2-hydroxyphenyl)-1H-1,2,4-triazol-1-yl]benzoic acid) also has an oxygen-inclusive ligand field with a high [Fe3+]aq affinity of ca. 10−37 M. In its crystalline state, DFX is tridentate, forming a bis-ligand complex with ferric ions.30 The high affinity for Fe3+ from DFO, DFP, and DFX make them (as well as additional ferric and ferrous ion chelating compounds) potentially useful for depleting cellular iron pools in cancer treatment; however, their effectiveness is limited in treating other disorders.31
Despite a decades-long effort to expand use of these three traditional iron chelators to iron accumulation diseases comorbid with neurodegenerative and cardiovascular pathophysiology, their limited efficacy has been outweighed by adverse effects.32–37 A particularly telling example arose from a clinical trial using DFP to treat brain iron accumulation common in Friedreich's Ataxia (FA), a genetic disorder resulting in knock-down of the mitochondrial protein ‘frataxin’.38,39 Frataxin, a nuclear-encoded mitochondrial matrix Fe2+-binding protein, directs Fe-S cluster assembly by promoting delivery of ferrous ions to the scaffold protein (ISCU in humans), the enzyme that assembles 2Fe-2S clusters.12,40–43 In FA, inability to produce Fe-S clusters (and heme) coupled with mitochondrial iron overload reduces a cell's ability to regulate metabolism and this limits cellular viability.44,45 High doses of DFP in a clinical study worsened ataxia scores, an effect attributed to a reduction in Fe-S cluster biogenesis, as DFP is a far more robust scavenger of cellular iron than any cellular iron ‘chaperone’.46
These previous studies show there is a disconnect for using for ferric ion chelators that lead to urinary or fecal iron excretion to manage accessible cellular iron which, given the cell's relatively low dissolved [O2], is predominately composed of ferrous ions.47–50 Ferrous ions have long been recognized as pro-oxidants due to their promotion of the step-wise one-electron reduction of O2 or H2O2, which supports the Fenton reaction and produces hydroxyl (HO ·) radicals.51,52 Production of radicals is enhanced by coordinating ligands that prefer Fe3+ in comparison to Fe2+, with the effect driven by the ratio [log βIII/βII, ] or the stability constants of the Fe3+ vs. Fe2+ complex of a given ligand. The potent ferric ion chelator DFO and other molecules containing hard ligand (oxygen) coordinating species (e.g. phosphate, EDTA, nitrilotriacetate (NTA)) are well-known to potentiate the autooxidation of the softer (Fe2+) metal redox state.53–57 For diseases including FA in which the clinical indications in pathology are driven by the sequelae of misregulated Fe2+, having a ferrous ion binding molecule present with limited capacity to promote oxygen species reduction, without generating cytotoxic conditions from its presence, would help reduce toxic effects and ROS production that complicates these disorders,58 an approach evaluated previously but that has not yielded clinical candidates.59
In this context, a rational choice for a potential therapeutic directed at managing cell iron rather than chelating it would position the ideal compound to add to, rather than compete with, the cell's natural iron handling machinery. Thus, advantageous compounds would have limited disparities between affinities for Fe2+ and Fe3+, with stability constants similar to the µM values that characterize the stability of Fe2+ in the metabolically available iron pool.60–65 A µM Fe2+ affinity would be consistent with the affinity of frataxin, ISCU and additional recipient ferrous ion binding proteins within the cell, a property that could promote metal transfer during natural ferrous ion delivery in biochemical pathways.9,40,41,66,67
Here, we describe the biophysical characterization of the two standard Fe3+ chelators (DFP and DFX) with three additional iron-targeting compounds, examining their metal binding affinity for Fe2+ vs. Fe3+, their metal to ligand coordination stoichiometry and their metal-ligand bound structures. One of the compounds, ATH434 (5,7-dichloro-2-((ethylamino)methyl)-8-hydroxy-3-methylquinazolin-4(3H)-one) previously referred to as PBT434,68 has shown efficacy in preclinical models of PD and MSA, and it is in Phase 2 clinical trials for MSA.68–74 The remaining two iron binding compounds, DMOG (dimethyloxalylglycine, the prodrug to N-oxalylglycine), and IOX3 (N-[(1-chloro-4-hydroxy-3-isoquinolinyl)carbonyl]-glycine), were also specifically chosen due to their ability to manage hypoxia in cells and share putative iron-binding motifs with ATH434 (see compound structures in Fig. 1).75,76 We further compared the ability of ATH434, DFP and DFX to induce ferrous ion autooxidation, an important consideration for regulating cellular oxidation related to Fenton chemistry. A methoxy-analog of ATH434 previously reported to have limited iron-binding capacity, served as a control for our affinity and autooxidation studies.68 In aggregate, ATH434 conformed to the proposed characteristics of a suitable therapeutic iron-targeting compound for treatment of iron regulation disorders.
Fig. 1.

Structures of iron binding compounds. Traditional iron chelators: (A) Deferoxamine (DFO), (B) deferasirox (DFX), and (C) deferiprone (DFP). Iron coordinating compounds: (D) dimethyloxalylglycine (DMOG) and (E) N-[(1-chloro-4-hydroxy-3-isoquinolinyl)carbonyl]-glycine (IOX3). Novel iron targeting molecules: (F) ATH434, and its 8-methoxy derivative (G) ATH434-OMe.
Methods
Fe2+ metal binding competition assay
Ferrous ion binding affinities were determined for each of the five compounds of interest (ATH434, DFP, DFX, DMOG, and IOX3) using our previously developed competitive Fe2+-binding assay.77 Each of the compounds listed above were purchased commercially (MedChemExpress) or in the case of ATH434 provided by Alterity as the mesylate salt. This assay employs well established divalent metal chelators, which are chromophores (Mag-Fura-2 and Rhod-5 N) or fluorophores (Fura-4F) that serve as iron sensitive probes to quantify metal binding affinity of target compounds under competitive (heterogeneous) conditions that mimic conditions of metal binding competition seen in cells. All chemical probes were purchased commercially (Sigma) and their chemical structures are known (Supplementary Fig. 1). Mag-Fura-2 and Rhod-5 N are chromophores with iron binding absorbance peak maxima at 365 and 435 nm, respectively, with their own respective Kd’s for Fe2+ binding of 6.5 × 10⁻⁶ M and 1.2 × 10⁻⁵ M. Metal binding to the chromophore alone causes a shift resulting in reduced signal at each's respective peak maxima. Fura-4F is an iron binding fluorophore with a Kd for Fe2+ binding of 1.1 × 10⁻⁷ M with an emission spectrum that dampens upon metal binding. Ferrous quenching of Fura-4F was measured using excitation scans between Exc(λ) = 250–450 nm, monitoring the dampening of the iron free compound excitation signal at 340 nm that reduces upon iron binding. All Fe2+ binding studies were performed using anaerobic degassed buffer solutions containing 150 mM NaCl and 50 mM Tris HCl (pH 7.5). Anaerobic buffer solutions were degassed for 30 min by bubbling hydrated Ar(g) into a capped vented bottle, and all solutions were stored within an anaerobic Coy wet chamber ([O2] < 5 ppm). UV-visible spectroscopy measurements were performed using an anaerobic quartz cuvette and conducted at room temperature using an anaerobically housed Shimadzu UV-1800 spectrometer housed in the Coy Chamber. Fluorescence measurements were performed using an anaerobic quartz cuvette and conducted at room temperature using a Horiba QuantaMaster-400 fluorimeter.
Spectroscopy samples were prepared and data collected using a standardized methodology outlined previously.77 All samples were prepared individually within the Coy chamber and placed within septa sealed cuvettes. Solution samples at 2 µM concentration were prepared for each competitive probe (Mag-Fura-2, Rhod-5 N, or Fura-4F) by adding solid sample to 1 ml of anaerobic buffer. Probe concentration was verified by UV-visible spectroscopy using the calculated extinction coefficients for Mag-Fura-2 (ε366 = 29,900 cm−1M−1), Rhod-5 N (ε551 = 75 000 cm−1M−1), and Fura-4F (ε364 = 24 000 cm−1M−1). 77,78 Solid compound of interest (ATH434, DFX, DFP, DMOG, or IOX3) was then added to the probe sample for a final target compound concentration of 2 µM. Assays using Fura-4F were initially saturated using a 20 µM buffered CaCl2 solution prior to iron titrations to account for calcium contaminants within buffer systems, as described previously.77 For each competition assay, a buffered stock solution of 2 mM ferrous ammonium sulfate was prepared, and small volumes (≤5 µl) were progressively added until signal saturation was reached. Changes in absorbance or fluorescence at each wavelength, as a function of iron concentration, were used as input into the Dynafit fitting software utilizing binding model scripts outlined previously.77 As elaborated in our previous publication, spectral simulations generated by the Dynafit scripts employed non-linear least squares regression binding models tailored to each chromophore or fluorophore to calculate best fit parameters.77 Simulation output yielded Kd values for all five iron compounds investigated. Titration data was simulated using binding schemes that reflect the iron compound of interest in competition with Mag-Fura-2 or Rhod-5 N, or Fe2+ competing against bound Ca2+ for Fura-4F (Ca2+ Kd = 7.7 × 10⁻⁷). Coefficient variations for each simulated binding curve utilized to determine Kd were in the order of < 30%, justifying appropriateness of each binding scheme used.
Isothermal titration calorimetry
Metal binding affinity, metal to ligand stoichiometry, and the thermodynamic stability was assessed for each metal-loaded compound of interest using Isothermal Titration Calorimetry (ITC). A Nano Isothermal Titration Calorimeter (TA Instruments) housed within a Coy anaerobic wet chamber provided environmental conditions suitable for studying ferrous ion binding to each compound of interest free of exposure to metal oxidants. For all Fe2+ binding studies, the Coy box was purged with Ar(g) for 4 h prior to experimentation. The same Ar(g) degassed buffer solutions containing 150 mM NaCl and 50 mM Tris HCl (pH 7.5) were used to make the individual iron and compound samples, and all samples were stored anaerobically within the Coy chamber for a maximum of 30 min before use. An iron solution at concentrations between 0.5 and 7.0 mM were loaded into the syringe and solutions of the compounds (ATH434, DFX, DFP, and DMOG) at respective concentrations of 50, 770, 300, and 775 µM, making a 10 to 1 Fe: compound starting relative ratio, were place in the 1.5 ml volume sample cell. IOX3 required a 30-fold increase of iron relative to compound to achieve a significant observable binding curve, using 12 mM titrant iron and 400 µM compound. During each sample characterization, titration experiments were performed at a stirring rate of 200 rpm with a fixed temperature of 30 °C. During the experiment, a 250 µl syringe provided an initial 2 µl injection, followed by 19 additional injections of 10 µl, of buffered metal solution into the 1.5 ml sample cell containing the compound sample; there was a 10 min equilibration time between each injection.
For Fe3+ binding characterization studies performed by ITC, the glove box housing the instruments was opened to air. Ferric ion buffered solutions were prepared aerobically containing 150 mM sodium chloride and 150 mM sodium acetate (used to stabilize Fe3+ in solution) at a pH of 5.5; the lower pH was also used to stabilize Fe3+ solubility.79 For Fe3+ binding studies with DMOG and IOX3, ferric chloride was titrated into a sample cell containing each compound individually, as done previously when we performed the Fe2+ binding studies outlined above. To assess binding of DMOG to Fe3+, a titrant syringe containing 8 mM FeCl3 was prepared for titrations into a sample cell containing 800 µM DMOG. For IOX3 binding studies, 24 mM of FeCl3 titrant was prepared for titrations into 400 µM IOX3. For Fe3+ binding studies with ATH434, titrations of Fe3+ into ATH434 binding interactions failed to produce a binding curve that could be fit for subsequent analysis. To circumvent this issue, the titrant and analyte solutions were interchanged so that ATH434 was present in the titrant syringe with Fe3+ contained within the sample cell. A binding profile was established using this reverse titration technique by loading 2 mM of ATH434 into the titrant syringe and 100 µM FeCl3 into the sample cell. Finally, we were not able to use ITC to measure the ferric ion binding affinity for DFX and DFP, since their extremely strong binding affinities exceeded technique characterization capabilities.
ITC data analysis was performed using the NanoAnalyze Data Analysis Software version 3.12.5 provided by TA Instruments. All data were baseline subtracted using titration profiles of buffer into buffer, iron into buffer, and buffer into compound. Thermogram data were fit using non-linear regression best fit simulations with a 95% fit confidence for independent binding sites to yield metal binding affinity, metal to ligand stoichiometry, and all thermodynamic parameters. All data were collected in triplicate on independent samples to ensure data reproducibility.
X-ray absorption spectroscopy
Bound metal electronic and metrical parameters were determined using X-ray Absorption Spectroscopy (XAS). Fe2+ bound complex samples for each of the five compounds of interest were prepared within an anaerobic Coy wet chamber using Ar(g) degassed anaerobic buffer containing 150 mM NaCl and 50 mM Tris-HCl (pH 7.5). Fe3+ bound complex samples with ATH434, DMOG, and IOX3 were prepared aerobically using buffer containing 150 mM NaCl and 150 mM sodium acetate (pH 5.5); structures of Fe3+ bound to DFX and DFP were compared to previously characterized by crystallography.28–30 All XAS samples contained 2 mM final concentration of compound and 0.9 molar equivalents of either ferrous ammonium sulfate (for Fe2+ samples) or ferric chloride (for Fe3+ samples). Each XAS sample was diluted by addition of 30% (v/v) glycerol to ensure appropriate sample glassing during low temperature data collection. Lucite XAS sample cells, pre-wrapped with Kapton tape, were loaded with 120 µL of metal-compound, samples were flash frozen in liquid nitrogen and then stored in liquid nitrogen until data collection. Iron k-edge XAS data were collected on each sample at the Stanford Synchrotron Radiation Laboratory using beamline 7–3 and at beamline 9–3; both beamlines were equipped with Si[220] double-crystal monochromators containing harmonic rejection mirrors. Fluorescence excitation spectra were collected using a Canberra 30-element (on beamline 7-3) and a Canberra 100-element (on beamline 9-3) Germanium solid state detector permanently housed at the beamline. An Oxford instruments, continuous-flow liquid helium cryostat was used at each beamline to maintain a sample temperature during collection of 10 K. An iron foil absorption spectrum was collected simultaneously with each sample scan to provide an internal calibration of the sample's spectral X-ray energy. All XAS spectra were measured using 5 eV steps in the pre-edge region (6900–7094 eV), 0.25 eV steps in the edge region (7095–7135 eV) and 0.05 Å−1 increments in the extended X-ray absorption fine structure (EXAFS) region (out to k = 13 Å−1), integrating from 1 to 30 sec in a k3 weighted manner, for a total scan length of approximately 40 min. All scans were carefully monitored for spectral anomalies and for photoreduction of Fe3+ samples prior to averaging, and a total of 5–7 scans for each sample were averaged for data analysis. Spectra were collected on at least two independent samples to ensure spectral reproducibility.
Spectral data analysis was performed on raw/unfiltered data using the Macintosh OS X version of the EXAFSPAK program suite, integrated with Feff v7.2 for theoretical model generation.80,81 X-ray absorption near edge structure (XANES) data were analyzed in the energy range of 7100–7160 eV. From this, the metal oxidation state was determined by comparing the first derivative of the experimental k-edge to that of known ferrous and ferric model compounds. EDG_FIT software was used to fit a spline over the pre-edge region (7109–7117 eV), which was subsequently adjusted using Gaussian models accounting for deviations from the spline. Best-fit models were then integrated to approximate the normalized pre-edge feature area.81 The EXAFS data were converted to k-space using an E0 value for iron of 7130 eV, and data were then Fourier transformed. EXAFS data were fit using single-scattering theoretical model amplitude and phase functions for Fe-O/N and Fe-C interactions. A calibrated scale factor (Sc) of 0.95, and energy shift E0 values -11.5 eV (for Fe2+) and −7.6 eV (for Fe3+), were fixed during the simulations. Data for Fe2+ samples were fit using a k range of 1–13.0 Å−1, while Fe3+ samples were fit using a k range of 1–12.0 Å−1 (due to monochromator spectral distortion at high k). To simulate the EXAFS spectrum, Fe-ligand atom coordination numbers were fixed at half-integer values, while the Debye–Waller factors (a measure of absorber–scatterer bond disorder) as well as absorber–scatterer bond lengths were allowed to vary during the simulation. Best- fit selection criteria were characterized by having the lowest mean square deviation between experimental data and theoretical fit (F’ value), along with an acceptable Debye–Waller factor (DW) of <6.0 × 10³ Å2.
Ferrous iron autooxidation coupled O2 consumption
The velocity of Fe2+ autooxidation in the absence or presence of a given coordinating ligand was determined by O2-consumption using a Clark-type oxygen electrode manufactured by Hansatech Industries (Oxygraph+). Samples were prepared in 100 mM [2-(N-morpholino)ethanesulfonic acid] MES buffer, pH 7.0. The electrode solution (control or with added ligand, as noted in the figures) was equilibrated for 2 min prior to addition of a degassed solution of ferrous ammonium sulfate in 100 mM MES, pH 5.0. The consumption of O2 was followed for 300 s. The initial velocities were determined as the slope of [O2] vs. time trace following ferrous iron addition (n = 5). These initial velocities were subsequently used in a fit of a standard first order rate equation (GraphPad Prism9). In these experiments, the concentration of the non-varied reactant was 0.5 mM. As has been noted previously56,57 and indicated by the R2 values, this reaction is first order in both [Fe2+] and [Ligand].
Results and discussion
Fe2+ competition binding assay
The ferrous ion binding affinity for ATH434, DFX, DFP, DMOG, and IOX3 was measured as a starting point for complex-structure analyses and to compare how each molecule interacts with reduced metal. Each Fe2+ binding affinity was measured using a metal competition binding assay adapted exclusively to explore ferrous ion binding under the competitive binding environmental conditions.77 The Fe2+ affinity of ATH434 was measured in competition with two standard divalent metal chromophores/fluorophores, Mag-Fura-2 and Fura-4F, molecules with published Kd values of 6.5 × 10⁻⁶ and 1.1 × 10⁻⁷ M, respectively.77 Each experiment was performed in triplicate using each chromophore or fluorophore, with representative spectra displayed for each chromophore/fluorophore probe with ATH434 in Fig. 2 (panels A, C, and E, respectively). The target wavelength monitored for competitive Fe2+ binding is identified with the arrow in each figure panel. Corresponding specific wavelength spectral intensity vs. [Fe2+] values for ATH434 with each probe is shown in Fig. 2 (panels B, D, and F), including the best-fit simulation line for each obtained using a single metal binding site model for the target compound. The averaged metal binding affinities for ATH434–Fe2+ binding obtained in competition with each standard is provided in Table 1. Affinities measured for ATH434 using Mag-Fura-2 and Fura-4F are very similar (5.99 ± 1.1 µM and 6.99 ± 1.3 µM, respectively) giving an average measured Kd of 6.49 ± 1.2 µM. Affinities measured for Fe2+ binding to ATH434 using the competition assay is quite different from those measured in the past using potentiometry, with the previous report listing a Fe2+ binding affinity of 18 µM.73 Differences in iron binding affinities between previous and our current studies may be due to differences in techniques or differences in experimental methods; the previous studies were performed under Ar(g) atmosphere at pH 7.4, while our work was performed in an anaerobic wet chamber at pH 7.5 with all buffers bubbled with hydrated Ar(g) to remove oxygen. Values measured in these competition assays are consistent with those from ITC (see below).
Fig. 2.

Anaerobic Fe2+ competition binding assay for ATH434. Representative titration absorption spectra with corresponding binding profiles of Rhod-5 N (A and B) and Mag-Fura-2 (C and D) competing with ATH434 for Fe2+ ions. Fluorescence Fe2+ quenching of Fura-4F in competition with ATH434 with fluorescence spectra (E) and corresponding binding profile (F). Spectra of chromophore or fluorophore by itself indicated in red and an arrow that designates the wavelength of characterization (panels A, C, and E, respectively). Best-fit simulations of data points for each binding profile shown with error bars from three independent titrations.
Table 1.
Ferrous ion binding dissociation constants for each compound determined by metal competition assays using Mag-Fura-2, Rhod-5 N, and Fura-4F
| Compound | Chelator | Fe2+ Kd (µM) |
Averaged Kd (µM) |
|---|---|---|---|
| ATH434 | Mag-Fura-2 | 5.99 ± 1.1 | 6.49 ± 1.2 |
| Fura-4F | 6.99 ± 1.3 | ||
| DFX | Mag-Fura-2 | 3.95 ± 1.3 | 4.25 ± 1.3 |
| Fura-4F | 4.55 ± 1.3 | ||
| DFP | Mag-Fura-2 | 14.0 ± 4.0 | 15.2 ± 4.0 |
| Rhod-5N | 16.2 ± 4.0 | ||
| DMOG | Mag-Fura-2 | 18.9 ± 9.0 | 25.9 ± 8.1 |
| Rhod-5N | 32.8 ± 7.1 | ||
| IOX3 | Mag-Fura-2 | 43.4 ± 2.1 | 32.7 ± 4.1 |
| Rhod-5N | 21.9 ± 6.0 |
Average Kd values represent the average affinity obtained from using multiple competitive chelators for three independent trials with each compound of interest. Data were collected at room temperature using anaerobic buffer containing 150 mM NaCl and 50 mM Tris HCl (pH 7.5).
Fe2+ competition binding analysis was performed using the same protocol for the four additional compounds of interest (DFX, DFP, DMOG, and IOX3). For simplicity, representative absorption Fe2+ binding data collected using Mag-Fura-2 as the competing compound are provided for each in Fig. 3 (panels A, C, E, and G, respectively), and their corresponding specific wavelength spectral intensity vs. [Fe3+] data with best fit simulation using a single site competition binding model is provided (panels B, D, F, and H, respectively). Competition binding affinities were measured for DFX in the identical manner as ATH434 (i.e. using Mag-Fura-2 and Fura-4F), since affinities of these two standards were within the boundaries of the compound being investigated. In the measurements for the three additional compounds (DFP, DMOG, and IOX3), we substituted Rhod-5 N for Fura-4F, since affinity of these compounds for ferrous ions was weaker, and the affinity of Rhod-5 N was in the same order of magnitude for these three compounds being investigated. Fe2+-binding affinities for DFX were in the µM range (4.25 ± 1.3), similar to the value observed for ATH434; however, those measured for DFP, DMOG, and IOX3 were an order of magnitude weaker, with comparative averaged Kd values of 15.2 ± 4.0, 25.9 ± 8.1, and 32.7 ± 4.1 µM, respectively (Table 1).
Fig. 3.

Anaerobic Fe2+ competition binding assay for DFX, DFP, DMOG, and IOX3. Representative titration absorption spectra with corresponding binding profiles of Mag-Fura-2 competing for Fe2+ ions with DFX (A and B), DFP (C and D), DMOG (E and F), and IOX3 (G and H). Spectra of chromophore by itself indicated in red and the arrow designates wavelength of characterization (panels A, C, E, G, respectively). Best-fit simulations of data points for each binding profile shown with error bars from three independent titrations.
Fe2+ binding characterization using ITC
As a verification for measuring Fe2+ binding affinity with our competition assay, and to measure the stoichiometry between Fe2+ and each compound of interest, we performed ferrous ion binding analysis for ATH434, DFX, DFP, DMOG, and IOX3 using ITC. Unlike the competition assay outlined above, ITC is performed under homogeneous conditions. In addition to providing a measure of the binding affinity, ITC provides metal to ligand compound stoichiometry and numeric measurements for the thermodynamic contributions (enthalpy and entropy) associated with binding. The raw ITC binding isotherm spectrum for Fe2+ exposure to ATH434 is provided in Fig. 4 (panel A) with the molar ratio binding isotherm in panel B. Simulations of the molar binding isotherm data indicated a Fe2+ binding affinity of 4.60 ± 1.9 µM for ATH434, with a metal to compound stoichiometry of 1:1 (Table 2). This affinity is very close to the affinity for Fe2+ binding by ATH434 observed from our competition assay listed above (average value of 6.49 ± 1.2 µM), suggesting that although each technique has limitations, the averaged values match in precision, likely validating the Kd measured values presented. Fe2+-binding to ATH434 has a strong negative enthalpic contribution (ΔH of −106.1 ± 1.5 kJ/mol value), suggesting complexation is highly energetically favorable, likely due to metal binding being driven by strong polar attractions between metal to compound ligand atoms. Interestingly, a very large negative entropic contribution (ΔS of −246.7 ± 0.7 J/mol·K) is observed for ATH434–Fe2+ binding by ITC. While iron binding by a single ATH434 as a bi- or tridentate ligand would exclude only two or three solvent water molecules creating minimal solvent disorder, the low entropy measured could also indicate that metal loaded complex is itself highly structurally ordered with very minimal structural variability of the complex. In doing so, the highly structured complex would present fewer possible atomic or molecular arrangements in solution, reducing system entropy (Table 2). A highly structured system in this case is suggested by the low-bond disorder values observed for Fe2+-ATH434 in the XAS analysis (outlined below).
Fig. 4.

Isothermal titration calorimetry spectra for Fe2+ binding to ATH434, DFX, DFP, DMOG, IOX3, and ATH434-OMe. Raw isothermal titration calorimetry data (top) and the corresponding integrated thermogram with best-fit simulation (bottom) for Fe2+ titrations into: ATH434 (A and B), DFX (C and D), DFP (E and F), DMOG (G and H), IOX3 (I and J), and ATH434-OMe (K and L), respectively.
Table 2.
Binding dissociation constants, stoichiometric values, and thermodynamic stability parameters determined using isothermal titration calorimetry of each compound interacting with Fe2+ ions in solution
| Compound | ITC Kd Value (µM) | Stoichiometry (Fe/Compound) | ΔG (kJ/mol) |
ΔH (kJ/mol) |
ΔS (J/mol·K) |
|---|---|---|---|---|---|
| ATH434 | 4.60 ± 1.9 | 1.00 ± 0.5 | −31.3 ± 1.7 | −106.1 ± 1.5 | −246.7 ± 0.7 |
| ATH434-OMe | − | − | − | − | − |
| DFX | 1.42 ± 0.5 | 0.24 ± 0.02 | −34.0 ± 0.9 | −59.6 ± 0.5 | −84.5 ± 4.5 |
| DFP | 13.9 ± 0.2 | 0.27 ± 0.2 | −28.2 ± 0.1 | −78.7 ± 1.9 | −166.5 ± 6.4 |
| DMOG | 19.6 ± 1.6 | 0.22 ± 0.04 | −27.3 ± 0.2 | −12.3 ± 1.3 | 49.5 ± 3.7 |
| IOX3 | 59.1 ± 3.9 | 0.34 ± 0.1 | −24.5 ± 0.1 | −79.3 ± 1.3 | −180.6 ± 4.1 |
ITC was also used to measure Fe2+ binding under homogeneous conditions for the four additional target compounds (DFX, DFP, DMOG, and IOX3). Raw ITC binding isotherm spectra for Fe2+ exposure to each additional compound is provided in Fig. 4 with the molar ratio binding isotherm data in panels C and D for DFX, E and F for DFP, G and H for DMOG, and I and J for IOX3, respectively. Binding simulations indicate the Kd for Fe2+ binding of DFX is 1.42 ± 0.5 µM, while simulations for Fe2+ titrations into DFP, DMOG, and IOX3 indicate binding occurs with Kd values that are an order of magnitude weaker at 13.9 ± 0.2, 19.6 ± 1.6, and 59.1 ± 3.9 µM, respectively (Table 2). With the exception of IOX3, these binding affinities have reduced intra-assay variance as compared to values measured by the competition assay (Table 1); this follows a consistent trend we observed in our competition assay development publication77 and may be an inherent limitation in accuracy of the technique. The Fe2+-compound stoichiometry for DFX, DFP, DMOG, and IOX3 indicate each compound forms a tris-complex with Fe2+ in solution, producing stoichiometric ratios ∼0.3 (i.e. 3:1 compound: Fe2+) in each case. The 3:1 compound: Fe2+ stoichiometry for DFX (a tridentate ligand for Fe3+) is surprising, and this may be an artifact of ligand incompatibility at one site of the compound for Fe2+ or possibly due to differences in solution and anaerobic conditions used between here and the compared studies.30
The enthalpic contributions observed for DFX, DFP, DMOG, and IOX3 were measured between −12>ΔH>−80 kJ/mol, values that are higher than that measured for ATH434, suggesting metal binding in these compounds is less driven by strong metal-ligand polar attractions, but rather driven by weaker bonding interactions (i.e. Van der Waals or hydrogen bonding interactions) and higher energy ligand arrangements. Larger, less negative, entropic contributions compared to ATH434 were observed for DFP and IOX3 at −167>ΔS>−181 J/mol·K, with values even larger observed for DMOG and DFX at 50>ΔS>−85 J/mol·K, respectively. The consistently larger entropic energy values observed for the other four compounds compared to ATH434, especially in the case of DMOG, may indicate the metal loaded complex structures in these four complexes are a result of solution entropy from eliminating water molecules as metal ligands during complexation, and possibly that they have a greater number of conformational states related to the arrangement of atoms in the molecules that are energetically favorable, leading to higher configurational entropy.
ITC measurements were also used to probe the Fe2+ binding affinity for ATH434-OMe, a methoxy variant of ATH434. The flat baseline in the titration calorimetry and corresponding thermogram observed in Fig. 4 (panels K and L) confirms that the methoxy variant of ATH434 does not bind ferrous ions. In its entirety, the ferrous ion binding affinities measured by ITC for all five original compounds that bind metal are very similar to those measured using the competition assay, with lack of metal binding to the methoxy variant of ATH434 serving as a negative binding control.
Fe3+ binding characterization using ITC
ITC is capable of measuring binding affinity across a detectable range of dissociation constants between 10−3 and 10−9 M; however, it is not suitable for measuring the binding properties of strong Fe3+ chelators, such as for DFX and DFP, with previously reported Kd values of 1.26 × 10−37 and 3.16 × 10⁻³⁵ M, respectively.30,82 Therefore, we attempted only to assess the Fe3+ binding affinity of ATH434, DMOG, and IOX3 with ITC. Due to experimental complications with ATH434 and Fe3+, we were forced to measure the ferric ion binding affinity in a reverse strategy (i.e. by injecting compound into iron solution), which was the opposite performed during the Fe2+ ITC measurements; experiments with Fe3+ and DMOG and IOX3 were done in the same manner as the Fe2+ ITC experiments (i.e. iron solution into compound). All Fe3+ ITC titrations were performed at pH of 5.5 instead of pH 7.4, the pH used in the Fe2+ titration studies, and we included acetate to the buffer. Despite these necessary experimental differences between our Fe2+ and Fe3+ studies for ATH434 and the additional four compounds, the results we present provide useful direct metal to ligand binding affinities, metal-compound stoichiometries and a characteristic evaluation of the binding thermodynamics at these two pH points.
The raw ITC binding isotherm spectra for Fe3+ exposure to ATH434 are provided in Fig. 5, with the molar ratio binding isotherm, in panels A and B, respectively. Simulations of the binding isotherm indicate that ATH434 has a major binding events with Fe3+ at a binding Kd of 0.46 ± 0.04 µM, a value significantly weaker that that seen for DFO and DFX, but notably an order of magnitude higher that that seen for DMOG and IOX3 (see below). The stoichiometry of this binding event is at a metal to compound stoichiometry of 1:1 (Table 3). A second weaker Fe3+ binding event is also observed for ATH434 at a binding Kd of 20.6 ± 0.7 µM and a stoichiometry of 1:3. The current affinity for the primary binding event measured for Fe3+ binding to ATH434 using ITC at pH 5.5 (Kd =0.46 ± 0.04 µM) is in a similar range to the value previously observed in the potentiometry studies when corrected for the lower fraction of ionized ligand (fL 10−4.66 at pH 5.5 vs. fL 10−2.31 at pH 7.4), leading to the previously reported Kd of 10−9.55 (∼0.3 nM, (Finkelstein, 2017 #1916)). The moderate enthalpic contributions for both events in the current study are similar, with ΔH values of −50>ΔH>−53 kJ/mol and ΔS values between −54>ΔS>−76 J/mol·K. The elevated enthalpic values may reflect weaker bonding interactions between Fe3+ and ATH434, as compared to the Fe2+ binding values, and an increase in configurational entropy due to an increase in the number of structural microstates present compared to a more ordered state observed in Fe2+ binding to this compound.
Fig. 5.

Isothermal titration calorimetry spectra for Fe3+ binding to ATH434, DMOG, and IOX3. Raw isothermal titration calorimetry data (top) and the corresponding integrated thermogram with best-fit simulation (bottom) for Fe3+ titrations into: ATH434 (A and B), DMOG (C and D), and IOX3 (E and F), respectively.
Table 3.
Binding dissociation constants, stoichiometric values, and thermodynamic stability parameters determined using isothermal titration calorimetry of each compound interacting with Fe3+ ions in solution
| Compound | ITC Kd Value (µM) | Stoichiometry (Fe/Compound) | ΔG (kJ/mol) |
ΔH (kJ/mol) |
ΔS (J/mol·K) |
|---|---|---|---|---|---|
| ATH434 | 0.46 ± 0.04 | 1.4 ± 0.21 | −36.8 ± 0.4 | −53.3 ± 0.5 | −54.4 ± 4.3 |
| 20.6 ± 0.7 | 0.34 ± 0.6 | −27.2 ± 1.8 | −50.2 ± 2.4 | −75.9 ± 1.3 | |
| DMOG | 4.53 ± 1.4 | 1.53 ± 0.20 | −31.9 ± 1.2 | −120.8 ± 0.21 | −293.2 ± 8.3 |
| IOX3 | 9.59 ± 0.13 | 0.85 ± 0.05 | −17.49 ± 0.04 | −21.04 ± 1.2 | −11.6 ± 1.2 |
ITC was also used to measure Fe3+ binding characteristics to the two additional compounds, DMOG and IOX3, which have not been previously characterized for the ferric ion binding affinity. The raw ITC binding isotherm spectra showing Fe3+ interactions to both compounds are provided in Fig. 5; raw isotherms and molar ratio binding spectra/fits are shown in panels C and D, and panels E and F, respectively. Both DMOG and IOX3 display a weaker (micromolar) Fe3+ affinity with a Kd that is weaker than that observed for ATH434, at values of 4.53 ± 1.4 and 9.59 ± 0.13 µM, respectively (Table 3). The stoichiometric ratios of Fe3+ to DMOG or IOX3 are 1.53 ± 0.20 and 0.85 ± 0.05, suggesting formation of the tris-complex observed for Fe2+ binding is unlikely and in the case of ferric ion binding, the stoichiometry is closer to 1:1. Fe3+-binding to DMOG has a strong enthalpic contribution (ΔH of −120.8 ± 0.21 kJ/mol) and an additional very large negative entropic contribution (ΔS of −293.2 ± 8.3 J/mol·K) suggesting strong polar binding interactions dominate Fe3+ coordination in this complex and a rigid overall conformational flexibility leading to a reduced configurational entropy is also observed. Energetic values observed between IOX3 and Fe3+ suggest metal coordination impacts the thermodynamic energy of the system in a manner closer to what is seen for ATH434, with a ΔH of −21.04 ± 1.2 kJ/mol value and a ΔS of −11.6 ± 1.2 J/mol·K.
Bound Fe electronic and structural characterization using XAS
Iron k-edge XAS was used to characterize the metal site structure and electronic characteristics of Fe2+ and Fe3+ bound to each compound of interest that has not been structurally characterized. Analysis of the XANES spectra provides insight into the oxidation state, spin state, coordination geometry, and local ligand environment for Fe bound to each compound. The XANES spectra of Fe2+ bound to ATH434, DFX, DFP, DMOG, and IOX3 are provided in Fig. 6 (panel A). Each spectrum is consistent with iron in the Fe2+ oxidation state, based on the XANES first inflection energy values determined for each complex, all of which are centered at ca. 7123 eV, as compared to the value of 7123.1 eV observed previously for the ferrous ion control (Table 4).40 Pre-edge spectral signals in the XANES from Fe2+ bound to each of the compounds is provided in Fig. 6 (panel B); the 1s→3d transition energy maximum value and overall signal area provide insight into the metal oxidation state, metal spin state, and metal-ligand coordination symmetry for Fe2+ bound to each complex. Peak maxima centered at ca. 7111 and 7113 eV in each compound is consistent with a high-spin Fe2+. The low pre-edge peak signal areas determined for each, between ca. 4.3 and 4.4 eV2 for DFX and DMOG, and between 7.1 and 7.3 eV2 for ATH434, DFP, and IOX3, suggest a high level of metal-ligand overall coordination symmetry at the complex's metal site, with a slightly higher asymmetry in the metal-ligand environment observed for Fe2+ bound to ATH434, DFP, and IOX3 (Table 4).
Fig. 6.

Normalized k-edge XANES spectrum of Fe2+ drug complexes for ATH434, DFX, DFP, DMOG, and IOX3. (A) Representative Fe k-edge XANES spectra of Fe2+ bound to ATH434 (teal), DFX (purple), DFP (orange), DMOG (black), and IOX3 (pink). (B) Expanded pre-edge spectra of representative 1s→3d transitions for each complex offset for clarity.
Table 4.
Analysis of the first inflection edge energy and 1s→3d pre-edge peak features represented in the XANES spectrum of Fe2+ bound ATH434, DFX, DFP, DMOG, and IOX3
| Compound | First inflection edge energy (eV) |
Pre-edge peak maxima (eV) |
Pre-edge peak Area (eV2) |
|---|---|---|---|
| ATH434 | 7123.2 ± 0.25 | 7111.4 ± 0.49 | 7.3 ± 0.14 |
| 7113.4 ± 0.21 | |||
| DFX | 7123.9 ± 0.28 | 7111.9 ± 0.07 | 4.3 ± 0.35 |
| 7113.4 ± 0.21 | |||
| DFP | 7122.9 ± 0.24 | 7111.5 ± 0.54 | 7.1 ± 0.56 |
| 7113.5 ± 0.33 | |||
| DMOG | 7123.7 ± 0.49 | 7112.2 ± 0.85 | 4.4 ± 0.42 |
| 7113.8 ± 0.49 | |||
| IOX3 | 7123.7 ± 0.19 | 7111.8 ± 0.45 | 7.3 ± 1.6 |
| 7113.5 ± 0.21 |
In addition, we characterized the structure of Fe3+ bound to ATH434, DMOG, and IOX3, as none have been previously structurally characterized, as a way to compare these with the known structures of ferric bound DFP and DFX.28–30 XANES spectra for Fe3+ bound to ATH434, DMOG, and IOX3 are provided in Fig. 7 (panel A) with the 1s→3d signals for each offset in panel B. In each case, the XANES first inflection edge energy is at ca. 7128 eV, a value shifted by ca. 5 eV higher than observed for Fe2+ in these samples, as expected since it takes a higher energy to liberate an electron from ferric vs. ferrous ions (Table 5). In the case of ATH434, a 1s→3d pre-edge signal peak was observed at a peak maximum at 7114 eV and a peak area of 6.3 ± 0.21 eV2, suggesting that Fe3+ is bound in a highly symmetric ligand environment in this complex. For DMOG and IOX3, two distinct 1s→3d transitions are observed at 7113 and 7114, with pre-edge peak areas higher than that seen for ATH434 at 11.1 ± 1.5 and 8.7 ± 0.57 eV2, respectively, suggesting a slightly perturbed metal-ligand coordination symmetry for these complexes as compared to ATH434. However, all three compound pre-edge areas are within the range expected for high-spin to octahedral Fe3+ complexes.
Fig. 7.

Normalized k-edge XANES spectrum of Fe3+ bound ATH434, DMOG, and IOX3. (A) Representative Fe k-edge XANES spectra of Fe3+ bound to ATH434 (teal), DMOG (black), and IOX3 (pink). (B) Expanded pre-edge spectra of representative 1s→3d transitions for each complex offset for clarity.
Table 5.
Analysis of the first inflection edge energy and 1s→3d pre-edge peak features represented in the XANES spectrum of Fe3+ bound ATH434, DMOG, and IOX3
| Compound | First inflection edge energy (eV) |
Pre-edge peak maxima (eV) |
Pre-edge peak area (eV2) |
|---|---|---|---|
| ATH434 | 7127.6 ± 0.92 | 7113.9 ± 0.14 | 6.3 ± 0.21 |
| DMOG | 7127.3 ± 0.35 | 7113.2 ± 0.16 | 11.1 ± 1.5 |
| 7114.4 ± 0.23 | |||
| IOX3 | 7128.1 ± 0.07 | 7113.5 ± 0.21 | 8.7 ± 0.57 |
| 7114.5 ± 0.07 |
The EXAFS region of the XAS spectrum can be simulated to provide direct metal ligand bond lengths at very high accuracy (±0.02 Å), as well as metal to ligand coordination numbers (CN) at an accuracy of ± 1, and ligand identity (± row of the periodic table). EXAFS spectra for Fe2+ bound to ATH434, DFX, DFP, DMOG, and IOX3 are provided in Fig. 8, panels A, C, E, G, I, respectively. Fourier transforms displayed for each in Fig. 8, panels B, D, F, H, J, respectively, provide a pseudo-radial distribution of the ligand environments (shifted by −0.4 Å) around the absorbing metal that help illustrate independent ligand scattering systems in each sample. Best-fit simulations for each complex are also provided in Fig. 8, and the metrical parameters obtained from the optimal simulations of the data are reported in Table 6. The nearest neighbor ligand environments for ATH434 and IOX3 reflect two independently resolvable Fe-O/N ligand environments at 2.08 and 2.20 Å and at 2.04 and 2.17 Å, respectively. The accumulative coordination number for these nearest neighbor environment fits are slightly lower than 6 in both cases; however, the bond lengths observed match the expected 6-coordinate Fe-O and Fe-N bond lengths listed in the Cambridge Structural Database (between 2.10 and 2.20 Å for Fe-O6 and Fe-N6, respectively).83 For DFX, DFP, and DMOG, ferrous ions bound to these compounds are held in a single well-ordered environment centered at a nearest neighbor bond length of 2.11 Å for DFX and DMOG and at 2.12 Å for DFP; also consistent with 6-coordinate systems Fe2+-(O/N)6 systems. Finally, long- range carbon scattering is observed at multiple resolvable atomic interactions (>2.93 Å) in each sample spectrum.
Fig. 8.

Raw EXAFS and Fourier Transform or Fe2+ bound ATH434, DFX, DFP, DMOG, and IOX3. Full EXAFS with corresponding Fourier transform of the EXAFS data for Fe2+ loaded complexes: ATH434 (A and B), DFX (C and D), DFP (E and F), DMOG (G and H), and IOX3 (I and J), respectively. Empirical data shown in black and theoretical simulation shown in green.
Table 6.
Representative best-fit simulation parameters from analysis for the Fe k-edge EXAFS for Fe2+ loaded ATH434, DFX, DFP, DMOG, and IOX3. Raw data were fit over a k-range of 1.0–13.0 Å−1
| Nearest neighbor ligand environmenta | Long-range ligand environmenta | ||||||||
|---|---|---|---|---|---|---|---|---|---|
| Compound | Atomb | R(Å)c | C.N.d | σ2 e | Atomb | R(Å)c | C.N.d | σ 2e | F’ f |
| ATH434 | O/N | 2.08 | 2 | 1.99 | C | 2.98 | 2 | 1.67 | 0.42 |
| O/N | 2.20 | 3 | 3.80 | C | 3.15 | 2 | 2.82 | ||
| C | 4.14 | 3 | 4.17 | ||||||
| DFX | O/N | 2.11 | 5.5 | 5.88 | C | 3.04 | 1 | 3.51 | 0.49 |
| C | 3.47 | 1.5 | 1.35 | ||||||
| C | 4.10 | 2 | 5.01 | ||||||
| DFP | O/N | 2.12 | 5.5 | 5.63 | C | 2.99 | 2 | 5.63 | 0.42 |
| C | 3.19 | 2 | 1.98 | ||||||
| C | 4.27 | 3.5 | 1.93 | ||||||
| C | 4.11 | 2 | 1.82 | ||||||
| DMOG | O/N | 2.11 | 6 | 5.61 | C | 2.90 | 1 | 2.56 | 0.46 |
| C | 3.75 | 1 | 4.71 | ||||||
| C | 4.15 | 3 | 5.94 | ||||||
| C | 4.32 | 3 | 3.72 | ||||||
| IOX3 | O/N | 2.04 | 1.5 | 3.33 | C | 2.92 | 2 | 1.70 | 0.33 |
| O/N | 2.17 | 3 | 1.00 | C | 3.10 | 3 | 1.50 | ||
| C | 4.15 | 3.5 | 1.74 | ||||||
| C | 4.33 | 3.5 | 1.30 | ||||||
aIndependent metal-ligand scattering environment.
bScattering atoms: C (carbon), N (nitrogen), and O (oxygen).
cAverage metal-ligand bond length.
dAverage metal-ligand coordination number.
eAverage Debye-Waller factor in Å2 × 10³.
fNumber of degrees of freedom weighted mean square deviation between data and fit.
EXAFS spectra for Fe3+ bound to ATH434, DMOG, and IOX3, as well as the Fourier transform of the EXAFS data for each, is provided in Fig. 9, and best-fit metrical parameters from simulating the data from each is provided in Table 7. In the case of Fe3+, the iron nearest neighbor ligand environment in each sample is constructed of two separate/resolvable Fe-O/N ligand environments at average bond lengths of ca. 1.95 and 2.09 Å. Coordination numbers are consistently lower than seen for the Fe2+ complex fits but Debye–Waller factor values are within the same range, suggesting a slight disorder in the metal ligand symmetry for each resolvable nearest neighbor ligand environment for Fe3+ to these samples. The bond lengths are consistent with iron having octahedral symmetry in each system, as compared to 6-coordinate Fe-O and Fe-N bond lengths at 1.9–2.1 Å, respectively, observed in the Cambridge Structural database.83 As seen in the Fe2+ spectral simulations, long-range carbon scattering is observed at R > 2.93 Å, suggesting each compound has multiple long-range ligand environments.
Fig. 9.

Raw EXAFS and Fourier Transform or Fe3+ bound ATH434, DMOG, and IOX3. Full EXAFS with corresponding Fourier transform of the EXAFS data for Fe3+ loaded complexes: ATH434 (A and B), DMOG (C and D), and IOX3 (E and F), respectively. Empirical data shown in black and theoretical simulation shown in green.
Table 7.
Best fit simulation parameters from analysis for the Fe k-edge EXAFS for Fe3+ loaded ATH434, DFX, DFP, DMOG, and IOX3. Raw data were fit over a k-range of 1.0–12.0 Å-1.
| Nearest neighbor ligand environmenta | Long-range ligand environmenta | ||||||||
|---|---|---|---|---|---|---|---|---|---|
| Compound | Atomb | R(Å)c | C.N.d | σ 2e | Atomb | R(Å)c | C.N.d | σ 2 e | F’ f |
| ATH434 | O/N | 1.93 | 1 | 3.45 | C | 2.94 | 2 | 2.43 | 0.26 |
| O/N | 2.09 | 3 | 4.72 | C | 3.10 | 3 | 2.53 | ||
| C | 3.49 | 1.5 | 4.12 | ||||||
| C | 3.92 | 2.0 | 2.52 | ||||||
| C | 4.12 | 3 | 1.70 | ||||||
| DMOG | O/N | 1.97 | 2.5 | 3.00 | C | 3.07 | 4 | 2.87 | 0.68 |
| O/N | 2.08 | 3.5 | 4.58 | C | 3.49 | 3 | 2.16 | ||
| C | 3.93 | 2 | 4.89 | ||||||
| C | 4.14 | 2 | 4.27 | ||||||
| IOX3 | O/N | 1.96 | 3 | 1.58 | C | 3.05 | 4 | 5.47 | 0.46 |
| O/N | 2.10 | 2.5 | 1.56 | C | 3.46 | 3 | 3.43 | ||
| C | 3.91 | 1.5 | 4.12 | ||||||
| C | 4.08 | 2 | 3.11 | ||||||
aIndependent metal-ligand scattering environment.
bScattering atoms: C (carbon), N (nitrogen), and O (oxygen).
cAverage metal-ligand bond length.
dAverage metal-ligand coordination number.
eAverage Debye–Waller factor in Å2 × 10³.
fNumber of degrees of freedom weighted mean square deviation between data and fit.
Combining our metal binding thermodynamics results (affinities and metal/ligand stoichiometries) with our XAS structural characterization paints a picture of a single ATH434 molecule in solution binding Fe2+ in a high-spin symmetric octahedral manner with likely 3–4 water oxygens completing the 6-coordinate metal-ligand binding scheme. This structure is unique from the multi-ligand-metal complexes formed (at 3:1) with Fe2+ for the additional compounds outlined in this report. When binding Fe3+, only a single ATH434 binds tightly to the metal (there is however a second much weaker affinity measured, which could be a second binding event), and the remaining ligands likely come from water molecules. If ATH434 binds Fe in a tridentate ligand manner, its ferric bound structure would be very similar to what was reported by X-ray crystallography for similar higher valent iron binding compounds.84,85
Ligand-dependent Fe2+ autooxidation
Ferrous ion autooxidation by O2 is recognized to be potentiated by hard-ligand (oxygen) containing coordinating species.53–57 Among such ligands used therapeutically, DFO has already been shown to effect this reaction.53 As there are no published data regarding ferrous ion autooxidation of metal bound to DFP, DFX, and ATH434, we examined each compound's potential for potentiating bound ferrous ion electron transfer (ET) to dioxygen. Given that the Fe3+-ATH434 complex was only 10-fold more stable at pH 5.5 than the Fe2+ complex at pH 7.5 (Kd values 0.46 vs. 4.6 μM), we predicted that ATH434 would be less likely to potentiate the pro-oxidant behavior of ferrous ions. Indeed, using a Clark-type O2 electrode to monitor oxygen consumption, we demonstrated that like DFO, DFP, and DFX strongly lowered the energy barrier of ET from Fe2+ to O2 in comparison to the presence of ATH434. This was indicated whether [Fe2+] (Fig. 10, panel A) or [Ligand] (Fig. 10, panel B) was the variable species. In either case, the behavior of the data was consistent with a first-order relationship between the varied component and the velocity of O2 consumption. These behaviors were confirmed by the excellent fit of a first-order reaction scheme to both data sets (Table 8).
Fig. 10.
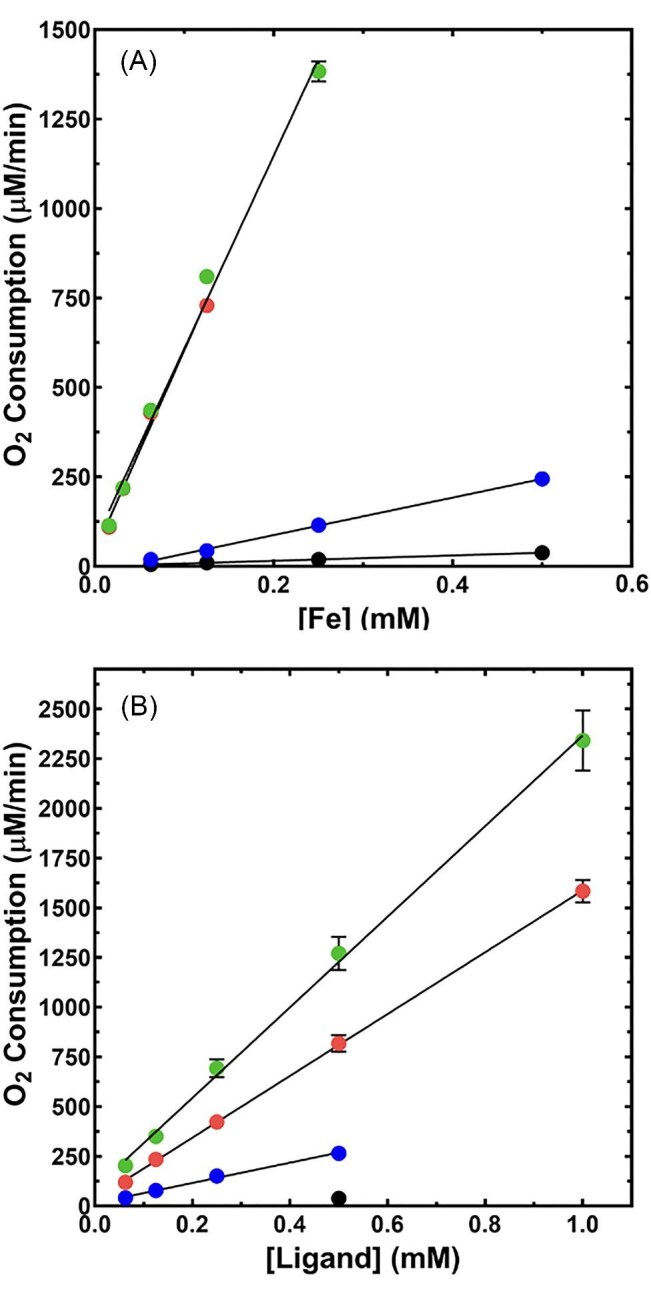
Ligand-dependent O2 consumption data reflecting Fe2+ autooxidation for DFX, ATH434, and DFP. Initial oxygen consumption velocities (Clark-type O2 electrode) measured as a function of [Fe2+] (panel A) and [Ligand] (panel B) for: DFX (green), ATH434 (blue), DFP (red), and control (black) samples. Straight line represents the fitted first-order relationship between these concentrations and the theoretical first-order rate constants provided in Table 7. Error bars on the mean velocity values are not apparent as they are smaller than the dimension of symbols in most cases.
Table 8.
First-order kinetic constants for ligand-induced Fe2+ autooxidation. A first-order equation was fit to data as displayed in Fig. 10A and B to provide the rate constants (GraphPad Prism)
| Variable [Fe2±] | Variable [coordinating ligand] | |||
|---|---|---|---|---|
| Sample | k 1, min−1 | R2 | k 1, min−1 | R2 |
| Control | 74.9 ± 8.5 | 0.9878 | − | − |
| ATH434 | 532.2 ± 8.5 | 0.9973 | 510 ± 15.0 | 0.9915 |
| Deferiprone (DFP) | 5620 ± 175.1 | 0.9904 | 1554 ± 23.0 | 0.9970 |
| Deferasirox (DFX) | 5392 ± 148.3 | 0.9903 | 2278 ± 96.1 | 0.9774 |
To directly link coordination of Fe2+ by a given ligand to the enhanced ET to dioxygen, we also examined the properties of ATH434 and its 8-methoxy derivative ATH434-OMet. Titration of ATH434-OMe with Fe2+ exhibited no indication of metal binding when examined by ITC in comparison to binding exhibited by the parent compound, ATH434 (redrawn in Fig. 11, panel A), confirming that the 8-methoxy derivative served as a negative control. In parallel, the velocity of O2 consumption due to Fe2+ autooxidation in the presence of ATH434-OMe was quantitatively identical to the rate of the control (Fig. 11, panel B). At the concentrations used in this comparison ([Fe2+] = 0.5 mM, [ATH434] or [ATH434-OMe] = 1.0 mM), the initial velocities of the control and ATH434-OMe reactions were the same within experimental error, at 25.5 µM O2 consumed/min. The initial velocity of O2 consumption due to ATH434 under these conditions was 275 µM/min.
Fig. 11.
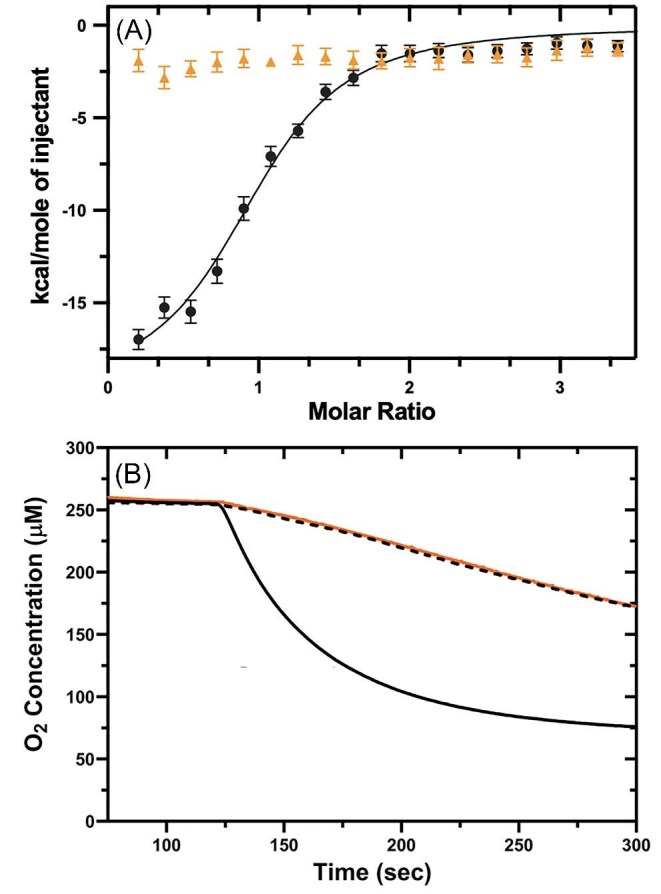
ATH434-dependent Fe2+ autooxidation correlates with ATH434 binding of metal. Titration of ATH434 with Fe2+ is compared to the calorimetric behavior in the titration of ATH434-OMe (A). Initial oxygen consumption velocities due to the autoxidation of Fe2+ (0.5 mM) were measured in the absence serving as the control (black dashed line) or presence of 1.0 mM ATH434 (solid black line) or ATH434-OMe (dashed black line) (B). Ligand injection occurred at 125 s in panel B.
Conclusions
Here, we explored the physical characteristics of five iron binding compounds to better understand their metal binding affinity, provide structural insight for the ferrous and ferric bound complexes, and to test their activity in promoting ferrous ion autooxidation. We show the iron-targeting compound ATH434 binds ferrous ions with an affinity within the micromolar range, a value that closely matches that measured for essential Fe2+ utilization proteins including PCBP1/2, frataxin, and the ISCU scaffold protein.9,40,41,67 Having a µM Fe2+ binding affinity matched to proteins that drive ferrous ion utilization within the cell indicates this drug could contribute to metal delivery within the cytosol or within the matrix for Fe-S cluster assembly, in contrast to the extant iron chelators found in clinical practice that typically bind ferrous ions much more weakly. ATH434 binds Fe2+ with 1:1 stoichiometry, likely utilizing the compound's phenol oxygen and 1 or 2 of the exposed nitrogens, making up a maximum of 3 ligands coordinated to metal. Since Fe2+-bound to ATH434 is 6-coordinate, as measured by XAS, the 3 to 4 additional remaining metal ligands likely come from solvent water molecules. An elevated nitrogen and water oxygen ligand-metal coordination sphere for this sample would be consistent with ATH434 having the largest average Fe2+-ligand nearest neighbor bond length in the EXAFS at 2.14 Å, as compared to average values of 2.11, 2.12, 2.11 and 2.11 Å for DFX, DFP, DMOG, and IOX3. Since ATH434 has the lowest metal binding ΔH value (−106 kJ/mol) and the lowest ΔS (−247 J/mol·K) measured from the Fe2+ ITC binding fits compared to the other compounds, we believe compatibility between compound nitrogen and solvent oxygen ligands, and ferrous metal, would lead to a higher enthalpically favorable compound, while also limiting the complex configurational and solvent exclusion energies both of which would lead to decreased entropy for Fe2+-bound ATH434.
A coordination geometry of Fe2+-ATH434 with three water molecules (or a fourth stabilized by hydrogen bonding of water to the compound's basic amine) to complete a 6-coordinate sphere would allow the water molecules to generate an accessible and exchangeable surface on the Fe2+ that could help promote iron transfer to protein recipients (i.e. frataxin, ISCU, PCBP1, and PCBP2).9,40,41,67 As the Fe2+ binding affinity for ATH434 matches that of essential ferrous ion binding proteins with an accessible metal surface, we speculate that among the five compounds investigated in this report, ATH434 has the best molecular characteristics for both binding and transferring ferrous ions to recipient proteins in several biochemical pathways. These ideal attributes would allow ATH434 to increase Fe2+ availability in iron overload disease cells to help maintain a metabolically active, exchangeable iron pool.
A characteristic of the common iron chelators is that they bind ferric ions with extremely high affinity, making them useful for treating iron overload conditions through metal binding and removal. This avidity for Fe3+, however, thermodynamically drives ET from Fe2+ to dioxygen. This reaction is directly proportional to the difference in stability of the ferric vs. ferrous ion bound complexes, since strong chelation of ferric ions in comparison to ferrous ions promotes the inherent pro-oxidant activity of the latter species. In addition, their high affinity puts the loading fate of normal ferric ion binding molecules in the cell at jeopardy, since the metal is bound to the chelator and no longer available in the cell. This would certainly be true for DFX, DFP, and DFO, all of which have extremely high affinity (i.e. ≤10−31) for Fe3+. Interestingly, ATH434 has a relatively weaker affinity for Fe3+ (0.46 µM Kd under the conditions tested; estimated to be 0.3 nM at physiologic pH73), coupled to the desirable traits outlined above that promote Fe2+ binding and an accessible/exchangeable Fe-drug structure. Having a Fe3+ affinity weaker than the three noted iron chelators would allow ATH434 to avoid competing or interfering with traditional ferric ion binding protein loading, which would in turn prevent the stripping of Fe3+ from cells. ATH434’s low Fe3+ affinity would also not upset redox processing of iron during standard biochemical pathways. This is of course also true for DMOG and IOX3, each of which have an order of magnitude weaker affinity for ferric ions than ATH434; however, they lack other desirable traits including a µM ferrous ion binding affinity, an exchangeable metal surface, and ability to stabilize ferrous ions against autooxidation. We therefore conjecture that ATH434’s low Fe3+ affinity, with its limited potential for autooxidation distinguishes it from the catechol-mimetic chelators known to prevent the required redox cycling of enzyme bound iron. In sum, ATH434’s Fe2+ vs. Fe3+ binding properties and its limited capacity to promote ferrous ion oxidation may position it as a useful candidate for iron regulation disorders such as FA, PD, and MSA, which are characterized by poorly regulated ferrous iron and vulnerability to oxidative stress.
Supplementary Material
Acknowledgements
Portions of this research were carried out at the Stanford Synchrotron Radiation Lightsource (SSRL). SSRL is a national user facility operated by Stanford University on behalf of the U.S. Department of Energy, Office of Basic Energy Sciences. The SSRL Structural Molecular Biology Program is supported by the Department of Energy, Office of Biological and Environmental Research, and by the NIH, National Center for Research Resources, Biomedical Technology Program. C.S.S. acknowledges support from the Niagara University Academic Center for Integrated Science, Research Council, and the NU-SURF program.
Contributor Information
Ashley E Pall, De partment of Pharmaceutical Sciences, Wayne State University, Detroit, MI 48201, USA.
Silas Bond, Alterity Therapeutics Limited, Melbourne, 3000, Australia.
Danielle K Bailey, Department of Biochemistry, University of Buffalo, Buffalo, NY14203, USA.
Christopher S Stoj, Department of Biochemistry, Chemistry and Physics, Niagara University, Lewiston, NY 14109, USA.
Isabel Deschamps, Department of Biochemistry, Chemistry and Physics, Niagara University, Lewiston, NY 14109, USA.
Penny Huggins, Alterity Therapeutics Limited, Melbourne, 3000, Australia.
Jack Parsons, Alterity Therapeutics Limited, Melbourne, 3000, Australia.
Margaret J Bradbury, Alterity Therapeutics Limited, Newark, CA 94560, USA.
Daniel J Kosman, Department of Biochemistry, University of Buffalo, Buffalo, NY14203, USA.
Timothy L Stemmler, De partment of Pharmaceutical Sciences, Wayne State University, Detroit, MI 48201, USA.
Data availability
The data underlying this article are available in the article and in its online supplementary material.
References
- 1. Galaris D., Pantopoulos K., Oxidative stress and iron homeostasis: mechanistic and health aspects, Crit. Rev. Clin. Lab. Sci., 2008, 45(1), 1–23. 10.1080/10408360701713104 [DOI] [PubMed] [Google Scholar]
- 2. Chang K. H., Chen C. M., The role of oxidative stress in Parkinson's disease, Antioxidants (Basel), 2020, 9(7), 597. [DOI] [PMC free article] [PubMed] [Google Scholar]
- 3. Calabrese V., Lodi R., Tonon C., D'Agata V., Sapienza M., Scapagnini G., Mangiameli A., Pennisi G., Stella A. M., Butterfield D. A., Oxidative stress, mitochondrial dysfunction and cellular stress response in Friedreich's ataxia, J. Neurol. Sci., 2005, 233(1–2), 145–162. 10.1016/j.jns.2005.03.012 [DOI] [PubMed] [Google Scholar]
- 4. Schapira A. H., Mitochondrial dysfunction in neurodegenerative disorders, Biochimica et Biophysica Acta (BBA)—Bioenergetics, 1998, 1366(1–2), 225–233. 10.1016/S0005-2728(98)00115-7 [DOI] [PubMed] [Google Scholar]
- 5. Bradley J. L., Homayoun S., Hart P. E., Schapira A. H., Cooper J. M., Role of oxidative damage in Friedreich's ataxia, Neurochem. Res., 2004, 29(3), 561–567. 10.1023/B:NERE.0000014826.00881.c3 [DOI] [PubMed] [Google Scholar]
- 6. Fibach E., Dana M., Oxidative stress in beta-thalassemia, Mol. Diagn. Ther., 2019, 23(2), 245–261. 10.1007/s40291-018-0373-5 [DOI] [PubMed] [Google Scholar]
- 7. Shizukuda Y., Tripodi D. J., Rosing D. R., Iron overload or oxidative stress? Insight into a mechanism of early cardiac manifestations of asymptomatic hereditary hemochromatosis subjects with C282Y homozygosity, J. Cardiovasc. Trans. Res., 2016, 9(4), 400–401. 10.1007/s12265-016-9704-2 [DOI] [PMC free article] [PubMed] [Google Scholar]
- 8. Shibata N., Inose Y., Toi S., Hiroi A., Yamamoto T., Kobayashi M., Involvement of 4-hydroxy-2-nonenal accumulation in multiple system atrophy, Acta. Histochem. Cytochem., 2010, 43(2), 69–75. 10.1267/ahc.10005 [DOI] [PMC free article] [PubMed] [Google Scholar]
- 9. Leidgens S., Bullough K. Z., Shi H., Li F., Shakoury-Elizeh M., Yabe T., Subramanian P., Hsu E., Natarajan N., Nandal A., Stemmler T. L., Philpott C. C., Each member of the poly-r(C)-binding protein 1 (PCBP) family exhibits iron chaperone activity toward ferritin, J. Biol. Chem., 2013, 288(24), 17791–17802. 10.1074/jbc.M113.460253 [DOI] [PMC free article] [PubMed] [Google Scholar]
- 10. Ogawa K., Sun J., Taketani S., Nakajima O., Nishitani C., Sassa S., Hayashi N., Yamamoto M., Shibahara S., Fujita H., Igarashi K., Heme mediates derepression of Maf recognition element through direct binding to transcription repressor Bach1, EMBO J., 2001, 20(11), 2835–2843. 10.1093/emboj/20.11.2835 [DOI] [PMC free article] [PubMed] [Google Scholar]
- 11. Frey A. G., Nandal A., Park J. H., Smith P. M., Yabe T., Ryu M. S., Ghosh M. C., Lee J., Rouault T. A., Park M. H., Philpott C. C., Iron chaperones PCBP1 and PCBP2 mediate the metallation of the dinuclear iron enzyme deoxyhypusine hydroxylase, Proc. Natl. Acad. Sci. U.S.A, 2014, 111(22), 8031–8036. 10.1073/pnas.1402732111 [DOI] [PMC free article] [PubMed] [Google Scholar]
- 12. Campbell C. J., Pall A. E., Naik A. R., Thompson L. N., Stemmler, T. L. Molecular details of the Frataxin-Scaffold interaction during mitochondrial Fe-S cluster assembly, Int. J. Mol. Sci., 2021, 22(11), 6006. 10.3390/ijms22116006 [DOI] [PMC free article] [PubMed] [Google Scholar]
- 13. Lill R., Kispal G., Maturation of cellular Fe-S proteins: an essential function of mitochondria, Trends Biochem. Sci, 2000, 25(8), 352–356. 10.1016/S0968-0004(00)01589-9 [DOI] [PubMed] [Google Scholar]
- 14. Rouault T., Klausner R., Regulation of iron metabolism in eukaryotes, Curr. Top. Cell. Regul., 1997, 35, 1–19. 10.1016/S0070-2137(97)80001-5 [DOI] [PubMed] [Google Scholar]
- 15. Hinton T. V., Batelu S., Gleason N., Stemmler T. L., Molecular characteristics of proteins within the mitochondrial Fe-S cluster assembly complex, Micron, 2022, 153, 103181. 10.1016/j.micron.2021.103181 [DOI] [PubMed] [Google Scholar]
- 16. Hershko C., Konijn A. M., Nick H. P., Breuer W., Cabantchik Z. I., Link G., ICL670A: a new synthetic oral chelator: evaluation in hypertransfused rats with selective radioiron probes of hepatocellular and reticuloendothelial iron stores and in iron-loaded rat heart cells in culture, Blood, 2001, 97(4), 1115–1122. 10.1182/blood.V97.4.1115 [DOI] [PubMed] [Google Scholar]
- 17. Drugs@FDA (016267 Deferoxamine Mesylate). FDA, 2022. [Google Scholar]
- 18. Velasquez J., Wray A. A., Deferoxamine. StatPearls. Treasure Island (FL), 2024. [Google Scholar]
- 19. Codd R., Richardson-Sanchez T., Telfer T. J., Gotsbacher M. P., Advances in the Chemical Biology of Desferrioxamine B, ACS Chem. Biol., 2018, 13(1), 11–25. 10.1021/acschembio.7b00851 [DOI] [PubMed] [Google Scholar]
- 20. Pecoraro L., Wang X., Shah D., Song X., Kumar V., Shakoor A., Tripathi K., Ramteke P. W., Rani R., Biosynthesis pathways, transport mechanisms and biotechnological applications of fungal siderophores, J Fungi (Basel), 2021, 8(1), 21. [DOI] [PMC free article] [PubMed] [Google Scholar]
- 21. Neilands J. B., Siderophores: structure and function of microbial iron transport compounds, J. Biol. Chem., 1995, 270(45), 26723–26726. 10.1074/jbc.270.45.26723 [DOI] [PubMed] [Google Scholar]
- 22. Hossain DLE-W M. B., Loghry R. A., Helm D. V., Circular dichroism, crystal structure, and absolute configuration of the siderophore ferric N,N',N"-triacetylfusarinine, FeC39H57N6O15, J. Am. Chem. Soc., 1980, 102(18), 5766–5773. [Google Scholar]
- 23. Miethke M., Marahiel M. A., Siderophore-based iron acquisition and pathogen control, Microbiol. Mol. Biol. Rev., 2007, 71(3), 413–451. 10.1128/MMBR.00012-07 [DOI] [PMC free article] [PubMed] [Google Scholar]
- 24. Zalkin A., Forrester J. D., Templeton D. H., Crystal and molecular structure of Ferrichrome A, Science, 1964, 146(3641), 261–263. 10.1126/science.146.3641.261 [DOI] [PubMed] [Google Scholar]
- 25. Pramanik S., Chakraborty S., Sivan M., Patro B. S., Chatterjee S., Goswami D., Cell permeable imidazole-desferrioxamine conjugates: synthesis and in vitro evaluation, Bioconjugate Chem., 2019, 30(3), 841–852. 10.1021/acs.bioconjchem.8b00924 [DOI] [PubMed] [Google Scholar]
- 26. Goodwin J. F., Whitten C. F., Chelation of ferrous sulphate solutions by desferrioxamine B, Nature, 1965, 205 (4968), 281–283. 10.1038/205281b0 [DOI] [PubMed] [Google Scholar]
- 27. Mobarra N., Shanaki M., Ehteram H., Nasiri H., Sahmani M., Saeidi M., Goudarzi M., Pourkarim H., Azad M., A review on iron chelators in treatment of iron overload syndromes, Int. J. Hematol. Oncol. Stem Cell Res., 2016, 10(4), 239–247. [PMC free article] [PubMed] [Google Scholar]
- 28. Kline M. A., Orvig C., Complexation of iron with the orally active decorporation drug L1 (3-hydroxy-1,2-dimethyl-4-pyridinone), Clin. Chem., 1992, 38(4), 562–565. 10.1093/clinchem/38.4.562 [DOI] [PubMed] [Google Scholar]
- 29. Clarke Eric T. M. A. E., Reibenspies J., Crystal structure of the tris 1,2-dimethyl-3-hydroxy-4-pyridinone (DMHP) complex with the Fe(III) ion, Inorg. Chim. Acta, 1992, 196(2), 177–183. 10.1016/S0020-1693(00)86121-6 [DOI] [Google Scholar]
- 30. Steinhauser S., Heinz U., Bartholomä M., Weyhermüller T., Nick H., Hegetschweiler K., Complex formation of ICL670 and related ligands with Fe<SUP>III</SUP>and Fe<SUP>II</SUP>, Eur. J. Inorg. Chem., 2004, 2004(21), 4177–4192. [Google Scholar]
- 31. Ibrahim O., O'Sullivan J., Iron chelators in cancer therapy, Biometals, 2020, 33(4–5), 201–215. 10.1007/s10534-020-00243-3 [DOI] [PubMed] [Google Scholar]
- 32. Negida A., Hassan N. M., Aboeldahab H., Zain Y. E., Negida Y., Cadri S., Cadri N., Cloud L. J., Barrett M. J., Berman B., Efficacy of the iron-chelating agent, deferiprone, in patients with Parkinson's disease: a systematic review and meta-analysis, CNS Neurosci. Ther., 2024, 30(2), e14607. 10.1111/cns.14607 [DOI] [PMC free article] [PubMed] [Google Scholar]
- 33. Finkenstedt A., Wolf E., Hofner E., Gasser B. I., Bosch S., Bakry R., Creus M., Kremser C., Schocke M., Theurl M., Moser P., Schranz M., Bonn G., Poewe W., Vogel W., Janecke A. R., Zoller H., Hepatic but not brain iron is rapidly chelated by deferasirox in aceruloplasminemia due to a novel gene mutation, J. Hepatol., 2010, 53(6), 1101–1107. 10.1016/j.jhep.2010.04.039 [DOI] [PMC free article] [PubMed] [Google Scholar]
- 34. Klopstock T., Chahrokh-Zadeh S., Holinski-Feder E., Meindl A., Gasser T., Pongratz D., Muller-Felber W., Markedly different course of Friedreich's ataxia in sib pairs with similar GAA repeat expansions in the frataxin gene, Acta Neuropathol., 1999, 97(2), 139–142. 10.1007/s004010050966 [DOI] [PubMed] [Google Scholar]
- 35. Smith G. C., Alpendurada F., Carpenter J. P., Alam M. H., Berdoukas V., Karagiorga M., Ladis V., Piga A., Aessopos A., Gotsis E. D., Tanner M. A., Westwood M. A., Galanello R., Roughton M., Pennell D. J., Effect of deferiprone or deferoxamine on right ventricular function in thalassemia major patients with myocardial iron overload, J. Cardiovasc. Magn. Reson., 2011, 13(1), 34. 10.1186/1532-429X-13-34 [DOI] [PMC free article] [PubMed] [Google Scholar]
- 36. Sammaraiee Y., Banerjee G., Farmer S., Hylton B., Cowley P., Eleftheriou P., Porter J., Werring DJ. Risks associated with oral deferiprone in the treatment of infratentorial superficial siderosis, J. Neurol., 2020, 267(1), 239–243. 10.1007/s00415-019-09577-6 [DOI] [PMC free article] [PubMed] [Google Scholar]
- 37. Kontoghiorghes G. J., Introduction of higher doses of deferasirox: better efficacy but not effective iron removal from the heart and increased risks of serious toxicities, Expert Opin. Drug Saf., 2010, 9(4), 633–641. 10.1517/14740338.2010.497138 [DOI] [PubMed] [Google Scholar]
- 38. Campuzano V., Montermini L., Lutz Y., Cova L., Hindelang C., Jiralerspong S., Trottier Y., Kish S. J., Faucheux B., Trouillas P., Authier F. J., Durr A., Mandel J. L., Vescovi A., Pandolfo M., Koenig M., Frataxin is reduced in Friedreich ataxia patients and is associated with mitochondrial membranes, Hum. Mol. Genet., 1997, 6(11), 1771–1780. 10.1093/hmg/6.11.1771 [DOI] [PubMed] [Google Scholar]
- 39. Campuzano V., Montermini L., Molto M. D., Pianese L., Cossee M., Cavalcanti F., Monros E., Rodius F., Duclos F., Monticelli A., Zara F., Canizares J., Koutnikova H., Bidichandani S. I., Gellera C., Brice A., Trouillas P., De Michele G., Filla A., De Frutos R., Palau F., Patel P. I., Di Donato S., Mandel J. L., Cocozza S., Koenig M., Pandolfo M., Friedreich's ataxia: autosomal recessive disease caused by an intronic GAA triplet repeat expansion, Science, 1996, 271(5254), 1423–1427. 10.1126/science.271.5254.1423 [DOI] [PubMed] [Google Scholar]
- 40. Cook J. D., Bencze K. Z., Jankovic A. D., Crater A. K., Busch C. N., Bradley P. B., Stemmler A. J., Spaller M. R., Stemmler T. L., Monomeric yeast Frataxin is an iron-binding protein, Biochemistry, 2006, 45(25), 7767–7777. 10.1021/bi060424r [DOI] [PMC free article] [PubMed] [Google Scholar]
- 41. Kondapalli K. C., Kok N. M., Dancis A., Stemmler T. L., Drosophila Frataxin: an iron chaperone during cellular Fe−S cluster bioassembly, Biochemistry, 2008, 47(26), 6917–6927. 10.1021/bi800366d [DOI] [PMC free article] [PubMed] [Google Scholar]
- 42. Stemmler T. L., Lesuisse E., Pain D., Dancis A., Frataxin and mitochondrial FeS cluster biogenesis, J. Biol. Chem., 2010, 285(35), 26737–26743. 10.1074/jbc.R110.118679 [DOI] [PMC free article] [PubMed] [Google Scholar]
- 43. Cai K., Frederick R. O., Tonelli M., Markley, J. L. Interactions of iron-bound frataxin with ISCU and ferredoxin on the cysteine desulfurase complex leading to Fe-S cluster assembly, J. Inorg. Biochem., 2018, 183, 107–116. 10.1016/j.jinorgbio.2018.03.007 [DOI] [PMC free article] [PubMed] [Google Scholar]
- 44. Alper G., Narayanan V., Friedreich's ataxia, Pediatr. Neurol., 2003, 28(5), 335–341. 10.1016/S0887-8994(03)00004-3 [DOI] [PubMed] [Google Scholar]
- 45. Zhang Y., Lyver E. R., Knight S. A., Lesuisse E., Dancis A., Frataxin and mitochondrial carrier proteins, Mrs3p and Mrs4p, cooperate in providing iron for heme synthesis, J. Biol. Chem., 2005, 280(20), 19794–19807. 10.1074/jbc.M500397200 [DOI] [PubMed] [Google Scholar]
- 46. Pandolfo M., Arpa J., Delatycki M. B., Le Quan Sang K. H., Mariotti C., Munnich A., Sanz-Gallego I., Tai G., Tarnopolsky M. A., Taroni F., Spino M., Tricta F., Deferiprone in Friedreich ataxia: a 6-month randomized controlled trial, Ann. Neurol., 2014, 76(4), 509–521. 10.1002/ana.24248 [DOI] [PubMed] [Google Scholar]
- 47. Hu J. D. L., Outten C. E., The redox environment in the mitochondrial intermembrane space is maintained seperately from the cytosol and matrix, J. Biol. Chem., 2008, 283(43), 29126–29134. [DOI] [PMC free article] [PubMed] [Google Scholar]
- 48. Shen D., Dalton T. P., Nebert D. W., Shertzer H. G., Glutathione redox state regulates mitochondrial reactive oxygen production, J. Biol. Chem., 2005, 280(27), 25305–25312. 10.1074/jbc.M500095200 [DOI] [PubMed] [Google Scholar]
- 49. Gonciarz R. L., Collisson E. A., Renslo A. R., Ferrous Iron-Dependent Pharmacology, Trends Pharmacol. Sci., 2021, 42(1), 7–18. 10.1016/j.tips.2020.11.003 [DOI] [PMC free article] [PubMed] [Google Scholar]
- 50. Lee K. H., Kim D. Y., Kim W., Cultivation of human skin cells under physiological oxygen concentration modulates expression of skin significant genes and response to hydroxy acids, Biochem. Biophys. Res. Commun., 2021, 551, 161–167. 10.1016/j.bbrc.2021.02.113 [DOI] [PubMed] [Google Scholar]
- 51. Thomas C., Mackey M. M., Diaz A. A., Cox D. P., Hydroxyl radical is produced via the Fenton reaction in submitochondrial particles under oxidative stress: implications for diseases associated with iron accumulation, Redox Report, 2009, 14(3), 102–108. 10.1179/135100009X392566 [DOI] [PubMed] [Google Scholar]
- 52. Fischbacher A., von Sonntag C., Schmidt T. C., Hydroxyl radical yields in the Fenton process under various pH, ligand concentrations and hydrogen peroxide/Fe(II) ratios, Chemosphere, 2017, 182, 738–744. 10.1016/j.chemosphere.2017.05.039. [DOI] [PubMed] [Google Scholar]
- 53. Burkitt M. J., Gilbert B. C., The autoxidation of iron(II) in aqueous systems: the effects of iron chelation by physiological, non-physiological and therapeutic chelators on the generation of reactive oxygen species and the inducement of biomolecular damage, Free Radic. Res. Commun., 1991, 14(2), 107–123. 10.3109/10715769109094123 [DOI] [PubMed] [Google Scholar]
- 54. Harris D. C., Aisen P., Facilitation of Fe(II) autoxidation by Fe(3) complexing agents, Biochimica et Biophysica Acta (BBA)—General Subjects, 1973, 329(1), 156–158. 10.1016/0304-4165(73)90019-6 [DOI] [PubMed] [Google Scholar]
- 55. Kosman D. J., Iron metabolism in aerobes: managing ferric iron hydrolysis and ferrous iron autoxidation, Coord. Chem. Rev., 2013, 257(1), 210–217. 10.1016/j.ccr.2012.06.030 [DOI] [PMC free article] [PubMed] [Google Scholar]
- 56. Zang V. aR. vE., Kinetics and mechanism of the autoxidation of iron(II) induced through chelation by ethylenediaminetetraacetate and related ligand, Inorg. Chem., 1990, 29 (9), 1705–1711. 10.1021/ic00334a023 [DOI] [Google Scholar]
- 57. Welch K. D., Davis T. Z., Aust S. D., Iron autoxidation and free radical generation: effects of buffers, ligands, and chelators, Arch. Biochem. Biophys., 2002, 397(2), 360–369. 10.1006/abbi.2001.2694 [DOI] [PubMed] [Google Scholar]
- 58. Samuni A. M., Krishna M. C., DeGraff W., Russo A., Planalp R. P., Brechbiel M. W., Mitchell J. B., Mechanisms underlying the cytotoxic effects of Tachpyr—a novel metal chelator, Biochimica et Biophysica Acta (BBA)—General Subjects, 2002, 1571(3), 211–218. 10.1016/S0304-4165(02)00218-0 [DOI] [PubMed] [Google Scholar]
- 59. Bernhardt P. V., Chin P., Sharpe P. C., Richardson D. R., Hydrazone chelators for the treatment of iron overload disorders: iron coordination chemistry and biological activity, Dalton Trans., 2007, (30), 3232–3244. 10.1039/b704102k [DOI] [PubMed] [Google Scholar]
- 60. Garber Morales J., Holmes-Hampton G. P., Miao R., Guo Y., Munck E., Lindahl P. A., Biophysical characterization of iron in mitochondria isolated from respiring and fermenting yeast, Biochemistry, 2010, 49(26), 5436–5444. 10.1021/bi100558z [DOI] [PMC free article] [PubMed] [Google Scholar]
- 61. McCormick S. P., Moore M. J., Lindahl P. A., Detection of labile low-molecular-mass transition metal complexes in mitochondria, Biochemistry, 2015, 54(22), 3442–3453. 10.1021/bi5015437 [DOI] [PMC free article] [PubMed] [Google Scholar]
- 62. Brawley H. N., Kreinbrink A. C., Hierholzer J. D., Vali S. W., Lindahl P. A., Labile iron pool of isolated Escherichia coli cytosol likely includes Fe-ATP and Fe-Citrate but not Fe-Glutathione or Aqueous Fe, J. Am. Chem. Soc., 2023, 145(4), 2104–2117. 10.1021/jacs.2c06625 [DOI] [PMC free article] [PubMed] [Google Scholar]
- 63. Imlay J. A., Cellular defenses against superoxide and hydrogen peroxide, Annu. Rev. Biochem., 2008, 77 (1), 755–776. 10.1146/annurev.biochem.77.061606.161055 [DOI] [PMC free article] [PubMed] [Google Scholar]
- 64. Park S., Imlay J. A., High levels of intracellular cysteine promote oxidative DNA damage by driving the fenton reaction, J. Bacteriol., 2003, 185(6), 1942–1950. 10.1128/JB.185.6.1942-1950.2003 [DOI] [PMC free article] [PubMed] [Google Scholar]
- 65. Gakh O., Park S., Liu G., Macomber L., Imlay J. A., Ferreira G. C., Isaya G., Mitochondrial iron detoxification is a primary function of frataxin that limits oxidative damage and preserves cell longevity, Hum. Mol. Genet., 2006, 15(3), 467–479. 10.1093/hmg/ddi461 [DOI] [PubMed] [Google Scholar]
- 66. Lewis B. E., Mason Z., Rodrigues A. V., Nuth M., Dizin E., Cowan J. A., Stemmler T. L., Unique roles of iron and zinc binding to the yeast Fe-S cluster scaffold assembly protein “Isu1” , Metallomics, 2019, 11(11), 1820–1835. 10.1039/C9MT00172G [DOI] [PMC free article] [PubMed] [Google Scholar]
- 67. Dzul S. P., Rocha A. G., Rawat S., Kandegedara A., Kusowski A., Pain J., Murari A., Pain D., Dancis A., Stemmler T. L., In vitro characterization of a novel Isu homologue from Drosophila melanogaster for de novo FeS-cluster formation, Metallomics, 2017, 9(1), 48–60. 10.1039/C6MT00163G [DOI] [PMC free article] [PubMed] [Google Scholar]
- 68. Bailey D. K., Clark W., Kosman D. J., The iron chelator, PBT434, modulates transcellular iron trafficking in brain microvascular endothelial cells, PLoS One, 2021, 16(7), e0254794. 10.1371/journal.pone.0254794 [DOI] [PMC free article] [PubMed] [Google Scholar]
- 69. Beauchamp L. C., Liu X. M., Vella L. J., Adlard P. A., Bush A. I., Finkelstein D. I., Barnham K. J., ATH434 rescues pre-motor hyposmia in a mouse model of parkinsonism, Neurotherapeutics, 2022, 19(6), 1966–1975. 10.1007/s13311-022-01300-0 [DOI] [PMC free article] [PubMed] [Google Scholar]
- 70. Diwakarla S., McQuade R. M., Constable R., Artaiz O., Lei E., Barnham K. J., Adlard P. A., Cherny R. A., Di Natale M. R., Wu H., Chai X. Y., Lawson V. A., Finkelstein D. I., Furness J. B., ATH434 reverses colorectal dysfunction in the A53T mouse model of Parkinson's disease, JPD, 2021, 11(4), 1821–1832. 10.3233/JPD-212731 [DOI] [PMC free article] [PubMed] [Google Scholar]
- 71. Finkelstein D. I., Shukla J. J., Cherny R. A., Billings J. L., Saleh E., Stefanova N., Barnham K. J., Adlard P. A., The compound ATH434 prevents Alpha-Synuclein toxicity in a murine model of multiple system atrophy, JPD, 2022, 12(1), 105–115. 10.3233/JPD-212877 [DOI] [PMC free article] [PubMed] [Google Scholar]
- 72. Heras-Garvin A., Refolo V., Schmidt C., Malfertheiner K., Wenning G. K., Bradbury M., Stamler D., Stefanova N., ATH434 reduces alpha-Synuclein-related neurodegeneration in a murine model of multiple system atrophy, Mov. Disord., 2021, 36(11), 2605–2614. 10.1002/mds.28714 [DOI] [PubMed] [Google Scholar]
- 73. Finkelstein D. I., Billings J. L., Adlard P. A., Ayton S., Sedjahtera A., Masters C. L., Wilkins S., Shackleford D. M., Charman S. A., Bal W., Zawisza I. A., Kurowska E., Gundlach A. L., Ma S., Bush A. I., Hare D. J., Doble P. A., Crawford S., Gautier E. C., Parsons J., Huggins P., Barnham K. J., Cherny R. A., The novel compound PBT434 prevents iron mediated neurodegeneration and alpha-synuclein toxicity in multiple models of Parkinson's disease, Acta. Neuropathol. Commun., 2017, 5(1), 53. 10.1186/s40478-017-0456-2 [DOI] [PMC free article] [PubMed] [Google Scholar]
- 74. Therapeutics A., Study of ATH434 in participants with multiple system atrophy, 2024, [Available from: https://clinicaltrials.gov/ct2/show/NCT04102506 (5 February 2004, date last accessed).
- 75. Kato S., Takahashi T., Miyata N., Roman R. J., DMOG, a prolyl hydroxylase inhibitor, increases hemoglobin levels without exacerbating hypertension and renal injury in salt-sensitive hypertensive rats, J. Pharmacol. Exp. Ther., 2020, 372(2), 166–174. 10.1124/jpet.119.262782 [DOI] [PMC free article] [PubMed] [Google Scholar]
- 76. Chan M. C., Atasoylu O., Hodson E., Tumber A., Leung I. K., Chowdhury R., Gomez-Perez V., Demetriades M., Rydzik A. M., Holt-Martyn J., Tian Y. M., Bishop T., Claridge T. D., Kawamura A., Pugh C. W., Ratcliffe P. J., Schofield C. J., Potent and selective triazole-based inhibitors of the hypoxia-inducible factor prolyl-hydroxylases with activity in the murine brain, PLoS One, 2015, 10(7), e0132004. 10.1371/journal.pone.0132004 [DOI] [PMC free article] [PubMed] [Google Scholar]
- 77. Koebke K. J., Batelu S., Kandegedara A., Smith S. R., Stemmler T. L., Refinement of protein Fe(II) binding characteristics utilizing a competition assay exploiting small molecule ferrous chelators, J. Inorg. Biochem., 2020, 203, 110882. 10.1016/j.jinorgbio.2019.110882 [DOI] [PubMed] [Google Scholar]
- 78. Walkup G. K., Imperiali B., Fluorescent chemosensors for divalent zinc based on zinc finger domains, J. Am. Chem. Soc., 1997, 119 (15), 3443–3450. 10.1021/ja9642121 [DOI] [Google Scholar]
- 79. Zhang J., Bai Z., Ouyang M., Xu X., Xiong H., Wang Q., Grimm B., Rochaix J. D., Zhang L., The DnaJ proteins DJA6 and DJA5 are essential for chloroplast iron-sulfur cluster biogenesis, EMBO J., 2021, 40(13), e106742. 10.15252/embj.2020106742 [DOI] [PMC free article] [PubMed] [Google Scholar]
- 80. Rehr J. J., Ankudinov A. L., Progress and challenges in the theory and interpretation of X-ray spectra, J. Synchrotron Rad., 2001, 8(2), 61–65. 10.1107/S0909049500016423 [DOI] [PubMed] [Google Scholar]
- 81. George G. N., George S. J., Pickering I. J.. EXAFSPAK. Menlo Park, CA, 2001. http://www-ssrl.slac.stanford.edu/∼george/exafspak/exafs.htm [Google Scholar]
- 82. Nurchi V. M., Crisponi G., Pivetta T., Donatoni M., Remelli M., Potentiometric, spectrophotometric and calorimetric study on iron(III) and copper(II) complexes with 1,2-dimethyl-3-hydroxy-4-pyridinone, J. Inorg. Biochem., 2008, 102(4), 684–692. 10.1016/j.jinorgbio.2007.10.012 [DOI] [PubMed] [Google Scholar]
- 83. Allen F. H., The cambridge structural database: a quarter of a million crystal structures and rising, Acta. Crystallogr. B. Struct. Sci., 2002, 58 (3), 380–388. 10.1107/S0108768102003890 [DOI] [PubMed] [Google Scholar]
- 84. Zhu Z.-H., Hu Q., Pan H.-L., Zhang Y., Xu H., Kurmoo M., Huang J., Zeng M.-H., Tracking the multiple-step formation of an iron(III) complex and its application in photodynamic therapy for breast cancer, Sci. China Chem., 2019, 62(6), 719–726. 10.1007/s11426-019-9464-1 [DOI] [Google Scholar]
- 85. Carmo dos Santos N. A., Natali M., Badetti E., Wurst K., Licini G., Zonta C., Cobalt, nickel, and iron complexes of 8-hydroxyquinoline-di(2-picolyl)amine for light-driven hydrogen evolution, Dalton Trans., 2017, 46(47), 16455–16464. 10.1039/C7DT02666H [DOI] [PubMed] [Google Scholar]
Associated Data
This section collects any data citations, data availability statements, or supplementary materials included in this article.
Supplementary Materials
Data Availability Statement
The data underlying this article are available in the article and in its online supplementary material.