

Abstract
Adenovirus E1A proteins influence cell growth and phenotype through physical interactions with cellular proteins that regulate basic processes such as cell cycle progression, DNA synthesis, and differentiation. p120E4F is a low-abundance cellular transcription factor that represses the adenovirus E4 promoter and is regulated by E1A, through a phosphorylation-induced reduction of its DNA binding activity, to permit activation of the E4 promoter during early infection. To determine the normal biological role of p120E4F, we assessed its ability to influence fibroblast cell growth and transformation. p120E4F suppressed NIH 3T3 fibroblast colony formation but had little effect when coexpressed with E1A and/or activated ras. Cells that overexpressed p120E4F were inhibited in their ability to enter S phase, had elevated levels of the cdk inhibitor p21WAF1, and reduced cyclin D-cdk4/6 kinase activity. The increase of p21WAF1 levels occurred through a p53-independent posttranscriptional mechanism that included a three- to fourfold increase in the half-life of p21WAF1 protein. Coexpression of activated ras with p120E4F stimulated cyclin D1 expression, elevated cyclin D-cdk4/6 kinase activity, and accelerated cell growth. These data suggest an important role for p120E4F in normal cell division and demonstrate that p21WAF1 can be regulated by protein turnover.
Adenovirus E1A oncoproteins serve as the major regulators of the adenoviral life cycle by controlling two aspects of lytic infection: E1A coordinately activates high-level expression of viral genes during the early phase of infection and, in addition, induces the onset of S phase in the host cell to allow viral DNA replication (3, 41). Both capacities are due to the ability of E1A to influence the activity of cellular factors involved in the control of basic processes such as cell cycle progression, DNA synthesis, and differentiation (12, 25, 35, 40). When taken out of the context of a lytic infection, E1A can act as a transforming protein (24, 41); this is due, in part, to its ability to bind to products of the retinoblastoma tumor suppressor gene, Rb, and two Rb-related proteins, p107 and p130 (35, 47).
In G0 or early G1, Rb family proteins are hypophosphorylated and associate with E2Fs, a family of heterodimeric transcription factors that regulate the expression of genes whose products are required for S phase (35). The association of Rb family proteins with E2F factors inactivates E2F-mediated transcriptional stimulation or, on some promoters, can function to actively repress transcription (35). In response to mitogenic signals, cyclin D-cdk4/6 kinase activities, and subsequently cyclin E-cdk2 kinase activity, progressively phosphorylate Rb and cause the release of E2F complexes to enable S phase entry (42, 43). In the absence of mitogenic signals or the presence of growth inhibitory signals, Rb phosphorylation is prevented by decreased levels of cyclin proteins and/or elevated levels of the universal cyclin-dependent kinase inhibitors p21WAF1/Cip1/Sdi1, p27Kip1, and p57Kip2, or the D-type cyclin-dependent kinase inhibitors INK4a-d (23, 44). The binding of E1A to Rb family proteins circumvents this entire regulatory circuit by releasing E2Fs from Rb proteins and thus dysregulating E2F activity to promote cell cycle progression (35).
Cyclin-cdk’s and cdk inhibitors regulate a number of important processes in addition to the Rb-E2F pathway (5, 6, 11, 26, 45), and E1A has also evolved a number of mechanisms to directly control their function. Recent evidence indicates that E1A can bind to and inactivate p27, as well as repress p15INK4b transcription, to help overcome transforming growth factor β (TGF-β)-mediated G1 arrest in epithelial cells (9, 33). However, the complexity of cell growth regulation suggests that additional mechanisms must also be involved.
E4F is a ubiquitously expressed, low-abundance cellular transcription factor that exists in two forms, a predominant full-length 120-kDa protein (p120E4F) and a less-abundant proteolytically derived 50-kDa amino-terminal fragment (p50E4F) (17). Both forms bind to the same sites in the adenovirus E4 promoter but have opposite functional effects; p120E4F represses the E4 promoter in the absence of E1A, whereas p50E4F activates the E4 promoter only in the presence of E1A. E1A differentially regulates the DNA binding activities of both forms through induced phosphorylation, down-regulating the DNA binding activity of the p120E4F repressor while stimulating that of p50E4F, and thus controls a precise regulatory circuit. Analysis of the murine p120E4F protein (also called φAP3) showed that p120E4F phosphorylation is reduced in serum-starved cells but is restimulated by the addition of serum or tetradecanoyl phorbol acetate, or by adenovirus infection, suggesting that p120E4F may regulate some aspect of cell proliferation (18).
Here we report that enforced expression of p120E4F in NIH 3T3 fibroblasts has profound negative effects on cell growth that are alleviated by coexpression of E1A, activated ras, or both. The growth effects of p120E4F are accompanied by an elevation of p21WAF1 levels, which occurs through a posttranscriptional mechanism that includes reduced turnover of the p21 protein.
MATERIALS AND METHODS
Cell culture and DNAs.
All cell lines were maintained in Dulbecco’s modified Eagle’s medium (DMEM) containing 10% fetal bovine serum (FBS) in a 5% CO2 atmosphere. NIH 3T3 clone 7 mouse fibroblast cells were a gift from M. Roussel (St. Jude Children’s Research Hospital, Memphis, Tenn.). p120E4F-expressing cell lines (E4F2.5K/3T3) were generated by Lipofectamine- (Life Technologies) or calcium phosphate-mediated transfection with pCMVs-E4F2.5K (17) and pβA-Pr-neo (19) as a selection marker and selected in media containing 400 μg of G418 per ml. pCMVs-E4F2.5K expresses the 783-amino-acid E4F open reading frame tagged at the amino terminus with the S-peptide (Novagen). E4F262/3T3 cell lines were obtained by using pCMVs-E4F262 and pβA-Pr-neo; pCMVs-E4F262 (previously designated pCMVs-E4F-WT) expresses the first 262 amino acids of the E4F cDNA tagged at the amino terminus with the S-peptide (17). E4F2.5K/ras cell lines were obtained by using pCMVs-E4F2.5K, pβA-Pr-neo, and pSP72-ras, which expresses the T-24-derived activated H-ras mutant (38) (from G. Zambetti, St. Jude Children’s Research Hospital). Control lines (3T3/neo) or ras-expressing lines (3T3/ras) were obtained by using pβA-Pr-neo or pSP72-ras and pβA-Pr-neo, respectively. Dexamethasone-inducible cell lines (pMAM-E4F2.5K/3T3) were obtained by using the S-peptide-tagged E4F-1 cDNA cloned into the SalI site of pMAMneo (Clontech). Dexamethasone (Sigma) was dissolved in sterile phosphate-buffered saline (PBS) to an active concentration of 500 μM and filter sterilized, added directly to the culture medium at the indicated final concentrations, and replaced in culture every two days. Cell synchronization was done by 48-h incubation in DMEM containing 0.1% FBS; cells were stimulated to re-enter the cell cycle by the addition of FBS to a final concentration of 10%. Mutant p53 expression plasmids contained the human p53 cDNA, with the 281 (22) and 22,23,281 (31) mutations, respectively, cloned into pCMVneo (from G. Zambetti). Adenovirus E1A proteins were expressed from pCMV-E1A(13S) and pCMV-E1A(12S) (17).
Colony formation assays.
For Lipofectamine-mediated transfections, 105 NIH 3T3 clone 7 cells were plated in duplicate in six-well trays on day 0. The next day, a total of 2.5 μg of DNA containing 150 ng of each expression plasmid and pBluescript as a carrier in 100 μl of DMEM was mixed with a mixture of 6 μl of lipofectamine and 94 μl of DMEM at room temperature for 45 to 60 min, diluted with 0.8 ml of DMEM, and added to each well; the wells were previously washed with DMEM without additives. Each well received an additional 1 ml of DMEM containing 20% fetal calf serum at 6 h posttransfection and was refed with DMEM containing 10% FBS at 18 to 24 h posttransfection. The next day, each well was expanded to a 10-cm2 plate, and cells were maintained in media containing 400 μg of G418 per ml for 3 weeks, with the media refreshed every 3 days. Colonies were stained with 1× crystal violet stain (Sigma) in PBS and scored visually. For calcium phosphate-mediated transfections, 5 × 10⁵ NIH 3T3 mouse fibroblasts were plated in duplicate or triplicate in 10-cm2 petri dishes on day 0. The next day, cells were refed prior to transfection. Calcium phosphate-DNA precipitates were formed by mixing 20 μg of total DNA, containing 1 μg of each plasmid with pBluescript as a carrier, with 0.5 ml of 0.2 M calcium phosphate and 0.5 ml of 2× BES [N,N-bis(2-hydroxyethyl)-2-aminoethanesulfonic acid]-buffered saline at room temperature for 45 min, adding the solution dropwise to corresponding numbered plates, and incubating the solution overnight at 37°C in 3% CO2. The dishes were then washed twice with 1× PBS, refed, and returned to 5% CO2. After 48 h, transfected cells were split 1:10 or 1:20 into three 10-cm2 dishes and selected in media containing 400 μg of G418 per ml for 3 weeks. G418-resistant colonies were stained and scored as above.
Cell cycle analysis and growth rates.
Analysis of cell cycle distribution and DNA content by fluorescence-activated cell sorting (FACS) was performed as previously described (27). Cell growth rates were determined by plating 0.5 × 10⁵ to 1.0 × 10⁵ cells in duplicate wells of six-well trays in DMEM containing 10% FBS and counting the cells with a hemocytometer every 24 h or as indicated. Cell viability was determined by trypan blue staining.
Immunoprecipitation, pulse-chase, and Western blot analyses.
Detection of E4F protein by S-protein–agarose precipitation followed by Western blotting was done as previously described (17). For pulse-chase analysis of p21WAF1, cells were metabolically labeled in DMEM without methionine or cysteine, containing 0.25 mCi of EXPRE35SS cell labeling mix (NEN) per ml for 1 h, washed twice with DMEM, and refed with DMEM supplemented with 10 mM (each) methionine and cysteine. At the indicated times, labeled cells were lysed for 20 min at 4°C in radioimmunoprecipitation assay buffer, cleared by centrifugation, and precleared by incubation with 50 μl of protein A-Sepharose beads, followed by removal of the beads by centrifugation. Antibody against p21WAF1 (Santa Cruz Biotechnology) was used to immunoprecipitate p21WAF1 protein from equal amounts of protein extracts made at each time point. Immunoprecipitates were separated by sodium dodecyl sulfate–14% polyacrylamide gel electrophoresis (SDS–14% PAGE) (37) and analyzed by a PhosphorImager with ImageQuant software (Molecular Dynamics). Western blots were probed with polyclonal antisera to the amino-terminal 84 amino acids of E4F (α-E4F-Nterm) (17) and donkey anti-rabbit antibody linked to horseradish peroxidase (Life Technologies) and visualized with the enhanced chemiluminescence (ECL) detection system (Amersham, Pierce). To detect Ras proteins, 50 μg of protein in detergent-containing cell extracts (15) or membrane-containing fractions of sonicated cells were separated by SDS–12.5% PAGE and electroblotted to nitrocellulose (Schleicher and Schuell). Western blots were probed with a pan anti-Ras monoclonal antibody (Santa Cruz Biotechnology) and detected by ECL. Cyclins and cyclin-dependent kinase inhibitor proteins were detected with antibodies against p21WAF1 (Santa Cruz Biotechnology), p27KIP1 (Transduction Laboratories), cyclin A (PharMingen, Santa Cruz Biotechnology), cyclin B1 (PharMingen), cyclin D1 (C. J. Sherr, St. Jude Children’s Research Hospital), and cyclin E (Santa Cruz Biotechnology). Blots were visualized by ECL.
In vitro kinase assays.
Immunoprecipitation and analysis of kinase activities from whole-cell extracts of E4F, E4F/ras, and control cell lines were performed essentially as described previously (34, 48). Kinase activities were immunoprecipitated from 100 μg of extract with antisera or purified antibodies against cyclin D1 (C. J. Sherr), cyclin E (Santa Cruz Biotechnology), cyclin A (PharMingen), cdk2, and cdk4 and cdk6 (C. J. Sherr). All reactions were performed at 30°C in 20 μl of kinase buffer (50 mM HEPES [pH 7.5], 10 mM MgCl2, 1 mM dithiothreitol) containing 20 μM ATP and 10 μCi of [γ-32P]ATP (6,000 Ci/mmol; NEN). Reaction mixtures containing cyclin D1 or cdk4 and cdk6 immune complexes were incubated for 90 min and used 50 ng of glutathione S-transferase (GST)-Rb (379–928) protein (S. Hiebert, Vanderbilt University, Nashville, Tenn.) as a substrate. Reaction mixtures containing cyclin E, cyclin A, and cdk2 immune complexes were incubated for 10 min and used 1 μg of histone H1 (Sigma) as a substrate. Phosphorylation of substrate protein was determined by SDS–10% PAGE of boiled immune complex kinase reaction mixtures and quantitated by a PhosphorImager.
Northern blot analysis.
Total RNA was isolated by acid guanidinium thiocyanate-phenol-chloroform extraction (7) and used to prepare polyadenylated RNA with the PolyATtract mRNA isolation system (Promega). Poly(A)+ RNA (10 μg) was electrophoresed through a 1.2% formaldehyde-agarose gel (37) in parallel with RNA size markers (Life Technologies) and transferred to nitrocellulose. Probes were gel-purified plasmid inserts that were labeled by the Megaprime DNA labeling system (Amersham). Individual probes were excised from the following I.M.A.G.E. Consortium [LLNL] cDNA clones (29): mouse p21 (clone 533961), mouse cyclin A (clone 476912), mouse cyclin D1 (clone 402690), and mouse cyclin E (clone 315063). All clones were obtained through Genome Systems, Inc.
RESULTS
p120E4F can suppress fibroblast colony formation and growth.
The effect of p120E4F on cell growth was assessed by colony formation assays using NIH 3T3 fibroblasts. A cytomegalovirus (CMV) promoter-driven expression construct encoding the full-length E4F cDNA (pCMVs-E4F2.5K) or empty vector (pCMV4) was cotransfected into NIH 3T3 fibroblasts with a neomycin resistance marker alone or in combination with constructs expressing E1A(13S), E1A(12S), or activated ras (Table 1). Increasing amounts of the E4F construct markedly suppressed G418-resistant colony formation relative to vector controls. In contrast, when cotransfected with E1A(13S), E1A(12S), or activated ras expression constructs, the E4F construct had little or no suppressive effect on colony formation and at lower levels had a slight stimulatory effect with activated ras. Coexpression of the E4F construct with combinations of E1A(13S) plus ras or E1A(12S) plus ras also had modest stimulatory effects (Table 1). Because coexpression of E1A has little or no effect on expression from pCMVs-E4F2.5K (17), alleviation of p120E4F-induced colony suppression by E1A was not due to effects on p120E4F expression.
TABLE 1.
Effect of E4F cDNA overexpression on NIH 3T3 colony formation
| E4F construct | Amount (μg) | Coexpressed oncogene(s) | Fold change in colony no. (SD)a |
|---|---|---|---|
| pCMV4 | 1.00 | ||
| E4Fb | 0.15 | 0.63 (0.18) | |
| E4F | 0.3 | 0.33 (0.17) | |
| E4F | 0.5 | 0.17 (0.06)c | |
| E4F | 0.15 | + E1A(13S) | 1.19 (0.16) |
| E4F | 0.3 | + E1A(13S) | 0.89 (0.03) |
| E4F | 0.5 | + E1A(13S) | 1.01 (0.30) |
| E4F | 0.15 | + E1A(12S) | 0.86 (0.11) |
| E4F | 0.3 | + E1A(12S) | 0.68 (0.16) |
| E4F | 0.5 | + E1A(12S) | 0.92 (0.54) |
| E4F | 0.15 | + T24-ras | 1.79 (0.31)f |
| E4F | 0.3 | + T24-ras | 2.02 |
| E4F | 0.5 | + T24-ras | 0.76 |
| E4F | 0.15 | + E1A(13S) + T24-ras | 1.75 (0.36) |
| E4F | 0.3 | + E1A(13S) + T24-ras | 1.47 (0.21) |
| E4F | 0.5 | + E1A(13S) + T24-ras | 1.62 |
| E4F | 0.15 | + E1A(12S) + T24-ras | 2.35 (1.44) |
| E4F | 0.3 | + E1A(12S) + T24-ras | 2.10 |
| E4F | 0.5 | + E1A(12S) + T24-ras | 1.47 |
| E4F262d | 1.0 | 1.16 (0.06)e | |
| E4Ff | 0.5 | + p53-281 | 0.17 (0.02) |
| E4F | 0.5 | + p53-22,23,281 | 0.30 (0.07) |
Calculated as the ratio of the number of G418-resistant colonies from pCMVs-E4F2.5K (E4F)- or pCMVs-E4F262 (E4F262)-containing transfections to the number of G418-resistant colonies from pCMV4 control transfections. SD, standard deviation. For each set of E4F transfections, parallel transfections containing pCMV4 (instead of an E4F plasmid) and the indicated coexpressed oncogenes were used as controls. Values are derived from three independent experiments unless otherwise noted; values with no standard deviations are from one experiment. pCMV4 control transfections typically produced 50 to 100 colonies.
Each E4F cDNA-containing transfection was performed with Lipofectamine reagent and contained 105 NIH 3T3 clone 7 fibroblasts, 150 ng of the indicated oncogene-expressing plasmids, the indicated amount of pCMV4 (pCMV) or pCMVs-E4F2.5K (E4F), 150 ng of pβA-Pr-neo, and pBluescript plasmid for 2.5 μg of total DNA; all colony selections were performed in G418-containing media (400 μg/ml) for 24 days.
Values derived from five independent experiments.
Each E4F262-containing transfection was performed with the calcium phosphate procedure and contained 5 × 10⁵ NIH 3T3 fibroblasts, 1.0 μg of pCMV4 (pCMV) or pCMVs-E4F262 (E4F262), 1.0 μg of pβA-Pr-neo, and pBluescript plasmid for 20.0 μg of total DNA; for E4F262, each independent experiment was performed in duplicate or triplicate. These conditions produced numbers of pCMV4 control colonies similar to those of the transfections with Lipofectamine.
Values derived from two independent experiments.
Each p53-containing transfection was performed with Lipofectamine reagent and contained 6 × 10⁴ NIH 3T3 fibroblasts, 150 ng of the indicated mutant p53 expression plasmid or empty vector (pCMVneo), 500 ng of pCMV4 (pCMV) or pCMVs-E4F2.5K, and pBluescript plasmid for 1.0 μg of total DNA.
Although the majority of protein expressed from the E4F cDNA exists in cells as full-length p120E4F, a minor fraction is proteolytically converted to p50E4F (17). As such, the growth effects seen with expression of full-length E4F cDNA could be a function of p120E4F, p50E4F, or both. Therefore, a construct expressing E4F-encoded amino acids 1 to 262 (E4F262) was also tested, as described above, in NIH 3T3 colony formation assays (Table 1); the E4F262-encoded protein displays all of the functional properties of endogenous p50E4F with regard to DNA binding, transcriptional activation, and E1A regulation (17). In contrast to full-length E4F cDNA, expression of E4F262 had no significant effect on colony formation. Therefore, the growth-suppressive effects of E4F cDNA in untransformed NIH 3T3 cells are due to the p120E4F protein.
To further analyze this effect, individual clones of NIH 3T3 fibroblasts were isolated from the colony formation assays described above and assayed for expression of p120E4F or E4F262 and for changes in their growth characteristics; representative clones of each type are illustrated (Fig. 1A). The growth rates of cell lines that overexpress p120E4F were markedly reduced in comparison to control cell lines, and the degree of growth rate reduction roughly correlated with the level of p120E4F expression (Fig. 1B). In contrast, the growth rates of E4F262 cell lines were no different than those of the control cell lines. Cell lines that coexpress p120E4F and activated ras had normal or accelerated growth rates, similar to those of ras-transformed NIH 3T3 fibroblasts (Fig. 2). Cell viability, as measured by trypan blue exclusion, was generally greater than 90% for all cell lines (not shown). Thus, the phenotypic effect of p120E4F expression in stable cell lines correlated with what was observed in colony formation assays.
FIG. 1.

Ectopic expression of p120E4F reduces the growth rate of NIH 3T3 fibroblasts. (A) NIH 3T3 cell lines that express E4F cDNA or an amino-terminal E4F fragment were plated at 5 × 10⁴ cells per 35-mm-diameter well, and cell counts were determined after the indicated times of growth. Cell lines included the parental line (NIH 3T3), a G418-resistant control (3T3/neo 23-1), three lines that express p120E4F from E4F cDNA (E4F2.5K/3T3-4, -5, and -7), and two lines that express the first 262 amino acids from E4F cDNA (E4F252/3T3 25-2 and 26-2). Growth rates of the indicated lines were measured in parallel in three independent experiments. Growth curves shown are from a single representative experiment, with each point being the average from duplicate wells; the standard error between duplicates was less than 4% at all points. (B) Expression levels of ectopically expressed p120E4F in E4F2.5K/3T3 and control cell lines were determined by precipitation with S-protein–agarose and Western blotting using α-E4F-Nterm antiserum after separation of proteins by SDS–10% PAGE. The position of p120E4F is indicated by the arrow. The positions of molecular mass markers (in kilodaltons) are also shown. (C) Expression levels of the ectopically expressed p50E4F-like E4F amino-terminal fragment in E4F262 cell lines were determined by Western blotting as described for panel B. The position of the E4F262 protein is indicated by the arrow.
FIG. 2.

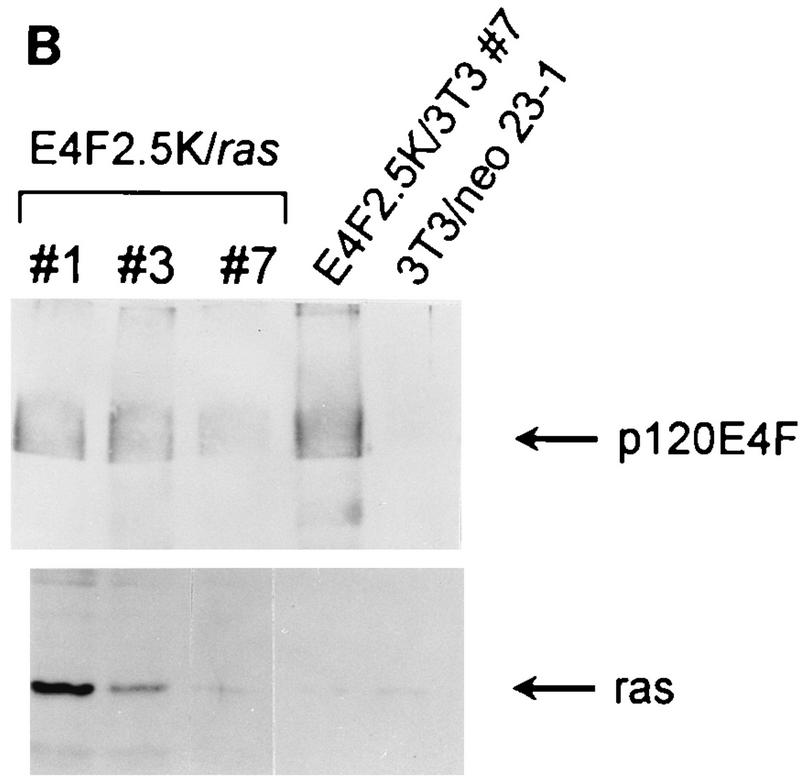
Coexpression of activated ras alleviates the suppression of cell growth by p120E4F. (A) NIH 3T3 cell lines that coexpress p120E4F and activated ras were plated at 105 cells per 35-cm-diameter well, and cell counts were determined at the indicated times. Cell lines include the parental line (NIH 3T3), two ras-expressing cell lines (3T3/ras 17-1 and 17-2), two p120E4F cell lines (E4F2.5K/3T3-4 and -7), and three lines that coexpress p120E4F and activated ras (E4F2.5K/ras-1, -3, and -7). Growth curves are from a single representative experiment, with each point being the average from duplicate wells; the standard error between duplicates was less than 6% at all points. Growth rates of all lines were determined in parallel in three independent experiments. (B) Expression levels of p120E4F and Ras proteins in E4F2.5K/ras and control cell lines. Ectopically expressed p120E4F protein was detected by precipitation with S-protein–agarose and Western blotting using α-E4F-Nterm antiserum after separation of proteins by SDS–10% PAGE. Ras proteins were detected by Western blotting using a pan anti-Ras monoclonal antibody after separation of protein extracts by SDS–14% PAGE, as described in Materials and Methods. The positions of p120E4F and Ras are indicated by arrows.
Enforced p120E4F expression inhibits S-phase entry.
Alleviation of p120E4F’s negative growth effects by E1A and ras suggested that p120E4F was affecting some aspect controlling G1-to-S-phase progression. To determine if E4F cell lines exhibited a delay in S-phase entry, a p120E4F cell line (E4F2.5K/3T3-7) and a control cell line (NIH 3T3) were synchronized in G0 by serum starvation for 48 h and then analyzed by FACS for cell cycle progression following serum stimulation. For the control cell line (Fig. 3, top panel), S-phase entry occurred sharply after 10 h poststimulation, with the number of cells in S phase peaking at 14 to 16 h poststimulation. For the p120E4F cell line (Fig. 3, bottom panel), a slow accumulation of cells in S phase started approximately 10 h poststimulation and then sharply accelerated at 27 h, with the number of cells in S phase peaking at 33 h poststimulation. The period between maximal accumulation in S phase and accumulation in the next G1 phase was approximately 5 to 7 h for both cell lines, indicating a similar duration of G2-M phases for both lines (not shown). These results indicate a delay in the G1-to-S-phase transition in p120E4F-expressing cells.
FIG. 3.

p120E4F attenuates S-phase entry following serum stimulation. Cells were grown to 30% confluency and synchronized in the quiescent G0 state by incubation in media containing 0.1% serum for 48 h prior to stimulation with 10% serum. At the indicated times after serum addition, the distribution of cells with 2C (G0-G1), intermediate (S), and 4C (G2-M) DNA content were determined by FACS analysis of propidium iodide-stained nuclei. FACS profiles were determined for several serum stimulation experiments; values from a representative experiment are shown. (Top panel) Percentage of NIH 3T3 cells in S phase after serum stimulation. (Bottom panel) Percentage of E4F2.5K/3T3-7 cells in S phase after serum stimulation. Note that the time intervals are spaced differently on the two graphs (x axes).
To determine if the delay in S-phase entry was directly attributable to p120E4F function and not a result of clonal selection, we constructed fibroblast cell lines in which p120E4F expression was under dexamethasone-inducible control from the mouse mammary tumor virus long terminal repeat (pMAM-E4F2.5K/3T3) (Fig. 4C). FACS analysis of pMAM-E4F2.5K/3T3 cell lines after 48 to 72 h of dexamethasone treatment showed a sharp reduction of cells in S phase and an accumulation of cells in G0-G1 relative to untreated cells, whereas the percentage of cells in S phase with dexamethasone-treated control cell lines (23-1, pMAM/3T3-1) was only slightly reduced or was unaffected (Fig. 4A and B). These data confirm that p120E4F overexpression attenuates or blocks the G1-to-S transition.
FIG. 4.

Induction of p120E4F leads to G1 arrest. (A) Three cell lines engineered to express p120E4F from the dexamethasone-inducible mouse mammary tumor virus long terminal repeat (pMAM-E4F2.5K/3T3-11, -12, and -13), an empty vector control line (pMAM/3T3-1), and the parental line (3T3/neo 23-1) were grown to 30% confluency and then treated with 1 μM dexamethasone for 48 to 72 h (+ Dex) or left untreated (No Dex). Representative histograms depicting FACS analysis of the indicated cell lines are shown. The positions of propidium iodide-stained cells with 2C and 4C DNA content are indicated. (B) Percentages of cells with 2C (G0-G1), intermediate (S), and 4C (G2-M) DNA content as determined by FACS analysis of the untreated and dexamethasone-treated cell lines shown in panel A. Note the sharp decline of cells in S and G2-M phase following dexamethasone treatment of pMAM-E4F2.5K/3T3 cell lines, compared to control lines. (C) Expression levels of ectopically expressed p120E4F in pMAM-E4F/3T3 cell lines and the pMAM/3T3-1 control line following a 72-h treatment with 1 μM dexamethasone (+). −, untreated. p120E4F protein was detected by Western blotting using α-E4F-Nterm antiserum after S-protein–agarose precipitation from 100 μg of protein extract; the position of p120E4F is indicated.
p120E4F cell lines contain elevated levels of p21WAF1.
Inhibition of G1-to-S-phase progression in p120E4F cell lines suggested that p120E4F/ras expression was affecting the activity of one or more G1-specific cyclin-cdk complexes. Therefore, lysates of p120E4F cells, p120E4FR/ras cells, and control cells were immunoprecipitated by antisera against cyclin D1, cyclin E, cyclin A, cdk2, and cdk4/6, and the immunoprecipitates were tested in vitro for associated kinase activity (Fig. 5A and B). Cyclin D1- and cdk4/6-associated kinase activities were reduced 10- to 20-fold in p120E4F cells, whereas cyclin E- and cdk2-associated kinase activities were reduced 4- to 5-fold and cyclin A-associated kinase activity was reduced 2-fold. In contrast, all cyclin-associated and cdk kinase activities were elevated 1.5- to 4-fold in p120E4F/ras cells, correlating with their increased growth rates.
FIG. 5.

p120E4F cell lines contain reduced G1 cyclin-cdk activities and elevated levels of p21WAF1. (A) Graphic representation of the average relative G1 cyclin-cdk kinase activities present in p120E4F, p120E4F/ras, and control cell lines. Antiserum against cyclin D1, a combination of antisera against cdk4 and cdk6, and antisera against cyclin E, cyclin A, and cdk2 were used to immunoprecipitate kinase activities from extracts of two control cell lines (NIH 3T3 and 3T3/neo 23-1), two p120E4F cell lines (E4F2.5K/3T3-4 and E4F2.5K/3T3-7), and two p120E4F/ras cell lines (E4F2.5K/ras-1 and E4F2.5K/ras-3). Cyclin D1-associated kinase activity and cdk4/6 kinase activity were measured by in vitro phosphorylation of GST-Rb protein; cyclin E-associated kinase activity, cyclin A-associated kinase activity, and cdk2 kinase activity were measured by in vitro phosphorylation of histone H1 protein. Kinase activities in extracts from similar cell types were measured individually by PhosphorImager analysis of 32P-labeled substrate, averaged, and then normalized to the averaged activities from control cell extracts. Each data point depicts the mean relative activity from three independent experiments; standard deviations are shown as thin black bars. (B) Representative in vitro kinase assays for immunoprecipitates of cyclin D1, cdk 4/6, cyclin E, cyclin A, and cdk2 from extracts of the 3T3/neo 23-1 control, E4F2.5K/3T3-7, and E4F2.5K/ras-1 cell lines. Reaction substrates GST-Rb and histone H1 were analyzed after separation by SDS–10% PAGE. (C) Western blot analysis of cyclins D1, E, and A and cdk inhibitors p21 and p27 in extracts from p120E4F cell lines (E4F2.5K/3T3-4, -5, and -7) and control cell lines (NIH 3T3 and 3T3/neo 23-1). Extracts (50 μg of protein/lane) were separated by SDS–12% PAGE and detected by Western blotting; antibody against β-actin was used as a control for protein concentration and loading. (D) Western blot analysis of cyclins D1, E, and A and cdk inhibitors p21 and p27 in extracts from p120E4F/ras cell lines (E4F2.5K/ras-1, -3, and -7) and control cell lines (NIH 3T3 and 3T3/neo 23-1).
The relative protein levels of cyclins D1, E, and A and universal cdk inhibitors p21 and p27 in lysates of p120E4F, p120E4F/ras, and control cell lines were determined by immunoblot analyses. p120E4F cells had significant increases in p21 levels and more modest increases in p27 levels (Fig. 5C), which could account for inhibition of S-phase entry. p120E4F cell lines also had higher levels of cyclin E, which may allow these cells to partially overcome the higher levels of p21 and p27 and grow, albeit at a low rate. p120E4F/ras cell lines still had elevated levels of p21, p27, and cyclin E, but they also had markedly higher levels of cyclin D1 (Fig. 5D), which might titrate out the increased levels of p21 and p27 and permit the observed accelerated growth rates.
p21WAF1 protein half-life is stabilized in p120E4F cell lines independent of p53.
Although p21 and cyclin E protein levels were higher in p120E4F cell lines, Northern blot analysis showed no accompanying increase in p21 mRNA levels and a significant decrease in cyclin E mRNA levels (Fig. 6A). Also, cyclin D1 and cyclin A mRNA levels did not appreciably change. These results, and the lack of E4F binding sites in the p21WAF1 and cyclin E promoters, indicate that the p120E4F transcription factor must be indirectly affecting the expression of these genes. In contrast, cyclin D1 mRNA levels were elevated in p120E4F/ras cell lines (Fig. 6B), accounting for the higher levels of cyclin D1 protein. To determine if the higher level of p21 protein in p120E4F cells was due to increased protein stability, the p21 half-life was measured in p120E4F and control cells by pulse labeling for 1 h with [35S]methionine and [35S]cysteine, followed by a chase with an excess of unlabeled methionine and cysteine. Quantitation of immunoprecipitated p21 protein showed a half-life of ∼45 min in control cells and a half-life of ∼165 min in p120E4F cells (Fig. 7), indicating that p120E4F overexpression leads to a decrease in p21 protein turnover.
FIG. 6.

p120E4F cell lines do not contain increased levels of p21WAF1 mRNA. (A) Northern blot analysis of poly(A) RNA isolated from three p120E4F cell lines (E4F2.5K/3T3-4, -5, and -7) and two control cell lines (NIH 3T3 and 3T3/neo 23-1). Blots (10 μg of RNA/lane) were hybridized with 32P-labeled cDNA probes for p21WAF1, cyclin D1, cyclin E, and cyclin A; a cDNA probe for gelsolin was used as a control for RNA concentration and loading. (B) Northern blot analysis of poly(A)+ RNA isolated from two control cell lines (NIH 3T3 and 3T3/neo 23-1), two p120E4F cell lines (E4F2.5K/3T3-4 and E4F2.5K/3T3-7), and two p120E4F/ras cell lines (E4F2.5K/ras-1 and E4F2.5K/ras-3). Blots were hybridized with 32P-labeled probes for p21WAF1 and cyclin D1.
FIG. 7.

p21WAF1 protein half-life is greater in p120E4F cells. (A) Quantitation of p21 protein half-life. Subconfluent cultures of E4F2.5K/3T3-7 cells and 3T3/neo 23-1 control cells were labeled for 1 h with [35S]methionine and [35S]cysteine and chased with an excess of unlabeled methionine and cysteine for the times indicated. 35S-labeled p21 protein was immunoprecipitated, separated by SDS–14% PAGE, and quantitated by PhosphorImager analysis. The data at individual time points represent the relative amounts of 35S-labeled p21 protein compared to the start of the chase (time zero) and are the average of three independent experiments; standard deviations are shown as thin bars, and the positions where p21 levels are reduced by 50% (t1/2) are indicated by dotted lines. (B) Immunoprecipitation of p21 protein from a representative pulse-chase experiment.
Although the p21 promoter has been identified as a transcriptional target of wild-type p53 (13), the posttranscriptional up-regulation of p21 in p120E4F cells suggests it is not likely to depend upon wild-type p53 function. Also, p53 protein levels are not elevated in p120E4F cells (16). To confirm that p53 is not involved, the E4F cDNA was transfected into NIH 3T3 fibroblasts in combination with constructs expressing two forms of mutant p53, p53-281 and p53-22,23,281 (22, 31). Both forms can oligomerize with and inactivate wild-type p53, but the 22,23,281 mutant lacks a functional transcriptional activation domain. Neither p53 mutant altered the effect of p120E4F expression on colony formation (Table 1), indicating that the effects elicited by p120E4F were p53 independent.
DISCUSSION
Genetic and functional analyses have linked many of the biological effects of the adenovirus E1A proteins to two E1A-mediated transcriptional regulatory mechanisms, the dysregulation of E2F factors through the interaction of E1A with members of the Rb protein family and the repression of enhancer-activated transcription through the interaction of E1A with p300 and CBP (12, 35, 47). We demonstrate in this study that another cellular transcription factor targeted by E1A, p120E4F, can also influence cellular growth and phenotype.
Ectopic expression of p120E4F in NIH 3T3 fibroblasts markedly suppressed colony formation and led to extremely low growth rates in stably expressing cell lines, effects that were alleviated by coexpression of E1A or activated ras. We suspect that the growth-suppressive effects are a specific result of p120E4F-mediated transcriptional repression for several reasons. Currently, the only known function of p120E4F is as a transcriptional repressor, and the growth-suppressive effects were not seen with p50E4F, whose DNA binding activity is dormant in the absence of E1A (17), or with two other factors that recognize the E4F binding site and activate transcription, ATF-2 and NF-IL6 (16). Also, alleviation of the suppressive effect by E1A correlates with the down-regulation of p120E4F DNA binding activity by E1A (17). However, we do not know what cellular genes are specifically targeted by p120E4F or if they can influence cell growth. Thus, we cannot rule out some other unknown function of p120E4F or that E1A may alleviate p120E4F growth suppression by inhibiting this unknown function or through its interaction with Rb family proteins.
p120E4F and regulation of p21WAF1.
Stable or inducible overexpression of p120E4F led to a blocked or attenuated G1-to-S-phase transition. In p120E4F cell lines, p21 protein levels were markedly increased, p27 levels were modestly increased, and cyclin D-cdk4/6 activities were severely compromised (10- to 20-fold lower). Cyclin E-cdk2 and cyclin A-cdk2 activities were also lower but not to the same extent as cyclin D1-cdk4/6, suggesting that the loss of cyclin D-cdk4/6 activity was the primary cause of the G1-to-S block. In confirmation, the stimulation of cyclin D1 gene expression and cyclin D1 protein levels by coexpression of activated ras (49) elevated cyclin D1-cdk4/6 activity by as much as 80-fold and alleviated the G1-to-S block. Furthermore, activated ras expression did not reduce the elevated levels of p21 that were induced by p120E4F, suggesting that p120E4F was still functional in these cells. We therefore presume that the elevated levels of p21 and p27 are responsible for the G1-to-S block but cannot discount the possibility that other p120E4F-induced effects may also be involved.
Mechanisms that control cdk inhibitor expression or activity have been documented at multiple levels, including transcription, mRNA stability, translational control, posttranslational stabilization, and protein sequestration (10, 13, 21, 23, 30, 33, 36, 39, 46), but for p21 most studies have focused on the mechanisms of transcriptional induction. In this study, the effect of p120E4F expression on p21 turnover is a clear indication that protein stability also plays a part in p21 regulation. Whether or not protein stabilization is the only mechanism altering p21 levels in p120E4F-overexpressing cells remains to be determined, as it is unclear if the three- to fourfold increase in p21 half-life can account for the entire observed increase of p21 protein (10- to 30-fold by densitometry). Therefore, we cannot rule out additional posttranscriptional mechanisms, such as the increased translation that occurs during cell cycle regulation of p27, with p53 regulation of cdk4, or with overexpression of mdm-2 in some human tumors (14, 21, 28).
How p120E4F affects p21 turnover remains unclear. We observed that, in addition to p21, cyclin E and p27 protein levels were also elevated, albeit more modestly, in p120E4F-overexpressing cells, suggesting a common link in their regulation. In the case of cyclin E, protein levels increased while mRNA levels significantly dropped, suggesting that cyclin E stabilization was on the same order as that of p21. Recent studies have demonstrated that p21 can be degraded through the ubiquitin-proteosome pathway (4, 32), the mechanism responsible for cyclin E and p27 degradation (8, 36, 50). Although there are no indications as yet that p21 turnover is cell cycle regulated, as occurs with cyclin E and p27 (1, 8, 36, 50), one interpretation of our results is that the specific pathways regulating the turnover of p21 and cyclin E may share a common component whose transcription is affected by p120E4F (e.g., a specific E2, E3, or deubiquitinating enzyme). However, ubiquitinization of cyclin E and p27 appears to require prior phosphorylation by cdk’s (and possibly mitogen-activated protein kinases for p27) (2, 8, 50), and thus their relative stabilization in p120E4F cells could also be a secondary reflection of the inhibition of cdk activities by p21.
Biological relevance of p120E4F.
Although the inhibitory growth effects reported here occurred with overexpression of p120E4F, they do correlate with its regulation observed in serum-starved CREF cells (18); i.e., the stimulation of p120E4F phosphorylation that occurs with serum, tetradecanoyl phorbol acetate, or adenovirus infection (E1A) down-regulates p120E4F DNA binding activity and would thereby lessen its negative effects on cell cycle progression and growth. Also, we recently observed similar negative effects on colony formation and cellular growth rates when p120E4F was overexpressed in H35 hepatoma cells, indicating that the effects reported here are not peculiar to our NIH 3T3 clone or to fibroblast cell lines in general (16).
Another situation where p120E4F may be physiologically relevant involves the effect of E1A on TGF-β growth inhibition. The ability of E1A to overcome TGF-β growth inhibition involves a number of different mechanisms that include the direct physical binding and inactivation of p27, repression of TGF-β-induced p15INK4b gene transcription, and a block to TGF-β induction of p21 (9, 33). Although the effect on p21 induction appears to involve the repression of TGF-β induced activation of the p21 promoter, dependent on an E1A-p300/CBP interaction (5, 9, 30), p21 mRNA induction in TGF-β-treated HaCaT human keratinocyte cells is reduced by only 50% with adenovirus infection (9). This suggests that the marked reduction of p21 protein must also have a posttranscriptional component, and it is possible that this may be due to E1A-mediated down-regulation of p120E4F. Examination of this mechanism and other physiological processes in which p21 levels increase (e.g., senescence or differentiation) may ultimately reveal a wider array of circumstances in which E4F proteins play important roles.
ACKNOWLEDGMENTS
We are grateful to Richard Ashmun, Sam Lucas, and Ed Wingfield for FACS analyses; Charles Sherr for antisera against cyclins D1, D2, and D3, cdk2, cdk4, and cdk6, and p21 and p27; Martine Roussel for NIH 3T3 clone 7 fibroblasts; Scott Hiebert for the construct expressing GST-Rb (379-928); Gerard Zambetti for CMV constructs expressing mutant p53 proteins and for performing p53 Western blot analyses; Jaideep Thottassery and John Schuetz for expressing p120E4F in H35 hepatoma cells; and Ruby Tharp for excellent technical assistance. We also thank Gerard Zambetti, John Cleveland, Martine Roussel, John Schuetz, Jeffrey Sample, and Scott Hiebert for helpful discussions and critical reading of the manuscript.
This work was supported, in part, by National Institutes of Health (NIH) grant R01 GM51299 (R.J.R.), NIH/NCI Cancer Center Support CORE grant 5 P30 CA21765, and the American Lebanese Syrian Associated Charities of St. Jude Children’s Research Hospital (ALSAC).
REFERENCES
- 1.Agrawal D, Dong F, Wang Y Z, Kayda D, Pledger W J. Regulation of cyclin E and p27kip during mitosis in BALB/c 3T3 cells. Cell Growth Differ. 1995;6:1199–1205. [PubMed] [Google Scholar]
- 2.Alessandrini A, Chiaur D S, Pagano M. Regulation of the cyclin-dependent kinase inhibitor p27 by degradation and phosphorylation. Leukemia. 1997;11:342–345. doi: 10.1038/sj.leu.2400581. [DOI] [PubMed] [Google Scholar]
- 3.Berk A J. Functions of adenovirus E1A. Cancer Surv. 1986;5:367–387. [PubMed] [Google Scholar]
- 4.Blagosklonny M V, Wu G S, Omura S, el-Deiry W S. Proteasome-dependent regulation of p21WAF1/CIP1 expression. Biochem Biophys Res Commun. 1996;227:564–569. doi: 10.1006/bbrc.1996.1546. [DOI] [PubMed] [Google Scholar]
- 5.Botchan M. Coordinating DNA replication with cell division: current status of the licensing concept. Proc Natl Acad Sci USA. 1996;93:9997–10000. doi: 10.1073/pnas.93.19.9997. [DOI] [PMC free article] [PubMed] [Google Scholar]
- 6.Chevalier S, Blow J J. Cell cycle control of replication initiation in eukaryotes. Curr Opin Cell Biol. 1996;8:815–821. doi: 10.1016/s0955-0674(96)80082-2. [DOI] [PubMed] [Google Scholar]
- 7.Chomczynski P, Sacchi N. Single-step method of RNA isolation by acid guanidinium thiocyanate-phenol-chloroform extraction. Anal Biochem. 1987;162:156–159. doi: 10.1006/abio.1987.9999. [DOI] [PubMed] [Google Scholar]
- 8.Clurman B E, Sheaff R J, Thress K, Groudine M, Roberts J M. Turnover of cyclin E by the ubiquitin-proteosome pathway is regulated by cdk2 binding and phosphorylation. Genes Dev. 1996;10:1979–1990. doi: 10.1101/gad.10.16.1979. [DOI] [PubMed] [Google Scholar]
- 9.Datto M B, Hu P P-C, Kowalik T F, Yingling J, Wang X-F. The viral oncoprotein E1A blocks transforming growth factor β-mediated induction of p21/WAF1/Cip1 and p15/INK4B. Mol Cell Biol. 1997;17:2030–2037. doi: 10.1128/mcb.17.4.2030. [DOI] [PMC free article] [PubMed] [Google Scholar]
- 10.Datto M B, Li Y, Panus J F, Howe D J, Xiong Y, Wang X F. Transforming growth factor beta induces the cyclin-dependent kinase inhibitor p21 through a p53-independent mechanism. Proc Natl Acad Sci USA. 1995;92:5545–5549. doi: 10.1073/pnas.92.12.5545. [DOI] [PMC free article] [PubMed] [Google Scholar]
- 11.Doree M, Galas S. The cyclin-dependent protein kinases and the control of cell division. FASEB J. 1994;8:1114–1121. doi: 10.1096/fasebj.8.14.7958616. [DOI] [PubMed] [Google Scholar]
- 12.Eckner R. p300 and CBP as transcriptional regulators and targets of oncogenic events. Biol Chem. 1996;377:685–688. [PubMed] [Google Scholar]
- 13.el-Deiry W S, Tokino T, Velculescu V E, Levy D B, Parsons R, Trent J M, Lin D, Mercer W E, Kinzler K W, Vogelstein B. WAF1, a potential mediator of p53 tumor suppression. Cell. 1993;75:817–825. doi: 10.1016/0092-8674(93)90500-p. [DOI] [PubMed] [Google Scholar]
- 14.Ewen M E. p53-dependent repression of cdk4 synthesis in transforming growth factor-beta-induced G1 cell cycle arrest. J Lab Clin Med. 1996;128:355–360. doi: 10.1016/s0022-2143(96)80006-0. [DOI] [PubMed] [Google Scholar]
- 15.Fernandes E R, Ashendel C L. ras downregulation of protein kinase C mRNA in C3H 10T1/2 fibroblasts. Mol Carcinog. 1996;17:23–34. doi: 10.1002/(SICI)1098-2744(199609)17:1<23::AID-MC4>3.0.CO;2-L. [DOI] [PubMed] [Google Scholar]
- 16.Fernandes, E. R., and R. J. Rooney. Unpublished data.
- 17.Fernandes E R, Rooney R J. The adenovirus E1A-regulated transcription factor E4F is generated from the human homolog of nuclear factor φAP3. Mol Cell Biol. 1997;17:1890–1903. doi: 10.1128/mcb.17.4.1890. [DOI] [PMC free article] [PubMed] [Google Scholar]
- 18.Fognani C, Della Valle G, Babiss L E. Repression of adenovirus E1A enhancer activity by a novel zinc finger-containing DNA-binding protein related to the GLI-Kruppel protein. EMBO J. 1993;12:4985–4992. doi: 10.1002/j.1460-2075.1993.tb06192.x. [DOI] [PMC free article] [PubMed] [Google Scholar]
- 19.Gunning P, Leavitt J, Muscat G, Ng S-Y, Kedes L. A human beta-actin expression vector system directs high-level accumulation of antisense transcripts. Proc Natl Acad Sci USA. 1987;84:4831–4835. doi: 10.1073/pnas.84.14.4831. [DOI] [PMC free article] [PubMed] [Google Scholar]
- 20.Harlow E, Lane D. Antibodies: a laboratory manual. Cold Spring Harbor, N.Y: Cold Spring Harbor Laboratory Press; 1988. [Google Scholar]
- 21.Hengst L, Reed S I. Translational control of p27Kip1 accumulation during the cell cycle. Science. 1996;271:1861–1864. doi: 10.1126/science.271.5257.1861. [DOI] [PubMed] [Google Scholar]
- 22.Hinds P W, Finlay C A, Quartin R S, Baker S J, Fearon E R, Vogelstein B, Levine A J. Mutant p53 DNA clones from human colon carcinomas cooperate with ras in transforming primary rat cells: a comparison of the “hot spot” mutant phenotypes. Cell Growth Differ. 1990;1:571–580. [PubMed] [Google Scholar]
- 23.Jacks T, Weinberg R A. Cell-cycle control and its watchman. Nature. 1996;381:643–644. doi: 10.1038/381643a0. [DOI] [PubMed] [Google Scholar]
- 24.Jones N C. Transformation by the human adenoviruses. Semin Cancer Biol. 1990;1:425–435. [PubMed] [Google Scholar]
- 25.Jones N C. Transcriptional modulation by the adenovirus E1A gene. Curr Top Microbiol Immunol. 1995;199:59–80. doi: 10.1007/978-3-642-79586-2_4. [DOI] [PubMed] [Google Scholar]
- 26.King R W, Deshaies R J, Peters J, Kirschner M W. How proteolysis drives the cell cycle. Science. 1996;274:1652–1659. doi: 10.1126/science.274.5293.1652. [DOI] [PubMed] [Google Scholar]
- 27.Krishan A. Rapid flow cytometric analysis of the mammalian cell cycle by propidium iodide staining. J Cell Biol. 1975;66:188–193. doi: 10.1083/jcb.66.1.188. [DOI] [PMC free article] [PubMed] [Google Scholar]
- 28.Landers J E, Haines D S, Strauss III J F, George D L. Enhanced translation: a novel mechanism of mdm2 oncogene overexpression identified in human tumor cells. Oncogene. 1994;9:2745–2750. [PubMed] [Google Scholar]
- 29.Lennon G, Auffray C, Polymeropoulos M, Soares M B. The I.M.A.G.E. consortium: an integrated molecular analysis of genomes and their expression. Genomics. 1996;33:151–152. doi: 10.1006/geno.1996.0177. [DOI] [PubMed] [Google Scholar]
- 30.Li J-M, Nichols M A, Chandrasekharan S, Xiong Y, Wang X-F. Transforming growth factor B activates the promoter of cyclin-dependent kinase inhibitor p15INK4B through an Sp1 consensus site. J Biol Chem. 1995;270:26750–26753. doi: 10.1074/jbc.270.45.26750. [DOI] [PubMed] [Google Scholar]
- 31.Lin J, Teresky A K, Levine A J. Two critical hydrophobic amino acids in the N-terminal domain of the p53 protein are required for the gain of function phenotypes of human p53 mutants. Oncogene. 1995;10:2387–2390. [PubMed] [Google Scholar]
- 32.Maki C G, Howley P M. Ubiquitination of p53 and p21 is differentially affected by ionizing and UV radiation. Mol Cell Biol. 1997;17:355–363. doi: 10.1128/mcb.17.1.355. [DOI] [PMC free article] [PubMed] [Google Scholar]
- 33.Mal A, Poon R Y, Howe P H, Toyoshima H, Hunter T, Harter M L. Inactivation of p27Kip1 by the viral E1A oncoprotein in TGFbeta-treated cells. Nature. 1996;380:262–265. doi: 10.1038/380262a0. [DOI] [PubMed] [Google Scholar]
- 34.Matsushime H, Quelle D E, Shurtleff S A, Shibuya M, Sherr C J, Kato J. D-type cyclin-dependent kinase activity in mammalian cells. Mol Cell Biol. 1994;14:2066–2076. doi: 10.1128/mcb.14.3.2066. [DOI] [PMC free article] [PubMed] [Google Scholar]
- 35.Nevins J R. Adenovirus E1A: transcription regulation and alteration of cell growth control. Curr Top Microbiol Immunol. 1995;199:25–32. doi: 10.1007/978-3-642-79586-2_2. [DOI] [PubMed] [Google Scholar]
- 36.Pagano M, Tam S W, Theodoras A M, Beer-Romero P, Del Sal G, Chau V, Yew P R, Draetta G F, Rolfe M. Role of the ubiquitin-proteasome pathway in regulating abundance of the cyclin-dependent kinase inhibitor p27. Science. 1995;269:682–685. doi: 10.1126/science.7624798. [DOI] [PubMed] [Google Scholar]
- 37.Sambrook J, Fritsch E F, Maniatis T. Molecular cloning: a laboratory manual. 2nd ed. Cold Spring Harbor, N.Y: Cold Spring Harbor Laboratory Press; 1989. [Google Scholar]
- 38.Santos E, Tronick S R, Aaronson S A, Pulcianni S, Barbacid M. T24 human bladder carcinoma oncogene is an activated form of the normal human homologue of BALB and Harvey-MSV transforming genes. Nature. 1982;298:343–347. doi: 10.1038/298343a0. [DOI] [PubMed] [Google Scholar]
- 39.Schwaller J, Koeffler H P, Niklaus G, Loetscher P, Nagel S, Fey M F, Tobler A. Posttranscriptional stabilization underlies p53-independent induction of p21WAF1/CIP1/SDI1 in differentiating human leukemic cells. J Clin Invest. 1995;95:973–979. doi: 10.1172/JCI117806. [DOI] [PMC free article] [PubMed] [Google Scholar]
- 40.Sellers W R, Kaelin W G. Rb as a modulator of transcription. Biochim Biophys Acta. 1996;1288:M1–M5. doi: 10.1016/0304-419x(96)00014-5. [DOI] [PubMed] [Google Scholar]
- 41.Shenk T, Flint J. Transcriptional and transforming activities of the adenovirus E1A proteins. Adv Cancer Res. 1991;57:47–85. doi: 10.1016/s0065-230x(08)60995-1. [DOI] [PubMed] [Google Scholar]
- 42.Sherr C J. D-type cyclins. Trends Biochem Sci. 1995;20:187–190. doi: 10.1016/s0968-0004(00)89005-2. [DOI] [PubMed] [Google Scholar]
- 43.Sherr C J. Cancer cell cycles. Science. 1996;274:1672–1677. doi: 10.1126/science.274.5293.1672. [DOI] [PubMed] [Google Scholar]
- 44.Sherr C J, Roberts J M. Inhibitors of mammalian G1 cyclin-dependent kinases. Genes Dev. 1995;9:1149–1163. doi: 10.1101/gad.9.10.1149. [DOI] [PubMed] [Google Scholar]
- 45.Stillman B. Cell cycle control of DNA replication. Science. 1996;274:1659–1664. doi: 10.1126/science.274.5293.1659. [DOI] [PubMed] [Google Scholar]
- 46.Vlach J, Hennecke S, Alevizopoulos K, Conti D, Amati B. Growth arrest by the cyclin-dependent kinase inhibitor p27Kip1 is abrogated by c-Myc. EMBO J. 1996;15:6595–6604. [PMC free article] [PubMed] [Google Scholar]
- 47.Whyte P K. The retinoblastoma protein and its relatives. Semin Cancer Biol. 1995;6:83–90. doi: 10.1006/scbi.1995.0011. [DOI] [PubMed] [Google Scholar]
- 48.Winston J, Dong F, Pledger W J. Differential modulation of G1 cyclins and the Cdk inhibitor p27kip1 by platelet-derived growth factor and plasma factors in density-arrested fibroblasts. J Biol Chem. 1996;271:11253–11260. doi: 10.1074/jbc.271.19.11253. [DOI] [PubMed] [Google Scholar]
- 49.Winston J T, Coats S R, Wang Y Z, Pledger W J. Regulation of the cell cycle machinery by oncogenic ras. Oncogene. 1996;12:127–134. [PubMed] [Google Scholar]
- 50.Won K A, Reed S I. Activation of cyclin E/CDK2 is coupled to site-specific autophosphorylation and ubiquitin-dependent degradation of cyclin E. EMBO J. 1996;15:4182–4193. [PMC free article] [PubMed] [Google Scholar]