

Abstract
Developmental dyslexia (DD) is a common reading disorder with neurological underpinnings; however, it remains unclear whether Chinese children with DD exhibit spectral power or network topology abnormalities. This study investigated spectral power and brain network topology abnormalities using electroencephalography (EEG) during resting states and a one-back Chinese-Korean character task in 85 Hong Kong Chinese children with DD and 51 typically developing peers (ages 7–11). EEG signals were transformed using the Fast Fourier Transform to estimate spectral power. Functional connectivity matrices were derived using the phase-lag index, and network topology was assessed via minimum spanning tree (MST) analysis. The results suggested that children with DD showed reduced alpha power over central, frontal, temporal, parietal, and occipital scalp areas at rest, and over central and frontal areas during the task. MST results revealed decreased beta band integration at rest but increased alpha band integration during the one-back task. Familiar Chinese stimuli elicited greater alpha and beta power and lower beta band integration compared to unfamiliar Korean stimuli. Moreover, resting-state beta band integration correlated positively with reading fluency in children with DD. These findings point to inhibitory control deficits and cortical hyperactivation in Chinese DD, reflected in disrupted large-scale network topology, and highlight the alpha band as a potential biomarker. They also demonstrate that language familiarity modulates neural efficiency and recruits compensatory networks. Overall, the study provides new insights into the neural basis of reading difficulties in Chinese children with DD.
Supplementary Information
The online version contains supplementary material available at 10.1007/s10548-025-01123-0.
Keywords: Developmental dyslexia, EEG, Spectral power, Brain topology
Introduction
Developmental dyslexia (DD) is a widespread neurodevelopmental disorder, affecting approximately 5–10% of children globally, with prevalence estimates varying depending on diagnostic criteria (Pennington and Bishop 2009). It is characterized by persistent deficits in reading, writing, and spelling despite adequate intelligence, educational access, motivation, and intact sensory abilities (Shaywitz and Shaywitz 2005). Neuroimaging studies have consistently identified structural and functional abnormalities in core reading-related brain regions, including the left temporoparietal cortex, left occipitotemporal cortex, and left inferior frontal gyrus—regions implicated in phonological processing, orthographic recognition, and reading fluency (Brem et al. 2020; Hoeft et al. 2007; Richlan et al. 2011). Beyond academic challenges, DD is linked to psychosocial issues such as stress and anxiety, highlighting its significant impact as a learning disability (Eissa 2010; Espin et al. 2019).
Cognitive Deficits in DD
DD is a multifaceted disorder characterized by a range of cognitive deficits, including impairments in phonological processing (Ramus et al. 2003), orthographic skills (Boros et al. 2016), morphological awareness (Shu et al. 2006), and working memory (Fostick and Revah 2018). The diverse cognitive impairments associated with DD underscore its complexity and suggest the involvement of various neural anomalies underlying the disorder. In alphabetic languages, phonological awareness is traditionally considered the core deficit (Melby-Lervåg and Lervåg 2012). However, in non-alphabetic languages such as Chinese, which lack phoneme-to-grapheme correspondence, deficits in orthographic and morphological awareness are more pronounced (Ho et al. 2007; McBride-Chang et al. 2011; Yan et al. 2013). These linguistic differences suggest both unique and shared cognitive processes across alphabetic and non-alphabetic language systems. Consequently, the underlying neural mechanisms of DD may also differ between these writing systems, reflecting language-specific processing demands.
Neural Connectivity and Large-Scale Network Abnormalities in DD
Neuroimaging studies have traditionally focused on identifying specific brain regions related to reading. However, it is now recognized that reading requires the intricate coordination of a widespread neural network (Cattinelli et al. 2013). Recent neuroimaging research has shifted focus toward investigating connectivity and large-scale brain network abnormalities in DD. Resting-state fMRI studies indicate widespread connectivity abnormalities. For example, a German study found that children with DD exhibit reduced connectivity between the left posterior and inferior frontal areas (Schurz et al., 2015). Reduced connectivity in the visual word form area and left inferior frontal gyrus has been observed in children with DD during reading tasks (Schurz et al., 2015; Van der Mark et al., 2009). Research on Chinese children with DD has shown decreased connectivity between the left middle occipital gyrus and the left inferior frontal gyrus during lexical processing and visual perception tasks (Cao et al., 2018).
Large-scale brain network abnormalities in children with DD have been investigated using fMRI and brain topology methods during resting and task states (Bailey et al. 2018; Zhang et al. 2021). Resting-state studies suggest that children with DD show lower connectivity clustering in the left hemisphere than their typically developing (TD) peers (Finn et al. 2014; Qi et al. 2016). However, task-based findings have yielded inconsistent results. While some studies have reported over-segregated functional organization in Chinese children with DD during phonological tasks (Zhang et al. 2021), others have found no significant group differences, suggesting task-dependent neural adaptations (Yang and Tan 2020). These discrepancies underscore the need for further research to explore how task demands and linguistic differences influence brain connectivity patterns in DD.
EEG Spectral and Connectivity Abnormalities in DD
EEG has provided valuable insights into the neurophysiological underpinnings of DD during resting-state and task-state conditions. Specifically, studies on EEG spectral power have revealed reduced alpha band activity (8–12 Hz) across the frontal, temporal, and parietal scalp areas in children with DD (Babiloni et al. 2012; Papagiannopoulou and Lagopoulos 2016). This diminished alpha activity, often localized in the temporoparietal scalp area—crucial for decoding and word recognition—potentially indicates a disruption in the neural mechanisms underlying phonological processing (Angelakis et al. 2004). Furthermore, children with DD have shown decreased beta band activity (12–30 Hz) over the frontal and central scalp areas (Eroğlu et al. 2022; Spironelli et al. 2008). Since beta activity is associated with executive functions and visuomotor integration, its reduction further indicates impairments in broader cognitive processing domains (Basharpoor et al. 2022). Notably, findings from De Vos et al. (2017) suggest that increased beta band power to speech rhythms in adolescents with DD may represent a compensatory mechanism. In their study, adolescents with DD showed reduced alpha synchronization but elevated beta responses, and importantly, beta power positively correlated with phonological performance. These results suggest that beta oscillatory activity may support phonemic processing in the absence of efficient alpha entrainment.
Beyond spectral power, EEG connectivity studies have unveiled that children with DD display reduced connectivity between the occipital and temporal scalp areas, indicating a disruption in the neural circuitry that supports reading (Gallego-Molina et al. 2022; Žarić et al. 2017). Resting-state EEG source analyses have also revealed weaker connectivity among regions involved in visual and motor processing, including the calcarine sulcus, right postcentral gyrus, left paracentral gyrus, right angular gyrus, and right supplementary motor area (Bosch-Bayard et al. 2020). In contrast, other studies have reported increased coherence across widespread scalp regions—particularly frontal, central, and temporal areas—across all frequency bands (delta, theta, alpha, and beta), which may reflect compensatory reorganization of functional networks in response to reading difficulties (Arns et al., 2007).
Brain Network Integration and Topology Abnormalities in DD
Minimum Spanning Tree (MST) analysis is increasingly used to explore global brain connectivity, offering insights into neural network organization while avoiding the confounds of recurrent connections. MST constructs a cycle-free network that connects all brain regions with minimal total weight, enabling a more efficient assessment of network structure (Stam et al. 2014; Tewarie et al. 2015a). In the context of DD, the application of MST to resting-state EEG data has consistently exposed atypical brain topology. For instance, Fraga González et al. (2016) identified a less integrated theta band network in Dutch children with DD. Similarly, Xue et al. (2020) reported a less integrated theta band network in Chinese children with DD, along with reduced beta band integration, suggesting potential cultural or linguistic specificity in brain network alterations associated with DD.
In contrast, studies in adults with DD have shown more integrated alpha band networks (Fraga González et al. 2018), interpreted as a compensatory reorganization that may reflect increased reliance on alternative or bilateral neural pathways to support reading. Since DD is a neurological disorder of reading (Habib 2000), examining brain topology differences in EEG during reading tasks would be valuable. However, there are few task-state EEG studies investigating brain topology abnormalities. Only a task-state EEG study of Dutch adults with DD during auditory tasks found that individuals with DD exhibit a stronger shift toward a more integrated theta band network topology during word tracking, suggesting altered functional brain network organization linked to impaired phonological and reading skills (Zhang et al. 2022).
The Current Study
Despite significant advancements, critical gaps in our understanding of DD remain. Research on brain network topology in non-alphabetic languages, such as Chinese, is notably scarce, particularly studies examining spectral power and topological abnormalities. Moreover, existing studies are often limited by small sample sizes (Fraga González et al. 2016; Xue et al. 2020; Zhang et al. 2022), reducing statistical power and generalizability. Additionally, most MST-based investigations have focused exclusively on resting-state data. Given DD’s reading-related nature, examining differences in brain topology during reading tasks may provide more ecologically valid insights. Resting-state activity predominantly reflects aperiodic or spontaneous neural activation, while task-related activity is more directly linked to the specific neural processes engaged by the task and is thus capable of revealing band-specific neural dynamics. To address these limitations, the present study adopts a comprehensive approach, integrating both resting and task states EEG in a large cohort of Chinese children with DD (n = 85). This larger sample size enables robust statistical analyses and the investigation of neural impairments in relation to dyslexia severity. This approach is expected to advance the understanding of DD’s neural mechanisms and inform targeted intervention strategies.
Therefore, our study aims to examine brain activity and network topology abnormalities in Hong Kong Chinese children with DD in both resting and task states. EEG recordings were obtained from children with DD and their TD peers during resting-state sessions—with eyes open and closed—and during a Chinese-Korean one-back task. We calculated spectral power for several scalp areas in the alpha and beta bands and constructed functional connectivity matrices using the phase-lag index (PLI). From each matrix, we extracted MST graphs and computed related metrics. Finally, to explore the potential brain-behaviour connection, we also conducted correlational analyses between the differentiated MST metrics and Chinese word reading measures within the DD group to determine whether neural impairments positively correlate with severity of reading difficulty. We hypothesize that children with DD will demonstrate altered spectral power and brain network topology compared to TD children, reflecting disrupted neural mechanisms. Furthermore, we expect language familiarity to modulate these neural patterns, with brain network properties correlating with reading performance, offering valuable insights into the neural basis of DD.
Method
Participants
In this study, we enrolled 136 participants, 85 children with DD and 51 TD children, all in the second or third grade (aged 7–11 years), to assess differences in brain spectral power and topology during resting and task states. The study was part of a larger research project approved by The Joint Chinese University of Hong Kong—New Territories East Cluster Clinical Research Ethics Committee (The Joint CUHK-NTEC CREC). All participants were native Cantonese-speaking Chinese readers recruited from primary schools and education authorities in Hong Kong. Written consent obtained from both the children and their guardians.
Children with DD had to meet the following inclusion criteria: a formal diagnosis of DD by an educational or clinical psychologist using the Hong Kong Test of Specific Learning Difficulties in Reading and Writing for Primary School Students—Third Edition [HKT-P(III)], requiring adequate IQ (85 or higher), poor literacy (− 1 SD or below), and at least one area of cognitive-linguistic deficit (− 1 SD or below); and no history of brain injury, birth complications, significant sensory impairment, or other neurological or psychological disorders (e.g., ADHD). TD children were identified based on their parents’ reports that they had no reading or writing difficulties. Detailed demographic information for the participants is provided in Table 1.
Table 1.
Descriptive statistics and demographic information
| Measurement | TD | DD | t |
|---|---|---|---|
| Male-to-female ratio | 25:26 | 42:43 | - |
| Age | 8 (± 0.52) | 8.05 (± 1.48) | −0.24 |
| Family income1 | 3.87 (± 1.65) | 3.4 (± 1.91) | 1.34 |
| Maternal education2 | 3.07 (± 1.6) | 2.98 (± 1.76) | 0.25 |
| Paternal education 3 | 3.09 (± 1.67) | 2.87 (± 1.96) | 0.62 |
| D-prime (Chinese) | 3.87 (± 0.54) | 3.47 (± 0.81) | 3.16** |
| D-prime (Korean) | 2.98 (± 0.82) | 2.47 (± 0.84) | 3.26** |
| Reading accuracy | 90.23 (± 15.79) | 45.2 (± 25.88) | 11.46*** |
| Reading fluency | 153.28 (± 46.76) | 57.67 (± 36.19) | 11.68*** |
| Chinese reaction time (ms) | 678.47 (± 132.33) | 764.18 (± 139.58) | −3.20** |
| Korean reaction time (ms) | 716.03 (± 110.29) | 812.70 (± 140.34) | −3.97** |
1Monthly family income was categorized as follows: 1 for HKD 10,000 (USD 1,280) or below, 2 for HKD 10,001–20,000 (USD 1,281–2,560), 3 for HKD 20,001–30,000 (USD 2,561–3,840), 4 for HKD 30,001–40,000 (USD 3,841–5,120), 5 for HKD 40,001–50,000 (USD 5,121–6,400), and 6 for HKD 50,001 (USD 6,401) or above
2Maternal and paternal educational levels were coded with the following scale: 1 for middle school or below, 2 for high school, 3 for preparatory school, 4 for college, and 5 for postgraduate studies
**p <.01 (two-tailed); ***p <.001 (two-tailed)
Behavioral Measures
Chinese word reading accuracy (Wang et al. 2021): The evaluation of Chinese word reading used a list of two-character words derived from the Hong Kong Corpus of Primary School Chinese (Leung and Lee 2002). The second character of each word progressively increased in difficulty. Children were asked to read the second character aloud and were awarded a point for each correct response. The task ended after the participant provided ten consecutive incorrect responses. The total number of correct responses was the score of Chinese word reading accuracy.
Chinese character and word reading fluency (Siu et al. 2018): Reading fluency in Chinese character and word recognition was assessed through three sub-tests. The first sub-test involved characters with pronunciations consistent with their phonetic radicals, while the second sub-test dealt with characters with pronunciations inconsistent with their phonetic radicals. The third sub-test required reading two-character words. In each sub-test, children were tasked with reading correctly as many items as possible within one minute. The sum of the three sub-test scores was the score of Chinese character and word reading fluency.
Experimental Task
The eyes-open and eyes-closed resting-state paradigms: During the resting-state session, children were directed to complete two resting-state paradigms, with their EEG activity being recorded throughout: an eyes-open condition and an eyes-closed condition. Initially, children were guided to sit comfortably and relax. In the eyes-closed condition, they were instructed to look straight ahead, close their eyes, and remain motionless for three minutes. Conversely, for the eyes-open condition, children were asked to fixate on a cross displayed on a computer screen for three minutes without engaging in any specific task.
Chinese-Korean character one-back task: The one-back task, adapted from Maurer et al. (2007), is known to be sensitive to reading expertise in Chinese. In this paradigm, participants were shown sequences of monosyllabic Chinese words and unfamiliar Korean characters and instructed to press the “1” key if the presented character was identical to the one shown in the preceding trial (Maurer et al. 2024; Wang and Maurer 2020; see Fig. 1). Characters from the two languages were matched in stroke number and size. Participants first completed a practice session of 10 trials.
Fig. 1.

The Chinese and Korean one-back trial
The main experiment included four blocks (two in Chinese and two in Korean) of 46 trials, each lasting about two minutes. Trials began with a prefixation period of 250 to 750 milliseconds, followed by a character presentation for 500 milliseconds and a fixation cross for 1 s between trials. Each block contained six target characters and forty non-target characters. The order of Chinese and Korean blocks was counterbalanced between participants to eliminate order effects.
To measure discriminative performance, we utilized d-prime. We calculated the rates of correct identification of targets (hits) and incorrect identification of non-targets as targets (false alarms) and then adjusted these rates to avoid skewed results using the formula d-prime = Z(hit rate) - Z(false alarm rate). We also adjusted for perfect scores following the methods outlined in Haatveit et al. (2010). Participants with d-prime scores below 1 in either Chinese or Korean condition (i.e., 9 with DD and 1 TD) were excluded.
EEG Data Acquisition and Analysis
EEG Recording and Preprocessing
EEG data were recorded in resting states and during a Chinese-Korean character one-back task using a 128-channel EGI system (Electrical Geodesics, Inc.) at a sampling rate of 500 Hz. The recordings were referenced to Cz with an online filter range of 0.1–100 Hz, and impedances were maintained below 50 kΩ. Pre-processing was conducted using BrainVision Analyzer software (Brain Products GmbH). The raw EEG data were filtered offline with a 0.3–70 Hz bandpass filter and a 50 Hz notch filter to remove power line noise. Channels that consistently exhibited poor signal quality throughout the task, such as those showing unusually high-amplitude oscillatory noise or sawtooth-like waveform distortions, were identified through visual inspection and excluded from further analysis. On average, 1.49 ± 1.79 and 1.08 ± 1.01 channels were excluded in the eye-closed condition for the DD and TD groups, respectively, and 1.48 ± 1.64 and 0.83 ± 0.97 channels were excluded in the eye-open condition. For the one-back task, 2.79 ± 2.57 and 1.78 ± 2.00 channels were excluded in the DD and TD groups. The remaining data were subjected to independent component analysis (ICA) to correct eye movement artifacts. ICA was performed using the Extended Infomax algorithm, with all channels enabled and continuous data per subject. Artifactual components were identified by visual inspection of their time series, scalp topographies, and spectral profiles. On average, 4.72 ± 2.70 and 5.61 ± 2.80 components were removed in the DD and TD groups, respectively, for the resting-state eyes-closed condition; 2.54 ± 1.82 and 3.43 ± 2.45 components were removed for the eyes-open condition; 1.93 ± 0.82 and 1.80 ± 0.89 components were removed for the one-back task. Subsequently, the excluded channels were reconstructed using spline interpolation, and all channels were re-referenced to an average reference.
For the resting-state analysis, EEG data were segmented into 2-second epochs, whereas for the task-related analysis, 2-second epochs were extracted from 150 milliseconds before to 1850 milliseconds after each character onset, and only trials without a behavioral response were included in the following analysis. To refine computations and minimize volume conduction from nearby channels, 32 channels matching the 10–20 system were extracted from the initial 128-channel setup, following the transformation standards set by Luu & Ferree (2005), including channels AF3, AF4, FC1, FC2, FC5, FC6, FP1, FP2, F3, F4, F7, F8, FZ, T7, T8, C3, C4, CP1, CP2, CP5, CP6, CZ, P3, P4, P7, P8, PO3, PO4, PZ, O1, O2, and OZ. Artifact rejection criteria excluded segments exceeding ± 100 µV, and participants with fewer than 20 clean segments were excluded, resulting in the removal of 34 participants for the eyes-closed condition, 42 for the eyes-open condition, and 14 for the task-related data. The final sample included 102 participants (40 TD children, 62 children with DD) for the eyes-closed condition; 94 participants (33 TD, 60 DD) for the eyes-open condition; and 115 participants (48 TD, 66 DD) for the Chinese-Korean one-back task, following the exclusion of 10 participants due to poor task performance. Detailed demographic information of each condition is provided in Supplementary Material 1. After exclusion, 6,270 segments (M(± SD) = 61.47 ± 21.26) and 5,284 segments (M(± SD) = 56.82 ± 19.31) were retained for the eyes-closed and eyes-open conditions, respectively. For the one-back task, 6,120 Chinese (M(± SD) = 53.68 ± 13.27) and 6,383 Korean trials (M(± SD) = 55.99 ± 14.09) were retained.
Portions of the eyes-closed resting-state EEG data were used to determine the individual alpha frequency, which defined personalized frequency bands for analyzing EEG power during the working memory task to compare children with DD and TD children (Wang et al. 2022).
Spectral Power
We performed an in-depth spectral power analysis in resting and task states (i.e., eyes-closed, eyes-open, Chinese one-back, and Korean one-back) to investigate the differences in EEG activity between children with DD and TD children across the four experimental conditions: resting-state eyes-closed, resting-state eyes-open, one-back Chinese, and one-back Korean conditions. For this analysis, we utilized the Fast Fourier Transform (FFT) technique, as described by Brigham (1988), to calculate the spectral power for each EEG channel and segment, achieving a frequency resolution of 0.5 Hz. Each 2‑s segment (N = 1000 samples at 500 Hz) was tapered with a Hann window of length N and then submitted to a single N‑point FFT without overlap. EEG signals were filtered using bandpass filters to isolate frequency bands, and a windowing function was applied to minimize spectral leakage before FFT computation. The absolute power for the alpha (8–12 Hz) and beta (12–30 Hz) bands was calculated as the sum of the squared amplitudes of the FFT results. We focused on alpha given its well-established links to working memory during nback tasks and to attentional control during resting-state (Chikhi et al. 2022; Wang et al. 2022), and on beta because of its association with executive functions and visuomotor integration—domains often impaired in DD (Basharpoor et al. 2022). These spectral power values were then averaged across epochs for different scalp areas of interest, including central (C3, C4, CP1, CP2, CP5, CP6, CZ), frontal (AF3, AF4, F3, F4, F7, F8, FC1, FC2, FC5, FC6, FP1, FP2, FZ), temporal (T7, T8), parietal (P3, P4, P7, P8, PO3, PO4, PZ), and occipital (O1, O2, OZ) scalp areas. Delta (0.5–4 Hz) and theta (4–8 Hz) power were also computed for exploratory purposes.
Functional Connectivity
Before constructing MST graphs to quantify brain topological structures, it is essential to compute measures of FC. In this analysis, we employed the phase-lag index (PLI) to quantify FC across all pairwise combinations of the 32 channels. The PLI is a statistical measure designed to capture phase synchronization by assessing the asymmetry in the distribution of instantaneous phase differences between two signals (Stam et al. 2007). A uniform distribution of phase differences indicates an absence of phase synchronization between EEG signals, whereas any deviation from uniformity (i.e., a nonuniform or asymmetric distribution) denotes phase locking and interdependence of the underlying sources. The PLI is less susceptible to confounding influences such as volume conduction and electrode montage. The PLI is defined as follows:
 |
The PLI ranges from 0 to 1, where a value of 0 indicates that the phase difference between the two signals is uniformly distributed around zero (i.e., no asymmetry). In contrast, a value of 1 indicates that the phase difference is either always positive or consistently negative (i.e., complete asymmetry).
In our study, the PLI was computed to assess FC within the alpha and beta bands across resting and task states within the MATLAB R2018b environment (MathWorks Inc., Natick, MA, USA), utilizing the HERMES brain connectivity toolbox (Niso et al., 2013), which is available at https://hermes.med.ucm.es. We also derived PLI FC matrices for the delta and theta bands for an exploratory analysis. A 32 × 32 connectivity matrix was generated for each segment, condition, and frequency band. MST graphs were then constructed based on the PLI matrix of each segment to characterize the underlying brain topology.
Network Topology
To quantify the topology of brain networks, we constructed an MST for each segment-derived PLI matrix. This segment-wise approach follows standard practice in the MST literature (González et al. 2016; Xue et al. 2020; Zhang et al. 2022) and preserves the natural, moment-to-moment fluctuations in network topology. In principle, MST graphs were expected to display an intermediate topology between two extreme cases: a path-like topology (corresponding to maximal segregation) consisting of a series of successively connected nodes and a star-like tree (corresponding to maximal integration) characterized by a central node to which all other nodes are connected with only one edge (see Fig. 2). An MST with N nodes contains N-1 edges, and the weight of each edge is defined as 1 - PLI, and the edges are then sorted in ascending order. This transformation was necessary because MST construction seeks to minimize the total cost required to connect all nodes. By converting PLI values into a distance-like metric, stronger functional connections yield lower weights, enabling the MST algorithm to prioritize these during optimization. The Kruskal algorithm (Kruskal 1956) was used to add the edge with the lowest weight to the tree or skip it to avoid forming a loop until all nodes were connected in a loopless network (Stam et al. 2014).
Fig. 2.
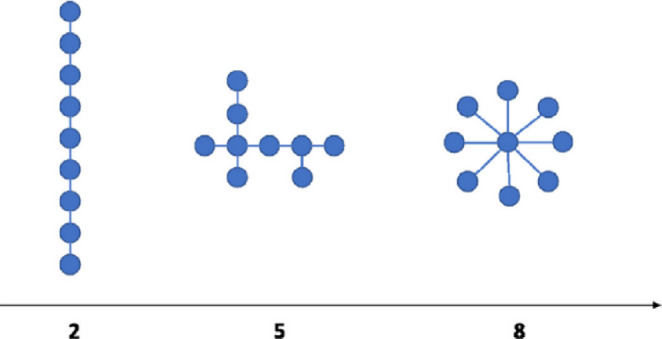
Tree topologies and MST examples in brain networks. Illustrative progression of tree structures ranging from a path-like topology (left) to a star-like topology (right). Each example contains nine nodes (depicted as circles) and eight edges (illustrated as lines). This series demonstrates an increase in the number of leaf nodes, where the path-like tree exemplifies maximal segregation, and the star-like tree represents maximal integration within a network. Adapted from Fraga-González et al. (2016)
To evaluate the topological properties of the MST network in our study, we also computed various topology metrics, including Degree, Kappa, Betweenness Centrality (BC), Diameter, Eccentricity (Ecc), Leaf Fraction (LF), and Tree Hierarchy (Th). These metrics were widely used in previous brain network topology studies of dyslexia (Fraga González et al. 2018; Xue et al. 2020). Table 2 offers detailed descriptions of these metrics.
Table 2.
MST metrics summary
| MST Metrics | Description |
|---|---|
| Degree | The number of neighbors for a given node |
| Kappa | The measure of the broadness of the degree distribution |
| BC | Fractions of all shortest paths that pass through a given node |
| Diameter | The largest distance between any two nodes |
| Ecc | The largest distance between a given node and any other node |
| LF | Fraction of nodes with a degree of 1 |
| Th | A hierarchical metric quantifying the trade-off between large-scale integration in the MST and the overload of central nodes |
Abbreviations: BC = Betweenness Centrality, Ecc = Eccentricity, LF = Leaf Fraction, Th = Tree Hierarchy
Statistical Analysis
We conducted independent sample t-tests to compare the behavioral performance between children with DD and TD children, including Chinese word reading accuracy and fluency, d-prime scores and reaction times for Chinese and Korean conditions in the one-back task.
For the EEG data, to address variability in segment counts across participants, we standardized our analysis by randomly selecting 20 segments from each participant for each condition, repeating this process 1000 times (Zhang et al. 2022). We then conducted independent sample t-tests and repeated-measures ANOVAs (RM ANOVAs) on the grand average of these 1000 randomly selected epoch sets for each condition. Our EEG data analysis primarily focused on the alpha and beta bands. We used independent sample t-tests to investigate group differences between children with DD and TD children concerning spectral power and MST metrics in the resting state. For the Chinese–Korean one-back task, we ran 2 × 2 RM ANOVAs (Group: DD vs. TD; Condition: Chinese vs. Korean) separately for alpha and beta spectral power at each scalp area and for each MST metric within those bands.
Shapiro-Wilk tests indicated a non-normal distribution for most spectral power and MST metrics. To achieve normality, we applied a natural log transformation to the data, consistent with methodologies utilized in preceding studies (Fraga González et al. 2016; Xue et al. 2020; Zhang et al. 2022). Additionally, to control the risk of Type I errors from multiple comparisons, we used the Benjamini–Hochberg false discovery rate (FDR) procedure (q = 0.05, two—sided; Benjamini & Hochberg, 1995). In our spectral‑power analyses, all p‑values from the five scalp areas within each frequency band were adjusted simultaneously. For the repeated‑measures ANOVAs, we applied FDR correction separately to the five regional p‑values for each main effect (group, time) and for the group × time interaction. The same FDR approach was applied to the MST metrics within each band, maintaining sensitivity to true effects while controlling the expected proportion of false discoveries.
Given our particular interest in how differentiated MST metrics relate to Chinese word reading abilities in the DD group—which may reflect underlying deficiencies in network topology related to behavioral outcomes—we performed permutation-based correlation analyses. FDR correction was also implemented here to improve the statistical robustness of the correlation results.
Results
Behavioral Results
Independent‑samples t‑tests revealed strong group differences in reading accuracy and fluency, with children with DD performing markedly worse than their TD peers. Likewise, in the one‑back task, the DD group exhibited significantly lower D-prime scores and longer reaction times across both Chinese and Korean conditions (all p <.01), reflecting poorer task performance and slower processing speed relative to TD children. Detailed behavioral results are presented in Table 1.
Spectral Power Results
Resting-State Spectral Power
Significant group differences were primarily observed in the eyes-closed alpha band across the central (t(100) = 3.136, FDR-corrected p =.011; Fig. 3c), frontal (t(100) = 2.526, FDR-corrected p =.022; Fig. 3d), temporal (t(100) = 2.099, FDR-corrected p =.038; Fig. 3e), parietal (t(100) = 2.924, FDR-corrected p =.011; Fig. 3f), and occipital scalp areas (t(100) = 2.412, FDR-corrected p =.022; Fig. 3g), as shown in Table 3. These effects remained significant after FDR correction, with TD children showing higher alpha power than those with DD. For clarity, only eyes-closed alpha band results are presented in Table 3. No significant group differences were found in the eyes-closed beta band; detailed results are reported in Supplementary Material 2.
Fig. 3.

Comparison of Resting-State Spectral Power. (a) Average spectral power across all channels in the eyes-closed condition. (b) Average spectral power across all channels in the eyes-open condition. Shaded areas represent the 95% confidence interval. Comparison of log-transformed absolute power values across the central (c), frontal (d), temporal (e), parietal (f) and occipital (g) scalp areas in the eyes-closed alpha band, with significant differences indicated after FDR correction. Abbreviations: TD = typically developing, DD = developmental dyslexia. Significance markers: *p <.05
Table 3.
Group comparison of the resting-state spectral power in various scalp areas
| Frequency band | Scalp area | TD | DD | Stats | |||
|---|---|---|---|---|---|---|---|
| M | SD | M | SD | t | p | ||
| Eyes-closed Alpha | Central | 2.343 | 0.459 | 2.004 | 0.630 | 3.136 | 0.002** |
| Frontal | 1.939 | 0.413 | 1.708 | 0.506 | 2.526 | 0.013* | |
| Temporal | 2.717 | 0.599 | 2.435 | 0.749 | 2.099 | 0.038* | |
| Parietal | 3.070 | 0.511 | 2.707 | 0.740 | 2.924 | 0.004** | |
| Occipital | 3.469 | 0.681 | 3.119 | 0.768 | 2.412 | 0.018* | |
Bold text indicates significant effects. Significance markers: * p <.05, ** p <.01, *** p <.001
In eyes-open condition, the TD group exhibited slightly higher alpha power than the DD group over the central (t(91) = 1.746, p =.085) and frontal scalp areas (t(91) = 1.731, p =.088), and lower beta power over the temporal area (t(91) = −1.720, p =.090). This trend is also reflected in the average spectral power plots (Fig. 3a–b), where between-group differences are more pronounced in the eyes-closed condition—particularly in the alpha band—compared to the eyes-open condition. No other significant effects were observed across scalp areas in the alpha or beta bands. Full results for the eyes-open condition are available in Supplementary Material 2.
Task-State Spectral Power
The RM ANOVAs revealed statistically significant differences in EEG spectral power between groups and conditions during the one-back task (see Table 4; Fig. 4). In the alpha band, significant main effects of group were observed in the central (F(1,113) = 4.347, p =.039, η2 = 0.037) and frontal (F(1,113) = 6.506, p =.012, η2 = 0.054) scalp areas, with the TD group showing higher alpha power compared to the DD group. However, these effects did not survive FDR correction. Marginally significant group effects were found over the temporal, parietal, and occipital scalp areas. For the main effect of condition, significant differences were identified after FDR correction in the frontal (F(1,113) = 5.242, FDR-corrected p =.30, η2 = 0.044; Fig. 4c), temporal (F(1,113) = 15.110, FDR-corrected p <.001, η2 = 0.118; Fig. 4d), parietal (F(1,113) = 20.299, FDR-corrected p <.001, η2 = 0.152; Fig. 4e), and occipital (F(1,113) = 51.263, FDR-corrected p <.001, η2 = 0.312; Fig. 4f) scalp areas, with higher alpha power in the Chinese condition compared to the Korean condition. No significant interactions were observed in the alpha band.
Table 4.
Group and condition effects on the alpha and beta power in the one-back task
| Frequency band | Scalp area | Group | Condition | Condition × Group | ||||||
|---|---|---|---|---|---|---|---|---|---|---|
| F(1, 113) | p | η2 | F(1, 113) | p | η2 | F(1, 113) | p | η2 | ||
|
One-back Alpha |
Central | 4.347 | 0.039* | .037 | 0.110 | 0.741 | 0.001 | 1.697 | 0.195 | 0.015 |
| Frontal | 6.506 | 0.012* | 0.054 | 5.242 | 0.024* | 0.044 | 0.709 | 0.401 | 0.006 | |
| Temporal | 2.872 | 0.093 | 0.025 | 15.110 | < 0.001*** | 0.118 | 0.087 | 0.768 | 0.001 | |
| Parietal | 3.813 | 0.053 | 0.033 | 20.299 | < 0.001*** | 0.152 | 0.049 | 0.826 | < 0.001 | |
| Occipital | 2.820 | 0.096 | 0.024 | 51.263 | < 0.001*** | 0.312 | 0.989 | 0.322 | 0.009 | |
|
One-back Beta |
Central | 0.514 | 0.475 | 0.005 | 3.430 | 0.067 | 0.029 | 1.166 | 0.283 | 0.010 |
| Frontal | 3.204 | 0.076+ | 0.028 | 2.167 | 0.144 | 0.019 | 1.648 | 0.202 | 0.014 | |
| Temporal | 0.920 | 0.340 | 0.008 | 0.015 | 0.904 | < 0.001 | 0.092 | 0.762 | 0.001 | |
| Parietal | 0.301 | 0.584 | 0.003 | 22.605 | < 0.001*** | 0.167 | 2.378 | 0.126 | 0.021 | |
| Occipital | 0.060 | 0.807 | 0.001 | 13.741 | < 0.001*** | 0.108 | 1.385 | 0.242 | 0.012 | |
Bold text indicates significant effects. Significance markers: * p <.05, ** p <.01, *** p <.001
Fig. 4.

EEG spectral power differences between DD and TD children in the Chinese and Korean One-Back Task. Group averages for the alpha and beta band spectral powers: (a) Average spectral power across all channels in the Chinese one-back condition. (b) Average spectral power across all channels in Korean one-back condition. Shaded areas represent the 95% confidence interval. Group averages for the spectral power in the alpha band in the frontal (c), temporal (d), parietal (e), and occipital (f) scalp areas, and beta band in the parietal (g) and occipital (h) in the Chinese and Korean conditions of the one-back task. Abbreviations: TD = typically developing, DD = developmental dyslexia. Significance markers: *p <.05, **p <.01, ***p <.001
In the beta band, a marginally significant main effect of group was observed over the frontal scalp area. For the main effect of condition, significant effects were found after FDR correction in the parietal (F(1,113) = 22.605, FDR-corrected p <.001, η2 = 0.167; Fig. 4g) and occipital (F(1,113) = 13.741, FDR-corrected p <.001, η2 = 0.108; Fig. 4h) scalp areas, demonstrating higher beta power in the Chinese condition compared to the Korean condition. A marginally significant main effect of condition was observed in the central scalp area. No significant interactions were found between the group and the condition in the beta band.
Brain Network Topology
Resting-State Network Topology
Resting-state topology analysis in the eyes-open beta band revealed group differences in degree, Kappa, LF, and BC (see Table 5), with children with DD showing lower degree (t(91) = 2.04, p =.045), Kappa (t(91) = 2.38, p =.020), LF (t(91) = 2.28, p =.026), and higher BC (t(91) = − 2.03, p =.047) compared to the TD children. However, these effects did not survive FDR correction. No significant differences were observed in the eyes‑open alpha band or the eyes‑closed alpha or beta bands (see Supplementary Material 3). Figure 5(a) illustrates the eyes‑open beta MST; MSTs for the remaining bands are available in Supplementary Material 6.
Table 5.
Group comparison of the beta band MST metrics during the eyes-open resting state
| Frequency band | MST | TD | DD | Stats | |||
|---|---|---|---|---|---|---|---|
| Metrics | M | SD | M | SD | t | p | |
| Eyes-open Beta | Degree | 1.593 | 0.026 | 1.581 | 0.028 | 2.040 | 0.045* |
| Kappa | 0.174 | 0.042 | 0.152 | 0.044 | 2.380 | 0.020* | |
| BC | −1.919 | 0.020 | −1.910 | 0.020 | −2.030 | 0.047* | |
| Diameter | −2.163 | 0.057 | −2.170 | 0.050 | 0.600 | 0.549 | |
| Ecc | −2.461 | 0.056 | −2.467 | 0.051 | 0.490 | 0.625 | |
| LF | −0.830 | 0.022 | −0.840 | 0.020 | 2.280 | 0.026* | |
| Th | 2.356 | 0.023 | 2.347 | 0.021 | 1.950 | 0.056 | |
Degree = Maximum Nodal Degree, BC = Betweenness Centrality, Ecc = Eccentricity, LF = Leaf Fraction, Th = Tree Hierarchy. Bold text indicates significant effects. Significance markers: * p <.05
Fig. 5.

MST plots for eyes‑open beta and one‑back alpha bands. An illustration of MSTs was created using MATLAB’s treeplot function on group‑average PLI matrices for the eyes‑open beta (a) and one‑back alpha (b) bands. Abbreviations: TD = typically developing; DD = developmental dyslexia
Task-State Network Topology
The analysis of network topology using RM ANOVAs uncovered significant differences between TD and DD children during the one-back task (see Table 6). The results revealed a significant main effect of the group in the diameter (F(1,113) = 3.993, p =.048, η2 = 0.034; Fig. 6b) and eccentricity (F(1,113) = 4.252, p =.036, η2 = 0.036; Fig. 6c) of alpha band, indicating a more integrated brain topology in the DD group than in the TD group when engaged in the one-back task. However, these effects did not survive FDR correction. Furthermore, we found a significant interaction between group and condition in the alpha band degree (F(1,113) = 4.272, p =.041, η2 = 0.036; Fig. 6a). Post hoc analysis indicated that most pairwise contrasts were non-significant (p >.10); however, the comparison between the Chinese and Korean conditions yielded a marginally significant effect in the TD group (t = 2.326, p =.098). For illustration, Fig. 5b displays MST trees derived from group‑average alpha band PLI in the one‑back task; one‑back beta band MSTs are provided in Supplementary Material 6.
Table 6.
Group and condition effects on the alpha and beta band MST metrics during the one-back task
| Frequency band | MST | Group | Condition | Condition × Group | ||||||
|---|---|---|---|---|---|---|---|---|---|---|
| Metrics | F(1, 113) | p | η2 | F(1, 113) | p | η2 | F(1, 113) | p | η2 | |
|
One-back Alpha |
Degree | 0.310 | 0.579 | 0.003 | 2.202 | 0.141 | 0.019 | 4.272 | 0.041* | 0.036 |
| Kappa | 0.178 | 0.674 | 0.002 | 1.665 | 0.200 | 0.015 | 2.319 | 0.131 | 0.020 | |
| BC | 0.248 | 0.620 | 0.002 | 0.172 | 0.679 | 0.002 | 0.391 | 0.533 | 0.003 | |
| Diameter | 3.993 | 0.048* | 0.034 | 0.532 | 0.467 | 0.005 | 0.678 | 0.412 | 0.006 | |
| Ecc | 4.252 | 0.042* | 0.036 | 0.617 | 0.434 | 0.005 | 0.791 | 0.376 | 0.007 | |
| LF | 0.050 | 0.823 | < 0.001 | 0.106 | 0.745 | 0.001 | 0.050 | 0.823 | < 0.001 | |
| Th | 0.010 | 0.919 | < 0.001 | 0.151 | 0.698 | 0.001 | 0.123 | 0.726 | 0.001 | |
|
One-back Beta |
Degree | 0.052 | 0.820 | < 0.001 | 1.751 | 0.188 | 0.015 | 0.004 | 0.951 | < 0.001 |
| Kappa | 1.174 | 0.281 | < 0.001 | 9.066 | 0.003 ** | 0.074 | 0.176 | 0.676 | 0.002 | |
| BC | 0.605 | 0.438 | 0.005 | 3.220 | 0.075+ | 0.028 | 0.009 | 0.924 | < 0.001 | |
| Diameter | 0.426 | 0.515 | 0.004 | 0.023 | 0.881 | < 0.001 | 0.054 | 0.816 | < 0.001 | |
| Ecc | 0.215 | 0.643 | 0.002 | 0.010 | 0.922 | < 0.001 | 0.121 | 0.728 | 0.001 | |
| LF | 3.813 | 0.053+ | 0.033 | 8.296 | 0.005 ** | 0.068 | 0.563 | 0.455 | 0.005 | |
| Th | 2.279 | 0.134 | 0.020 | 2.358 | 0.127 | 0.020 | 1.308 | 0.255 | 0.011 | |
Degree = maximum nodal degree; BC = betweenness centrality; Ecc = eccentricity; LF = leaf fraction; Th = tree hierarchy. Bold text indicates significant effects. Significance markers: * p <.05, ** p <.01, *** p <.001
Fig. 6.

EEG MST metrics differences between DD and TD children in the Chinese and Korean One-Back Task. Group averages for the alpha and beta band MST metrics: degree (a), diameter (b), and eccentricity (c) of alpha band, kappa (d) and leaf fraction (e) of beta band in the Chinese and Korean conditions of the one-back task. For better visualization, a constant was added to adjust the log-transformed MST metrics with negative values. Abbreviations: Ecc = Eccentricity, LF = Leaf Fraction, MST = Minimum Spanning Tree, TD = typically developing, DD = developmental dyslexia. Significance markers: *p <.05, **p <.01
Additionally, a significant main effect of the condition survived FDR correction in the beta band, showing lower Kappa (F(1,113) = 9.066, FDR-corrected p =.017, η2 = 0.074; Fig. 6d) and LF (F(1,113) = 8.296, FDR-corrected p =.017, η2 = 0.068; Fig. 6e) in the Chinese condition compared to the Korean condition (see Table 6; Fig. 5). Marginally significant main effects of the condition were also found in the BC and Th metrics.
Exploratory Results in the Delta and Theta Bands
We conducted exploratory analyses of delta and theta band activity during the resting-state (eyes-open and eyes-closed) conditions. No significant main effects of group were observed for theta or delta spectral power or MST metrics in either condition. Full statistical details are presented in Supplementary Material 4.
Additional exploratory analyses were performed for the one-back task. Repeated-measures ANOVA revealed a significant main effect of condition in the delta band over the central (F(1,113) = 19.187, FDR-corrected p <.001, η² = 0.145), parietal (F(1,113) = 7.130, FDR-corrected p =.022, η² = 0.059), and occipital (F(1,113) = 6.270, FDR-corrected p =.023, η² = 0.053) scalp areas. In the theta band, significant condition effects were found in the central (F(1,113) = 9.697, FDR-corrected p =.002, η² = 0.145), frontal (F(1,113) = 10.900, FDR-corrected p =.002, η² = 0.044), temporal (F(1,113) = 38.428, FDR-corrected p <.001, η² = 0.254), parietal (F(1,113) = 83.320, FDR-corrected p <.001, η² = 0.424), and occipital scalp areas (F(1,113) = 65.822, p <.001, η² = 0.368), indicating higher spectral power in the Chinese condition compared to the Korean condition. No significant main effects of group or interactions were found in the spectral power results. For MST metrics, a significant main effect of condition was observed in the delta band diameter (F(1,113) = 4.905, p =.029, η² = 0.042) and eccentricity (F(1,113) = 4.127, p =.045, η² = 0.035), with both measures higher in the Chinese condition compared to the Korean condition. However, these effects did not survive FDR correction. No other significant group effects or interactions were observed, and no significant results were found in the theta band MST metrics. Detailed results are provided in Supplementary Material 5.
MST Metrics and Chinese Word Reading Performance
We conducted permutation-based correlation analysis with FDR correction to investigate the relationship between differentiated MST metrics (i.e., beta band MST metrics during eyes-open resting state and alpha band metrics during the one-back task) and Chinese word reading performance within the DD group. For a comprehensive table of all computed correlations, please refer to Supplementary Materials 7 and 8.
The results revealed a positive correlation between the eyes-open beta band Kappa metric and reading fluency (r =.292, p =.030; Fig. 7a). Additionally, a significant positive correlation was observed between the eyes-open beta band Leaf Fraction metric and reading fluency (r =.297, p =.028; Fig. 7b). However, in the one-back task, a negative association was found between the alpha band degree metric and d-prime in the Korean condition (r = −.266, p =.038; Fig. 7c). These findings, however, did not remain significant after FDR correction.
Fig. 7.

Significant correlations between MST metrics and Chinese reading performance in the group with developmental dyslexia. Correlations between MST metrics and Chinese reading performance in the group with developmental dyslexia: (a) eyes-open beta band Kappa metric and reading fluency, (b) eyes-open beta band Leaf Fraction metric and reading fluency, and (c) alpha degree during the one-back task and d-prime in the Korean condition. Abbreviations: LF = Leaf Fraction; MST = Minimum Spanning Tree. *p <.05
Discussion
The current study provides compelling evidence of neural abnormalities in Hong Kong children with DD, highlighting differences in EEG spectral power and brain network topology during both resting and task states. Key findings during the resting state indicate reduced alpha power and a less integrated beta band network. During the one-back task, spectral power analyses revealed increased alpha power and more integrated brain networks in children with DD compared to their TD peers. For familiar stimuli (Chinese characters), significant increases in alpha and beta power were observed across multiple brain areas, alongside less integrated alpha and beta networks compared to the Korean condition. Additionally, an interaction effect in the alpha band degree between group and condition suggests that the two groups exhibit different neural responses when switching between the Chinese and Korean conditions. Exploratory correlation analyses further revealed that differentiated brain metrics have potential behavioural relevance. Collectively, these findings elaborate on the neural underpinnings of DD in Chinese children during both resting and task states, suggesting that alpha band spectral power may be a stable biomarker for Chinese DD. Greater network integration could act as a compensatory mechanism in children with DD, supporting working memory and task performance. When processing unfamiliar stimuli, increased network integration may similarly serve a compensatory role.
Reduced Alpha Power in DD Compared To TD Children Across Resting and Task States
Our analysis revealed reduced alpha power in children with DD during the eyes-closed condition, particularly in the central, frontal, temporal, parietal, and occipital scalp areas. This reduction persisted during task-state EEG, with significantly lower alpha power in the central and frontal scalp areas compared to TD children. These findings align with recent meta-analytical results, which characterize children with DD by a widespread reduction in alpha band activity across multiple scalp areas (Cainelli et al. 2023). Our results complement these findings, showing similar patterns in a Chinese cohort, thus reinforcing the generalizability of these characteristics across diverse populations.
Alpha oscillations play a key role in cognitive control by inhibiting task-irrelevant information and reducing competing neural activity (Klimesch 2012). They are crucial for reactive, modality-specific distracter suppression during working memory tasks (Zhou et al. 2023). Higher frontal alpha power has been linked to better inhibitory control (Klimesch 2012; Van der Lubbe et al. 2019). Thus, the decreased alpha activity in children with DD, particularly in the frontal area, may indicate impaired inhibitory control. In addition, Deiber et al. (2021) demonstrated that reduced alpha power reflects cortical hyperactivation, as it weakens the brain’s ability to suppress irrelevant activity, resulting in excessive and dysregulated neural responses. Similarly, our findings demonstrate that children with DD exhibit reduced alpha power during both resting and task states. This reduction may indicate a state of cortical hyperactivation, potentially contributing to cognitive impairments observed in children with DD.
Moreover, prior research has noted a positive correlation between alpha power and phonological skills in TD children (De Vos et al. 2017), which indicates that impaired synchronization within the alpha band may hinder phonological processing in children with DD. Overall, this evidence suggests that reduced alpha activity is indicative of difficulties with inhibitory control and cortical hyperactivation in children with DD. This highlights the potential of alpha band brain activity as a biomarker for underlying cognitive deficits associated with DD.
Diminished Resting State Beta Band Network Integration in DD
Children with DD showed less integrated network topology in the eyes-open beta band, with higher degree, kappa, LF, and Th compared to TD children. This aligns with previous research on Mandarin-speaking children with DD, who also showed less integrated brain network topology in the beta band (Xue et al. 2020). Additionally, fMRI studies have shown that Chinese individuals with DD exhibit less integrated brain functional organization within structural networks than TD peers (Liu et al. 2015; Zhang et al. 2021).
Research suggests that resting beta activity is linked to the default mode of processing and ongoing cognitive activity beyond task-specific functions (Laufs et al. 2003). Studies have shown that resting-state beta activity can predict motor skill learning (Sugata et al. 2020; Wu et al. 2014). Additionally, resting-state beta plays a significant role in visual perception (Quentin et al. 2016) and can predict performance in visual tasks (Rogala et al. 2020). Impairments in these functions could contribute to difficulties in tasks requiring coordination and visual attention, which are often reported in children with DD. However, De Vos et al. (2017) reported increased beta synchronization during task performance in adolescents with DD, which was interpreted as a compensatory mechanism to enhance phonemic processing. While this task-state over-synchronization may support specific cognitive functions, resting-state beta integration likely reflects broader cognitive capacity. The less integrated beta band topology in children with DD may reflect general impairments in cognitive processing, particularly in motor coordination and visual perception.
Enhanced Alpha Band Integration and Language Effects in One-Back Task for DD
Further, our results suggest that children with DD show decreased eccentricity and diameter during the one-back task in the alpha band. With reduced eccentricity, these children exhibited shorter distances to other nodes, indicating a more central role in the alpha band network (Stam et al. 2014; Van Dellen et al. 2014). The reduced diameter also implies a shorter node path and a more integrated network in children with DD during the one-back task (van Stam and Van Straaten 2012; Tewarie et al. 2015b). While our task-based findings point to increased alpha band integration in DD, Fraga González et al. (2018) reported decreased alpha band network integration in dyslexic adults at rest. This contrast may reflect state-dependent dynamics, where reduced integration at rest relates to lower baseline attention control, whereas increased integration during task performance may reflect compensatory recruitment to meet cognitive demands. Interestingly, previous research using MST-based brain topology on children reported higher network integration in the alpha band with increased cognitive demands during a math task (Vourkas et al. 2014). This finding may suggest a relationship between network integration and cognitive functions such as attentional and working memory processes. Enhanced alpha band integration could imply higher cognitive demand and reduced recruitment of specialized subnetworks in children with DD, potentially representing a compensatory mechanism to support tasks related to working memory. However, increased network integration does not always indicate efficient processing. It may also reflect cognitive overload or reduced network flexibility, where broader engagement compensates for inefficient routing. Similar patterns have been reported in ADHD, with elevated alpha connectivity and limited modulation with task demands (Michelini et al. 2019), and in other clinical groups showing signs of “hub overload” (Fodor et al., 2021). Thus, increased alpha band integration in DD may reflect both compensatory adaptation and underlying inefficiency.
Moreover, our study found a significant interaction in alpha band degree between group and task condition, indicating that language familiarity (Chinese vs. Korean) affects neural processing differently in children with DD compared to TD children. However, the post hoc analysis did not reveal significant differences within the specific conditions. This suggests that while there is an overall interaction effect, the subtleties of how language familiarity influences neural processing might not be strong enough to produce significant differences in specific pairwise comparisons. It could indicate variability within groups or a need for a larger sample size to detect more nuanced effects.
Higher Alpha and Beta Power in One-Back Chinese Compared to Korean Condition
In examining the main effect of condition, we observed increased activity in the temporal, parietal, and occipital scalp areas when children were presented with Chinese stimuli compared to Korean stimuli. High alpha power is often associated with excitatory processes during cognitive events, as noted by Klimesch (2012). This is supported by findings from Bailey et al. (2018), who reported a negative correlation between parietal-temporal alpha amplitude and pseudoword reading speed. Furthermore, Jensen and Mazaheri (2010) have linked alpha power to the functional inhibition of task-irrelevant brain activity, which aids in allocating cognitive resources to task-relevant regions, thereby optimizing performance. These observations suggest that the elevated alpha power in the familiar Chinese condition might indicate more active cognitive processing with familiar Chinese words. This familiarity with Chinese likely enables children to more effectively inhibit irrelevant brain activity, requiring less cognitive engagement and enhancing processing efficiency for familiar linguistic information.
During Chinese trials, increased beta power was observed over the parietal and occipital scalp areas. Beta band oscillations represent the natural rhythms of the parietal cortices (Capilla et al. 2022; Samaha et al. 2017). Specifically, beta activity in the parietal regions is associated with various visual processes, such as visual detection, motion discrimination, and spatial attention (Stengel et al. 2021; Veniero et al. 2021). The increased beta power likely reflects enhanced visual processing when engaging with familiar Chinese words. This activation suggests automatic lexical access within the language network, facilitating faster and more efficient comprehension. By contrast, the processing of unfamiliar Korean stimuli likely requires greater cognitive effort, as automaticity is reduced or absent.
Less Integrated Beta Band Brain Topology in Chinese Compared to Korean Condition
In the beta band, lower kappa and leaf fraction were observed in the Chinese condition compared to the Korean condition. Kappa reflects the distribution of degrees within the network, indicating diversity in node connectivity. Lower kappa values suggest less scale-free network properties, where hub nodes are less effective in facilitating efficient information flow (C. van Stam and Van Straaten 2012). Similarly, a decrease in leaf fraction indicates fewer connected hub nodes and longer path lengths, reflecting reduced efficiency in information transfer (Tewarie et al. 2015a). These findings suggest that both children with DD and TD exhibited a less integrated network topology during Chinese compared to Korean stimuli.
This indicates that processing familiar Chinese words requires lower network integration, reflecting a less demanding cognitive load compared to the unfamiliar Korean trials. The less demanding nature of the Chinese trials likely results in a less integrated brain network, as they require fewer cognitive resources for processing compared to the unfamiliar Korean stimuli.
Correlation Between Differentiated MST Metrics and Chinese Word Reading
Lastly, we investigated the correlations between distinct resting and task-state MST metrics and Chinese word reading performance within the DD group. We found that the eyes-open resting-state beta band kappa and leaf fraction were positively associated with reading fluency. Since increased kappa and leaf fraction indicate a more integrated brain network (Zhang et al. 2022), our results suggest that a more integrated beta band topology in the resting state is linked to better reading performance. This finding aligns with previous studies showing that resting-state network modularity is related to Chinese word reading in children with typical reading development (Lui et al. 2021). The direction of the within-group correlations is consistent with the between-group comparisons, reinforcing that a more integrated resting-state brain topology benefits reading performance. However, as these correlations did not survive FDR correction, they remain exploratory.
We also observed a negative correlation between the alpha band degree metric and d-prime in the Korean condition. Increased tree degree reflects greater connectivity within the network, indicating higher network integration (Bullmore and Sporns 2009). The negative correlation suggests that higher alpha network integration may be needed to support the cognitive demands of processing unfamiliar stimuli. This supports the idea that over-integration of the alpha network could increase cognitive load, potentially reducing task efficiency.
Limitations
Our study offers valuable insights into the abnormalities in resting-state alpha power and beta band network integration observed in children with DD, highlighting the influence of language familiarity on neural processing. However, several limitations should be addressed in future research. Although we used the PLI for functional connectivity analysis, which is robust against volume conduction effects (Stam et al. 2007), the analysis was performed at the sensor level, limiting the ability to detect cortical source-specific abnormalities. Future studies could enhance this by employing EEG source localization, allowing for more precise interpretations and cross-validation with other neuroimaging techniques, such as fMRI and MEG. Additionally, we did not directly compare state‑dependent spectral power and brain topology alterations between resting and task conditions in DD versus TD children. Future studies that explicitly test for such state‑by‑group interactions will help uncover finer‑grained neural dynamics underlying DD. Finally, because Chinese is a logographic (non-alphabetic) writing system, the extent to which these spectral and topological abnormalities generalize to alphabetic orthographies remains unclear. Comparative studies with larger, crosslinguistic cohorts that integrate both the resting-state and task-related paradigms are essential to establish the universality of these neural markers.
Conclusion
This study highlights key neural abnormalities in Hong Kong Chinese children with DD, with a focus on spectral power and brain network topology. Children with DD showed reduced alpha power in both resting and task states—potentially indicating deficits in inhibitory control and information processing—and decreased resting-state beta band network integration, which could reflect impairments in broader cognitive processing. Conversely, the observed increase in alpha band network integration during task performance may reflect compensatory engagement of working memory networks, though this interpretation remains tentative. Language familiarity significantly modulated neural responses: higher alpha and beta power during familiar Chinese stimuli indicated more efficient and automatic processing, while decreased beta band network integration suggested reduced cognitive effort required to process familiar tasks. Additionally, the association between a more integrated resting-state beta band network and better Chinese reading performance underscores the role of brain network topology in influencing reading outcomes in children with DD.
These findings offer important insights into the neural basis of DD and suggest that spectral and topological abnormalities—particularly in the alpha band—may serve as useful neural markers for reading difficulties. This raises the potential for developing EEG-based screening tools using alpha band features. Targeted interventions, such as neurofeedback training aimed at modulating alpha and beta activity, may help improve reading and cognitive performance. Prior studies have shown that neurofeedback can enhance reading accuracy, phonological awareness, and spelling in children with dyslexia (Nazari et al. 2012; Breteler et al. 2010), offering a promising complement to traditional literacy interventions by addressing underlying neural inefficiencies. Moreover, the differential neural responses to familiar versus unfamiliar stimuli emphasize the need for language-specific intervention strategies, contributing to a better understanding of the interplay between brain function and linguistic context.
Electronic Supplementary Material
Below is the link to the electronic supplementary material.
Acknowledgements
This research was supported by the Health and Medical Research Fund (HMRF) of the Food and Health Bureau, Hong Kong (04152496) and the General Research Fund (GRF) of the Research Grants Council of Hong Kong (RGC-GRF 14600919).
Author Contributions
Yaqi Yang wrote the main manuscript text, performed data analysis, and prepared figures and tables. Shuting Huo and Jie Wang assisted with data collection. Urs Maurer contributed to funding acquisition and conceptualization. All authors reviewed the manuscript.
Data Availability
The datasets generated and analyzed during the current study are available from the corresponding author upon reasonable request.
Declarations
Competing interests
The authors declare no competing interests.
Footnotes
Publisher’s Note
Springer Nature remains neutral with regard to jurisdictional claims in published maps and institutional affiliations.
References
- Angelakis E, Lubar JF, Stathopoulou S, Kounios J (2004) Peak alpha frequency: an electroencephalographic measure of cognitive preparedness. Clin Neurophysiol 115(4):887–897 [DOI] [PubMed] [Google Scholar]
- Arns M, Peters S, Breteler R, Verhoeven L (2007) Different brain activation patterns in dyslexic children: evidence from EEG power and coherence patterns for the double-deficit theory of dyslexia. J Integr Neurosci 6(01):175–190 [DOI] [PubMed]
- B Kruskal J (1956) On the shortest spanning subtree of a graph and the traveling salesman problem. Proc Am Math Soc 7(1):48–50 [Google Scholar]
- Babiloni C, Stella G, Buffo P, Vecchio F, Onorati P, Muratori C, Miano S, Gheller F, Antonaci L, Albertini G& others. (2012) Cortical sources of resting state EEG rhythms are abnormal in dyslexic children. Clin Neurophysiol 123(12):2384–2391 [DOI] [PubMed] [Google Scholar]
- Bailey SK, Aboud KS, Nguyen TQ, Cutting LE (2018) Applying a network framework to the neurobiology of reading and dyslexia. J Neurodevelopmental Disorders 10:1–9 [DOI] [PMC free article] [PubMed] [Google Scholar]
- Basharpoor S, Seif E, Narimani M (2022) Systematic review of studies related to executive functions in children with dyslexia in the iranian studies (2001–2018). J Learn Disabil 11(2):33–46 [Google Scholar]
- Benjamini Y, Hochberg Y (1995) Controlling the false discovery rate: a practical and powerful approach to multiple testing. J R Stat Soc Ser B Stat Method 57(1):289–300
- Boros M, Anton J-L, Pech-Georgel C, Grainger J, Szwed M, Ziegler JC (2016) Orthographic processing deficits in developmental dyslexia: beyond the ventral visual stream. NeuroImage 128:316–327 [DOI] [PubMed] [Google Scholar]
- Bosch-Bayard J, Girini K, Biscay RJ, Valdes-Sosa P, Evans AC, Chiarenza GA (2020) Resting EEG effective connectivity at the sources in developmental dysphonetic dyslexia. Differences with non-specific reading delay. Int J Psychophysiol 153:135–147 [DOI] [PubMed] [Google Scholar]
- Brem S, Maurer U, Kronbichler M, Schurz M, Richlan F, Blau V, Reithler J, van der Mark S, Schulz E, Bucher K, Moll K, Landerl K, Martin E, Goebel R, Schulte-Körne G, Blomert L, Wimmer H, Brandeis D (2020) Visual word form processing deficits driven by severity of reading impairments in children with developmental dyslexia. Sci Rep 10(1):18728. 10.1038/s41598-020-75111-8 [DOI] [PMC free article] [PubMed] [Google Scholar]
- Breteler MH, Arns M, Peters S, Giepmans I, Verhoeven L (2010) Improvements in spelling after QEEG-based neurofeedback in dyslexia: A randomized controlled treatment study. Appl Psychophysiol Biofeedback 35:5–11 [DOI] [PMC free article] [PubMed] [Google Scholar]
- Brigham E (1988) The fast fourier transform and its applications. Prentice Hall
- Bullmore E, Sporns O (2009) Complex brain networks: graph theoretical analysis of structural and functional systems. Nat Rev Neurosci 10(3):186–198 [DOI] [PubMed] [Google Scholar]
- Cainelli E, Vedovelli L, Carretti B, Bisiacchi P (2023) EEG correlates of developmental dyslexia: A systematic review. Ann Dyslexia 73(2):184–213 [DOI] [PMC free article] [PubMed] [Google Scholar]
- Capilla A, Arana L, García-Huéscar M, Melcón M, Gross J, Campo P (2022) The natural frequencies of the resting human brain: an MEG-based atlas. NeuroImage 258:119373 [DOI] [PubMed] [Google Scholar]
- Cattinelli I, Borghese NA, Gallucci M, Paulesu E (2013) Reading the reading brain: A new meta-analysis of functional imaging data on reading. J Neurolinguistics 26(1):214–238 [Google Scholar]
- Cao F, Yan X, Spray GJ, Liu Y, Deng Y (2018) Brain mechanisms underlying visuo-orthographic deficits in children with developmental dyslexia. Front Hum Neurosci 12:490 [DOI] [PMC free article] [PubMed]
- Chikhi S, Matton N, Blanchet S (2022) EEG power spectral measures of cognitive workload: A meta-analysis. Psychophysiology 59(6):e14009. 10.1111/psyp.14009 [DOI] [PubMed] [Google Scholar]
- De Vos A, Vanvooren S, Vanderauwera J, Ghesquière P, Wouters J (2017) Atypical neural synchronization to speech envelope modulations in dyslexia. Brain Lang 164:106–117 [DOI] [PubMed] [Google Scholar]
- Deiber M-P, Ammann C, Hasler R, Colin J, Perroud N, Ros T (2021) Electrophysiological correlates of improved executive function following EEG neurofeedback in adult attention deficit hyperactivity disorder. Clin Neurophysiol 132(8):1937–1946 [DOI] [PubMed] [Google Scholar]
- Eissa M (2010) Behavioral and emotional problems associated with dyslexia in adolescence. 17(1)
- Eroğlu G, Teber S, Ertürk K, Kırmızı M, Ekici B, Arman F, Balcisoy S, Özcan YZ, Çetin M (2022) A mobile app that uses neurofeedback and multi-sensory learning methods improves reading abilities in dyslexia: A pilot study. Appl Neuropsychology: Child 11(3):518–528 [DOI] [PubMed] [Google Scholar]
- Espin L, García I, del Pino Sánchez M, Román F, Salvador A (2019) Effects of psychosocial stress on the hormonal and affective response in children with dyslexia. Trends Neurosci Educ 15:1–9. 10.1016/j.tine.2019.03.001 [DOI] [PubMed] [Google Scholar]
- Finn ES, Shen X, Holahan JM, Scheinost D, Lacadie C, Papademetris X, Shaywitz SE, Shaywitz BA, Constable RT (2014) Disruption of functional networks in dyslexia: A whole-brain, data-driven analysis of connectivity. Biol Psychiatry 76(5):397–404 [DOI] [PMC free article] [PubMed] [Google Scholar]
- Fodor Z, Horváth A, Hidasi Z, Gouw AA, Stam CJ, Csukly G (2021) EEG alpha and beta band functional connectivity and network structure mark hub overload in mild cognitive impairment during memory maintenance. Front Aging neurosci 13:680200 [DOI] [PMC free article] [PubMed]
- Fostick L, Revah H (2018) Dyslexia as a multi-deficit disorder: working memory and auditory temporal processing. Acta Psychol 183:19–28 [DOI] [PubMed] [Google Scholar]
- Fraga González G, Smit DJ, Van der Molen MJ, Tijms J, Stam CJ, De Geus EJ, Van der Molen MW (2018) EEG resting state functional connectivity in adult dyslexics using phase lag index and graph analysis. Front Hum Neurosci 12:341 [DOI] [PMC free article] [PubMed] [Google Scholar]
- Gallego-Molina NJ, Ortiz A, Martínez-Murcia FJ, Formoso MA, Giménez A (2022) Complex network modeling of EEG band coupling in dyslexia: an exploratory analysis of auditory processing and diagnosis. Knowl Based Syst 240:108098 [Google Scholar]
- González GF, Van der Molen M, Žarić G, Bonte M, Tijms J, Blomert L, Stam C, Van der Molen M (2016) Graph analysis of EEG resting state functional networks in dyslexic readers. Clin Neurophysiol 127(9):3165–3175 [DOI] [PubMed] [Google Scholar]
- Haatveit BC, Sundet K, Hugdahl K, Ueland T, Melle I, Andreassen OA (2010) The validity of d prime as a working memory index: results from the bergen n-back task. J Clin Exp Neuropsychol 32(8):871–880 [DOI] [PubMed] [Google Scholar]
- Habib M (2000) The neurological basis of developmental dyslexia: an overview and working hypothesis. Brain 123(12):2373–2399 [DOI] [PubMed] [Google Scholar]
- Ho CS-H, Chan DW, Chung KK, Lee S-H, Tsang S-M (2007) In search of subtypes of chinese developmental dyslexia. J Exp Child Psychol 97(1):61–83 [DOI] [PubMed] [Google Scholar]
- Hoeft F, Meyler A, Hernandez A, Juel C, Taylor-Hill H, Martindale JL, McMillon G, Kolchugina G, Black JM, Faizi A, Deutsch GK, Siok WT, Reiss AL, Whitfield-Gabrieli S, Gabrieli JDE (2007) Functional and morphometric brain dissociation between dyslexia and reading ability. Proc Natl Acad Sci 104(10):4234–4239. 10.1073/pnas.0609399104 [DOI] [PMC free article] [PubMed] [Google Scholar]
- Jensen O, Mazaheri A (2010) Shaping functional architecture by oscillatory alpha activity: gating by inhibition. Front Hum Neurosci 4:186 [DOI] [PMC free article] [PubMed] [Google Scholar]
- Klimesch W (2012) Alpha-band oscillations, attention, and controlled access to stored information. Trends Cogn Sci 16(12):606–617 [DOI] [PMC free article] [PubMed] [Google Scholar]
- Laufs H, Krakow K, Sterzer P, Eger E, Beyerle A, Salek-Haddadi A, Kleinschmidt A (2003) Electroencephalographic signatures of attentional and cognitive default modes in spontaneous brain activity fluctuations at rest. Proc Natl Acad Sci 100(19):11053–11058 [DOI] [PMC free article] [PubMed] [Google Scholar]
- Leung M, Lee A (2002) The hong kong corpus of primary school Chinese. 9th Meeting of the International Clinical Phonetics and Linguistics Association, Hong Kong
- Liu K, Shi L, Chen F, Waye MM, Lim CK, Cheng P, Luk SS, Mok VC, Chu WC, Wang D (2015) Altered topological organization of brain structural network in chinese children with developmental dyslexia. Neurosci Lett 589:169–175 [DOI] [PubMed] [Google Scholar]
- Lui KFH, Lo JCM, Ho CS-H, McBride C, Maurer U (2021) Resting state EEG network modularity predicts literacy skills in L1 chinese but not in L2 english. Brain Lang 220:104984 [DOI] [PubMed] [Google Scholar]
- Maurer U, Rometsch S, Song B, Zhao J, Zhao P, Li S (2024) Repetition suppression for familiar visual words through acceleration of early processing. Brain Topogr 37(4):608–620 [DOI] [PubMed] [Google Scholar]
- McBride-Chang C, Lam F, Lam C, Chan B, Fong CY-C, Wong TT-Y, Wong SW-L (2011) Early predictors of dyslexia in chinese children: familial history of dyslexia, language delay, and cognitive profiles. J Child Psychol Psychiatry 52(2):204–211 [DOI] [PubMed] [Google Scholar]
- Melby-Lervåg M, Lervåg A (2012) Oral language skills moderate nonword repetition skills in children with dyslexia: A meta-analysis of the role of nonword repetition skills in dyslexia. Sci Stud Read 16(1):1–34 [Google Scholar]
- Michelini G, Jurgiel J, Bakolis I, Cheung CH, Asherson P, Loo SK, Mohammad-Rezazadeh I (2019) Atypical functional connectivity in adolescents and adults with persistent and remitted ADHD during a cognitive control task. Translational Psychiatry 9(1):137 [DOI] [PMC free article] [PubMed] [Google Scholar]
- Nazari MA, Mosanezhad E, Hashemi T, Jahan A (2012) The effectiveness of neurofeedback training on EEG coherence and neuropsychological functions in children with reading disability. Clin EEG Neurosci 43(4):315–322 [DOI] [PubMed] [Google Scholar]
- Niso G, Bruña R, Pereda E, Gutiérrez R, Bajo R, Maestú F, Del-Pozo F (2013) HERMES: towards an integrated toolbox to characterize functional and effective brain connectivity. Neuroinformatics 11:405–434 [DOI] [PubMed]
- Papagiannopoulou EA, Lagopoulos J (2016) Resting state EEG hemispheric power asymmetry in children with dyslexia. Front Pead 4:11 [DOI] [PMC free article] [PubMed] [Google Scholar]
- Pennington BF, Bishop DVM (2009) Relations among speech, language, and reading disorders. Ann Rev Psychol 60(1):283–306. 10.1146/annurev.psych.60.110707.163548 [DOI] [PubMed] [Google Scholar]
- Qi T, Gu B, Ding G, Gong G, Lu C, Peng D, Malins JG, Liu L (2016) More bilateral, more anterior: alterations of brain organization in the large-scale structural network in chinese dyslexia. NeuroImage 124:63–74 [DOI] [PubMed] [Google Scholar]
- Quentin R, Elkin Frankston S, Vernet M, Toba MN, Bartolomeo P, Chanes L, Valero-Cabré A (2016) Visual contrast sensitivity improvement by right frontal high-beta activity is mediated by contrast gain mechanisms and influenced by fronto-parietal white matter microstructure. Cereb Cortex 26(6):2381–2390 [DOI] [PMC free article] [PubMed] [Google Scholar]
- Ramus F, Rosen S, Dakin SC, Day BL, Castellote JM, White S, Frith U (2003) Theories of developmental dyslexia: insights from a multiple case study of dyslexic adults. Brain 126(4):841–865 [DOI] [PubMed] [Google Scholar]
- Richlan F, Kronbichler M, Wimmer H (2011) Meta-analyzing brain dysfunctions in dyslexic children and adults. NeuroImage 56(3):1735–1742. 10.1016/j.neuroimage.2011.02.040 [DOI] [PubMed] [Google Scholar]
- Rogala J, Kublik E, Krauz R, Wróbel A (2020) Resting-state EEG activity predicts frontoparietal network reconfiguration and improved attentional performance. Sci Rep 10(1):5064 [DOI] [PMC free article] [PubMed] [Google Scholar]
- Samaha J, Iemi L, Postle BR (2017) Prestimulus alpha-band power biases visual discrimination confidence, but not accuracy. Conscious Cogn 54:47–55 [DOI] [PMC free article] [PubMed] [Google Scholar]
- Schurz M, Wimmer H, Richlan F, Ludersdorfer P, Klackl J, Kronbichler M (2015) Resting-state and task-based functional brain connectivity in developmental dyslexia. Cereb Cortex 25(10):3502–3514 [DOI] [PMC free article] [PubMed]
- Shaywitz SE, Shaywitz BA (2005) Dyslexia (specific reading disability). Biol Psychiatry 57(11):1301–1309. 10.1016/j.biopsych.2005.01.043 [DOI] [PubMed] [Google Scholar]
- Shu H, McBride-Chang C, Wu S, Liu H (2006) Understanding chinese developmental dyslexia: morphological awareness as a core cognitive construct. J Educ Psychol 98(1):122 [Google Scholar]
- Siu T-SC, McBride C, Tse C-S, Tong X, Maurer U (2018) Evaluating the effects of metalinguistic and working memory training on reading fluency in chinese and english: A randomized controlled trial. Front Psychol 9:2510 [DOI] [PMC free article] [PubMed] [Google Scholar]
- Spironelli C, Penolazzi B, Angrilli A (2008) Dysfunctional hemispheric asymmetry of theta and beta EEG activity during linguistic tasks in developmental dyslexia. Biol Psychol 77(2):123–131 [DOI] [PubMed] [Google Scholar]
- Stam CJ, Nolte G, Daffertshofer A (2007) Phase lag index: assessment of functional connectivity from multi channel EEG and MEG with diminished bias from common sources. Hum Brain Mapp 28(11):1178–1193 [DOI] [PMC free article] [PubMed] [Google Scholar]
- Stam C, Tewarie P, Van Dellen E, Van Straaten E, Hillebrand A, Van Mieghem P (2014) The trees and the forest: characterization of complex brain networks with minimum spanning trees. Int J Psychophysiol 92(3):129–138 [DOI] [PubMed] [Google Scholar]
- Stengel C, Vernet M, Amengual JL, Valero-Cabré A (2021) Causal modulation of right hemisphere fronto-parietal phase synchrony with transcranial magnetic stimulation during a conscious visual detection task. Sci Rep 11(1):3807 [DOI] [PMC free article] [PubMed] [Google Scholar]
- Sugata H, Yagi K, Yazawa S, Nagase Y, Tsuruta K, Ikeda T, Nojima I, Hara M, Matsushita K, Kawakami K (2020) & others. Role of beta-band resting-state functional connectivity as a predictor of motor learning ability. NeuroImage, 210, 116562 [DOI] [PubMed]
- Tewarie P, van Dellen E, Hillebrand A, Stam CJ (2015a) The minimum spanning tree: an unbiased method for brain network analysis. NeuroImage 104:177–188 [DOI] [PubMed] [Google Scholar]
- Tewarie P, van Dellen E, Hillebrand A, Stam CJ (2015b) The minimum spanning tree: an unbiased method for brain network analysis. NeuroImage 104:177–188 [DOI] [PubMed] [Google Scholar]
- Van Dellen E, Douw L, Hillebrand A, de Witt Hamer PC, Baayen JC, Heimans JJ, Reijneveld JC, Stam CJ (2014) Epilepsy surgery outcome and functional network alterations in longitudinal MEG: A minimum spanning tree analysis. NeuroImage 86:354–363 [DOI] [PubMed] [Google Scholar]
- Van der Lubbe RH, de Kleine E, Rataj K (2019) Dyslexic individuals orient but do not sustain visual attention: electrophysiological support from the lower and upper alpha bands. Neuropsychologia 125:30–41 [DOI] [PubMed] [Google Scholar]
- Van der Mark S, Bucher K, Maurer U, Schulz E, Brem S, Buckelmüller J,... Brandeis D (2009) Children with dyslexia lack multiple specializations along the visual word-form (VWF) system. Neuroimage 47(4):1940–1949 [DOI] [PubMed]
- van Stam C, Van Straaten E (2012) The organization of physiological brain networks. Clin Neurophysiol 123(6):1067–1087 [DOI] [PubMed] [Google Scholar]
- Veniero D, Gross J, Morand S, Duecker F, Sack AT, Thut G (2021) Top-down control of visual cortex by the frontal eye fields through oscillatory realignment. Nat Commun 12(1):1757 [DOI] [PMC free article] [PubMed] [Google Scholar]
- Vourkas M, Karakonstantaki E, Simos PG, Tsirka V, Antonakakis M, Vamvoukas M, Stam C, Dimitriadis S, Micheloyannis S (2014) Simple and difficult mathematics in children: A minimum spanning tree EEG network analysis. Neurosci Lett 576:28–33 [DOI] [PubMed] [Google Scholar]
- Wang F, Maurer U (2020) Interaction of top-down category-level expectation and bottom-up sensory input in early stages of visual-orthographic processing. Neuropsychologia 137:107299 [DOI] [PubMed] [Google Scholar]
- Wang J, Wu KC, Mo J, Wong WL, Siu TSC, McBride C, Chung KKH, Wong PC, Maurer U (2021) Remediation of a phonological representation deficit in chinese children with dyslexia: A comparison between metalinguistic training and working memory training. Dev Sci, 24(3), e13065 [DOI] [PubMed]
- Wang J, Huo S, Wu KC, Mo J, Wong WL, Maurer U (2022) Behavioral and neurophysiological aspects of working memory impairment in children with dyslexia. Sci Rep 12(1):12571 [DOI] [PMC free article] [PubMed] [Google Scholar]
- Wu J, Srinivasan R, Kaur A, Cramer SC (2014) Resting-state cortical connectivity predicts motor skill acquisition. NeuroImage 91:84–90 [DOI] [PMC free article] [PubMed] [Google Scholar]
- Xue H, Wang Z, Tan Y, Yang H, Fu W, Xue L, Zhao J (2020) Resting-state EEG reveals global network deficiency in dyslexic children. Neuropsychologia 138:107343 [DOI] [PubMed] [Google Scholar]
- Yan M, Pan J, Laubrock J, Kliegl R, Shu H (2013) Parafoveal processing efficiency in rapid automatized naming: A comparison between chinese normal and dyslexic children. J Exp Child Psychol 115(3):579–589 [DOI] [PMC free article] [PubMed] [Google Scholar]
- Yang J, Tan LH (2020) Whole-brain functional networks for phonological and orthographic processing in chinese good and poor readers. Front Psychol 10:2945 [DOI] [PMC free article] [PubMed] [Google Scholar]
- Žarić G, Correia JM, González GF, Tijms J, van der Molen MW, Blomert L, Bonte M (2017) Altered patterns of directed connectivity within the reading network of dyslexic children and their relation to reading dysfluency. Dev Cogn Neurosci 23:1–13 [DOI] [PMC free article] [PubMed] [Google Scholar]
- Zhang J, Liu L, Li H, Feng X, Zhang M, Liu L, Meng X, Ding G (2021) Large-scale network topology reveals brain functional abnormality in chinese dyslexic children. Neuropsychologia 157:107886 [DOI] [PubMed] [Google Scholar]
- Zhang M, Riecke L, Fraga-González G, Bonte M (2022) Altered brain network topology during speech tracking in developmental dyslexia. NeuroImage 254:119142 [DOI] [PubMed] [Google Scholar]
- Zhou YJ, Ramchandran A, Haegens S (2023) Alpha oscillations protect working memory against distracters in a modality-specific way. NeuroImage 278:120290. 10.1016/j.neuroimage.2023.120290 [DOI] [PubMed] [Google Scholar]
Associated Data
This section collects any data citations, data availability statements, or supplementary materials included in this article.
Supplementary Materials
Data Availability Statement
The datasets generated and analyzed during the current study are available from the corresponding author upon reasonable request.