Abstract
By means of differential RNA display, we have isolated a cDNA corresponding to transcripts that are down-regulated upon differentiation of the goblet cell-like HT-29-M6 human colon carcinoma cell line. These transcripts encode proteins originally identified as CROC-1 on the basis of their capacity to activate transcription of c-fos. We show that these proteins are similar in sequence, and in predicted secondary and tertiary structure, to the ubiquitin-conjugating enzymes, also known as E2. Despite the similarities, these proteins lack a critical cysteine residue essential for the catalytic activity of E2 enzymes and, in vitro, they do not conjugate or transfer ubiquitin to protein substrates. These proteins constitute a distinct subfamily within the E2 protein family and are highly conserved in phylogeny from yeasts to mammals. Therefore, we have designated them UEV (ubiquitin-conjugating E2 enzyme variant) proteins, defined as proteins similar in sequence and structure to the E2 ubiquitin-conjugating enzymes but lacking their enzymatic activity (HW/GDB-approved gene symbol, UBE2V). At least two human genes code for UEV proteins, and one of them, located on chromosome 20q13.2, is expressed as at least four isoforms, generated by alternative splicing. All human cell types analyzed expressed at least one of these isoforms. Constitutive expression of exogenous human UEV in HT-29-M6 cells inhibited their capacity to differentiate upon confluence and caused both the entry of a larger proportion of cells in the division cycle and an accumulation in G2-M. This was accompanied with a profound inhibition of the mitotic kinase, cdk1. These results suggest that UEV proteins are involved in the control of differentiation and could exert their effects by altering cell cycle distribution.
The intestinal epithelium is comprised of cells with different mature phenotypes that are believed to derive from common precursor cells resident in special anatomic compartments, called the crypts of Lieberkühn. Through asymmetric divisions and migration along the crypt, such precursor cells undergo phenotypic conversion into mucosecretory, absorptive, enteroendocrine or Paneth cells (19), with each expressing a distinct set of molecules characteristic of their specialized mature functions. The life cycle of mature cells terminates by apoptosis, followed by shedding from the tip of the villus to the intestinal lumen (19).
A number of cellular models, such as the human colorectal cancer-derived cell lines HT-29-M6, HS174T, and Caco-2, have allowed the analysis of the molecular mechanisms that control the differentiated phenotypes of human intestinal epithelial cells (24, 36, 44, 47, 73). Several of these models appear to recapitulate some of the differentiation processes that accompany developmentally regulated events, such as the establishment of cephalocaudal and crypt-villus axes (59, 62). Using either in vitro or in vivo models, systematic approaches have led to the identification of differentially expressed genes and proteins involved in the control of intestinal epithelial cell differentiation (4, 60, 64, 68).
HT-29-M6 intestinal epithelial cells are derivatives of HT-29 cells which have been adapted to grow in the presence of 10−6 M methotrexate and subsequently subcultured in the absence of this drug (32). HT-29-M6 cells differentiate into goblet-like cells upon confluence, with the expression of the apomucin MUC5AC and brush border enzymes and the development of transepithelial resistance (28, 32, 33). In this study, we report the isolation of a cDNA corresponding to a transcript that is down-regulated upon differentiation of HT-29-M6 cells. This cDNA, previously called CROC-1, was originally isolated on the basis of its ability to cause transcriptional activation of the human c-fos promoter (54). We show that this and related proteins are similar in sequence and in structure to the ubiquitin-conjugating enzymes, also known as E2 enzymes (7, 25). Despite their similarity to the E2 enzymes, the proteins described here lack a critical cysteine residue essential for the conjugation and transfer of ubiquitin to protein substrates. They are highly conserved in evolution, with homologs from yeasts to mammals, and constitute a novel family of proteins structurally related to, but distinct from, E2 enzymes. Based on these considerations, we have designated them ubiquitin-conjugating E2 enzyme variant (UEV) proteins. The gene for HsUEV-1/CROC-1 maps to chromosome 20q13.2 and is expressed as at least four different splice variants. Constitutive expression of exogenous UEV-1 proteins in HT-29-M6 cells inhibits their capacity to differentiate upon confluence and induces changes in their cell cycle behavior, associated with an inhibition of the mitotic kinase cdk1.
MATERIALS AND METHODS
Cell culture.
Cell lines HT-29 and HT-29-M6 were kindly provided by A. Zweibaum (INSERM U178, Villejuif, France). Cell lines SK-PC-1 and SK-PC-3 were established at the IMIM (69). All other cell lines were obtained from the American Type Culture Collection (Rockville, Md.). Cells were cultured in Dulbecco’s modified Eagle’s medium (GIBCO, Grand Island, N.Y.) supplemented with 10% fetal bovine serum in an atmosphere of 5% CO2.
RNA-based arbitrarily primed PCR.
Differential RNA display was performed as described previously (46, 72), with minor modifications. Briefly, reverse transcription was carried out in a 50-μl reaction mixture containing 0.1 μg of poly(A)-enriched RNA in 50 mM Tris-HCl (pH 8.0), 200 μM deoxynucleoside triphosphates (dNTPs), 1 μM primer, 40 U of RNasin (Promega, Madison, Wis.), and 100 U of Moloney murine leukemia virus reverse transcriptase (Promega) at 37°C for 1 h. Heat-inactivated aliquots of this reaction mixture were used as templates for a 25-μl PCR performed with 50 mM Tris HCl (pH 8.0), 50 mM KCl, 1.5 mM MgCl2, 200 μM dNTPs, 1 μM primer, 1 μCi of [33P]dATP (3,000 Ci/mmol; Amersham), and 1 U of Taq polymerase (Perkin-Elmer) with the following program: 1 cycle of 94°C for 5 min, 94°C for 5 min, 40°C for 5 min, and 72°C for 5 min; 40 cycles of 94°C for 1 min, 60°C for 1 min, and 72°C for 2 min; and a final extension at 72°C for 7 min. The radioactive PCR products were electrophoresed on a 20-cm 6% acrylamide–8 M urea gel in Tris-borate-EDTA at 35 W for 3 h; the gel was dried and exposed to film. Selected bands were identified on the autoradiograms, and the corresponding slices on the dried gels (approximately 0.2 mm-wide) were excised with a scalpel. DNA was eluted by incubation in 50 μl of 10 mM Tris HCl (pH 8.0)–0.1 mM EDTA buffer at 60°C for 1 h and used for subsequent PCRs in the same reaction conditions as above, at 94°C for 5 min followed by 30 cycles of 94°C for 15 s and 60°C for 15 s.
Northern blotting.
Total RNA (10) was electrophoresed on 1% agarose-formaldehyde gels at a constant intensity of 20 mA and transferred to nylon filters (56). Hybridization of 32P-labeled probes (16) was done in Quickhyb solution (Stratagene, La Jolla, Calif.) at 68°C for 1 h, and filters were washed to a final wash of 0.1× SSC (1× SSC is 0.15 M NaCl plus 0.015 M sodium citrate)–0.1% sodium dodecyl sulfate (SDS) at 55°C. RNA electrophoresis and transfer were monitored and normalized for quality and quantity by ethidium bromide staining of 28S and 18S rRNAs and hybridization of the filters with a probe for glyceraldehyde phosphate dehydrogenase.
Screening of cDNA and P1 artificial chromosome (PAC) libraries.
A HT-29 cDNA library in λZAP (Stratagene) was screened with 32P-labeled probes as described previously (56). Approximately 3 × 10⁵ PFU was screened, and positive plaques were rescreened. Inserts were analyzed by PCR, partial restriction mapping, and cross-hybridization. Selected clones were further characterized by manual sequencing using the cycle-sequencing procedure (Promega).
For screening of human genomic PAC libraries, A 3.3-kb PCR product from cDNA clone MAC4 was 32P labeled by random priming. Prehybridized filters containing human PAC clones (provided by the HGMP Resource Center) were hybridized overnight with the radiolabeled probe and washed to 0.1× SSC at 37°C for 10 min. A second round of screening yielded two positive clones.
Sequence analysis and molecular modeling.
Comparative sequence searches were performed by using the BLAST and FASTA algorithms on the following databases: GenBank, dbEST, TIGR, EMBL, and SwissProt. Sequence alignments were carried out with the CLUSTAL W software (65). Gene prediction using Caenorhabditis elegans unannotated genomic sequence data was done with the aid of the algorithm GeneWise (E. Birney, hhtp://www.sanger.ac.uk/~birney/wise/topwise.html). Secondary structure predictions were obtained by the PHDsec method (53). Dendrograms were generated by using the CLUSTAL W and PHILIP packages. Three-dimensional molecular models for UEV proteins were built by means of the WHAT IF software (70), using as template the crystal structure of Saccharomyces cerevisiae UBC4 (12). Loops were modeled with the Homology module of Biosym/MSI. Energy minimization of the resulting model was carried out with the AMBER forcefield implemented in the Insight II package.
In vitro ubiquitination assay.
A BglI-NotI fragment from HEL-CROC-1 (54) was subcloned into pGEX-3X (Pharmacia, Uppsala, Sweden) for the expression in Escherichia coli of recombinant glutathione S-transferase (GST)–UEV-1. Conjugation assays of 125I-labeled ubiquitin were performed as described previously (18). The reaction mixture contained 2 μg of E1, fraction IIA (a crude fraction that contains all known E3s), and 0.5 μg of E2-F1 or different concentrations of recombinant GST–UEV-1. Reactions were carried out at 37°C for 2 h and resolved by SDS-polyacrylamide gel electrophoresis.
Fluorescence in situ hybridization (FISH) analysis.
cDNA probes were labeled with biotin 16-dUTP (Boehringer Mannheim, Barcelona, Spain) by a standard nick translation reaction, hybridized overnight on human metaphase chromosomes in a humid chamber at 37°C, and washed as described previously (42). The signal was visualized by using avidin-fluorescein isothiocyanate (FITC) (Vector Laboratories, Burlingham, Calif.). Signals were amplified once with biotinylated anti-avidin D. Two independent PAC probes were labeled with biotin 16-dUTP and digoxigenin 11-dUTP, respectively, as described above, and were visualized with avidin-FITC and anti-digoxigenin-tetramethyl rhodamine isothiocyanate (Boehringer Mannheim). All images were analyzed under a fluorescence microscope equipped with the appropriate filter set. Images were captured by using a Cytovision station (Applied Imaging, Sunderland, England).
RT-PCR and genomic PCR.
For reverse transcription-PCR (RT-PCR), DNase-treated total RNA (5 μg) was used in a 50-μl reverse transcription reaction mixture containing 13 mM Tris-HCl (pH 8.0), 3 mM MgCl2, 0.5 mM EDTA, 50 mM potassium acetate, 2 mM spermidine, 4 mM putrescine, 1 mM ATP, 5 mM dithiothreitol, 0.01% Triton X-100, 1 μM primer 1 (complementary to the 3′ untranslated region of HsUEV-1 [Table 1; see Fig. 8C]), and 200 U of Moloney murine leukemia virus reverse transcriptase (Promega) at 37°C for 1 h. Aliquots of this reaction were used in hot-start 25-μl PCR mixtures containing 20 mM Tris-HCl (pH 8.4), 50 mM KCl (1× reaction buffer), 2 mM MgCl2, 200 mM dNTPs, 1 μM each forward and reverse oligonucleotides, and 1 U of Taq polymerase (GIBCO-BRL) with the following program: 94°C for 5 min; 94°C for 30 s, 55°C for 40 s, and 72°C for 1 min (25 or 37 cycles), followed by 72°C for 2 min, in a Perkin-Elmer 2400 or 9600 thermal cycler. Primer pairs (Table 1 and Fig. 8C) were as follows: for HsUEV-1A, primers 2 and 4; for HsUEV-1B, primers 3 and 4. Reaction products were electrophoresed on 2% agarose gels in Tris-acetate-EDTA buffer and transferred to nitrocellulose membranes, which were hybridized at 68°C with 32P end-labeled internal oligonucleotide 7 or 8 (Table 1; see Fig. 8C), washed at high stringency, and autoradiographed.
TABLE 1.
Oligonucleotides used in RT-PCR and genomic PCR
| No. | Sequence |
|---|---|
| 1 | GTCTACAAGACGTATCTA |
| 2 | ATGCCAGGAGAGGTTCAAGCGTCT |
| 3 | ATGGCCTACAAGTTCCGCACC |
| 4 | TTAATTGCTGTAACACTGTCCTT |
| 5 | GGAAAGCATTTTATCTCCACAGC |
| 6 | CTAGGTTCAAGTCTTCCTTCATC |
| 7 | CGACTGTTGGAAGAACT |
| 8 | CTTGGAGGCCCAATTATC |
| 9 | CTCCATTAGAACTATTTACTCC |
| 10 | GGAGTGGTGGACCCAAG |
| 11 | CGGCACGACTTCATCGAGACC |
| 12 | GGGTGAGACGTGGTGGATGCG |
| 13 | GTGGGACTACTGCTAGGTGTGTGGG |
| 14 | CCACGCTCCTCCACTCCCGCCCTT |
| 15 | CCCAGGCTGGTGGAGAGTGAG |
| 16 | GCTGATGACAGCAGAGGGTGGCAGGG |
| 17 | CCTTTATCGAGGGGTGCTG |
| 18 | CCACATTTCAGCATTTAGTGG |
| 19 | GCTACACATGTTAACGTACGCGAA |
| 20 | GTGCTGGCTCTGTGGCA |
| 21 | TGCTAATCCTAATACCT |
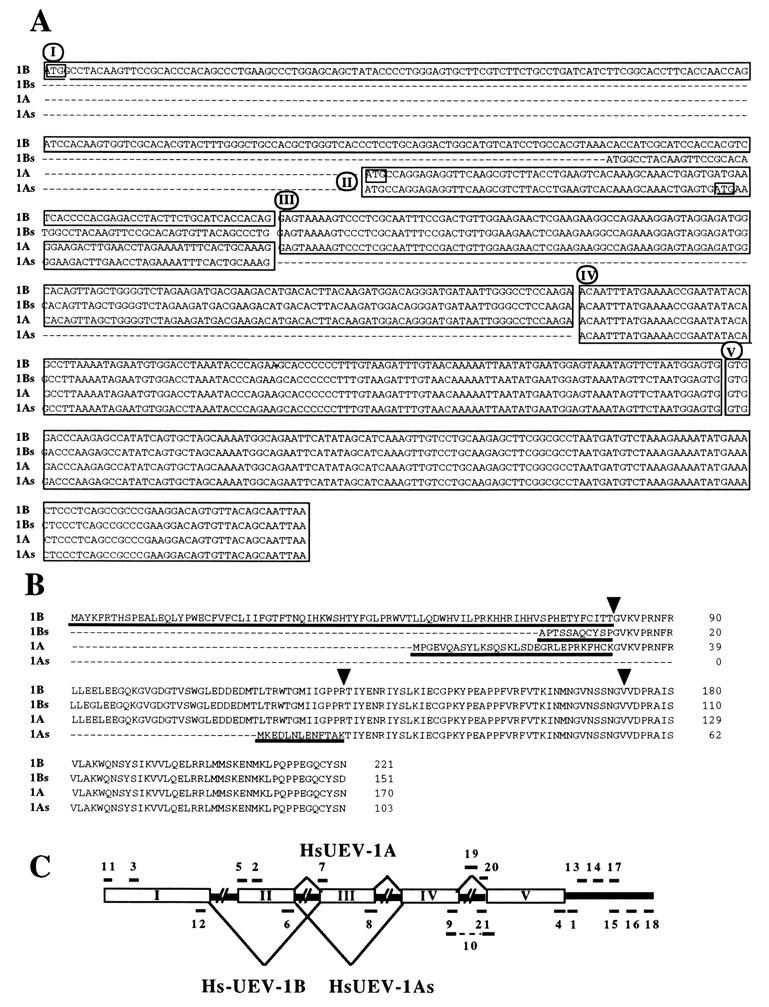
FIG. 8.
Alternative splice variants and genomic arrangement of exons of HsUEV-1. (A) Alignment of sequences of the major RT-PCR products as shown in panels C and D. Sequence blocks I through IV were assigned on the basis of presence or absence in the different forms. Block V is present in clone CRA6, a partially processed transcript (Fig. 2). Boxes show the initial codons for open reading frames in each form. (B) Deduced amino acid sequences for the four forms of HsUEV-1. The amino-terminal residues unique to each form are underlined. Arrowheads correspond to the junctions of the blocks in panel A. (C) Diagram for the arrangement of HsUEV-1 exons in genomic DNA and PAC clone 44c17. PCR analyses were performed with the primers indicated on the diagram and described in Table 1.
For PCR of human genomic and PAC DNAs, 100 or 20 ng of DNA, respectively, was used in hot-start 25-μl reaction mixtures containing 200 mM dNTPs, 2 mM MgCl2, 1× reaction buffer, 1 μM each oligonucleotide, and 1.25 U of Taq polymerase. Primer pairs were initially examined by using the following program: 94°C for 5 min, followed by 30 cycles of denaturation at 94°C (30 s), annealing at 55°C, and extension at 72°C (1 min). A “touch-down” approach was used for primer pairs which did not give an amplification product: denaturation at 95°C for 8 min, followed by 10 cycles of decreasing annealing temperature of denaturation at 94°C (1 min), annealing at 70°C decreasing to 61°C by 1°C per cycle (30 s), extension at 72°C (3 min), followed by a further 25 cycles at 60°C annealing temperature. The sequences of the primers used are given in Table 1, and their positions are shown in HsUEV-1 in Fig. 8C.
Plasmid constructions and transfection.
A BglI-NotI fragment from the construct HEL-CROC-1 (54), which contains the entire Ubc domain-like region and C terminus of UEV-1, was cloned into pcDNA3 (Invitrogen, Carlsbad, Calif.) under the transcriptional control of the cytomegalovirus promoter. Circular plasmid DNA (either control vector or sample construct) was transfected into cells by means of cationic liposomes (Lipofectamine; GIBCO-BRL). Stable transfectants were selected by resistance to G418 (600 μg/ml) for 3 weeks. Selected resistant clones were expanded and maintained in the presence of 300 μg of G418 per ml. Expression of the transfected gene was monitored by RT-PCR with primers specific for the vector and the exogenous gene on DNase-treated RNA samples.
Flow cytometry.
Cells maintained for 4 days in medium without selective drugs were harvested by trypsinization, washed twice with phosphate-buffered saline (PBS), resuspended in 1% bovine serum albumin (BSA)–PBS, and fixed in 70% ethanol at −20°C for at least 1 h. Fixed cells were washed three times with 1% BSA–PBS, incubated with RNase A (1 mg/ml; Promega) at 37°C for 1 h, and stained with propidium iodide (0.1 mg/ml; Sigma). DNA content was determined on an Epics Elite flow cytometer (Coulter, Hialeah, Fla.) as red fluorescence collected through a 675-nm-band filter. Aggregates were excluded by gating single cells by their areas versus peak fluorescence signal. Single-fluorescence histograms were analyzed with the Multicycle software (Phoenix Flow System, San Diego, Calif.).
Cell synchronization.
Cells were arrested at the G1-S boundary by double thymidine block (61). Preconfluent cells were incubated for 16 h with medium containing 2 mM thymidine, followed by a 9-h incubation with fresh medium containing 24 μM deoxycytidine and a second incubation in medium with 2 mM thymidine for 16 h. Arrested cells were allowed to enter the cycle by washing away the blocking medium and incubating the cells with medium containing 24 μM deoxycytidine. At 3-h intervals, cells were washed with PBS and processed for further analysis. Cell cycle arrest and progress was monitored in parallel cultures by incorporation of [3H]thymidine, added at 1 μCi/ml 30 min prior to washing, solubilization in 1% SDS–0.1 M NaOH, and scintillation counting. All time points were done in triplicate.
p34 kinase assay and Western blotting.
Cells were lysed in lysis buffer (20 mM HEPES [pH 7.0], 10 mM β-glycerolphosphate, 5 mM EGTA, 5 mM MgCl2, 50 mM NaF, 1 mM sodium orthovanadate, 2 mM dithiothreitol, 100 μg of leupeptin per ml, 100 μM phenylmethylsulfonate, 0.1% Triton X-100) and centrifuged for 30 min in a microcentrifuge. Supernatants were incubated at 4°C for 30 min with p13suc-1-Sepharose (Oncogene Sciences, Manhasset, N.Y.) (1) prewashed in lysis buffer; after incubation, beads were washed with lysis buffer followed by assay buffer (20 mM HEPES [pH 7.0], 5 mM 2-mercaptoethanol, 10 mM MgCl2). Pelleted beads were incubated in 50 μl of reaction buffer containing PK-A inhibitor (0.2 μg/ml; Sigma, Alcobendas, Madrid, Spain), histone H1 (type III-S; 0.6 mg/ml; Sigma), and 100 mM [γ-32P]ATP (3 dpm/fmol) at 30°C for 10 min; 25 μl of the reaction mixture was spotted on Whatman P81 phosphocellulose paper, washed five times with H2O, dried, and processed for counting in a LKB scintillation counter (14). In parallel, 20 μl of the reaction mixture was run on an SDS–12% polyacrylamide gel, and the gel was autoradiographed. For Western blotting (66), equal amounts of protein were separated by electrophoresis on SDS–10% acrylamide and transferred to nitrocellulose filters. The quality of protein transfer was monitored by staining with Ponceau red, and filters were blocked with 2% BSA in PBS for 30 min prior to incubation with antibodies to either p34cdc2 or cyclin B1 (Transduction Laboratories, Lexington, Ky.) at 1 μg/ml in blocking buffer. After 2 h of incubation, filters were washed and incubated for an additional 1 h with horseradish peroxidase-conjugated goat anti-mouse immunoglobulins. After washing, reactivity was developed with a chemiluminescent substrate (Amersham, Buckinghamshire, England) followed by exposure to film.
Immunocytochemistry.
Cells were grown on glass coverslips, washed with PBS, fixed in methanol-acetic acid (3:1) at room temperature for 5 min, preincubated with blocking buffer (5% horse serum in PBS), and incubated with anti-E-cadherin antibodies (HECD-1; Zymed, San Francisco, Calif.) diluted 1:400 in blocking buffer at room temperature for 1 h. Preparations were washed and incubated with FITC-conjugated goat anti-mouse immunoglobulin for 1 h. Subsequently, they were washed and incubated with Hoechst 33258 (Sigma) at 5 mg/ml in PBS. Fluorescein and Hoechst stainings were visualized under a Zeiss fluorescence microscope with the appropriate filter settings.
Nucleotide sequence accession numbers.
The sequence data for MAC4 and CRA6 have been submitted to GenBank under accession no. U49278 and U94279, respectively. The sequence data for HsUEV-1As and HsUEV-1Bs have been submitted to GenBank under accession no. U97281 and U97280, respectively.
RESULTS
A cDNA recognizing a transcript down-regulated during differentiation of HT-29-M6 intestinal epithelial cells.
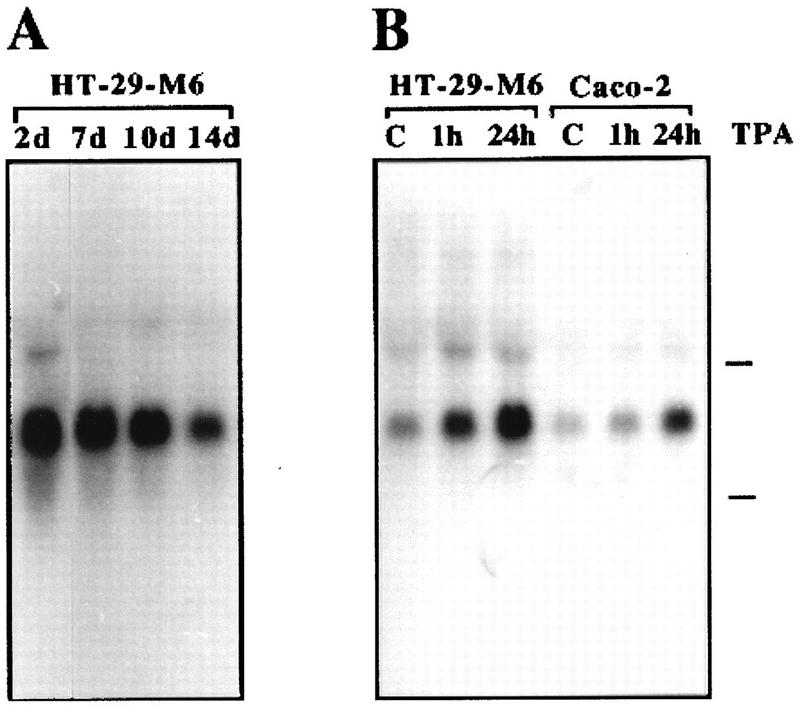
Total RNA was isolated at various time points from HT-29-M6 cells induced to differentiate by confluence and used as a template for cDNA synthesis and subsequent arbitrarily primed PCR under semiquantitative conditions (46, 72). Bands whose intensity decreased with confluence, i.e., whose expression was down-regulated with differentiation, were selected for further analysis. One of these bands, A3.5, recognized a 3.5-kb transcript in HT-29-M6 cells, with levels that decreased progressively with time of confluence of the cultures (Fig. 1A). Exposure of HT-29-M6 cells to phorbol esters inhibits and partially reverses the acquisition of differentiated features (15). Treatment of HT-29-M6 cells with the phorbol ester 12,13-tetradecanoyl phorbol acetate (TPA; 200 nM) for 1 h induced a strong increase in the levels of this transcript, which was maintained even after 24 h of treatment (Fig. 1B). The same response to TPA was seen when a different epithelial cell line, Caco-2, was analyzed (Fig. 1B). Therefore, the transcript recognized by A3.5, which is down-regulated during differentiation of HT-29-M6 cells and up-regulated by exposure to agents that block the differentiation process, could correspond to a gene involved in this process.
FIG. 1.
Probe A3.5 recognizes a transcript down-regulated during differentiation of HT-29-M6 cells. (A) HT-29-M6 cells were preconfluent or cultured to confluence for the indicated periods of time (days [d]); (B) 17-day postconfluent HT-29-M6 cells and 5-day postconfluent Caco-2 cells were treated with 200 nM TPA for the indicated times. Total RNA (12 μg/lane) was isolated and processed and filters hybridized with 32P-labeled band A3.5 as described in Materials and Methods. Marks to the right of the autoradiograms indicate migration of 28S and 18S rRNAs. C, untreated control cells.
A new family of proteins structurally related to the ubiquitin-conjugating enzymes.
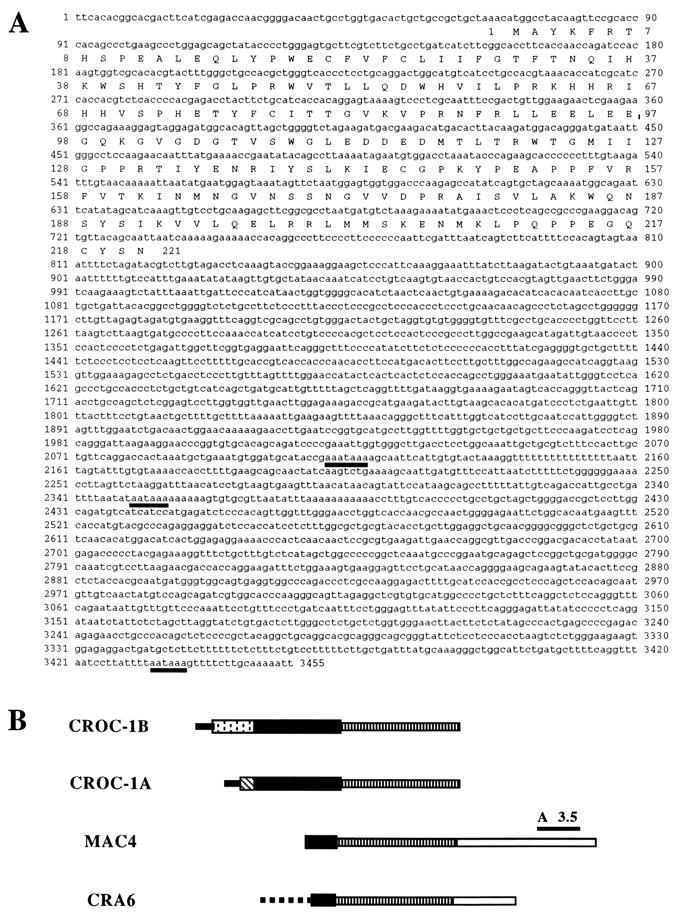
The sequence of A3.5 did not show significant similarities to any other sequence in available databases. A3.5 was used as a probe to screen for longer cDNAs in a λZAP phage library generated from HT-29 cells. This yielded clones which were identical in their 5′-most regions to the 3′-most sequences of GenBank entries U39361 and U39360 (Fig. 2B). The sequence for A3.5 is contained in the cDNA clone MAC4 but not in U39361 or U39360 (Fig. 2B). The latter cDNAs, previously identified as CROC-1A (U39360) and CROC-1B (U39361), are predicted to code for two proteins, of 170 and 221 amino acids, respectively, which are identical at their carboxy-terminal 140 residues (54) (Fig. 3). A third human protein, DDVit 1 (51; accession no. X98091), which is identical to EDPF-1 (accession no. U62136), shows 89.6% identity to the region conserved between CROC-1A and CROC-1B. A thorough search of EST databases has identified a number of sequences in various organisms predicted to code for proteins that are closely related to the human proteins (Fig. 3). Genes in Drosophila melanogaster, C. elegans, and S. cerevisiae with the potential to code for proteins closely related to CROC-1 were found (Fig. 3).
FIG. 2.
Phage clones isolated by screening with probe A3.5 are identical at their 5′ ends to CROC-1A and CROC-1B. (A) Composite nucleotide and deduced amino acid sequences of CROC-1B (positions 1 to 2136), MAC4 (positions 504 to 3455), and CRA6 (positions 588 to 2388). (B) Diagram depicting the relationships between CROC-1A, CROC-1B, MAC4, and CRA6. Solid lines, 5′ untranslated sequences; dotted line, intervening sequence (intron); stippled and striped boxes, coding regions unique to either CROC-1A or CROC-1B; solid box, coding region common to all forms; striped thin box, common 3′ untranslated sequence; open thin box, sequences unique to MAC4 and CRA6 (not present in CROC-1 cDNAs) at the 3′ untranslated region.
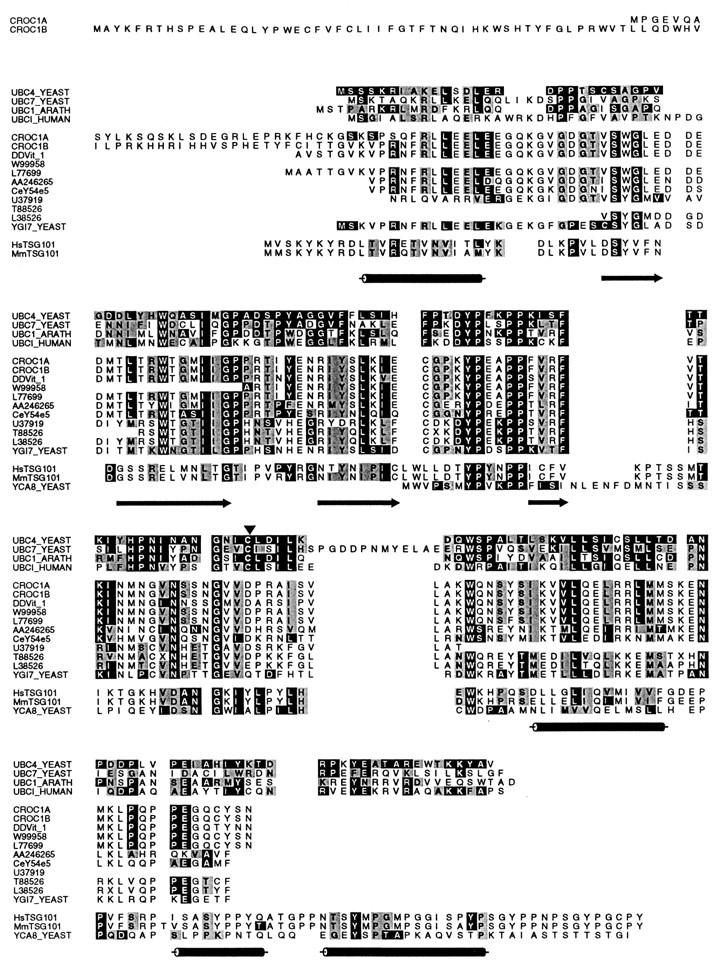
FIG. 3.
Alignment of CROC-1A, CROC-1B, and related proteins with four E2 enzymes for which structure has been determined, S. cerevisiae UBC4 and UBC7, A. thaliana UBC1, and human UBCI, and the product of the human tumor suppressor gene TSG101 and its mouse and yeast homologs. The long carboxy termini of the products of human and mouse TSG101, unrelated to E2 enzymes, and CROC-1 proteins, are not represented in the alignment. Accession numbers and organisms with represented sequence: S. cerevisiae UBC4, P15732; S. cerevisiae UBC7, Q02159; A. thaliana UBC1, P25865; Homo sapiens UBCI, P50550; CROC-1B, U39361; CROC-1A, U39360; DDVit 1, X98091; W99958, Mus musculus EST; L77699, Gallus gallus cDNA; AA246265, D. melanogaster EST; CeY54E5, C. elegans genomic cosmid; U37919, Oriza sativa EST; T88528, A. thaliana EST; L38756, Pisolinum tintorium EST; YGI7_YEAST, P53152; HsTSG101, U82130; MmTSG101, U52945; YCA_8, P25604. The C. elegans gene and protein were deduced from unannotated genomic sequence both manually and with the aid of the gene prediction algorithm GeneWise (see Materials and Methods). Secondary structure predictions are shown below the sequences as cylinders (alpha helices) and arrows (beta pleated sheets). The E2 catalytic Cys is marked with an arrowhead.
These proteins showed significant similarity to the E2 enzymes. Figure 3B shows alignments of CROC-1B and its S. cerevisiae homolog with a human E2 enzyme and three E2 enzymes, S. cerevisiae UBC4 and UBC7 and Arabidopsis thaliana UBC1, for which structure has been determined (11–13). A conserved Ubc domain defines E2 enzymes (25). The sequence identities between the conserved Ubc domain of human UCBI, S. cerevisiae UBC4 and UBC7, and A. thaliana UBC1 and the region of strongest similarity in CROC-1 proteins (positions 82 through 221 in CROC-1B) were 18.2, 24.2, and 22%, respectively. The degrees of identity of the same domains with the corresponding region of the yeast homolog of CROC-1 were 12.3, 17.7, and 26.2%. Allowing for conservative changes, the similarities rose to 42.4, 45.5, and 48.5% for CROC-1 and 37.7, 44.6, and 49.2% in the case of its yeast homolog.
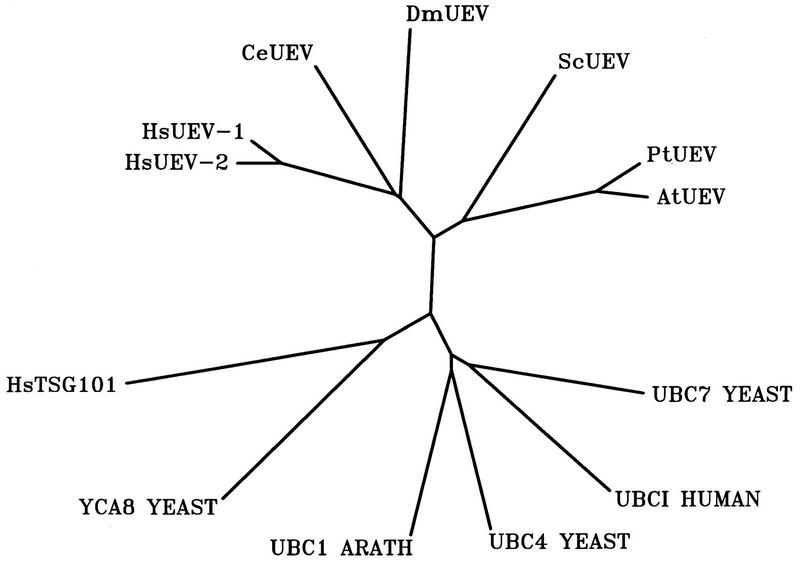
Predictions of secondary (Fig. 3) and tertiary (Fig. 4) structures also indicated that CROC-1 proteins are closely related to the E2 enzymes, differing at their amino and carboxy termini. Despite these similarities, CROC-1 proteins lack the critical Cys residue within the domain inferred from the amino acid sequence alignments (Fig. 3, arrowhead) and structural predictions (Fig. 4) to be equivalent to the catalytic domain of E2 enzymes. Very recently, two reports have also identified proteins that are predicted to be similar in structure to the E2 enzymes, but lack an obvious catalytic center (30, 49). In addition to CROC-1 and related proteins, the product of the tumor suppressor gene TSG101 and its homologs in different organisms also share these features (Fig. 3). A hierarchical classification based on the sequence comparison between the different proteins at the Ubc domain-like region showed that CROC-1-related proteins form a distinct subfamily within the E2 and related proteins. This subfamily is divergent from the TSG101-related proteins (Fig. 5). The relationship between these proteins is also illustrated in their predicted tertiary structures (Fig. 4), which show that the core structure of E2 enzymes, consisting of four antiparallel beta pleated sheets maintained in position by an alpha helix, would have a clear equivalent in CROC-1. In TSG101, the third beta pleated sheet of this core structure would be interrupted by the presence of a proline residue immediately preceding a two-residue insertion (Fig. 3 and 4). Based on these considerations, we have renamed these proteins UEV, preceded by two letters indicative of genus and species (Fig. 5).
FIG. 4.
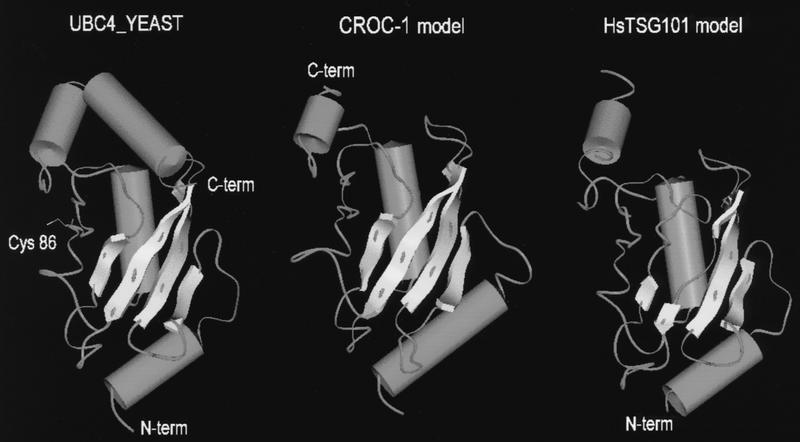
Three-dimensional molecular models of CROC-1 (middle) and TSG101 (right), built on the basis of the experimental three-dimensional structure of S. cerevisiae UBC4 (12) (left). The critical Cys, essential for the catalytic activity of ubiquitin-conjugating enzymes, is highlighted in the latter. Beta pleated sheets are represented as flat arrows, and alpha helices are represented as barrels. The models were built on sequences that could be aligned with UBC4, and thus the amino terminus (N-term) of CROC-1 and the carboxy terminus (C-term) of TSG101 are not represented.
FIG. 5.
Unrooted tree of phylogenetic relationships between the Ubc domain-like regions of UEV/CROC-1 and TSG101-related proteins and the Ubc domains of selected ubiquitin-conjugating enzymes. Accession numbers for the corresponding sequences are as in Fig. 3.
The identity of the 3′ untranslated sequences of the CROC-1A and CROC-1B cDNAs (54) indicates that they almost certainly correspond to RNAs transcribed from a single gene (see below). Therefore, according to our proposed designation, CROC-1A and CROC-1B are hereafter referred to as HsUEV-1A and HsUEV-1B, respectively. On the other hand, the 3′ untranslated sequences of HsUEV-1A and HsUEV-1B are completely unrelated to the 3′ untranslated sequence of the CROC-1-related protein DDVit 1 (51) (also known as EDPF-1), which argues that the latter is coded for by a different gene, which we have designated HsUEV-2 (Fig. 5; see Discussion).
In vitro ubiquitination assays were performed to test if UEV proteins can promote ubiquitination of protein substrates. In the presence of 125I-labeled ubiquitin, purified E1 and a crude fraction containing both E3 and recombinant HsUEV-1 did not promote conjugate formation (Fig. 6, lane 4). In contrast, a significant increase in conjugate formation was observed with a known and active E2 enzyme, E2-F1 (Fig. 6, lane 3). Furthermore, the degree of conjugate formation driven by E2-F1 was not altered by the presence of recombinant HsUEV-1 (data not shown). Therefore, in these experiments, UEV-1 proteins do not appear to have ubiquitin-conjugating activity.
FIG. 6.
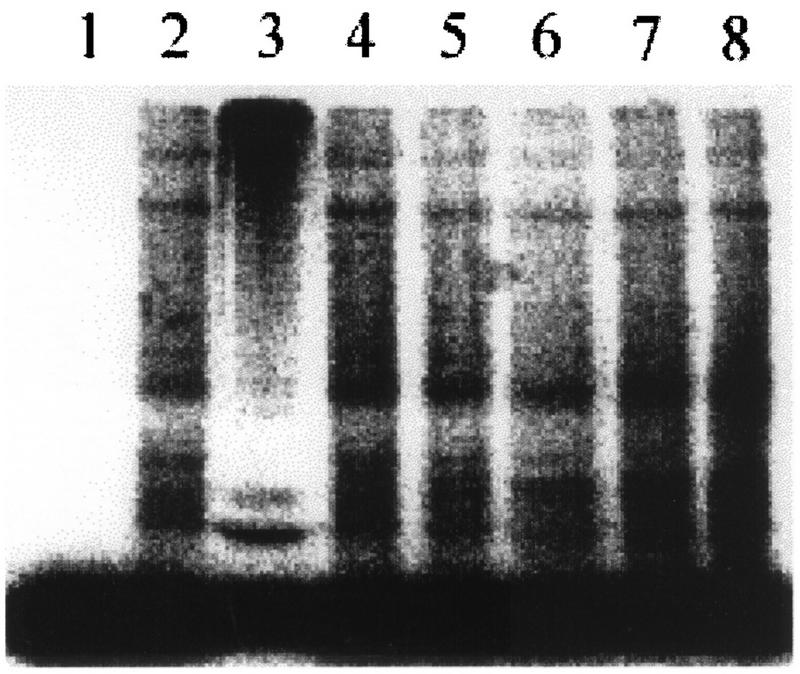
HsUEV-1 does not promote the conjugation of ubiquitin to protein substrates in vitro. Purified E1 only (lane 1), E1 with fraction IIA (containing E3 enzymes) (lane 2), E1 plus fraction IIA plus E2-F1 (lane 3), and E1 plus fraction IIA and increasing concentrations of recombinant GST–UEV-1 (lanes 4 to 8) were used in in vitro ubiquitination assays for the conjugation of 125I-ubiquitin. High-molecular-weight conjugates are formed only in the presence of E2-F1 (lane 2). Bands in lane 2 are a result of endogenous E2 contaminating fraction IIA and are taken as background signal for this assay.
Cell and tissue expression of HsUEV-1 isoforms.
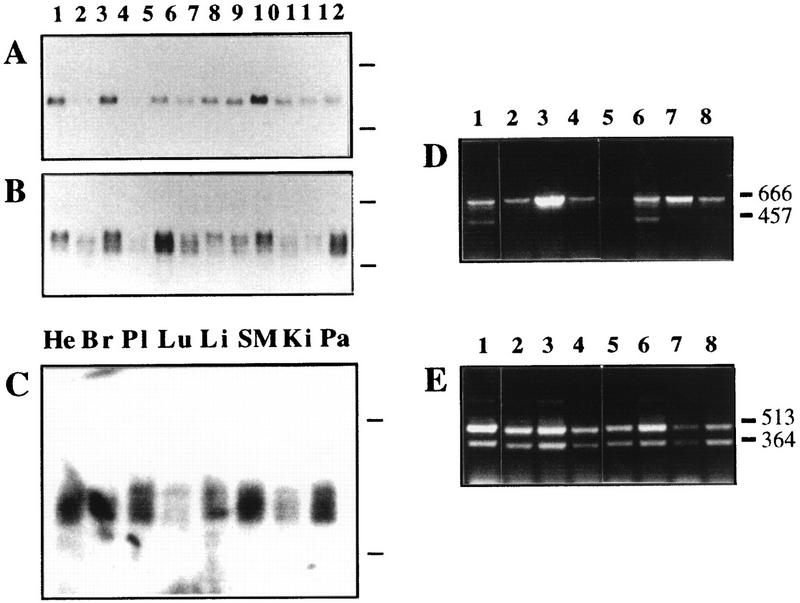
A panel of RNAs from human cell lines and tissues was analyzed for the expression of HsUEV-1. With A3.5 as a probe in Northern blotting, a 3.5-kb transcript was observed in most cell lines, while several showed very low or undetectable levels (Fig. 7A). Probing with MAC4, which encompasses part of the coding region and the entire 3′ untranslated region of UEV-1 (Fig. 2), revealed the existence of transcripts of different sizes, of which the band detected by A3.5 corresponded to the largest transcript. All cell types expressed at least one transcript species (Fig. 7B), as did all normal human tissues examined (Fig. 7C). The 3′ untranslated region of HsUEV-1 has at least three potential sites for polyadenylation (Fig. 2B). A3.5 corresponds to the 3′-most end of the full-length HsUEV-1 cDNA (Fig. 2B) and would recognize only the longer transcript. Therefore, one possible source for the diversity of transcript species observed would be the differential use of polyadenylation sites, which would result in transcripts with different 3′ ends.
FIG. 7.
Expression range of HsUEV-1. Northern blotting for the expression of HsUEV-1 in human cultured cell lines (A and B) and tissues (C). Probe A3.5 (A) or MAC4 (B) were used to hybridize a filter with RNAs from the following cell lines: 1, SK-CO-15 (colon carcinoma); 2, Caco-2 (colon carcinoma); 3, SK-PC-1 (pancreas carcinoma); 4, SK-PC-3 (pancreas carcinoma); 5, HepG2 (liver carcinoma); 6, T24 (bladder carcinoma); 7, HeLa (cervix carcinoma); 8, EW-1 (Ewing’s sarcoma); 9, RD-ES (Ewing’s sarcoma); 10, SK-MEL-28 (melanoma); 11, HEL (erythroleukemia); and 12, K562 (erythroleukemia). (C) Probe MAC4 was used to hybridize a filter with poly(A)-enriched RNA from the following human tissues: He, heart; Br, breast; Pl, placenta; Lu, lung; Li, liver; SM, skeletal muscle; Ki, kidney; Pa, pancreas. Marks to the right of the autoradiograms represent the migration of 28S and 18S rRNAs. (D and E) RT-PCR analysis with primers specific for HsUEV-1B (D) and HsUEV-1A (E), using as templates cDNAs from the following cell lines: 1, SK-MEL-28; 2, EW-1; 3, HepG2; 4, HT-29-M6 (colon carcinoma, mucosecretory); 5, H-29 (colon carcinoma, undifferentiated); 6, K562; 7, HEL; and 8, HDF (diploid fibroblasts). The sizes of the major amplified bands are indicated in nucleotides on the right.
RT-PCR using two sets of primers designed from the coding sequences of HsUEV-1A (Fig. 7E) and HsUEV-1B (Fig. 7D) identified four isoforms of HsUEV-1. These correspond to proteins with identical carboxi termini and unique amino termini (Fig. 8), arising by alternative splicing (see below). As expected, the 666-bp band in Fig. 7D corresponded to HsUEV-1B and the 513-bp band in Fig. 7E corresponded to HsUEV-1A (Fig. 8A). The short (364-bp) form (HsUEV-1As) is identical to HsUEV-1A, except for a 149-bp deletion (block III in Fig. 8A). To maintain a reading frame, direct joining of block II to block IV calls for the use of the second ATG in block II (Fig. 8A). Therefore, the protein predicted for HsUEV-1As is identical to HsUEV-1A at the carboxy-terminal 90 residues and contains a short 13-residue amino terminus unrelated to the other UEV-1 proteins (Fig. 8B). The shorter (457-bp) form generated with primers for HsUEV-1B (HsUEV-1Bs) was identical to HsUEV-1B except at the 5′ end (Fig. 8A). Translation in a frame that maintained the protein sequence common to the other UEV proteins did not reveal a translation initiation codon for this cDNA (Fig. 8B), suggesting that it is located upstream from the amplified sequence. This would also imply that HsUEV-1Bs corresponds to a fourth HsUEV-1 form with a unique 5′ end and, therefore, a unique amino terminus, which was not fully characterized in these experiments. This form showed a restricted range of expression, since it was detected only in two of the cell lines analyzed (Fig. 7D). The sequence from the 5′ end of block III up to the termination codon was present in all of the different RT-PCR products. Analysis of a cDNA clone corresponding to a partially processed transcript (clone CRA6 [Fig. 2]) indicated the existence of at least two separate blocks within this sequence (blocks IV and V).
The above-described blocks, deduced from cDNA sequences, were highly suggestive of the nature and arrangement of exons in the HsUEV-1 gene. With the exception of block I, each of the above-defined blocks could be amplified with specific primers from total human genomic DNA as well as from a human genomic PAC with sizes identical in genomic DNA and in cDNA. The unique 5′ sequence of HsUEV-1B (block I) did not give an amplification product in either genomic or PAC DNA, suggesting that block I results from joining at least two separate exons. Blocks V and VI were found to be separated by approximately 1.5 kb. PCR amplification was not achieved between sequence blocks I to II, II to III, III to IV, and IV to V, suggesting that they are separated in this region of the genome.
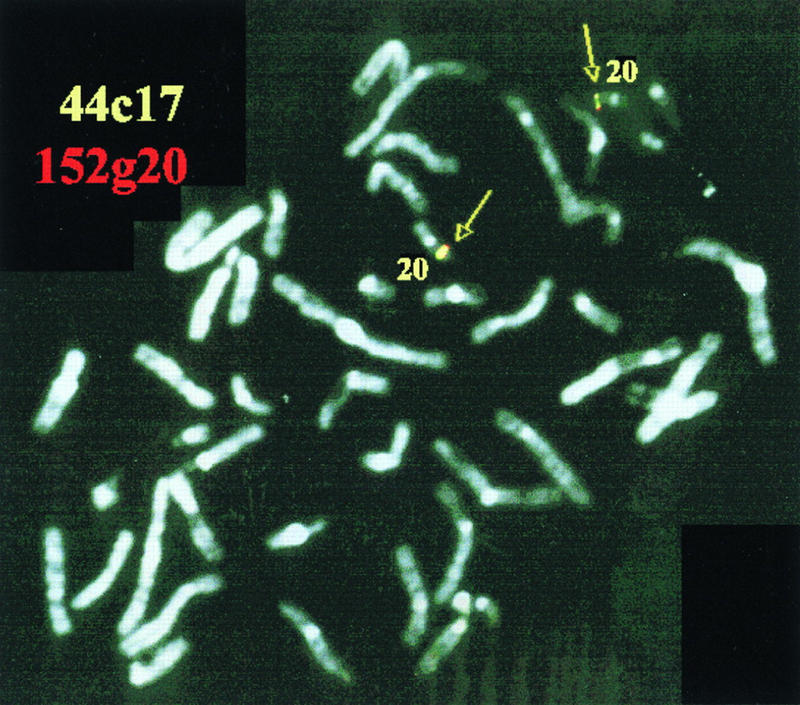
The location of these sequences in the human genome was analyzed by FISH on metaphase chromosomes. Two independent PAC clones containing HsUEV-1 sequence produced specific signals on 20q13.2 (Fig. 9). However, the cDNA MAC4 produced a clear signal on both chromosome 20q13.2 and chromosome 1q13.3 (data not shown). A search was made of a transcript map of the human genome (58) using the MAC4 sequence, indicating potential assignments to chromosomes 20, 7, and 2. By PCR analysis with primers corresponding to two separate exons, a putative HsUEV-1 pseudogene was assigned to chromosome 2 by amplification of a somatic cell hybrid panel (data not shown).
FIG. 9.
Chromosomal assignment of HsUEV-1 by FISH analysis. Human metaphase chromosomes were probed with two biotinylated independent PAC clones (yellow, 44c17; red, 152g20). Both probes yielded signals that colocalized on chromosome 20q13.2 (arrows and paired green spots).
In conclusion, HsUEV-1 is expressed in all tissues and cell lines examined as a heterogeneous collection of transcripts. This heterogeneity appears to arise from (i) differential use of polyadenylation signals and (ii) expression of isoforms generated by alternative splicing. The gene for HsUEV-1 contains at least six exons and is located on chromosome 20q13.2.
Effects of the constitutive expression of HsUEV-1 in HT-29-M6 cells.
Since expression of HsUEV was down-regulated during differentiation of HT-29-M6 cells, we studied the effects of the constitutive expression of the gene in these cells. HT-29-M6 cells were stably transfected with a construct expressing the entire domain of identity between HsUEV-1A and HsUEV-1B, under the transcriptional control of the cytomegalovirus promoter. Upon confluence, HT-29-M6 cells are able to differentiate into mucosecretory cells, and this is accompanied by the up-regulation of the apomucin MUC5AC, a hallmark of the differentiation process of these cells (28) (Fig. 10). Constitutive expression of exogenous HsUEV-1 in HT-29-M6 cells inhibited the expression of the MUC5AC gene after 2 weeks of confluent culture (Fig. 10). Therefore, continued expression of UEV-1 in HT-29-M6 cells inhibits the acquisition of markers of mucosecretory differentiation.
FIG. 10.
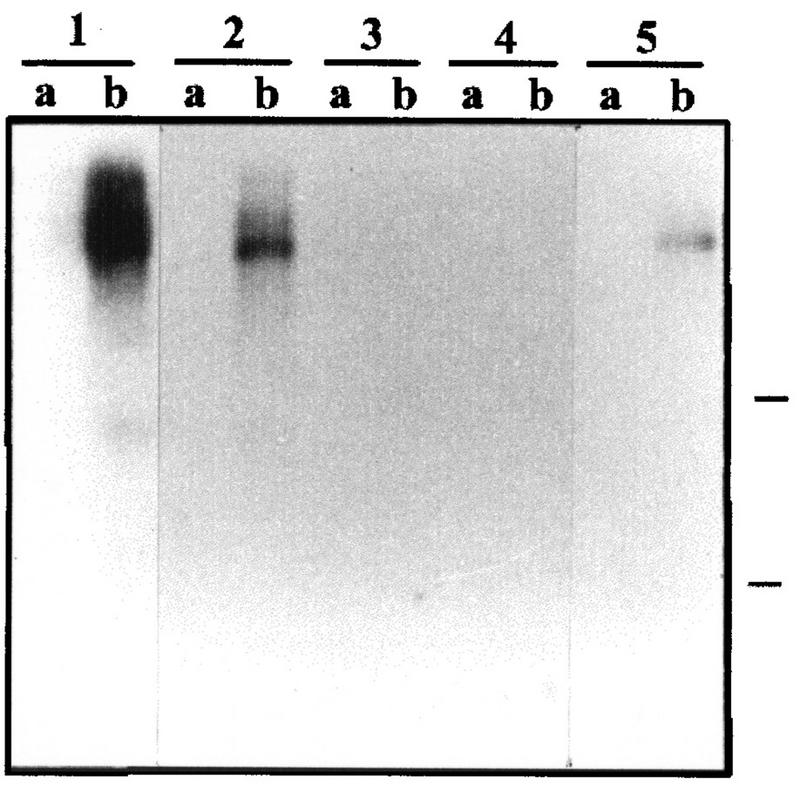
Effect of the constitutive expression of UEV-1 on the contact-induced expression of MUC5AC in HT-29-M6 cells. Control (lane pair 1) and independent clones of UEV-1-transfected HT-29-M6 cells (lane pairs 2 to 5) were harvested 2 days after seeding (lanes a) or 10 days after reaching confluence (lanes b). Transfected clones expressed different levels of the exogenous UEV-1, as determined by RT-PCR, the lowest levels corresponding to clone 2. Total RNA was analyzed by Northern blotting with a probe for the apomucin gene MUC5AC.
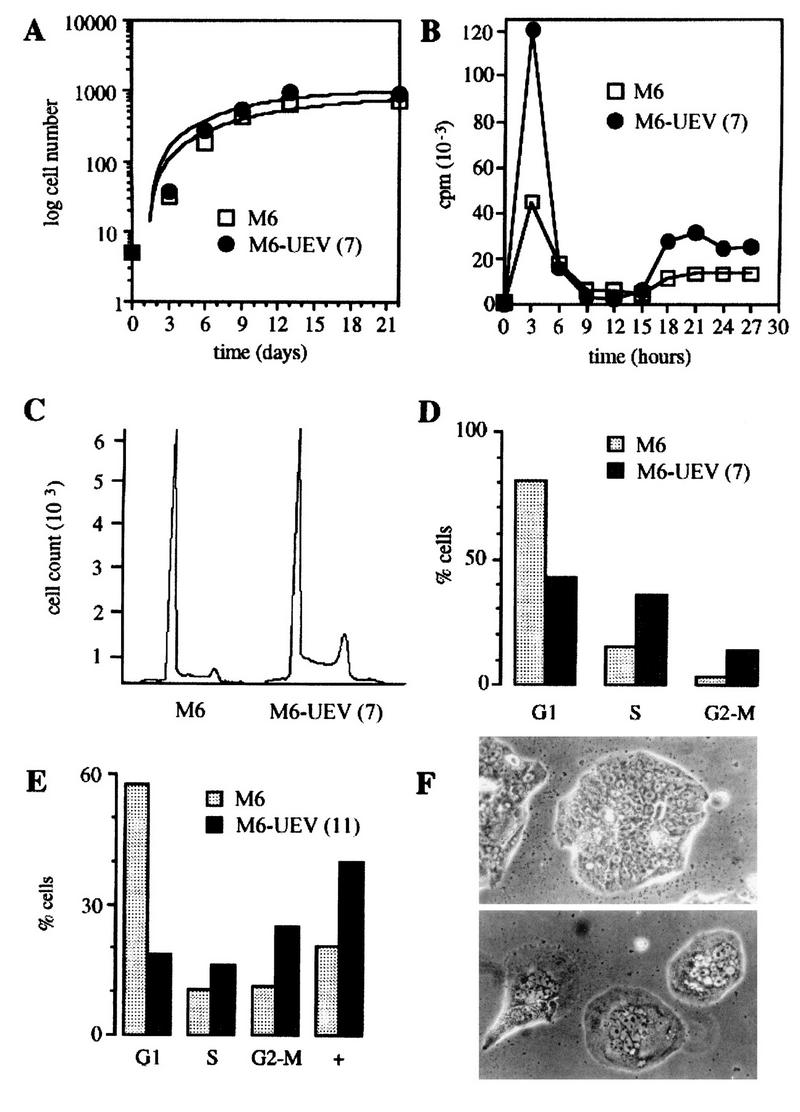
Transfected cells had initially a slightly higher growth rate than control cells, which stabilized and converged to control cell levels after 21 days of culture (Fig. 11A). Flow cytometry analysis showed that HsUEV-1-transfected HT-29-M6 cells had a higher proportion of cells in the S phase of the cell cycle (Fig. 11C and D). The larger number of cells in S phase was reflected in consistently higher levels of DNA synthesis in HsUEV-1-transfected cells, as measured by incorporation of [3H]thymidine in synchronized cells (Fig. 11B). The duration of the cell cycle, deduced from the time interval between peaks of DNA synthesis in synchronized cells, did not differ significantly in transfected and control cells (Fig. 11B).
FIG. 11.
Effects of the constitutive expression of UEV-1 on the growth and cell cycle patterns of HT-29-M6 cells. (A) Growth curves of control (empty squares) and UEV-1-transfected (filled circles) HT-29-M6 cells. Equal numbers of cells were seeded in triplicate plates and counted at 3-day intervals as attached and trypsinized cells. (B) Rates of DNA synthesis of synchronized control (empty squares) and UEV-1-transfected (filled circles) HT-29-M6 cells. Cells were seeded at equal numbers in triplicate wells, arrested at G1-S by double thymidine block, and allowed to enter S by removal of excess thymidine. [3H]thymidine was added 30 min before harvesting, which was done at 3-h intervals (see Materials and Methods). (C) Flow cytometry analysis for the DNA content of asynchronous cultures of control (left) and UEV-1-transfected (right) HT-29-M6 cells. Clone 7 of UEV-1-transfected cells was analyzed for DNA content 2 days after seeding. (D) Integrative multicycle analysis of single-fluorescence histograms corresponding to panel C. (E) Multicycle analysis of histograms from flow cytometry of clone 11 of UEV-1-transfected HT-29-M6 cells, analyzed 5 days after seeding. (F) Phase-contrast micrographs of control (top) and UEV-1-transfected clone 11 (bottom) HT-29-M6 cells, 7 days after seeding (magnification, ×400).
These experiments showed that a higher proportion of cells entering the cell cycle in HsUEV-1-transfected compared to control HT-29-M6 cells did not result in significantly different growth curves. However, under identical culture conditions, HsUEV-1-transfected but not control cells produced large numbers of detached and dead cells that floated in the culture medium (data not shown). Thus, the higher death rate of the transfected cells countered the increase in the number of cycling cells. Of the cells that remained attached to the culture dish, a proportion (1 to 3%) had nuclei with a morphology suggestive of apoptosis (Fig. 12). Nuclei with apoptotic morphology were not observed in control HT-29-M6 cells. This finding suggests that apoptosis plays a role in the high death rate observed in UEV-1-transfected HT-29-M6 cells.
FIG. 12.
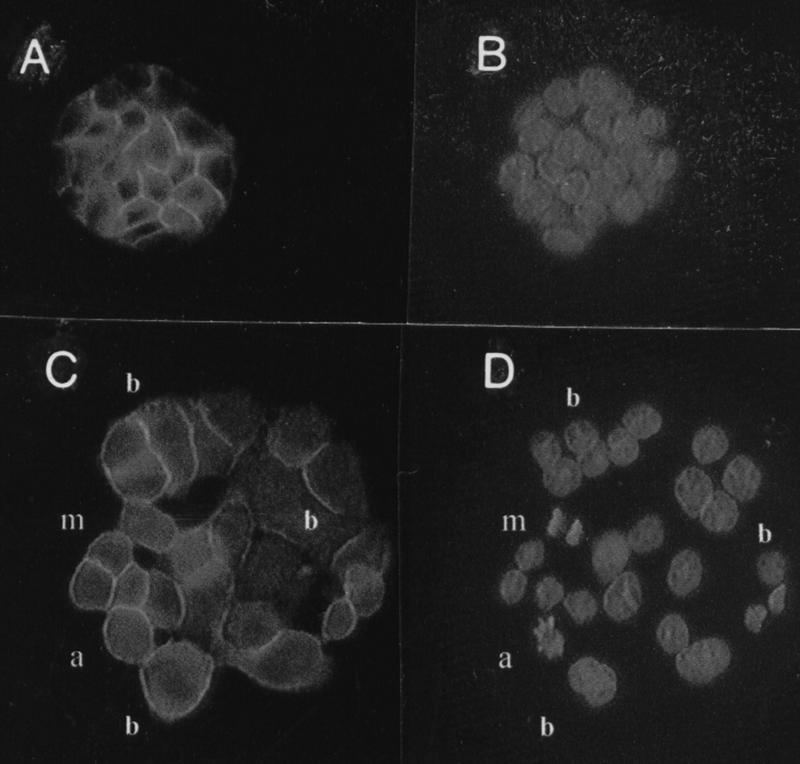
Effects of the constitutive expression of UEV-1 on the number and appearance of nuclei in HT-29-M6 cells. Control (A and B) and UEV-transfected (C and D) cells were decorated with anti-E-cadherin antibodies (A and C) to delimit the cell periphery. The same preparations were stained with Hoechst 33258 (B and D) for the visualization of nuclei. In UEV-1 transfected, but not in control, cells, binucleated cells (b), nuclei with apoptotic morphology (a), and frequent mitotic figures (m) are observed. Magnification, ×400.
The flow cytometry analysis also showed that UEV-1-transfected cells accumulated in the G2-M phase of the cell cycle (Fig. 11C to E). When analyzed 5 to 7 days after plating, UEV-1-transfected HT-29-M6 cells showed, in addition to a higher proportion of cells in S and G2-M than control cells, a population of cells with tetraploid or polyploid DNA content (Fig. 11E), presumably reflecting the occurrence of DNA replication in the absence of cell division. This was associated with the appearance of multinucleated cells, which increased in proportion with time of culture (Fig. 11F and 12).
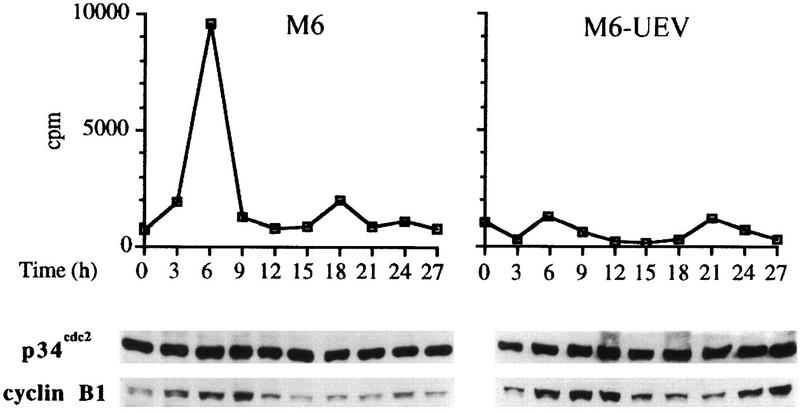
The observed accumulation in G2-M and endoreduplication of UEV-1-transfected cells suggested the occurrence of a defective regulation of one or more cell cycle transitions. Transit from the end of the S phase to mitosis and passage through mitosis are regulated by the mitotic kinase cdk1, a complex formed by a catalytic subunit, p34cdc2, and a regulatory subunit, cyclin B1 (40, 41, 45). HsUEV-1-transfected M6 cells showed strongly diminished levels of cdk1 activity (Fig. 13, top panel), while in both control and transfected cells, levels of p34cdc2 protein were fairly constant and unchanged throughout the cell cycle, and levels of cyclin B1 showed similar cyclic oscillations (Fig. 13, bottom panel). This finding indicates that the inhibition of cdk1 activity brought about by the constitutive expression of HsUEV-1 is not a consequence of changes in the levels of the complex subunits.
FIG. 13.
Effect of the constitutive expression of UEV-1 on the activity of the mitotic kinase cdk1 in HT-29-M6 cells. Synchronized control (left) and UEV-1-transfected (right) HT-29-M6 cells were analyzed for p13suc1-associated (cdk1) activity at 3-h intervals after release from the block at G1-S (top panel). Extracts from parallel cultures were analyzed by Western blotting for the subunit components of cdk1, p34cdc2 and cyclin B1, as indicated.
The effects on the cell cycle of the constitutive expression of UEV-1 in HT-29-M6 cells, in particular those affecting the G2-M transition, were not observed in untransfected cells expressing high levels of endogenous UEV-1. We reasoned that appropriate timing, rather than level, of expression could be the relevant factor that could explain these effects. Therefore, we determined the expression levels of endogenous UEV-1 in synchronized cells by means of nonsaturating, semiquantitative RT-PCR, which shows that the RNA for UEV-1A is expressed in a cell cycle-dependent fashion in HT-29-M6 cells (Fig. 14). Cells arrested at G1-S showed maximal levels of expression (time zero), followed by a marked decline during S (3 h after release) to reach undetectable levels at the end of S and beginning of G2-M (6 h after release) and a subsequent increase of levels, when cells have entered mitosis (9 and 12 h after release).
FIG. 14.
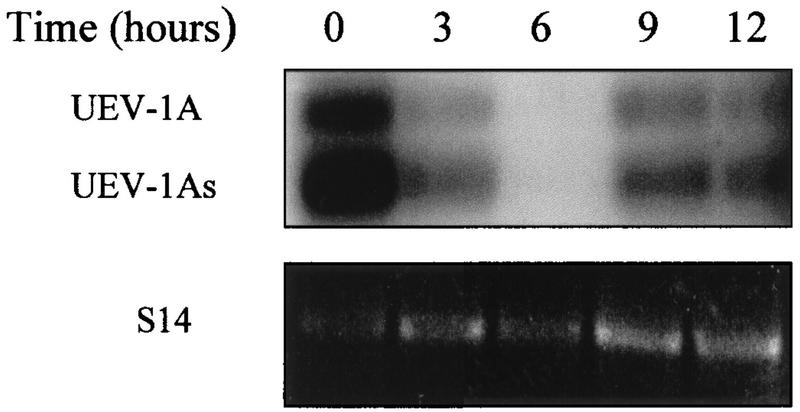
Cell cycle-regulated expression of endogenous UEV-1A. HT-29-M6 cells were synchronized by double thymidine block, allowed to enter the S phase, and analyzed for expression of UEV-1 at the indicated times by RT-PCR followed by hybridization with a specific labeled oligonucleotide (top). For normalization, the same samples were subjected to parallel RT-PCRs with primers for the ribosomal protein S14 (bottom). Entry of the cells in S was monitored in parallel experiments by incorporation of [3H]thymidine, which produced a curve equivalent to that shown in Fig. 11B, with a peak at 3 h. The experiment shown is representative of three independent experiments.
DISCUSSION
We have identified a family of proteins whose expression is regulated during in vitro differentiation of intestinal epithelial cells and that could play a role in modulating their mature phenotype and cell cycle status. These proteins were previously described as transcriptional regulators, known as CROC-1 (54). In this study, we show that they are highly conserved in evolution and constitute, by sequence relationship, a novel subfamily of the ubiquitin-conjugating, or E2, enzymes. Based on sequence and structure analyses, we propose to redesignate them UEV proteins. Despite their similarity in sequence and structure to the E2 enzymes, UEV proteins appear to lack the active center characteristic of these enzymes and were indeed unable to promote the transfer of ubiquitin to protein substrates, consistent with the fact that UEV proteins lack the essential, conserved Cys residue, required for enzymatic activity (7, 25). Substitution of the catalytic Cys by site-directed mutagenesis results in inactive E2 proteins that can behave as dominant negative variants in vitro and in vivo, effectively inhibiting ubiquitination by wild-type E2 enzymes (3, 63, 37). Although we were unable to demonstrate recombinant HsUEV-1-mediated inhibition of E2 enzyme-catalyzed ubiquitination, it remains possible that UEV proteins can still function to regulate protein ubiquitination, perhaps by positively or negatively modulating the transfer of ubiquitin to specific substrates by a specific subset of E2 enzymes. E2 enzymes can interact with each other, forming homodimers (43, 50) or heterodimers (8), and such interactions could modify the activity and/or substrate specificity of these enzymes. It is conceivable that interactions of E2 enzymes with UEV proteins provide a higher degree of combinatorial possibilities and direct a given enzyme to specific substrates or subcellular locations, or otherwise modulate its activity. The recent proposal that the product of the tumor suppressor gene TSG101 (34, 35) is a potential dominant negative variant of E2 enzymes (30, 49) is also based on sequence and structure predictions. We have shown here that TSG101 proteins and the proteins of the UEV family belong to distinct subgroups of inactive variants of the E2 enzymes. In both cases, the demonstration of a regulatory role of these proteins in ubiquitination would require finding relevant substrates and/or E2 partners in in vitro and in vivo experiments.
At least two different human UEV genes, one coding for HsUEV-1/CROC-1 and one coding for HsUEV-2/DDVit-1, could exist. This is inferred from the fact that in their cDNAs, 3′ untranslated sequences in HsUEV-1/CROC-1 differ completely from those of HsUEV-2/DDVit-1. In situ hybridization with the PAC genomic clones, combined with PCR analysis, assigns the gene for HsUEV-1 to chromosome 20q13.2. The evidence presented here indicates that the gene is expressed in different cell types, as at least four isoforms generated by alternative splicing. Database analysis (ESTs), in situ hybridization, and somatic cell hybrid analysis suggest that chromosomes 1, 2, and 7 harbor pseudogenes or genes related to HsUEV-1.
The variants of HsUEV-1 generated by alternative use of exons encode proteins identical at their carboxy-terminal 90 residues, which includes the domain of homology to the Ubc domain of E2 enzymes, and amino termini unique to each form. In E2 enzymes, the core Ubc domain appears to be sufficient for their enzymatic activity, while the extensions at either end could serve as modules for protein-protein interactions that direct the enzyme to specific substrates or subcellular locations (2, 20, 27, 38, 48). The unique amino termini of the different isoforms of HsUEV-1 might be involved in specific protein-protein interactions which may affect their localization or activity.
The fact that the expression of exogenous HsUEV-1 induced an accumulation of cells in G2-M and endoreduplication points to one important cellular process regulated by these proteins. Certain stimuli or exposure to DNA-damaging agents, such as irradiation and drugs, arrest cells in G2-M (55), in a process dependent on p53 (71, 9) and p21/WAF (71). The same agents induce endoreduplication in cells lacking p53 or p21/WAF (71). Since HT-29 cells do not have functional p53 (71), the accumulation in G2-M induced by HsUEV-1 does not depend on p53-regulated DNA damage checkpoints. Nevertheless, it cannot be ruled out that the observed effect is a nonspecific genotoxic effect which, in p53- and p21/WAF-deficient cells, would cause endoreduplication and apoptosis, although cells would not tend to accumulate in G2-M (71).
In the yeast S. cerevisiae, deletion of cyclin B (22), the regulatory component of cdc2, or of cdc2 itself (6, 22) leads to a round of replication in the absence of mitosis. In Schizosaccharomyces pombe, overexpression of rum1+, which results in inhibition of p34cdc2, is associated with endoreduplication (39). In mammalian cells, the tyrosine kinase inhibitor K252a induces endoreduplication (67), and viral proteins like human immunodeficiency virus Vpr (5, 23, 26, 52) or simian virus 40 large T (57) arrest cells in G2-M by inhibiting the mitotic kinase cdk1 (23, 26, 57), resulting in multiple rounds of replication in the absence of mitosis and concomitant polyploidy (5). In the case of the human immunodeficiency virus Vpr protein, the inhibition of cdk1 activity is associated with hyperphosphorylation of its catalytic subunit, p34cdc2 (26), possibly an indirect effect of Vpr on regulatory kinases or phosphatases (17, 21, 29). Therefore, it is possible that some of the cell cycle effects brought about by the constitutive expression of UEV-1 in HT-29-M6, namely, accumulation in G2-M and endoreduplication, are a direct consequence of the observed inhibition of the mitotic kinase cdk1. The mechanism responsible for the inhibition of cdk1 by UEV-1 remains to be determined, although our observations indicate that it is not due to changes in the protein levels of the component subunits of this kinase. Our finding that endogenous UEV-1A is expressed in a cell cycle-dependent manner further supports a role for these proteins in the physiological regulation of cell cycle transitions and suggests that the effects on the G2-M transition of HT-29-M6 cells transfected with a vector for the constitutive expression of UEV-1 is due to untimely expression of the exogenous protein. In untransfected cells, loss of expression of endogenous UEV-1 at the end of the S phase would allow the appearance of active cdk1 and normal progression through G2-M, whereas continuous expression of the exogenous gene in transfected cells would block this transition.
The cell cycle effects described here could reflect just one of the modes of action of UEV proteins and could be due to either direct or indirect interactions with proteins and pathways that regulate cell cycle transitions and possibly other cellular processes. CROC-1 proteins were originally identified based on their capacity to induce transcriptional activation of the human c-fos promoter and localized to the nucleus. These proteins do not appear to bind to DNA in a sequence-specific manner (54), and thus their activity could be a consequence of protein-protein interactions that enhance or stabilize one or more transcriptional activators. Also, the inhibition of the contact-induced differentiation of HT-29-M6 cells could be either a direct consequence of the changes in the cell cycle behavior induced by UEV-1 or due to the effects of the constitutive expression of UEV on other processes, such as transcription of specific genes, metabolic pathways involved in the acquisition of a differentiated phenotype, or cell-cell and cell-substrate adhesion.
Finally, the sequence and structural relationship of UEV with the product of the tumor suppressor gene TSG101 could stimulate a search for the involvement of UEV in tumorigenesis. Intragenic deletions and mutations (35) or abnormal patterns of expression (31) of TSG101 have been reported in breast cancer. UBE2V, the gene coding for UEV-1, has not been studied to date in the context of human disease.
ACKNOWLEDGMENTS
We thank R. Guigó, M. Burset, E. Batlle, A. García de Herreros, and D. Swallow for helpful discussion and suggestions.
E.S. is a recipient of fellowships from the IMIM and the CSIC, M.R.V. held an FPI fellowship from the Ministerio de Educación y Ciencia, C.H. holds a TMR fellowship from the European Union, and N.L. is a recipient of a fellowship from the IMIM. This work was funded with grants to T.M.T. (DGICYT PB92-0506-C02-01; Fundación Ramón Areces; Fundación Científica de la Asociación Española contra el Cáncer; CIRIT; Marató TV3).
REFERENCES
- 1.Arion D, Meijer L, Brizuela L, Beach D. cdc2 is a component of the M phase-specific histone H1 kinase: evidence for identity with MPF. Cell. 1988;55:371–378. doi: 10.1016/0092-8674(88)90060-8. [DOI] [PubMed] [Google Scholar]
- 2.Bailly V, Lamb J, Sung P, Prakash S, Prakash L. Specific complex formation between yeast RAD6 and RAD18 proteins: a potential mechanism for targeting RAD6 ubiquitin-conjugating activity to DNA damage sites. Genes Dev. 1994;8:811–820. doi: 10.1101/gad.8.7.811. [DOI] [PubMed] [Google Scholar]
- 3.Banerjee A, Deshaies R J, Chau V. Characterization of a dominant negative mutant of the cell cycle ubiquitin-conjugating enzyme Cdc34. J Biol Chem. 1995;270:26209–26215. doi: 10.1074/jbc.270.44.26209. [DOI] [PubMed] [Google Scholar]
- 4.Barila D, Murgia C, Nobili F, Gaetani S, Perozzi G. Subtractive hybridization cloning of novel genes differentially expressed during intestinal development. Eur J Biochem. 1994;223:701–709. doi: 10.1111/j.1432-1033.1994.tb19043.x. [DOI] [PubMed] [Google Scholar]
- 5.Bartz S R, Rogel M E, Emerman M. Human immunodeficiency virus type 1 cell cycle control: Vpr is cytostatic and mediates G2 accumulation by a mechanism which differs from DNA damage checkpoint control. J Virol. 1996;70:2324–2331. doi: 10.1128/jvi.70.4.2324-2331.1996. [DOI] [PMC free article] [PubMed] [Google Scholar]
- 6.Broek D, Bartlett R, Crawford K, Nurse P. Involvement of p34cdc2 in establishing the dependency of S phase in mitosis. Nature. 1991;349:388–393. doi: 10.1038/349388a0. [DOI] [PubMed] [Google Scholar]
- 7.Chen P, Johnson P, Sommer T, Jentsch S, Hochstrasser M. Multiple ubiquitin-conjugating enzymes participate in the in vivo degradation of the yeast MATα2 repressor. Cell. 1993;74:357–369. doi: 10.1016/0092-8674(93)90426-q. [DOI] [PubMed] [Google Scholar]
- 8.Chen X, Ko L J, Jayaraman L, Prives C. p53 levels, functional domains, and DNA damage determine the extent of the apoptotic response to tumor cells. Genes Dev. 1996;10:2438–2451. doi: 10.1101/gad.10.19.2438. [DOI] [PubMed] [Google Scholar]
- 9.Chomczynsky P, Sacchi N. Single-step method of RNA isolation by acid guanidinium thiocyanate-phenol-chloroform extraction. Anal Biochem. 1987;162:156–159. doi: 10.1006/abio.1987.9999. [DOI] [PubMed] [Google Scholar]
- 10.Ciechanover A. The ubiquitin-proteasome proteolytic pathway. Cell. 1994;79:12–21. doi: 10.1016/0092-8674(94)90396-4. [DOI] [PubMed] [Google Scholar]
- 11.Cook W J, Jeffrey L C, Sullivan M L, Vierstra R D. Three-dimensional structure of a ubiquitin-conjugating enzyme (E2) J Biol Chem. 1992;267:15116–15121. doi: 10.2210/pdb1aak/pdb. [DOI] [PubMed] [Google Scholar]
- 12.Cook W J, Jeffrey L C, Xu Y, Chau V. Tertiary structures of class I ubiquitin-conjugating enzymes are highly conserved: crystal structure of yeast Ubc4. Biochemistry. 1993;32:13809–13817. doi: 10.1021/bi00213a009. [DOI] [PubMed] [Google Scholar]
- 13.Cook W J, Martin P D, Edwards B F, Yamazaki R K, Chau V. Crystal structure of a class I ubiquitin conjugating enzyme (Ubc7) from Saccharomyces cerevisiae at 2.9 angstroms resolution. Biochemistry. 1997;36:1621–1627. doi: 10.1021/bi962639e. [DOI] [PubMed] [Google Scholar]
- 14.Diaz-Meco M, Dominguez I, Sanz L, Municio M M, Berra E, Cornet M E, Garcia de Herreros A, Johansen T, Moscat J. Phospholipase C-mediated hydrolysis of phosphatidylcholine is a target of transforming growth factor-β1 inhibitory signals. Mol Cell Biol. 1992;12:302–308. doi: 10.1128/mcb.12.1.302. [DOI] [PMC free article] [PubMed] [Google Scholar]
- 15.Fabre M, Garcia de Herreros A. Phorbol ester-induced scattering of HT-29 human intestinal cancer cells is associated with down-modulation of E-cadherin. J Cell Sci. 1993;106(Part 2):513–521. doi: 10.1242/jcs.106.2.513. [DOI] [PubMed] [Google Scholar]
- 16.Feinberg A P, Vogelstein B. A technique for radiolabeling DNA restriction endonuclease fragments to high specific activity. Anal Biochem. 1983;132:6–13. doi: 10.1016/0003-2697(83)90418-9. [DOI] [PubMed] [Google Scholar]
- 17.Felix M-A, Cohen P, Karsenti E. Cdc2 H1 kinase is negatively regulated by a type 2A phosphatase in the Xenopus early embryonic cell cycle: evidence from the effects of okadaic acid. EMBO J. 1990;9:675–683. doi: 10.1002/j.1460-2075.1990.tb08159.x. [DOI] [PMC free article] [PubMed] [Google Scholar]
- 18.Gonen H, Stancovski I, Shkedy D, Hadari T, Bercovich B, Bengal E, Mesilati S, Abu-Hatoum O, Schwartz A L, Ciechanover A. Isolation, characterization, and partial purification of a novel ubiquitin-protein ligase, E3. J Biol Chem. 1996;271:302–310. doi: 10.1074/jbc.271.1.302. [DOI] [PubMed] [Google Scholar]
- 19.Gordon J I, Hermiston M L. Differentiation and self-renewal in the mouse gastrointestinal epithelium. Curr Opin Cell Biol. 1994;6:795–803. doi: 10.1016/0955-0674(94)90047-7. [DOI] [PubMed] [Google Scholar]
- 20.Gosink M M, Vierstra R D. Redirecting the specificity of ubiquitination by modifying ubiquitin-conjugating enzymes. Proc Natl Acad Sci USA. 1995;92:9117–9121. doi: 10.1073/pnas.92.20.9117. [DOI] [PMC free article] [PubMed] [Google Scholar]
- 21.Gu Y, Rosenblatt J, Morgan D O. Cell cycle regulation of CDK2 activity by phosphorylation of Thr160 and Tyr15. EMBO J. 1992;11:3995–4005. doi: 10.1002/j.1460-2075.1992.tb05493.x. [DOI] [PMC free article] [PubMed] [Google Scholar]
- 22.Hayles J, Fisher D, Woollard A, Nurse P. Temporal order of S phase and mitosis in fission yeast is determined by the state of the p34cdc2-mitotic B cyclin complex. Cell. 1994;78:813–822. doi: 10.1016/s0092-8674(94)90542-8. [DOI] [PubMed] [Google Scholar]
- 23.He J, Choe S, Walker R, Di Marzio P, Morgan D O, Landau N R. Human immunodeficiency virus type 1 viral protein R (Vpr) arrests cells in the G2 phase of the cell cycle by inhibiting p34cdc2. J Virol. 1995;69:6705–6711. doi: 10.1128/jvi.69.11.6705-6711.1995. [DOI] [PMC free article] [PubMed] [Google Scholar]
- 24.Huet C, Sahuquillo-Merino C, Coudrier E, Louvard D. Absorptive and mucus-secreting subclones isolated from a multipotent intestinal cell line (HT-29) provide new models for cell polarity and terminal differentiation. J Cell Biol. 1987;105:345–357. doi: 10.1083/jcb.105.1.345. [DOI] [PMC free article] [PubMed] [Google Scholar]
- 25.Jentsch S. The ubiquitin-conjugation system. Annu Rev Genet. 1992;26:179–207. doi: 10.1146/annurev.ge.26.120192.001143. [DOI] [PubMed] [Google Scholar]
- 26.Jowett J B M, Planelles V, Poon B, Shah N P, Chen M-L, Chen I S Y. The human immunodeficiency virus type 1 vpr gene arrests infected T cells in the G2-M phase of the cell cycle. J Virol. 1995;69:6304–6313. doi: 10.1128/jvi.69.10.6304-6313.1995. [DOI] [PMC free article] [PubMed] [Google Scholar]
- 27.Kaiser P, Mandl S, Schwiger M, Schneider R. Characterization of functionally independent domains in the human ubiquitin conjugating enzyme UbcH2. FEBS Lett. 1995;377:193–196. doi: 10.1016/0014-5793(95)01323-7. [DOI] [PubMed] [Google Scholar]
- 28.Kitamura H, Cho M, Lee B H, Gum J R, Siddiki B B, Ho S B, Toribara N W, Lesuffleur T, Zweibaum A, Kitamura S, Kim Y S. Alteration in mucin gene expression and biological properties of HT-29 colon cancer cell subpopulations. Eur J Cancer. 1996;32A:1788–1796. doi: 10.1016/0959-8049(96)00168-2. [DOI] [PubMed] [Google Scholar]
- 29.Krek W, Nigg E A. Mutations of p34cdc2 phosphorylation sites induce premature mitotic events in HeLa cells: evidence for a double block to p34cdc2 kinase activation in vertebrates. EMBO J. 1991;10:3331–3341. doi: 10.1002/j.1460-2075.1991.tb04897.x. [DOI] [PMC free article] [PubMed] [Google Scholar]
- 30.Koonin E V, Abagyan R A. TSG101 may be the prototype of a class of dominant negative ubiquitin regulators. Nat Genet. 1997;16:330–331. doi: 10.1038/ng0897-330. [DOI] [PubMed] [Google Scholar]
- 31.Lee M P, Feinberg A P. Aberrant splicing but not mutations of TSG101 in human breast cancer. Cancer Res. 1997;57:3131–3134. [PubMed] [Google Scholar]
- 32.Lesuffleur T, Barbat A, Luccioni C, Beaumetin J, Clair M, Kornowski A, Dussaulx E, Dutrillaux B, Zweibaum A. Dihydrofolate reductase gene amplification-associated shift of differentiation in methotrexate-adapted HT-29 cells. J Cell Biol. 1991;115:1409–1418. doi: 10.1083/jcb.115.5.1409. [DOI] [PMC free article] [PubMed] [Google Scholar]
- 33.Lesuffleur T, Porchet N, Aubert J-P, Swallow D, Gum J R, Kim Y S, Real F X, Zweibaum A. Differential expression of the human mucin genes MUC1 to MUC5 in relation to growth and differentiation of different mucus-secreting HT-29 cell subpopulations. J Cell Sci. 1993;106:771–783. doi: 10.1242/jcs.106.3.771. [DOI] [PubMed] [Google Scholar]
- 34.Li L, Cohen S N. tsg101: a novel tumor susceptibility gene isolated by controlled homozygous functional knockout of allelic loci in mammalian cells. Cell. 1996;85:319–329. doi: 10.1016/s0092-8674(00)81111-3. [DOI] [PubMed] [Google Scholar]
- 35.Li L, Li X, Francke U, Cohen S N. The TSG101 tumor susceptibility gene is located in chromosome 11 band p15 and is mutated in human breast cancer. Cell. 1997;88:143–154. doi: 10.1016/s0092-8674(00)81866-8. [DOI] [PubMed] [Google Scholar]
- 36.Louvard D, Kedinger M, Hauri H P. The differentiating intestinal epithelial cell: establishment and maintenance of functions through interactions between cellular structures. Annu Rev Cell Biol. 1992;8:157–195. doi: 10.1146/annurev.cb.08.110192.001105. [DOI] [PubMed] [Google Scholar]
- 37.Madura K, Dohmen R J, Varshavsky A. N-recognin/Ubc2 interactions in the N-end rule pathway. J Biol Chem. 1993;268:12046–12054. [PubMed] [Google Scholar]
- 38.Matuschewski K, Hauser H P, Treier M, Jentsch S. Identification of a novel family of ubiquitin-conjugating enzymes with distinct amino-terminal extensions. J Biol Chem. 1996;271:2789–2794. doi: 10.1074/jbc.271.5.2789. [DOI] [PubMed] [Google Scholar]
- 39.Moreno S, Nurse P. Regulation of progression through the G1 phase of the cell cycle by the rum1+ gene. Nature. 1994;367:236–242. doi: 10.1038/367236a0. [DOI] [PubMed] [Google Scholar]
- 40.Morgan D O. Principles of CDK regulation. Nature. 1995;374:131–134. doi: 10.1038/374131a0. [DOI] [PubMed] [Google Scholar]
- 41.Murray A. Cyclin ubiquitination: the destructive end of mitosis. Cell. 1995;81:149–152. doi: 10.1016/0092-8674(95)90322-4. [DOI] [PubMed] [Google Scholar]
- 42.Nadal M, Mila M, Pritchard M, Mur A, Pujals J, Blouin J L, Antonarakis S E, Ballesta F, Extivill X. YAC and cosmid FISH mapping of an unbalanced chromosomal translocation causing partial trisomy 21 and Down syndrome. Hum Genet. 1996;9:460–466. doi: 10.1007/s004390050240. [DOI] [PubMed] [Google Scholar]
- 43.Nagai Y, Kaneda S, Nomura K, Yasuda H, Seno T, Yamao F. Ubiquitin-activating enzyme, E1, is phosphorylated in mammalian cells by the protein kinase Cdc2. J Cell Sci. 1995;108:2145–2152. doi: 10.1242/jcs.108.6.2145. [DOI] [PubMed] [Google Scholar]
- 44.Neutra M, Louvard D. Differentiation of intestinal cells in vitro. In: Matlin K S, Valentich J D, editors. Functional epithelial cells in culture. New York, N.Y: Alan R. Liss, Inc.; 1989. pp. 363–398. [Google Scholar]
- 45.Nurse P. Ordering S phase and M phase in the cell cycle. Cell. 1994;79:547–550. doi: 10.1016/0092-8674(94)90539-8. [DOI] [PubMed] [Google Scholar]
- 46.Perucho M, Welsh J, Peinado M A, Ionov Y, McClelland M. Fingerprinting of DNA and RNA by arbitrarily primed polymerase chain reaction: applications in cancer research. Methods Enzymol. 1995;254:275–290. doi: 10.1016/0076-6879(95)54020-2. [DOI] [PubMed] [Google Scholar]
- 47.Pinto M, Appay M D, Simon-Assman P, Chevalier G, Dracopoli N, Fogh J, Zweibaum A. Enterocytic differentiation of cultured human colon cancer cells by replacement of glucose by galactose in the medium. Biol Cell. 1982;44:193–196. [Google Scholar]
- 48.Pitluk Z W, McDonough M, Sangan P, Gonda D K. Novel CDC34 (UBC3) ubiquitin-conjugating enzyme mutants obtained by charge-to-alanine scanning mutagenesis. Mol Cell Biol. 1995;15:1210–1219. doi: 10.1128/mcb.15.3.1210. [DOI] [PMC free article] [PubMed] [Google Scholar]
- 49.Ponting C P, Cai Y-D, Bork P. The breast cancer gene product TSG101: a regulator of ubiquitination? J Mol Med. 1997;75:467–469. [PubMed] [Google Scholar]
- 50.Ptak C, Prendergast J A, Hodgins R, Kay C M, Chau V, Ellison M J. Functional and physical characterization of the cell cycle ubiquitin-conjugating enzyme CDC34 (UBC3). Identification of a functional determinant within the tail that facilitates CDC34 self-association. J Biol Chem. 1994;269:26539–26545. [PubMed] [Google Scholar]
- 51.Rehli F J, Krause S W, Andreseen R, Kreutz M. Molecular cloning of a 1α,25-dihydroxyvitamin D3-inducible transcript (DDVit 1) in human blood monocytes. Biochem Biophys Res Commun. 1997;234:407–412. doi: 10.1006/bbrc.1997.6798. [DOI] [PubMed] [Google Scholar]
- 52.Rogel M E, Wu L I, Emerman M. The human immunodeficiency virus type 1 vpr gene prevents cell proliferation during chronic infection. J Virol. 1995;69:882–888. doi: 10.1128/jvi.69.2.882-888.1995. [DOI] [PMC free article] [PubMed] [Google Scholar]
- 53.Rost B, Sander C. Prediction of protein secondary structure at better than 70% accuracy. J Mol Biol. 1993;232:584–599. doi: 10.1006/jmbi.1993.1413. [DOI] [PubMed] [Google Scholar]
- 54.Rothofsky M L, Lin S L. CROC-1 encodes a protein which mediates transcriptional activation from the human FOS promoter. Gene. 1997;195:141–149. doi: 10.1016/s0378-1119(97)00097-8. [DOI] [PubMed] [Google Scholar]
- 55.Russell K J, Wiens L W, Demers G W, Galloway D A, Plon S E, Groudine M. Abrogation of the G2 checkpoint results in differential radiosensitization of G1 checkpoint-deficient and G1 checkpoint-competent cells. Cancer Res. 1995;55:1639–1642. [PubMed] [Google Scholar]
- 56.Sambrook J, Fritsch E F, Maniatis T. Molecular cloning: a laboratory manual. 2nd ed. Cold Spring Harbor, N.Y: Cold Spring Harbor Laboratory; 1989. [Google Scholar]
- 57.Scarano F J, Laffin J A, Lehman J M, Friedrich T D. Simian virus 40 prevents activation of M-phase-promoting factor during lytic infection. J Virol. 1994;68:2355–2361. doi: 10.1128/jvi.68.4.2355-2361.1994. [DOI] [PMC free article] [PubMed] [Google Scholar]
- 58.Schuler G D, Boguski M S, Stewart E A, Stein L D, Gyapay G, et al. A gene map of the human genome. Science. 1996;274:540–546. [PubMed] [Google Scholar]
- 59.Simon T C, Gordon J I. Intestinal epithelial cell differentiation: new insights from mice, flies and nematodes. Curr Opin Genet Dev. 1995;5:577–586. doi: 10.1016/0959-437x(95)80026-3. [DOI] [PubMed] [Google Scholar]
- 60.Siyanova E Y, Serfas M S, Mazo I A, Tyner A L. Tyrosine kinase gene expression in the mouse small intestine. Oncogene. 1994;9:2053–2057. [PubMed] [Google Scholar]
- 61.Stein G S, Stein J L, Lian J B, Last T J, Owen T, McCabe L. Synchronization of normal dipoid and transformed mammalian cells. In: Celis J E, editor. Cell biology. A laboratory handbook. London, England: Academic Press, Inc.; 1994. pp. 282–287. [Google Scholar]
- 62.Suh E, Traber P G. An intestine-specific homeobox gene regulates proliferation and differentiation. Mol Cell Biol. 1996;16:619–625. doi: 10.1128/mcb.16.2.619. [DOI] [PMC free article] [PubMed] [Google Scholar]
- 63.Sung P, Prakash S, Prakash L. Mutation of cysteine-88 in the Saccharomyces cerevisiae RAD6 protein abolishes its ubiquitin-conjugating activity and its various biological functions. Proc Natl Acad Sci USA. 1990;87:2695–2699. doi: 10.1073/pnas.87.7.2695. [DOI] [PMC free article] [PubMed] [Google Scholar]
- 64.Sykes D E, Weiser M M. The identification of genes specifically expressed in epithelial cells of the rat intestinal crypts. Differentiation. 1992;50:41–46. doi: 10.1111/j.1432-0436.1992.tb00484.x. [DOI] [PubMed] [Google Scholar]
- 65.Thompson J D, Higgins D G, Gibson T J. CLUSTAL W: improving the sensitivity of progressive multiple sequence alignment through sequence weighting, position-specific gap penalties and weight matrix choice. Nucleic Acids Res. 1994;22:4673–4680. doi: 10.1093/nar/22.22.4673. [DOI] [PMC free article] [PubMed] [Google Scholar]
- 66.Towbin H, Staehelin T, Gordon J. Electrophoretic transfer of proteins from polyacrylamide gels to nitrocellulose sheets: procedure and some applications. Proc Natl Acad Sci USA. 1979;76:4350–4354. doi: 10.1073/pnas.76.9.4350. [DOI] [PMC free article] [PubMed] [Google Scholar]
- 67.Usui T, Yoshida M, Abe K, Osada H, Isono K, Beppu T. Uncoupled cell cycle without mitosis induced by a protein kinase inhibitor, K-252a. J Cell Biol. 1991;115:1275–1282. doi: 10.1083/jcb.115.5.1275. [DOI] [PMC free article] [PubMed] [Google Scholar]
- 68.Vasioukhin V, Servas M S, Siyanova E Y, Polonskaia M, Costigan V J, Liu B, Thomason A, Tyner A L. A novel intracellular epithelial cell tyrosine kinase is expressed in the skin and gastrointestinal tract. Oncogene. 1995;10:349–357. [PubMed] [Google Scholar]
- 69.Vilá M R, Lloreta J, Schüssler M H, Berrozpe G, Welt S, Real F X. New pancreas cancer cell lines which represent distinct stages of ductal differentiation. Lab Invest. 1995;72:395–404. [PubMed] [Google Scholar]
- 70.Vriend G. WHAT IF: a molecular modeling and drug design program. J Mol Graph. 1990;8:52–56. doi: 10.1016/0263-7855(90)80070-v. [DOI] [PubMed] [Google Scholar]
- 71.Waldman T, Lengauer C, Kinzler K W, Vogelstein B. Uncoupling of S phase and mitosis induced by anticancer agents in cells lacking p21. Nature. 1996;381:713–716. doi: 10.1038/381713a0. [DOI] [PubMed] [Google Scholar]
- 72.Welsh J, Chada K, Dalal S S, Cheng R, Ralph D, McClelland M. Arbitrarily primed PCR fingerprinting of RNA. Nucleic Acids Res. 1992;20:4965–4970. doi: 10.1093/nar/20.19.4965. [DOI] [PMC free article] [PubMed] [Google Scholar]
- 73.Zweibaum A, Laburthe M, Grasset E, Louvard D. Use of cultured cell lines in studies of intestinal cell differentiation and function. In: Field M, Frizzel R A, editors. Handbook of physiology. The gastrointestinal system. IV. Intestinal absorption and secretion. Bethesda, Md: American Physiological Society; 1991. pp. 223–255. [Google Scholar]


