

Abstract
While specific transcription factors are known to regulate cell fate decisions, the degree to which they can stimulate formation of specific cell organelles is less clear. We used a multi-omics comparison of the transcriptomes of ciliated and non-ciliated embryonic cells to identify transcription factors upregulated in ciliated cells, and conditional genetics in mouse embryos and stem cells to demonstrate that SP5/8 regulate cilia formation and gene expression. In Sp5/8 mutant embryos primary and motile cilia are shorter than normal and reduced in number across cell types, contributing to situs inversus and hydrocephalus. Moreover, expression of SP8 is sufficient to induce primary cilia in unciliated cells. This work opens new avenues for studying cilia assembly using stem cell models and offers new insights into human ciliopathies.
Cilia are microtubule-based organelles that project from most cell types, including proliferating progenitors, and serve critical functions in motility, sensation, and signal transduction (1, 2). Accordingly, genetic mutations that disrupt cilia cause developmental abnormalities termed ciliopathies that include hydrocephalus, situs inversus, polycystic kidney disease, and craniofacial defects (1, 3, 4). There are two types of cilia: primary and motile cilia based on their microtubule cytoskeleton (axoneme) structure. Most primary cilia are non-motile, solitary, and critical for signal transduction, particularly Hedgehog signaling, and can have sensory functions (1, 2, 4). Motile cilia provide cell motility or fluid flow and are present in multiple copies on terminally differentiated cells (4). There are hundreds of cilia proteins, and most are shared by primary and motile cilia (5–7). Two TF families (Forkhead and Regulatory factor X) have been found to enhance formation of sensory/primary cilia in a cell type specific manner and drive motile cilia formation across cell types and species (8–18). Despite the importance of primary cilia, the transcriptional control of genes required for primary cilia formation has not been delineated.
During mouse embryonic development, primary cilia form progressively starting at embryonic day 6 (E6.0) in pluripotent epiblast cells (19). Mouse embryonic stem cells (ESCs) and to a greater extent their derivative epiblast stem cells (EpiSCs) have cilia, as do human pluripotent stem cells (19, 20). Interestingly, while cells derived from the epiblast, including extraembryonic mesoderm, form cilia, the cells of the extraembryonic trophectoderm and the yolk sac visceral endoderm (YsVE) do not form cilia (19). YsVE have a high level of cilia disassembly protein activity, however, this does not explain the lack of primary cilia since drug inhibition of the cilia disassembly factors only results in rare YsVE cells forming primary cilia (19). This result raised the question of whether some cilia genes are poorly expressed in YsVE because the transcriptional activators for the genes are only present in ciliated cell types.
scRNA-seq analysis reveals broad upregulation of cilia genes in ciliated cells versus YsVE
During development the visceral endoderm (VE) generates cells that populate the yolk sac (YsVE) and the embryo (embryonic VE or emVE) (Fig. 1A). The latter initially overlie the epiblast and then intercalate with embryo-derived definitive endoderm (DE) and the two cell types form the gut endoderm during E7.0–7.5 (21). At around E5.0, emVE becomes morphologically and molecularly distinct from YsVE (22). We asked whether both VE- and DE-derivatives in the gut endoderm have cilia by employing two VE-specific reporter lines, Afp-GFP (23) and a combination of Ttr-Cre (24) (VE-specific driver) and a tdTomato (tdT) Cre reporter R26lsl-tdT (25) (Fig. 1B, fig. S1A, B). We confirmed a lack of cilia in YsVE using transmission electron microscopy and found that while the centrioles were apically localized, they failed to dock to the apical membrane and recruit ciliary vesicles necessary for cilia formation (fig. S1C, D). Strikingly, the emVE began to form cilia at around E7.0, and by E8.75 when the gut endoderm had formed, most gut VE cells (GutVE) had cilia (Fig. 1C–E, G, fig. S1A, B). Cilia formation in epiblast-derived DE and mesoderm cells peaked earlier at E6.5 (Fig. 1G). Moreover, cilia formation in the emVE lineage was concurrent with their intercalation with DE cells during E7.0 and E7.5 (fig. S1E). Furthermore, intercalation with DE cells seems to be required for cilia formation in emVE since in mutants in which mesoderm and DE do not form (Fgf8−/−) or DE forms but fails to fully interact with emVE (Epi-Strip1) emVE cells do not form cilia (fig. S1F–K) (26, 27). Thus, intercalation of emVE with DE could contribute to a DE-like transcriptional signature that includes cilia genes.
Fig. 1. VE-derived emVE cells form cilia during intercalation with DE to form gut.

(A) Schematic showing that the extraembryonic visceral endoderm (VE) lineage generates yolk sac VE (YsVE, green) and embryonic VE (emVE, cyan). emVE intercalates with embryo-derived definitive endoderm (DE, orange) of the gut to become gut VE (GutVE, blue). Ys also contains embryo-derived mesoderm (YsMes, pink). Black dots, ciliated cells. The schematics of embryos in (A) and beside (C-E) were modified from (21). (B) Wholemount images of Afp-GFP/+ embryos. Extra-embryonic tissue, above dashed line (E6.5, E7.5); Ys, right (E8.75); Pr, proximal; D, distal. (C-F) Immunofluorescent (IF) staining of transverse sections of Afp-GFP/+ embryos. Schematics indicate section level. Arrowheads, ciliated YsMes (F); D, dorsal; V, ventral; epi, epiblast; A, anterior; P, posterior. Scale bar, 1mm (B); 20μm low magnification, 5μm insets (C-F). (G) Quantification of the percentage ciliated emVE and GutVE (E6.0-E8.75), epiblast-derived cells (E6.0-E7.5), and DE (E8.75). Statistical analysis: one-way ANOVA (N=3 embryos/stage). (H) Uniform Manifold Approximation and Projection (UMAP) plot showing clustering of cells (scRNA-seq from (15)). (I, J) Bar plots of the top 6 upregulated biological processes and cilium-related terms in E7.5 emVE (I), the top 8 upregulated biological processes in E8.75 GutVE (J) compared to YsVE. Input gene cutoff log2Fold Change>1; Padj<0.05. Gene sets are ranked by Padj. The numbers in the boxes indicate the number of upregulated genes per total gene number per term. See also table S2, S3. (K) Venn diagram showing the overlap of upregulated cilia genes in GutVE, DE, or YsMes compared to YsVE at E8.75 (N=690 cilia genes, table S1).
To determine if some cilia genes are expressed at a higher level in ciliated cells, we profiled the expression of cilia genes in three ciliated cell types compared to unciliated YsVE. We chose a recently curated list of cilia genes that includes ones that regulate primary and motile cilia formation, and contribute to structure, function, and the transport machinery (N=690, table S1) (7). Some cilia proteins have additional functions outside the cilium and therefore are expressed in most cell types (28, 29). We first asked whether within the VE-lineage a subset of cilia genes is expressed at a higher level in GutVE (ciliated) cells compared with YsVE (unciliated). We subsetted the E5.5-E8.75 DE, emVE, GutVE, and YsVE cells from a single cell RNA-sequencing (scRNA-seq) data set of the early endoderm (21), and as expected the four cell types were represented as clusters by age (Fig. 1H). Differential gene expression analysis between GutVE and YsVE at each age followed by Gene Ontology (GO) enrichment analysis identified cilium organization and cilia assembly terms as significantly upregulated at E7.5 and were in the top 4 signatures at E8.75. (Padj < 0.05; Fig. 1I, J, table S2, 3). Among the cilia genes, 287 genes were significantly upregulated at least 2-fold at E8.75, 157 at E7.5, and 65 at E6.5 in GutVE compared to YsVE (log2FC [Fold Change]>1, Padj<0.05, fig. S2A, B, table S4). 304 genes were significantly upregulated more than 2-fold in at least one stage, with 50 genes upregulated at all three stages (fig. S2B, table S4).
To investigate whether these cilia genes are upregulated in other cell types with primary cilia, we compared the transcriptome of YsVE with its neighbor cells, yolk sac mesoderm (YsMes), or with gut DE. We performed scRNA-seq on E8.75 yolk sac tissue, and cluster analysis identified the expected five cell types (fig. S2C, table S5). Differential gene expression analysis revealed that cilium organization and cilia assembly GO terms were upregulated in E8.75 YsMes compared to YsVE (fig. S2D, E, table S6, 7). These Go terms were also upregulated after comparing E8.75 DE with YsVE (fig. S2F, G, table S8, 9). Curiously, both primary cilia and some motile cilia genes were enhanced in all three ciliated cell types. Interestingly, differential gene expression analysis showed that most of the 287 cilia genes upregulated in E8.75 GutVE compared to YsVE were also upregulated in DE or YsMes compared to YsVE (242/263 genes upregulated in DE, 115/131 upregulated in YsMes), with 110 genes upregulated in all three ciliated cell types at E8.75 (Fig. 1K, fig. S3A, table S10). Thus, we identified a set of 110 cilia genes that have shared upregulation in three ciliated cell types compared to unciliated YsVE at E8.75. Expression across lineages of these shared cilia genes appears to be conserved in human embryos, as the average expression was significantly downregulated in yolk sac endoderm compared to ciliated embryonic cells in human and mouse, whereas the remaining cilia genes were not downregulated (fig. S3B) (30). This finding supports our idea that a transcriptional activator promotes cilia gene expression.
Chromatin accessibility analysis identifies SP/KLF family TFs as binding cilia genes
We next asked if there are TFs that bind to open chromatin in the shared cilia genes (Fig. 2A) by performing assay for transposase-accessible chromatin with sequencing (ATAC-seq) on GutVE and YsMes compared to unciliated YsVE at E8.75 embryos (Fig. 2B). Upon peak calling, cilia genes were enriched in the enhanced open chromatin in GutVE and YsMes compared to YsVE (fig. S4, table S11, 12). 267 of the 690 cilia genes had enhancement of open chromatin in ciliated cells compared to YsVE (log2FC>0, Padj<0.05, table S13). Strikingly, the ATAC-seq analysis showed that of the 110 shared cilia genes, 70 had enhancement of open chromatin in promoter or enhancer regions (N=203 peaks, table S14). Moreover, motif enrichment analysis on these 203 peaks showed that DNA motifs specific to Krüppel-like factor and Specificity protein (KLF/SP) family TFs were significantly enriched (Fig. 2C, table S15). DNA binding motifs for CTCF, CTCFL, Fork head family (FOXP1, FOXA2/3, FOXF1, FOXO3) and TEAD1 were enriched to a lesser extent. Motif analysis of all cilia genes (N=690) with enhanced chromatin regions (N=586 peaks of 267 genes, table S16) also identified the same TF families, except TEAD1, and the motile cilia TFs RFX2, RFX3 were included but in a low percentage of peaks (~6%) (fig. S5A).
Fig. 2. Chromatin accessibility analysis of core ciliome genes in GutVE and YsM compared to YsVE identifies SP/KLF TF families.

(A) Study design, scRNA-seq and ATAC-seq in E8.75 embryo and ChIP-seq in ES cell lines. (B) Schematic diagram showing ATAC-seq sample preparation (left) and scatter plot (right) of sample clustering from principal component analysis (PCA) of GutVE, YsMes, and YsVE (N=3, 4, 4 samples). See also tables S11–15. (C) Enrichment of transcription factor recognition sequences in 203 differential ATAC-seq peaks in 70 of the shared cilia genes in GutVE and YsMes versus YsVE. The list is ranked based on P value. See also table S15. (D) Violin plot showing the log10 CPM (counts per million) expression levels of Sp5 and Sp8 from scRNA-seq data. See also table S17. (E) qRT-PCR quantification of Sp5, Sp8 mRNA expression normalized to Gapdh. (F, G) IF staining of transverse sections for SP8, tdT (VE lineage cells), and DAPI in the gut tube (F) and yolk sac (G) of E8.75 Ttr-Cre/+; R26lsl-tdT/+ embryos. (F’-F’’’, G’-G’’’) Higher magnification images of insets in (F, G). D, dorsal; V, ventral. Scale bar, 50μm, insets 20μm. The schematic of the embryo in (B) and beside (F) was modified from (21). Statistical analyses: Wilcoxon rank-sum test (D), unpaired t-test (E).
KLF/SP family TFs bind to GC-box or GT-box elements in promoters and enhancers and play many roles during development (31). Importantly, among the 26 SP/KLF family genes (Sp1–9, Klf1–17), only two (Sp5, Sp8) were differentially expressed in emVE+GutVE compared to YsVE at E6.5, E7.5 and E8.75 (Fig. 2D, fig. S5B, C, table S17). Moreover, Sp5 and Sp8 expression increased over the time when cilia form (Fig. 2D). Klf3 and Klf12 expression were significantly increased only at E8.75. Furthermore, Klf12 expression was very low in all cell types and KLF3 protein was previously shown to only be detected before E3.5 (fig. S5D) (32). Among Fork head family genes, Foxp1 was the only gene upregulated in GutVE compared to YsVE at the three ages and Foxj1 was low but slightly upregulated in GutVE at E8.75 (fig. S5E). We focused our functional analysis on Sp5 and Sp8 based on their gene expression, high percentage of motif enrichment and being novel candidates to regulate cilia.
SP5/8 mediate WNT/b-catenin signaling in multiple cell types and are expressed in the E8.5 gut endoderm where they promote hindgut extension and colon formation (33–36). To determine if the genes are expressed in the GutVE compartment of gut endoderm, we performed qRT-PCR analysis on E8.75 GutVE and YsVE and found Sp5/8 were expressed in GutVE and not YsVE (Fig. 2E). Immunofluorescence analysis of tissue sections confirmed that SP8 protein is present in gut endoderm, including GutVE, and is low in YsMes and absent from the yolk sac at E7.5 and E8.75 (Fig. 2F, G, fig. S5F, G).
In summary, a screen for motif enrichment in open chromatin regions near cilia genes identified SP5 and SP8 as strong candidates to drive expression of a group of genes associated with cilia formation and function.
SP5/8 bind to and are required for expression of a subset of cilia genes in ES cell-derived gastruloids
Based on previous SP5-Chromatin immunoprecipitation followed by sequencing analysis (ChIP-seq) in mouse embryoid bodies (GSE72989) (35), 139/690 cilia genes were bound by SP5 (N=202 binding sites) (table S17). ChIP-seq was performed to identify genes bound by SP8 in an ES cell line with doxycycline (Dox) inducible FLAG-tagged SP8 (i-Sp8-3xFlag) (35) (Fig. 3A, fig. S6A–C, table S18). EpiSCs were generated for ChIP-seq because they are highly ciliated compared to ESCs (82.2% vs 18.9%). FLAG ChIP-seq data analysis of Dox-induced i-Sp8-3xFlag cells (SP8-FLAG) versus control (no Dox) revealed that SP8 binds to 89/690 cilia genes (N=147 binding sites), 44 of which are shared with SP5 (Fig. 3B). In total, 187 cilia genes are bound by SP5 and/or SP8. SP8 preferentially binds to promoter regions (63.19%, N=78/89), while SP5 binds to promoter regions to a lesser extent (21.78%, N=40/139) (Fig. 3B, 3C, table S19, 20). The composite gene expression for SP5/8 bound cilia genes was significantly higher in GutVE compared to YsVE, and 100/187 genes were expressed at least 2-fold higher in GutVE, DE or YsMes compared to YsVE (Fig. 3D, table S21). The enhanced binding of SP5/8 preferentially occurred in regions of cilia gene open chromatin (Fig. 3E, fig. S6D, S6E). Interestingly, the motile cilia-related TF genes, Foxj1 and Rfx2/3/7 were bound by SP5/8 (fig. S7A). Like Foxj1, Rfx2/3 were expressed at a higher level in ciliated cells than YsVE only at E8.75 (fig. S5C). We also found that among the 564 potential SP5/8 binding sites in cilia genes 98 also have RFX2/3 binding sites (N=214) within 500 bp (fig. S7B).
Fig. 3. SP5/8 bind and activate cilia genes.

(A) Experimental design. (B) Venn diagram showing the overlap of cilia genes bound by SP5 and SP8. See also tables S19, S20. (C) Gene distribution of SP5/8 binding sites in cilia genes. (D) Violin plots showing composite expression levels of SP5/8 bound cilia genes (N=187) in DE, GutVE, and YsVE at E5.5-E8.75. (E) ATAC-seq plots of cilia genes in GutVE, YsMes, YsVE and ChIP-seq tracks of H3K4me3 and SP8-FLAG in EpiSCs and SP5-FLAG in embryoid bodies. Grey boxes indicate significance of the peak comparisons of ATAC-seq and ChIP-seq data. The number above ATAC-seq tracks represents fold change in a single 500 bp peak with Padj<0.05. Y-axis scale was chosen to optimize the visualization of peaks for each sample. (F) Schematic showing derivation of gastruloid spheres from ESCs. (G, H) IF staining of WT and Sp5/8 DKO ESCs derived day 2.5 gastruloid spheres. Yellow arrows indicate ciliated cells; white arrow heads indicate unciliated cells. (I, J) Quantification of the percentage of ciliated cells (I) and cilia length (J) in WT and Sp5/8 DKO gastruloid spheres (N=5 technical replicates/genotype). (K) Volcano plot showing the differential expression of SP5/8 bound cilia genes (N=187) in Sp5/8 DKO vs WT gastruloid spheres (table S22). (L) Overrepresentation analysis of downregulated genes in Sp5/8 DKO vs WT gastruloid spheres showing the enrichment of cilia-related gene sets (table S23). Statistical analyses: Wilcoxon rank-sum test (D), unpaired t-test (I, J). Scale bars, 5μm (G, H).
We next tested whether Sp5/8 are required for expression of cilia genes using gastruloid spheres derived from ESCs (37, 38). In the gastruloids derived from normal controls and Sp5/8 double knockout (DKO) ESCs, the percentage of cells with cilia was decreased by half (23.8% in Sp5/8 DKO vs 48.5% in control) and cilia length was also significantly reduced (0.9µm vs 1.3µm) (Fig 3.G–J). We then applied scRNA-seq analysis to control and Sp5/8 DKO gastruloids and performed differential gene expression analysis. Strikingly, the majority of SP5/8 bound cilia genes were downregulated in the Sp5/8 DKO gastruloids (100/187, table S22), including genes that encode IFT, BBS, NPHP, RFX2/3/7 and motile cilia structure proteins (Fig. 3K). Cilium-related gene sets were highly enriched in the downregulated genes in Sp5/8 DKO gastruloids (Fig. 3L, table S23). Thus, SP5/8 play an important role in maintaining cilia gene expression and cilia formation in cells in culture.
Sp5/8 are required for cilia formation across embryonic cell types
Next, we tested whether Sp5/8 are required for cilia formation in the developing mouse embryo. Sp8 null mutants are lethal around E14, whereas Sp5 mutants are viable with a kinked tail (33, 34, 39). We examined the VE lineage by generating mice with an Sp5 null allele and VE-lineage conditional knock-out (cKO) of Sp8 using Ttr-Cre and including a reporter allele to track the VE-lineage (VE-Sp5/8 cKO) (33). SP8 protein was not detected in the GutVE of VE-Sp5/8 cKO E8.75 embryos (fig. S8A, B). Importantly, the GutVE of VE-Sp5/8 cKO embryos had a significant reduction in the frequency of ciliated cells compared to controls (39.7% of tdT+ gut cells in mutants; 62.8% in littermate controls), as well as a slight decrease in cilia length (1.37µm in mutants vs 1.55µm controls, P=0.0237, Fig. 4A–D). Therefore, SP5/8 play a role in generating cilia and promoting their normal length in the GutVE.
Fig. 4. SP5/8 are required for primary cilia formation across tissues.
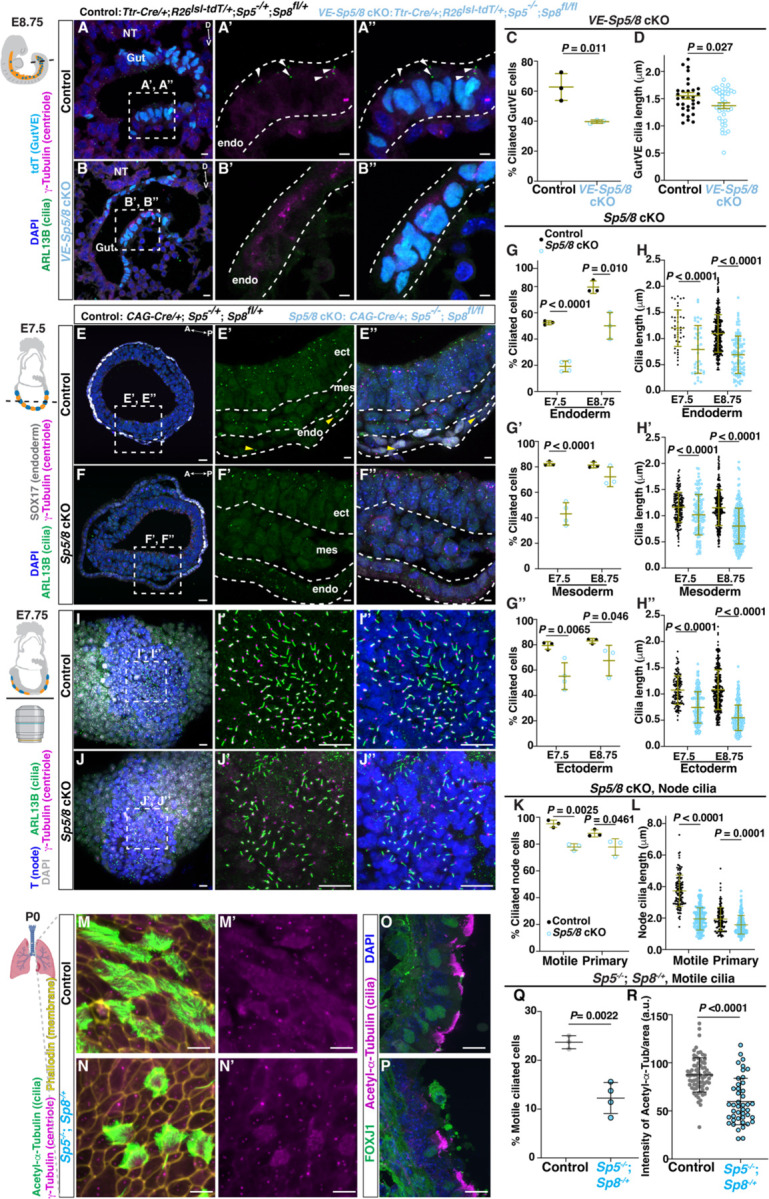
(A, B) IF staining of transverse sections of Control and VE-Sp5/8 cKO embryonic gut tube. Arrowhead, ciliated GutVE; NT, neural tube; D, dorsal; V, ventral. (C, D) Quantification of the percentage of ciliated cells and cilia length (D). (E, F) IF staining of transverse sections of Control and Sp5/8 cKOs. Ect, ectoderm; mes, mesoderm; end, endoderm. Note, in the Sp5/8 cKOs endoderm, ARL13B signal in cytoplasm is unspecific. (G, H) Quantification of the percentage of ciliated cells (G-G’’) and cilia length (H-H’’) in three cell types. n≥3 animals/genotype. (I, J) Maximum intensity projection ventral view of wholemount IF staining of Control (I) and Sp5/8 cKO (J) embryos in the node. (K, L) Quantification of percentage node ciliated cells (K) and cilia length (L) based on their position and Brachyury (T) expression (N=3 embryos/genotype). Motile and primary cilia are distinguished based on their localization at the center of the node (node pitch) or peripheral to it. (M, N) En face imaging of distal part of trachea in control and Sp5−/−; Sp8-/+ P0 neonates stained for cilia and membrane markers. Schematic created from Biorender.com. (O, P) IF staining of sagittal sections of trachea in control and Sp5−/−; Sp8-/+ animals at P0. (Q, R) Quantification of the percentage of motile ciliated cells (Q), and intensity of Acetyl-α-Tubulin fluorescence (R). Scale bar, 20μm (A, B, E, F, I, J); 20μm (M-P); 5μm insets. The schematics of the embryos beside (A, E, I) were modified from (21). Statistical analyses: unpaired t-test (C, D, Q, R), one-way ANOVA (G, H, K, L).
We next employed CAG-Cre to globally delete Sp8 in the Sp5 null mutant background (Sp5/8 cKO). At E10.5 Sp5/8 cKOs displayed the expected truncation of the anterior head and posterior trunk and exencephaly seen in Sp8 null mutants (34), but the phenotype was more extreme in double mutants (fig. S8C). At E7.5, there was an approximately two-fold reduction in the percentage of ciliated cells in all three germ layers (endoderm, mesoderm, and ectoderm) of Sp5/8 cKOs compared to controls, with the strongest defect in endoderm cells marked by SOX17 (GutVE and DE) (Fig. 4E–G). At E8.75, the percentage of cells with cilia continued to be reduced in Sp5/8 cKOs, especially in the gut endoderm (Fig. 4G). Cilia length was also significantly decreased in Sp5/8 cKOs in all three cell types, possibly more severely at E8.75 than E7.5 (Fig. 4H, fig. S8D, E). Importantly, the cilia defect was not due to lack of intercalation of VE and DE in the Sp5/8 cKOs since intercalation was normal (fig. S8H–K). Furthermore, by analyzing single and homozygous/heterozygous double mutant combinations we found that Sp5 and Sp8 both contribute to cilia formation at E8.5 across the three cell types (fig. S8L, M). These results demonstrate a global requirement of SP5/8 in promoting primary cilia formation and length control.
Primary cilia are essential for Sonic hedgehog (SHH) signaling and act through GLI TFs to ventralize the neural tube (40). As expected for a cilia mutant, we found a dorsalization of the neural tube in E10.5 Sp5/8 DKO mutants with a ventral expansion of PAX6+ dorsal progenitors into, and replacing, much of the OLIG2+ motor neuron domain (fig. S9). There was also a major reduction of the SHH target gene Gli1.
Sp5/8 promote motile cilia formation and function
In the early embryo, the node cells are a critical organizing center for gastrulation, and have a single specialized motile primary cilium that is longer than typical primary cilia and generates fluid flow necessary to generate organ asymmetry (2). We detected SP8 protein in the E7.75 node (fig. S10A, B) and Sp5/8 cKO mutants exhibited a significant reduction in the percentage of node cells with motile cilia compared to controls (77.8% vs 95.2%, respectively) and a 50% reduction in node cilia length (1.9µm in mutants vs 3.7µm in controls) (Fig. 4I–L). Primary cilia number in the peripheral node region of Sp5/8 cKO mutants was also reduced (77.8% in mutants vs 88.0%), with a shorter length (1.6µm in mutants vs 1.9µm in controls). Consistent with a defect in node cilia, Sp5/8 double null mutants had altered left-right patterning, as shown by bilateral expression of Nodal and Lefty1/2 at E8.25 (6 somites) (fig. S10C, 10D, E8.25) and randomization of heart looping at E9.5 (40% situs inversus/ambiguous) and lung morphology at E14.0 (57% situs inversus/ambiguous) compared to Sp5−/−; Sp8-/+ controls (fig. S10E–G).
Given that the motile cilia genes Foxj1 and Rfx2/3/7 have binding sites for SP5/8, we next asked whether motile cilia in the lung endoderm and ependymal cells of the brain require Sp5/8 for their normal formation. Although Sp8 cKOs die at E14, we found that Sp5−/−; Sp8-/+ animals die shortly after birth and have spina bifida and limb defects (fig. S11A). Most Sp5−/−; Sp8-/+ animals also had hydrocephalus (fig. S11B). In the distal trachea at P0, we observed a reduction in the number of FOXJ1+ nuclei corresponding to a significant reduction in the percentage of cells with motile cilia and within those cells the intensity of acetylated α tubulin was reduced indicating less and shorter cilia per cell (Fig. 4M–R). The number of centrioles also appeared reduced. Similarly, in the brain we found a significant reduction in the percentage of FOXJ1+ ependymal cells lining the third ventricle, corresponding to a reduction in cilia (ARL13B staining) and centrioles per cell (fig. S11C–E). These findings demonstrate that SP5/8 play a crucial role in promoting motile cilia formation in addition to primary cilia.
SP8 is sufficient to induce primary cilia in unciliated cells
We next tested whether SP8 is sufficient to induce cilia formation in YsVE cells by utilizing a Dox-inducible Sp8 gain-of-function (GOF) mouse allele combined with Ttr-Cre (24) and R26lsl-rtTA-Ires-EGFP (41) alleles and administering Dox daily during E5.5 to 7.5 (VE-Sp8 GOF; fig. S12A). In E8.75 VE-Sp8 GOF embryos SP8 protein was detected in the YsVE (fig. S12B, C) and strikingly cilia were present on 12% of cells compared to none in controls (fig. S12D–G). Furthermore, cilia length was like nonmotile primary cilia (~1.3µm).
A similar strategy was utilized using CAG-Cre to globally induce SP8 expression (Sp8 GOF) (Fig. 5A) and again ~15% of YsVE cells developed cilia. Interestingly, the percentage of YsMes with cilia also increased (Fig. 5B–D). Likewise, in Dox-inducible i-Sp8-3xFlag ES cells the percentage of cells with cilia was increased nearly two-fold from 22% to 35.0% and the average length of cilia was slightly increased (1.3µm in +Dox vs 1.1µm in -Dox, P=0.025, fig. S13A–C).
Fig. 5. SP8 is sufficient to induce primary cilia in YsVE.
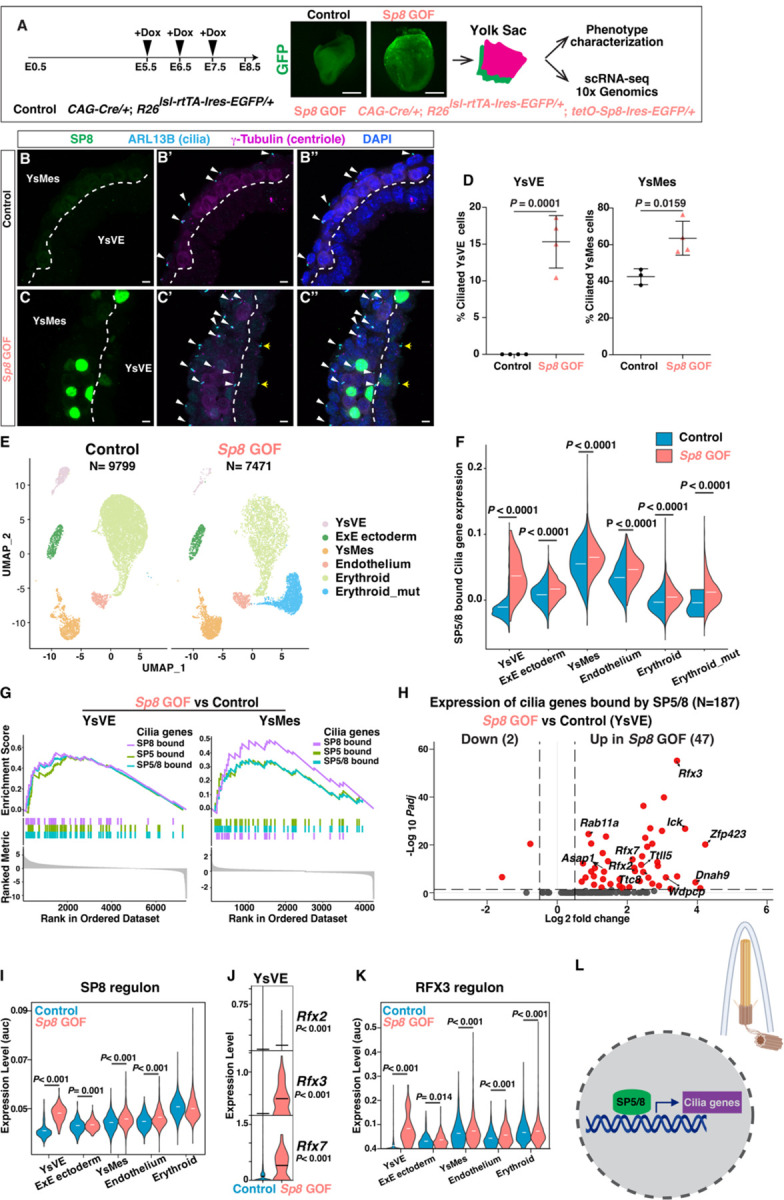
(A) The strategy of global Sp8 gain-of-function (GOF) (top) for phenotype characterization and scRNA-seq analysis in Control and Sp8 GOF E8.75 embryos. (B, C) IF staining of transverse sections of yolk sac tissues from Control (B) and Sp8 GOF (C) E8.5 embryos. White arrowheads, ciliated YsMes; yellow arrows, ciliated YsVE in Sp8 GOF mutants. (D) Quantification of the percentage of ciliated YsVE and YsMes cells in Control and Sp8 GOF yolk sacs (N≥3 tissues/genotype). (E) UMAP plots showing clustering of cell types of Control and Sp8 GOF yolk sac tissues (N=3, 2 replicates). (F) Violin plots showing the gene set expression levels of SP5/8 bound cilia genes (N=187) across cell types in Control and Sp8 GOF yolk sac cell types. (G) Gene set enrichment plots showing that SP5-bound, SP8-bound, or combined SP5/8-bound cilia genes are enriched in Sp8 GOF group vs Control in YsVE and YsMes cell types. (H) Volcano plot showing the differential expression of SP5/8 bound cilia genes in YsVE cells, comparing Sp8 GOF to Control (table S24). (I) Violin plots depicting the AUC (Area Under the Curve) score of SP8 regulon across different cell types in Control and Sp8 GOF samples. (J) Violin plots showing log10 CPM (counts per million) expression levels of Rfx2, Rfx3 and Rfx7 in YsVE of Control and Sp8 GOF samples. (K) Violin plot depicting the AUC score of RFX3 regulon across different cell types in Control and Sp8 GOF samples. (L) Schematic showing SP5/8 bind and activate a set of primary cilia genes (N=130 for SP5, N=84 for SP8), and some motile cilia genes (N=9 for SP5, N=5 for SP8) in the nucleus to promote cilia formation (top right). Scale bars, 250 μm (A), 5μm (B, C). Statistical analysis: unpaired t-test (D, J), Wilcoxon rank-sum test (F, I, K).
SP8 mis-expression using the Dox system in unciliated extraembryonic endoderm (XEN) stem cells (19), a model for primitive endoderm (precursor of VE) also induced cilia, but only in 3.5% of cells with a cilia length of 1.8µm (fig. S13D–L). In addition, overexpression of Rfx2 or Rfx4 were not sufficient to induce cilia formation in XEN cells and ectopic RFX2/4 did not increase cilia formation in the presence of SP8 (fig. S13M). Thus, of these TFs that bind cilia genes and are increased in E8.75 ciliated cells, only SP8 induces cilia.
Mis-expression of SP8 did not appear to change the property of the YsVE since ciliated YsVE maintained expression of the YsVE-specific protein CDH1/E-cadherin (fig. S12D, E). To further investigate the consequences of ectopic cilia formation in Sp8 GOF embryos, we performed scRNA-seq analysis of control (N=3) and Sp8 GOF (N=2) yolk sacs at E8.5 (Fig. 5E, fig. S14A–D). Cluster analysis identified five major cell types in the control and one additional cluster in the mutants. Pseudotime trajectory analysis suggested the new mutant cluster is related to the erythroid lineage (fig. S14E). The overall expression of SP5/8 bound cilia genes was significantly enhanced across all cell types in Sp8 GOF embryos (Fig. 5F). In particular, this gene set was highly enriched in YsVE and YsMes (Fig. 5G). Of the 187 cilia genes bound by SP5/8, 47 were significantly upregulated in Sp8 GOF YsVE, including genes encoding IFT, BBS, RFXs, and other positive regulators of ciliogenesis (Fig. 5H, table S24). Indeed, the regulon activity of SP8 was greatly enhanced across all cell types but erythroid (Fig. 5I). Rfx2/3/7 were among the genes significantly increased in the YsVE, along with RFX3 target genes (Fig. 5J, K). We did not detect cell death in control or Sp8 GOF conditions, thus SP8 does not induce cell death (fig. S15A). Lastly, although mutant YsVE cells form cilia, expression of Gli2 and Gli3 and the SHH target gene Gli1 were very low and not induced in mutant YsVE, whereas they were increased in YsMes that has the machinery necessary for SHH-signaling. Thus, canonical SHH signaling is not induced in YsVE, although Ihh expression was increased (fig. S15B).
In summary, SP8 is sufficient to drive cilia formation in unciliated YsVE in vivo and XEN cells in culture and increase the percentage of ciliated cells, and this is accompanied by activation of SP5/8 target cilia genes (Fig. 5L).
SP5/8 do not regulate cilia formation via the cell cycle
Cilia form during G1/GO and are disassembled before mitosis, and thus changes in cell cycle phases can alter cilia formation (42–44). In normal embryos where most cells are highly proliferative, we found a smaller percentage of ciliated cell types (DE and GutVE) are in G1 than unciliated YsVE at E6.5–8.75 (fig. S16A). Since SP5/8 have been reported to change cell cycle by promoting or inhibiting proliferation in a cell-type dependent manner (45–47), we asked whether loss or gain of SP5/8 alters the cell cycle in our systems. Analysis of Sp8 GOF yolk sac sections did not detect a significant change in the percentage of YsVE cells in late G2-M (phospho-histone H3+) or S phase (EdU+ cells) when SP8 was over-expressed (fig. S16B–G). Cell cycle phase scoring of the scRNA-seq data also indicated the cell cycle phase distributions were not changed across cell types in Sp8 GOF embryos compared to controls, except a possible increase in S phase in YsVE (fig. S16H). Flow analysis showed that the cell cycle distributions also were not altered in ES or XEN cells upon Sp8 overexpression (fig. S17A–D). Furthermore, cell cycle arrest alone did not induce cilia formation in XEN cells or further enhance cilia formation in Sp8 GOF XEN cells (fig. S17E). Finally, on the flip side, loss of Sp5/8 in embryos did not change the percentage of cells in late G2-M or S phase in E8.5 embryonic neural ectoderm or reduce G1 in gastruloids (fig. S17F–J). Thus, SP5/8 do not regulate cilia formation through altering the cell cycle.
Discussion
Previous work proposed that cilia formation is regulated in a lineage-specific manner, such that epiblast-derived cells have cilia and extra-embryonic lineage cells do not (19). While this is the case when the lineages are initially specified and segregated, we uncovered that when emVE intercalates with DE to become GutVE, the cells upregulate a set of cilia genes shared with other ciliated cells (YsMes and DE) and form primary cilia. This process is accompanied by upregulation of Sp5/8 and we found many cilia genes have binding sites for SP5/8. Moreover, Sp5/8 are required across embryonic cell types to increase the percentage of cells that form cilia and promote cilia length, for both primary and motile cilia. Finally, we demonstrate that a single TF, SP8, is sufficient to induce primary cilia in unciliated endoderm cells.
In addition to a reduction in the percentage of cells in the lung and brain that have motile in Sp5−/−; Sp8-/+ neonates, the remaining cells have less cilia and centrioles per cell. Likewise, in Sp5/8 cKO embryos, the length of the motile primary cilia remaining in the node are reduced two-fold but are longer than nonmotile primary cilia in other cell types. Consistent with these phenotypes, the mutants have hydrocephalus and randomization of left-right asymmetry of organs (lung and heart). Likely of relevance, we found that SP5/8 bind and SP8 can activate the expression of several motile cilia TFs (Foxj1, Rfx2/3/7). Since Foxj1 and Rfx3 null mutant mice have defects in node cilia length (8, 15), and Rfx3 mutants have a 40% reduction in pancreas primary cilia and Rfx4 mutants have shorter cilia in the embryonic brain (13, 48), the primary cilia defects observed in Sp5/8 cKOs could in part be indirectly due to a decrease in expression of these TFs. Similarly, the defects in motile cilia length and number per cell in Sp5/8 cKOs could be due to poor activation of Foxj1 and Rfx2/3/7 in the absence of SP5/8. However, our work argues that SP5/8 play a more prominent role than motile cilia TFs in primary cilia formation since in Sp5/8 cKOs the percentage of ciliated cells and average length of cilia are significantly reduced across all cell types. Also, SP5/8 bind a larger number of primary cilia genes than FOXJ1 or RFXs (12, 17, 49).
Canonical WNT signaling was shown to enhance primary cilia formation in hTERT retinal pigment epithelium cells by stabilizing centriole satellite proteins (50). Our study shows that the WNT target gene Sp5 positively regulates primary cilia formation in the mouse embryo and ES cells. We therefore suggest that WNT signaling acts, at least in part, at the transcriptional level by inducing Sp5 gene expression and then SP5 induces expression of its target cilia genes to enhance cilia formation.
Given our findings that SP5/8 bind key TFs regulating motile cilia and motile cilia are reduced in Sp5/8 mutants, SP5/8 are upstream in both the motile and primary cilia networks. However, although over-expression of SP8 in ES cells causes a slight increase in cilia length, the length of the extra cilia generated, or ectopic cilia in unciliated cells, is in line with primary cilia, and the cells have a single cilium. Thus, SP5/8 are not sufficient to induce motile cilia, at least in the time frame and systems we have analyzed. This is the case even when SP8 is co-expressed with RFX2 or RFX4 in XEN cells. Thus, SP5/8 are at the top of a transcriptional network activating primary and motile cilia genes but are only sufficient to induce primary cilia. SP5/8 therefore should be considered as candidate genes mutated in human ciliopathies.
Materials and Methods
Mouse husbandry
The following mouse strains were used: Afp-GFP (23), Ttr-Cre (24), R26lsl-tdT/+ (25), Fgf8CreER/+ (26), Strip1fl/+ (27), Sp8fl/fl (33), Sp8-/+ were generated from Sp8fl/+ mice, tet-O-Sp8-Ires-EGFP (35), Sp5lacZ/lacZ (Sp5−/−) (39), R26lsl-rtTA-Ires-EGFP (41), CAG-Cre (51), Sox2-Cre (52), R26mTmG/+ (53). Animals were maintained on an outbred Swiss Webster background. For embryonic stage, noon of the day that a vaginal plug was detected was designated as E0.5. All animal experiments were performed per the protocols approved and guidelines provided by the Memorial Sloan Kettering Cancer Center’s Institutional Animal Care and Use Committee (IACUC). Animals were given access to food and water ad libitum and housed on a 12 hour light/dark cycle. Mice were randomly chosen for analysis with no exclusions and using both males and females. Because some genotypes have a phenotype, blinding was not always possible.
For inducible SP8 expression, Doxycycline (Sigma) was administrated by gavage (10mg/ml in water and 0.2ml per animal daily) to pregnant females from E5.5–7.5 to induce Sp8 expression.
Cell lines
i-Sp8-3xFlag ESCs were generated as previously reported (35). Sp5/8 DKO ESCs were generated from R1 ESCs by Amaxa nucleofection (Lonza, VPH-1001) using CRISPR-cas9/gRNA ribonucleoprotein complex following manufacturer’s instructions. For targeting Sp5, two gRNAs: GGAGTAGCCCGGGGGCAACG and CGCTTCGCTTGTCCCGAGTG were used to delete a 3’ region of Exon-2 encoding a 3x Zn-finger domain and for Sp8, two guides: AGAGGAGTGGATCCCAACCT and GGACCCCCCTAACTGCGCCG were used to delete the coding region in Exon-3. The nucleofection of Cas9/gRNA complex and pMax-GFP cocktail solution was performed in 2,000,000 cells using Amaxa Nucleofector (Lonza). One day after nucleofection, GFP-positive cells were sorted using SONY SH800 (Sony), and 300,000 cells were plated onto gelatin-coated 150 mm dish for picking single colonies. Genomic deletion was confirmed by Sanger sequencing (Psomagen, Rockville, MD).
i-Sp8-3xFlag ESCs were maintained on 0.1% gelatin-coated dishes in ESC media that contained KnockOut DMEM (Gibco) supplemented with 15% fetal bovine serum (HyClone), 2mM L-glutamine (Gibco), 0.1mM β-mercaptoethanol (Gibco), 0.1 mM non-essential amino acids (Gibco), 1 mM sodium pyruvate (Gibco), 1% v/v penicillin and streptomycin (Gibco), 1,000 units/mL leukemia inhibitory factor (LIF, Millipore), 1μM PD0325901 and 3μM CHIR99021 (Stemgent). Sp5/8 DKO and R1 ESCs were cultured in the ES medium described above except without 2i (PD0325901 and CHIR99021) as described (37).
i-Sp8-3xFlag EpiSCs were generated from i-Sp8-3xFlag ESCs following a reported protocol (54). Briefly, ESCs were disassociated using Accutase (0.5mM EDTA, Innovative Cell Technologies) and plated on fibronectin-coated plates (16.7µg/ml solution, Millipore) at a density of 17,500 cells/cm2 on mitomycin-treated embryonic fibroblast feeder cells in N2B27 media supplemented with 12.5ng/ml heat-stable recombinant human β-FGF (PeproTech) and 20ng/ml activin A (PeproTech). EpiSC were cultured in the same medium on feeder cells for 2 passages before ChIP-seq. N2B27 media consisted of 50% DMEM-F12 (Gibco), 50% Neurobasal medium (Thermofisher), 0.5% N2 supplement (Thermofisher), 1% B27 supplement without vitamin A (Thermofisher), 2mM GlutaMAX (Gibco), 1% penicillin/streptomycin and 0.1µM β-mercaptoethanol.
Control and VE-Sp8-GOF XEN cell lines (N=3/genotype) were derived from E3.5 Ttr-Cre/+; R26lsl-rtTA-Ires-EGFP/+ and Ttr-Cre/+; R26lsl-rtTA-Ires -EGFP/+; tet-O-Sp8-Ires-EGFP/+ mouse blastocysts respectively using a protocol described previously (55). Briefly, mouse blastocysts were flushed from dissected uteri of pregnant females using embryo max M2 medium (Millipore). Blastocysts were then transferred using a mouth pipette onto a 0.1% gelatin-coated plate with mitomycin-treated mouse embryonic fibroblast feeder cells in ESC medium with 15% serum and LIF (Millipore). After 3 passages, feeder cells were removed and XEN cells were maintained on 0.1% gelatin-coated plastic dishes and cultured in RPMI1640 (pH 7.2) media (Gibco) supplemented with 15% fetal bovine serum, 2mM L-glutamine, 0.1mM β-mercaptoethanol, 0.1mM non-essential amino acids, 1mM sodium pyruvate and 1% v/v penicillin and streptomycin. The GOF of Sp8 genotype was confirmed by GFP fluorescence after incubation with Doxycycline for 48 hours.
VE-Sp8 GOF XEN cells were treated with cell cycle arrest drugs to block cell cycle progression using compounds listed in table S25.
Control and Sp8 GOF XEN cells were transfected with lentivirus carrying Dox inducible expression modules for Rfx2 (pCW57-RFP-P2A-MCS-Rfx2), Rfx4 (TetO-FUW-Rfx4) or Empty vector (pCW57-RFP-P2A-MCS). Construct information is listed in table S25.
Gastruloid sphere derivation
Gastruloids were derived from 300 R1 and Sp5/8 DKO ES cells in 96 well ultra-low attachment dishes for 48 hours and treated with CHIR (3μM) from D2 to D2.5 (38). Gastruloid spheres were collected at Day 2.5 for single-cell RNA sequencing (paper in preparation (Chalamalasetty et al)). Immunostaining of cilia was performed using a previously published protocol (37, 38).
Immunofluorescent staining, whole-mount embryo imaging and histology
For immunofluorescent (IF) staining of ESCs, cells were plated on gelatin-coated chambers (Ibidi), rinsed twice with PBS and fixed in 4% paraformaldehyde (PFA) for 10 min at room temperature (RT). After fixing, cells were washed twice with PBS and permeabilized with PBS containing 0.5% Triton X-100 (PBST) for 10 min at RT and blocked for 60 min with blocking buffer (0.1% PBST and 5% normal donkey serum).
For IF of embryo sections, embryos were fixed in 4% PFA at 4°C overnight, embedded in optimal cutting temperature compound (OCT), and cryosectioned at 12μm. Slides were air-dried for 10 min at RT and then washed in PBS for 10 min. Slides were permeabilized with 0.5% PBST for 10 min at RT and blocked with blocking buffer for 1 hour.
Primary antibodies were diluted in blocking buffer and placed on cells or slides overnight at 4℃. Cells or slides were washed three times in 0.1% PBST for 5 min and then incubated with secondary antibodies (Alexa Fluor conjugated secondary antibodies) diluted at 1:500 in blocking buffer at room temperature for 1 hour. Counterstaining was performed using DAPI (1:1000, Invitrogen). The cells or slides were washed three times in 0.1% PBST for 5 min each before cover slipping using Fluorogel mounting medium (Electron Microscopy Sciences). Primary and secondary antibodies and their related concentrations are listed in table S25.
For IF of whole-mount embryos, embryos were dissected and fixed with 4% PFA overnight at 4℃. After washing twice with PBS, embryos were permeabilized in 0.5% PBST for 10 min, washed, and blocked in blocking solution at RT for 1 hour, and incubated with the primary antibody diluted in blocking solution at 4°C overnight. Embryos were washed three times in 0.1% PBST at RT for 1 hour, incubated with secondary antibody at RT for 1 hour, washed three times in 0.1% PBST, and imaged in PBS on a glass-bottomed MatTek dish (MatTek). Chromogenic whole-mount in situ hybridization of E9.5 embryos and β-galactosidase staining of E14 lungs were performed as described previously (36).
For Hematoxylin and eosin staining, coronal sections of mouse brain were stained with Hematoxylin and Eosin (Thermo Fisher Scientific) (H&E) according to the protocol from the manufacturer. Images were collected on a Nanozoomer 2.0 HT slide scanner.
Whole Mount In situ Hybridization
Split initiator probes (V3.0) for mouse T/Bra, Nodal and Lefty1/2 were synthesized by Molecular Instruments, Inc. HCR-RNA Fluorescent In situ Hybridization was performed as described (56). Briefly, E8.25 embryos were harvested in PBS, fixed in 4% PFA overnight at 4°C and dehydrated. For HCR, embryos were rehydrated, permeabilized with 10mg/ml proteinase K for 15 min at room temperature and post-fixed in 4% PFA for 20min. Embryos were pre-incubated in probe hybridization buffer followed by an overnight incubation in probe solution at 370C. Embryos were washed the next morning and pre-incubated in amplification buffer. For amplification, embryos were incubated in 60 pmol of each hairpin per 0.5ml of amplification buffer for 16 hour at RT in the dark (36). Embryos were washed in 5x SSCT buffer and stained in 0.5mg/ml of DAPI solution in 5x SSCT buffer overnight at RT. The stained embryos were embedded on glass bottom dishes (MatTEK) and oriented in 1% ultra-low-melt agarose. Embryos were cleared using Ce3D++ solution at RT for at least 2–3 days in the dark.
RNA in situ hybridization of Gli1 mRNA in section was performed as described using antisense RNA probes for Gli1 (57). The templates for Gli1 were generated by PCR using primers containing T3 polymerase promoters from postnatal cerebellum cDNA.
TUNEL (terminal deoxynucleotidyl transferase dUTP nick end labeling) assay
Slides were first permeabilized with 0.5% Triton X-100, and pre-incubated with Tdt buffer (30 mM Tris-HCl, 140 mM sodium cacodylate and 1 mM CoCl2) for 15 min at room temperature. Slides were then incubated in a TUNEL reaction solution [containing terminal transferase (Roche, 3333574001) and Biotin-16-dUTP (Sigma-Aldrich, 11093070910)] for 1 hour at 37°C. Following the TUNEL reaction, slides were incubated in a Streptavidin Alexa Fluor 647 conjugate (Invitrogen, S-32357) for 1 hour. Slides were then washed in PBS twice for 5 min each followed by a 10 min incubation in DAPI. Prior to coverslipping using Fluorogel mounting medium (Electron Microscopy Science), slides were washed with PBS twice for 5 min each.
EdU labeling and detection
For cultured cells, 10 μM EdU (5-ethynyl-2'-deoxyuridine) was added to the culture medium of ESCs and XEN cells for 1hour before collection. Cells were then disassociated with 0.05% Trypsin, fixed with 4% PFA for 10 min, followed by labeling with Click-IT kit using Sulfo-Azide-Cy5 (Lumiprobe cat: A3330) and DAPI. The cells were then applied to flow cytometry analysis (Fortessas, BD). FlowJo software was used to visualize and analyze the intensity of DAPI and EdU-Cy5 fluorescence.
To quantify cell proliferation in the neural tube of embryos, EdU (Invitrogen) was injected intraperitoneally into dams at 100 mg/g 1 hour before euthanasia. A Click-it EdU kit using Sulfo-Azide-Cy5 (Lumiprobe Corporation A3330) was used per the manufacturer’s protocol to stain sections.
Transmission electron microscopy
Transmission electron microscope was performed as described previously (58). Briefly, yolk sac tissues were collected from E8.75 mouse embryos, fixed in 2% PFA, 2.5% glutaraldehyde, and 2 mM calcium chloride in 0.075 M sodium cacodylate buffer, pH 7.4. Yolk sac tissue was then treated with 0.1% tannic acid and washed in sodium cacodylate buffer, postfixed with 1% osmium tetroxide for 1 hour, and stained en bloc with uranyl acetate for 30 min. Tissue was then dehydrated in a graded series of ethanol, washed with acetone, and embedded in resin (Eponate12; Electron Microscopy Sciences). After polymerization at 60°C for 48 hours, ultrathin serial sections were cut, poststained with 2% uranyl acetate and 1% lead citrate, and imaged in a TEM (100CX; Jeol) with a digital imaging system at room temperature (XR41-C; AMT). Images were acquired at 80 kV. To improve clarity, some images were adjusted in Photoshop (Adobe Systems). In every case, all pixels in the image were adjusted uniformly, and all panels within a figure were adjusted with identical settings.
Imaging
Wholemount embryos and sections were digitally imaged on a Nikon A1R HD25 laser scanning confocal microscope and deconvolved using Denoise AI tool on NIS-Elements. Sections and images for quantification were imaged on an inverted DeltaVision Image Restoration Microscope with a deconvolution function. For whole mount in situ imaging, acquired optical sections (3.3µm) were analyzed with Imaris software (Bitplane, Inc).
Reverse Transcription Quantitative PCR
RNA was extracted from cells using the Trizol standard method (Invitrogen). Coding DNA was synthesized from 1–2.5μg total RNA of biological triplicates (per each condition) by reverse transcription using oligo(d)T and random primers with SuperScript IV VILO (Thermofisher). The cDNA samples were diluted at 1:10, and 2.5μl of the diluted cDNA was used for reverse transcription quantitative PCR (RT-qPCR) of the candidate genes with SYBR Green Master Mix (Qiagen) on a StepOnePlus Real-Time PCR System (Life Technologies). Relative expression was calculated using the 2-ΔΔCt method. The relative mRNA level was normalized to the reference gene Gapdh for data normalization. (Sequence of primers listed in table S25).
Assay for Transposase-Accessible Chromatin (ATAC) and sequencing
ATAC-seq was performed as previously described (59), with minor modifications. The yolk sac and gut tube were dissected from E8.75 (12 somite) Afp-GFP/+ embryos. Yolk sacs or gut tubes were washed in ice-cold DMEM/F12 and incubated for 45 min and 20 min, respectively, at 37°C in Accutase/0.25% Trypsin (Gibco) (1:2) to dissociate cells into single cells. Single-cell suspensions were incubated with DAPI to label dead cells for 5 min on ice and filtered through cell strainers prior to performing fluorescence-activated cell sorting (Aria-51, BD) to obtain high viability YsVE (GFP+) and YsMes (GFP-) cells from yolk sac samples and GutVE (GFP+) from gut tube samples.
For library preparation from the sorted cells described above was prepared according to the Omni-ATAC protocol. Briefly, 10,000–30,000 cells per sample were lysed using 0.1% NP-40, 0.1% Tween, and 0.01% Digitonin (Promega) to yield nuclei. The resulting chromatin was fragmented and tagmented using Tn5 transposase (Illumina). DNA was purified using a Qiagen MinElute Reaction Cleanup Kit (Qiagen) and amplified using NEBNext® High-Fidelity 2X PCR Master Mix (NEB). The number of cycles was estimated by qPCR. DNA tagmentation efficacy was evaluated with a Bioanalyzer 2100 (Agilent Technologies) and the DNA amounts were calculated with Qubit. Libraries were prepared using universal forward and reverse primers from Ad2.1-Ad2.24. The final libraries were purified using a single left-handed bead purification with AMPure beads (Beckman Coulter). The resulting DNA libraries were sequenced using the NextSeq550 system (Illumina), and about 25 million reads were obtained per sample by the MSKCC IGO core facility.
Chromatin immunoprecipitation (ChIP) and sequencing
i-Sp8-3xFlag EpiSCs were treated with or without Doxycycline (1μg/ml) for 24 hours, and fixed in 1% formaldehyde for 10 min, after which the reaction was quenched by the addition of glycine to the final concentration of 0.125M. Fixed cells were washed twice with PBS, snap frozen and store at −80°C. Frozen cell pellets were sent to MSKCC Epigenetics Research Innovation Lab for processing. Cells were resuspended in SDS buffer (100mM NaCl, 50mM Tris-HCl pH 8.0, 5mM EDTA, 0.5% SDS, 1x protease inhibitor cocktail from Roche). The resulting nuclei were spun down, resuspended in immunoprecipitation buffer at 1 mL per 0.5 million cells (SDS buffer and Triton Dilution buffer (100mM NaCl, 100mM Tris-HCl pH 8.0, 5mM EDTA, 5% Triton X-100) mixed in 2:1 ratio with the addition of 1xprotease inhibitor cocktail (Millipore Sigma, #11836170001) and processed on a Covaris E220 Focused-ultrasonicator to achieve an average fragment length of 200–300 bps with the following parameters: PIP=140, Duty Factor=5, CBP/Burst per sec=200, Time=1800s. Chromatin concentrations were estimated using the Pierce™ BCA Protein Assay Kit (ThermoFisher Scientific) according to the manufacturer’s instructions. Chromatin equal to 25M cells was used per ChIP reaction. The immunoprecipitation reactions were set up in 500uL of the immunoprecipitation buffer in Protein LoBind tubes (Eppendorf) and pre-cleared with 50uL of Protein G Dynabeads (ThermoFisher Scientific) for 2 hours at 4°C. After pre-clearing, the samples were transferred into new Protein LoBind tubes and incubated overnight at 4°C with 5ug of Flag antibody (Millipore Sigma) and H3K4me3 antibody (Epicypher). The next day, 50μL of BSA-blocked Protein G Dynabeads were added to the reactions and incubated for 2 hours at 4°C. The beads were then washed two times with low-salt washing buffer (150mM NaCl, 1% Triton X-100, 0.1% SDS, 2mM EDTA, 20mM Tris-HCl pH8.0), two times with high-salt washing buffer (500mM NaCl, 1% Triton X-100, 0.1% SDS, 2mM EDTA, 20mM Tris-HCl pH8.0), two times with LiCL wash buffer (250mM LiCl, 10mM Tris-HCl pH8.0, 1mM EDTA, 1% Na-Deoxycholate, 1% IGEPAL CA-630) and one time with TE buffer (10mM Tris-HCl pH8.0, 1mM EDTA). The samples were then reverse-crosslinked overnight in the elution buffer (1% SDS, 0.1M NaHCO3) and purified using the ChIP DNA Clean & Concentrator kit (Zymo Research, #D5205) following the manufacturer’s instructions. After quantification of the recovered DNA fragments, libraries were prepared using the ThruPLEX®DNA-Seq kit (R400676, Takara) following the manufacturer’s instructions, purified with SPRIselect magnetic beads (B23318, Beckman Coulter), and quantified using a Qubit Flex fluorometer (ThermoFisher Scientific) and profiled with a TapeStation (Agilent). The libraries were sent to the MSKCC Integrated Genomics Operation core facility for sequencing on an Illumina NovaSeq 6000 (aiming for 30–40 million 100bp paired-end reads per library).
ChIP and ATAC-seq data analysis
ChIP and ATAC sequencing reads were trimmed and filtered for quality and adapter content using version 0.4.5 of TrimGalore (https://www.bioinformatics.babraham.ac.uk/projects/trim_galore), with a quality setting of 15, and running version 1.15 of cutadapt and version 0.11.5 of FastQC. Reads were aligned to genome assembly mm10 using Bowtie2 (v2.3.4.1, http://bowtie-bio.sourceforge.net/bowtie2/index.shtml) and were deduplicated using MarkDuplicates (v2.16.0) of Picard Tools. To ascertain regions of chromatin accessibility, MACS2 (https://github.com/taoliu/MACS) was run with a p-value setting of 0.001 against a matched input sample. The bedtools suite (http://bedtools.readthedocs.io) was used to create normalized read density profiles by extending the 3’ end of the aligned fragments 200 bp for ChIP and 0 bp for ATAC and then normalizing to 10M uniquely mapped reads. A global peak atlas was created by first removing blacklisted regions (blacklists/mm10mouse/mm10.blacklist.bed.gz), then taking 500 bp windows around peak summits for ATAC and the entire peak region for ChIP and counting reads with version 1.6.1 of featureCounts (http://subread.sourceforge.net). DESeq2 was used to normalize read density (median ratio method) and to calculate differential enrichment for all pairwise contrasts. Peaks were annotated to genomic elements such as transcription start sites (TSS), transcription termination sites (TTS), exons, and introns using GENCODE version M17. Peak intersections were calculated using bedtools v2.29.1 and intersectBed with 1 bp overlap. Motif signatures were obtained using Homer v4.5 (http://homer.ucsd.edu). Composite and tornado plots were created using deepTools v3.3.0 by running computeMatrix and plotHeatmap on normalized bigwigs with average signal sampled in 25 bp windows and flanking region defined by the surrounding 2 kb. Peaks (regions of enrichment) were visualized using IGV (v2.16.0).
Single cell RNA-sequencing (scRNA-seq)
For the normal E8.75 embryos sample preparation, single cells were obtained as previously reported (15). Briefly, yolk sacs from three E8.75 embryos (12 somites) were dissected in DMEM/F12 with 5% FBS. Cells were dissociated with Trysin/Accutase for 15 min at 37°C. Cell clumps were triturated into single cells by mouth-pipetting using pulled (Sutter Instruments) 75mm glass capillaries. To remove debris, single-cell suspensions were filtered through FlowMI cell strainers (40μm, Sigma-Aldrich). Single cells were then spun at 450g for 4 min at RT and resuspended in PBS+0.04% BSA. Cell numbers and viability were determined using 0.2% (w/v) Trypan Blue on a hemocytometer. Single-cell suspensions of biological repeats were labeled with a Cell Multiplexing Oligo (10x Genomics 3’ CellPlex Kit) and then pooled together prior to loading onto a 10x Genomics chip (Chromium Next GEM Chip G). Following the manufacturer's instructions, single-cell libraries were prepared using 3' CellPlex Kit. After PicoGreen quantification and quality control by Agilent TapeStation, final libraries were sequenced on Illumina NovaSeq S4 platform (R1–28 cycles, i7–8 cycles, R2–90 cycles). The cell-gene count matrix was constructed using the Sequence Quality Control (SEQC) package (60).
For Sp8 GOF scRNA-seq, single cells were obtained from E8.5 Control and Sp8 GOF embryos as described above. Yolk sac tissues from 2 embryos per sample (N=2 per condition) were dissociated and filtered as described above. Single-cell suspensions were incubated with DAPI to label dead cells for 5 min on ice and filtered through cell strainers, followed by fluorescence-activated cell sorting (Aria-51, BD) to obtain single and high-viability cell suspensions. 9K-15K single-cell suspensions were loaded onto a 10x Genomics chip (Chromium Next GEM Chip G).
Following the manufacturer's instructions, single-cell libraries were prepared using 10X Genomics’ Chromium Next GEM Single Cell 3’ Reagent Kits, v3.1. After PicoGreen quantification and quality control by Agilent TapeStation, final libraries were sequenced on Illumina NovaSeq X platform. The cell-gene count matrix was constructed using the Sequence Quality Control (SEQC) package (60).
scRNA-seq data analysis
For E8.75 yolk sac scRNA-seq data, the Cell Ranger Single Cell software suite (10x Genomics) was used to demultiplex samples, align reads, and generate feature-barcode matrices. The reference genome used was the Genome Reference Consortium Mouse Build 38 (GRCm38, Gencode annotation mm10). Raw reads were processed using the Cell Ranger count program using default parameters.
For E8.5 Sp8 GOF yolk sac scRNA-seq data, the Cell Ranger Single Cell software suite (10x Genomics) was used to align reads and generate feature-barcode matrices. The reference genome used was the Genome Reference Consortium Mouse Build 38 (GRCm38, Gencode annotation mm10). Raw reads were processed using the Cell Ranger count program using default parameters.
For both of these scRNA-seq studies, Seurat v4.3.0 package was used to generate a UMI (unique molecular identifier) count matrix from the Cell Ranger output (54). Genes expressed in less than 10 cells were removed for further analyses. Cells with larger than 500 UMIs, 250 genes, 0.20 mitoRatio, or log10GenesPerUMI ≤ 0.75 were considered low quality/outliers and discarded from the datasets. For the E7.5 yolk sac analysis, normalization was performed on individual samples using the logTransform function. For the E8. 5 Sp8 GOF yolk sac scRNA-seq data normalization was performed on individual samples using the NormalizeData function with default parameters. The normalized data was scaled by ScaleData function with mitochondrial genes percentage regressed out. Principal component analysis (PCA) was performed on the scaled data by runPCA. Samples were then integrated using IntegrateLayers function with the Harmony Integration method.
Samples were then integrated using the Harmony Integration functions. For all analyses, the first 15 dimensions were used for the FindNeighbors function, and clusters were identified using the FindClusters function with a resolution of 0.1. Data were projected into the 2D space using the FindUMAP or RunUMAP function with 15 dimensions. Cluster markers and further differential gene expression analyses were all performed using normalized counts (NormalizeData) in the RNA assay. Cluster markers were identified using the FindAllMarkers and comparing markers generated to existing literature. To refine clustering further, the SubsetData function was used to create a new Seurat object, and the above clustering was reiterated.
For the gastruloid sRNA-seq analysis, we used STARSolo (STAR v. 2.7.9a) to map control and Sp5/8 DKO libraries to the same reference genome (63). Raw count matrices were processed with CellBender v. 0.3.2 using default parameters (64), then used to create individual Seurat v. 5.1.0 objects. For each object, we removed genes expressed in fewer than three cells and cells with fewer than 200 genes, and excluded cells beyond three median absolute deviations for mitochondrial transcript percentage, feature count, or UMI count. We then used DoubletFinder v. 2.0.4 to remove the top 7.5 % most likely doublets (65). Filtered objects were merged, log-normalized (NormalizeData, scale = 10 000), variable features identified (FindVariableFeatures, n = 2 000), and data scaled (ScaleData, regressing out mitochondrial RNA and cell-cycle scores). We ran PCA on the 2 000 variable features (RunPCA), integrated samples via IntegrateLayers with Harmony, and identified differentially expressed genes between control and Sp5/8 DKO using FindMarkers.
For publicly available scRNA-seq data, the endoderm scRNA-seq raw data were downloaded from GSE123046 (21), and the Seurat package was used to generate a Seurat object following the standard workflow described above. DE (E7.5 and E8.75 DE derived gut endoderm cells), emVE + GutVE (E5.5 to E7.5, and E8.75 GutVE derived gut endoderm cells), and exVE + YsVE (E5.5 to E8.75) were further subsetted and re-clustered for downstream data visualization and differential gene expression analysis.
Differential gene expression analyses between GutVE, DE, and YsMes compared to YsVE were performed using the Libra algorithm with the edgeR-LRT pseudobulk method (61). Genes with an adjusted P value (Padj) < 0.05 were considered significantly up or downregulated. Results were visualized by Violin plot and Umap plot using Seurat package, and Volcano plot using the EnhancedVolcano package on Bioconductor. Gene ontology analyses were performed separately on up and downregulated genes using the enrichGO, clusterProfiler packages on Bioconductor (62). To build a pseudotime trajectory on UMAP, Seurat object was converted to monocle 3 (1.3.7) object by as.cell_data_set function(66, 67). Cells were then clustered by cluster_cells function. The trajectory each partition was constructed by learn_graph followed by order_cells function. Regulon activity was computed by SCENIC (1.3.1) R package as previously described (68).
Human CS7 scRNA-seq data was downloaded from ArrayExpress (E-MTAB-9388) (30), and the Seurat package was used to generate a Seurat object following the standard workflow. YsMes, Gut endoderm and YsE cell types were further subsetted using Subset function, and plot gene expression using Doheatmap function of Seurat package.
Statistics
All statistical analyses of quantified data were performed using Prism software (GraphPad v10.2.3). The statistical analysis used for each figure is described in the figure legends. Data (shown as scatter graphs) are presented as mean±standard deviation (S.D.). Student unpaired Two-tailed t-test was used to compare two conditions; one-way ANOVA using an FDR method (Benjamini and Hochberg) was used to compare two experimental groups; two-way ANOVA followed by Tukey’s multiple comparison test was used for group analysis. P values were indicated in the figure/legends. The statistical significance of the SP5/8 ChIP tracks overlap with the cilia gene open chromatin, and of ATAC-seq genes/peaks overlap with cilia gene list was calculated using a two-sided Fisher’s exact test. The statistical significance of gene/gene module expression of scRNA-seq data was calculated using Wilcoxon rank-sum test.
Supplementary Material
Acknowledgments:
We thank members of Joyner lab for helpful discussions and especially Anjana Krishnamurthy and Sumru Bayin for providing advice on the scRNA-seq experiments and Andrew Lee for advice on analyzing cilia in the brain. We also thank Junmin Pan (Tsinghua University) for insightful comments on the manuscript; Meng-Fu Bryan Tsou (MSKCC) for comments on the manuscript and sharing CEP162 antibody; Jennifer Zallen (MSKCC) for providing R26mTmG; Strip1fl/fl mice; Sonja Nowotschin for providing an Illustrator file from which to modify the schematics of embryos; Yosip Kelemen (Weill Cornell Medicine) for data processing for Regulon analysis; Bumsoo Kim and Joo-Hyeon Lee (MSKCC) for advice on trachea staining and data analysis. We are grateful to the following cores for their expertise: the Rockefeller University EM facility for TEM sample preparation and imaging, and the MSKCC Epigenetics Research Innovation Lab, Single-cell Analytics Innovation Lab (SAIL), Integrated Genomics Operation, Center for Comparative Medicine and Pathology, and Flow cytometry facility. This work utilized the computational resources of the NIH HPC Biowulf cluster (https://hpc.nih.gov). Y.L. and A.L.J. dedicate this manuscript to the memory of their late colleague Kathryn V. Anderson who provided continuous scientific inspiration and support. Kathryn also provided valuable mentorship to YL in the early stages of the work.
Funding:
National Institutes of Health grant R01GM126124 (ALJ, KVA)
National Institutes of Health grant R01HD035455–24 (ALJ, KVA, AKH)
National Institutes of Health grant CCSG, P30 CA08748 (ALJ, AKH, SV)
National Institutes of Health grant R01DK127821 (AKH)
Cycle for Survival GC-223397 (ALJ)
National Institutes of Health NCI, 1ZIABC010345 (TPY)
Funding Statement
National Institutes of Health grant R01GM126124 (ALJ, KVA)
National Institutes of Health grant R01HD035455–24 (ALJ, KVA, AKH)
National Institutes of Health grant CCSG, P30 CA08748 (ALJ, AKH, SV)
National Institutes of Health grant R01DK127821 (AKH)
Cycle for Survival GC-223397 (ALJ)
National Institutes of Health NCI, 1ZIABC010345 (TPY)
Footnotes
Data and Materials Availability:
Raw fastq sequencing files and output files of normal and Sp8 GOF yolk sac scRNA-seq experiments are available at the GEO repository under the accession numbers GSE274844 and GSE293888. The scRNA-Seq data for the Gastruloid spheres are available at the GEO repository under the accession numbers GSE296732. Raw fastq sequencing files for ATAC-seq, ChIP-seq datasets and bigwig files for displaying read density tracks have been submitted to the GEO repository under the accession numbers GSE273919, GSE273920. All deposited data will be publicly available as of the date of publication. This paper does not report any original code; code resources and minor modifications are described in the Methods. Scripts for Sp8 GOF yolk sac scRNA-seq data analysis are available at http://github.com/stevehxf/Cilia_Science2025.
Any materials not publicly available through GEO or GitHub are available by contacting ALJ or YL.
References and Notes
- 1.Anvarian Z., Mykytyn K., Mukhopadhyay S., Pedersen L. B., Christensen S. T., Cellular signalling by primary cilia in development, organ function and disease. Nat Rev Nephrol 15, 199–219 (2019). [DOI] [PMC free article] [PubMed] [Google Scholar]
- 2.Goetz S. C., Anderson K. V., The primary cilium: a signalling centre during vertebrate development. Nat Rev Genet 11, 331–344 (2010). [DOI] [PMC free article] [PubMed] [Google Scholar]
- 3.Reiter J. F., Leroux M. R., Genes and molecular pathways underpinning ciliopathies. Nat Rev Mol Cell Biol 18, 533–547 (2017). [DOI] [PMC free article] [PubMed] [Google Scholar]
- 4.H. M. Mitchison, E. M. Valente, Motile and non-motile cilia in human pathology: from function to phenotypes. J Pathol 241, 294–309 (2017). [DOI] [PubMed] [Google Scholar]
- 5.Santos N., Reiter J. F., Building it up and taking it down: the regulation of vertebrate ciliogenesis. Dev Dyn 237, 1972–1981 (2008). [DOI] [PMC free article] [PubMed] [Google Scholar]
- 6.van Dam T. J. P. et al. CiliaCarta: An integrated and validated compendium of ciliary genes. PLoS One 14, e0216705 (2019). [DOI] [PMC free article] [PubMed] [Google Scholar]
- 7.Vasquez S. S. V., van Dam J., Wheway G., An updated SYSCILIA gold standard (SCGSv2) of known ciliary genes, revealing the vast progress that has been made in the cilia research field. Mol Biol Cell 32, br13 (2021). [DOI] [PMC free article] [PubMed] [Google Scholar]
- 8.Wallmeier J. et al. De Novo Mutations in FOXJ1 Result in a Motile Ciliopathy with Hydrocephalus and Randomization of Left/Right Body Asymmetry. Am J Hum Genet 105, 1030–1039 (2019). [DOI] [PMC free article] [PubMed] [Google Scholar]
- 9.Campbell E. P., Quigley I. K., Kintner C., Foxn4 promotes gene expression required for the formation of multiple motile cilia. Development 143, 4654–4664 (2016). [DOI] [PMC free article] [PubMed] [Google Scholar]
- 10.Brocal-Ruiz R. et al. Forkhead transcription factor FKH-8 cooperates with RFX in the direct regulation of sensory cilia in Caenorhabditis elegans. Elife 12, (2023). [DOI] [PMC free article] [PubMed] [Google Scholar]
- 11.Chung M. I. et al. RFX2 is broadly required for ciliogenesis during vertebrate development. Dev Biol 363, 155–165 (2012). [DOI] [PMC free article] [PubMed] [Google Scholar]
- 12.Choksi S. P., Lauter G., Swoboda P., Roy S., Switching on cilia: transcriptional networks regulating ciliogenesis. Development 141, 1427–1441 (2014). [DOI] [PubMed] [Google Scholar]
- 13.Ashique A. M. et al. The Rfx4 transcription factor modulates Shh signaling by regional control of ciliogenesis. Sci Signal 2, ra70 (2009). [DOI] [PubMed] [Google Scholar]
- 14.El Zein L. et al. RFX3 governs growth and beating efficiency of motile cilia in mouse and controls the expression of genes involved in human ciliopathies. J Cell Sci 122, 3180–3189 (2009). [DOI] [PubMed] [Google Scholar]
- 15.Bonnafe E. et al. The transcription factor RFX3 directs nodal cilium development and left-right asymmetry specification. Mol Cell Biol 24, 4417–4427 (2004). [DOI] [PMC free article] [PubMed] [Google Scholar]
- 16.Ahn S. et al. The C. elegans regulatory factor X (RFX) DAF-19M module: A shift from general ciliogenesis to cell-specific ciliary and behavioral specialization. Cell Rep 39, 110661 (2022). [DOI] [PubMed] [Google Scholar]
- 17.Sugiaman-Trapman D. et al. Characterization of the human RFX transcription factor family by regulatory and target gene analysis. BMC Genomics 19, 181 (2018). [DOI] [PMC free article] [PubMed] [Google Scholar]
- 18.Coschiera A. et al. Primary cilia promote the differentiation of human neurons through the WNT signaling pathway. BMC Biol 22, 48 (2024). [DOI] [PMC free article] [PubMed] [Google Scholar]
- 19.Bangs F. K., Schrode N., Hadjantonakis A. K., Anderson K. V., Lineage specificity of primary cilia in the mouse embryo. Nat Cell Biol 17, 113–122 (2015). [DOI] [PMC free article] [PubMed] [Google Scholar]
- 20.Cruz N. M., Reddy R., McFaline-Figueroa J. L., Tran C., Fu H., Freedman B. S., Modelling ciliopathy phenotypes in human tissues derived from pluripotent stem cells with genetically ablated cilia. Nat Biomed Eng 6, 463–475 (2022). [DOI] [PMC free article] [PubMed] [Google Scholar]
- 21.Nowotschin S. et al. The emergent landscape of the mouse gut endoderm at single-cell resolution. Nature 569, 361–367 (2019). [DOI] [PMC free article] [PubMed] [Google Scholar]
- 22.Bardot E. S., Hadjantonakis A. K., Mouse gastrulation: Coordination of tissue patterning, specification and diversification of cell fate. Mech Dev 163, 103617 (2020). [DOI] [PMC free article] [PubMed] [Google Scholar]
- 23.Kwon G. S. et al. Tg(Afp-GFP) expression marks primitive and definitive endoderm lineages during mouse development. Dev Dyn 235, 2549–2558 (2006). [DOI] [PMC free article] [PubMed] [Google Scholar]
- 24.Kwon G. S., Hadjantonakis A. K., Transthyretin mouse transgenes direct RFP expression or Cre-mediated recombination throughout the visceral endoderm. Genesis 47, 447–455 (2009). [DOI] [PMC free article] [PubMed] [Google Scholar]
- 25.Daigle T. L. et al. A Suite of Transgenic Driver and Reporter Mouse Lines with Enhanced Brain-Cell-Type Targeting and Functionality. Cell 174, 465–480 e422 (2018). [DOI] [PMC free article] [PubMed] [Google Scholar]
- 26.Hoch R. V., Clarke J. A., Rubenstein J. L., Fgf signaling controls the telencephalic distribution of Fgf-expressing progenitors generated in the rostral patterning center. Neural Dev 10, 8 (2015). [DOI] [PMC free article] [PubMed] [Google Scholar]
- 27.Bazzi H., Soroka E., Alcorn H. L., Anderson K. V., STRIP1, a core component of STRIPAK complexes, is essential for normal mesoderm migration in the mouse embryo. Proc Natl Acad Sci U S A 114, E10928–E10936 (2017). [DOI] [PMC free article] [PubMed] [Google Scholar]
- 28.Finetti F. et al. The small GTPase Rab8 interacts with VAMP-3 to regulate the delivery of recycling T-cell receptors to the immune synapse. J Cell Sci 128, 2541–2552 (2015). [DOI] [PMC free article] [PubMed] [Google Scholar]
- 29.Vivar O. I. et al. IFT20 controls LAT recruitment to the immune synapse and T-cell activation in vivo. Proc Natl Acad Sci U S A 113, 386–391 (2016). [DOI] [PMC free article] [PubMed] [Google Scholar]
- 30.Tyser R. C. V., Mahammadov E., Nakanoh S., Vallier L., Scialdone A., Srinivas S., Single-cell transcriptomic characterization of a gastrulating human embryo. Nature 600, 285–289 (2021). [DOI] [PMC free article] [PubMed] [Google Scholar]
- 31.Presnell J. S., Schnitzler C. E., Browne W. E., KLF/SP Transcription Factor Family Evolution: Expansion, Diversification, and Innovation in Eukaryotes. Genome Biol Evol 7, 2289–2309 (2015). [DOI] [PMC free article] [PubMed] [Google Scholar]
- 32.Hao J. et al. KLF3 promotes the 8-cell-like transcriptional state in pluripotent stem cells. Cell Prolif 53, e12914 (2020). [DOI] [PMC free article] [PubMed] [Google Scholar]
- 33.Bell S. M., Schreiner C. M., Waclaw R. R., Campbell K., Potter S. S., Scott W. J., Sp8 is crucial for limb outgrowth and neuropore closure. Proc Natl Acad Sci U S A 100, 12195–12200 (2003). [DOI] [PMC free article] [PubMed] [Google Scholar]
- 34.Dunty W. C. Jr., Kennedy M. W., Chalamalasetty R. B., Campbell K., Yamaguchi T. P., Transcriptional profiling of Wnt3a mutants identifies Sp transcription factors as essential effectors of the Wnt/beta-catenin pathway in neuromesodermal stem cells. PLoS One 9, e87018 (2014). [DOI] [PMC free article] [PubMed] [Google Scholar]
- 35.Kennedy M. W., Chalamalasetty R. B., Thomas S., Garriock R. J., Jailwala P., Yamaguchi T. P., Sp5 and Sp8 recruit beta-catenin and Tcf1-Lef1 to select enhancers to activate Wnt target gene transcription. Proc Natl Acad Sci U S A 113, 3545–3550 (2016). [DOI] [PMC free article] [PubMed] [Google Scholar]
- 36.Garriock R. J. et al. A dorsal-ventral gradient of Wnt3a/beta-catenin signals controls mouse hindgut extension and colon formation. Development 147, (2020). [DOI] [PMC free article] [PubMed] [Google Scholar]
- 37.van den Brink S. C. et al. Single-cell and spatial transcriptomics reveal somitogenesis in gastruloids. Nature 582, 405–409 (2020). [DOI] [PubMed] [Google Scholar]
- 38.Baillie-Johnson P., van den Brink S. C., Balayo T., Turner D. A., Martinez Arias A. , Generation of Aggregates of Mouse Embryonic Stem Cells that Show Symmetry Breaking, Polarization and Emergent Collective Behaviour In Vitro. J Vis Exp, (2015). [DOI] [PMC free article] [PubMed] [Google Scholar]
- 39.Harrison S. M., Houzelstein D., Dunwoodie S. L., Beddington R. S., Sp5, a new member of the Sp1 family, is dynamically expressed during development and genetically interacts with Brachyury. Dev Biol 227, 358–372 (2000). [DOI] [PubMed] [Google Scholar]
- 40.Bangs F., Anderson K. V., Primary Cilia and Mammalian Hedgehog Signaling. Cold Spring Harb Perspect Biol 9, (2017). [DOI] [PMC free article] [PubMed] [Google Scholar]
- 41.Belteki G. et al. Conditional and inducible transgene expression in mice through the combinatorial use of Cre-mediated recombination and tetracycline induction. Nucleic Acids Res 33, e51 (2005). [DOI] [PMC free article] [PubMed] [Google Scholar]
- 42.Plotnikova O. V., Pugacheva E. N., Golemis E. A., Primary cilia and the cell cycle. Methods Cell Biol 94, 137–160 (2009). [DOI] [PMC free article] [PubMed] [Google Scholar]
- 43.Choksi S. P. et al. An alternative cell cycle coordinates multiciliated cell differentiation. Nature 630, 214–221 (2024). [DOI] [PMC free article] [PubMed] [Google Scholar]
- 44.Khoury Damaa M. et al. Cyclin O controls entry into the cell-cycle variant required for multiciliated cell differentiation. Cell Rep 44, 115117 (2025). [DOI] [PubMed] [Google Scholar]
- 45.Soderholm S. et al. Single-cell response to Wnt signaling activation reveals uncoupling of Wnt target gene expression. Exp Cell Res 429, 113646 (2023). [DOI] [PubMed] [Google Scholar]
- 46.Miyamoto M., Hayashi T., Kawasaki Y., Akiyama T., Sp5 negatively regulates the proliferation of HCT116 cells by upregulating the transcription of p27. Oncol Lett 15, 4005–4009 (2018). [DOI] [PMC free article] [PubMed] [Google Scholar]
- 47.Gaborieau E., Hurtado-Chong A., Fernandez M., Azim K., Raineteau O., A dual role for the transcription factor Sp8 in postnatal neurogenesis. Sci Rep 8, 14560 (2018). [DOI] [PMC free article] [PubMed] [Google Scholar]
- 48.Ait-Lounis A. et al. Novel function of the ciliogenic transcription factor RFX3 in development of the endocrine pancreas. Diabetes 56, 950–959 (2007). [DOI] [PubMed] [Google Scholar]
- 49.Thomas J., Morle L., Soulavie F., Laurencon A., Sagnol S., Durand B., Transcriptional control of genes involved in ciliogenesis: a first step in making cilia. Biol Cell 102, 499–513 (2010). [DOI] [PubMed] [Google Scholar]
- 50.Kyun M. L. et al. Wnt3a Stimulation Promotes Primary Ciliogenesis through beta-Catenin Phosphorylation-Induced Reorganization of Centriolar Satellites. Cell Rep 30, 1447–1462 e1445 (2020). [DOI] [PubMed] [Google Scholar]
- 51.Sakai K., Miyazaki J., A transgenic mouse line that retains Cre recombinase activity in mature oocytes irrespective of the cre transgene transmission. Biochem Biophys Res Commun 237, 318–324 (1997). [DOI] [PubMed] [Google Scholar]
- 52.Hayashi S., Lewis P., Pevny L., McMahon A. P., Efficient gene modulation in mouse epiblast using a Sox2Cre transgenic mouse strain. Mech Dev 119 Suppl 1, S97–S101 (2002). [DOI] [PubMed] [Google Scholar]
- 53.Muzumdar M. D., Tasic B., Miyamichi K., Li L., Luo L., A global double-fluorescent Cre reporter mouse. Genesis 45, 593–605 (2007). [DOI] [PubMed] [Google Scholar]
- 54.Medina-Cano D. et al. Rapid and robust directed differentiation of mouse epiblast stem cells into definitive endoderm and forebrain organoids. Development 149, (2022). [DOI] [PMC free article] [PubMed] [Google Scholar]
- 55.Niakan K. K., Schrode N., Cho L. T., Hadjantonakis A. K., Derivation of extraembryonic endoderm stem (XEN) cells from mouse embryos and embryonic stem cells. Nat Protoc 8, 1028–1041 (2013). [DOI] [PMC free article] [PubMed] [Google Scholar]
- 56.Choi H. M. T. et al. Third-generation in situ hybridization chain reaction: multiplexed, quantitative, sensitive, versatile, robust. Development 145, (2018). [DOI] [PMC free article] [PubMed] [Google Scholar]
- 57.Blaess S. et al. Temporal-spatial changes in Sonic Hedgehog expression and signaling reveal different potentials of ventral mesencephalic progenitors to populate distinct ventral midbrain nuclei. Neural Dev 6, 29 (2011). [DOI] [PMC free article] [PubMed] [Google Scholar]
- 58.Agbu S. O., Liang Y., Liu A., Anderson K. V., The small GTPase RSG1 controls a final step in primary cilia initiation. J Cell Biol 217, 413–427 (2018). [DOI] [PMC free article] [PubMed] [Google Scholar]
- 59.Buenrostro J. D., Giresi P. G., Zaba L. C., Chang H. Y., Greenleaf W. J., Transposition of native chromatin for fast and sensitive epigenomic profiling of open chromatin, DNA-binding proteins and nucleosome position. Nat Methods 10, 1213–1218 (2013). [DOI] [PMC free article] [PubMed] [Google Scholar]
- 60.Azizi E. et al. Single-Cell Map of Diverse Immune Phenotypes in the Breast Tumor Microenvironment. Cell 174, 1293–1308 e1236 (2018). [DOI] [PMC free article] [PubMed] [Google Scholar]
- 61.Squair J. W. et al. Confronting false discoveries in single-cell differential expression. Nat Commun 12, 5692 (2021). [DOI] [PMC free article] [PubMed] [Google Scholar]
- 62.Yu G., Wang L. G., Han Y., He Q. Y., clusterProfiler: an R package for comparing biological themes among gene clusters. OMICS 16, 284–287 (2012). [DOI] [PMC free article] [PubMed] [Google Scholar]
- 63.Dobin A. et al. STAR: ultrafast universal RNA-seq aligner. Bioinformatics 29, 15–21 (2013). [DOI] [PMC free article] [PubMed] [Google Scholar]
- 64.Fleming S. J. et al. Unsupervised removal of systematic background noise from droplet-based single-cell experiments using CellBender. Nat Methods 20, 1323–1335 (2023). [DOI] [PubMed] [Google Scholar]
- 65.McGinnis C. S., Murrow L. M., Gartner Z. J., DoubletFinder: Doublet Detection in Single-Cell RNA Sequencing Data Using Artificial Nearest Neighbors. Cell Syst 8, 329–337 e324 (2019). [DOI] [PMC free article] [PubMed] [Google Scholar]
- 66.Trapnell C. et al. The dynamics and regulators of cell fate decisions are revealed by pseudotemporal ordering of single cells. Nat Biotechnol 32, 381–386 (2014). [DOI] [PMC free article] [PubMed] [Google Scholar]
- 67.Qiu X. et al. Reversed graph embedding resolves complex single-cell trajectories. Nat Methods 14, 979–982 (2017). [DOI] [PMC free article] [PubMed] [Google Scholar]
- 68.Aibar S. et al. SCENIC: single-cell regulatory network inference and clustering. Nat Methods 14, 1083–1086 (2017). [DOI] [PMC free article] [PubMed] [Google Scholar]
Associated Data
This section collects any data citations, data availability statements, or supplementary materials included in this article.
Supplementary Materials
Data Availability Statement
Raw fastq sequencing files and output files of normal and Sp8 GOF yolk sac scRNA-seq experiments are available at the GEO repository under the accession numbers GSE274844 and GSE293888. The scRNA-Seq data for the Gastruloid spheres are available at the GEO repository under the accession numbers GSE296732. Raw fastq sequencing files for ATAC-seq, ChIP-seq datasets and bigwig files for displaying read density tracks have been submitted to the GEO repository under the accession numbers GSE273919, GSE273920. All deposited data will be publicly available as of the date of publication. This paper does not report any original code; code resources and minor modifications are described in the Methods. Scripts for Sp8 GOF yolk sac scRNA-seq data analysis are available at http://github.com/stevehxf/Cilia_Science2025.
Any materials not publicly available through GEO or GitHub are available by contacting ALJ or YL.