

Abstract
Urban environments around the world are being highly populated by personal mobility vehicles, such as scooters or electric bicycles, which offer a new way to move around cities. Researchers from different disciplines are devoting efforts to integrate this novel vehicular paradigm into smart-city ecosystems given its advantages in terms of traffic sustainability, efficiency, and agility. However, the quick penetration of these vehicles also brings challenges and concerns related to their coexistence with other kinds of transportation systems or pedestrians, as well as the high number of accidents in which these vehicles are involved. When an accident happens, a fast and automatic detection is crucial to take quick measures, e.g., alerting emergency services. This is the main motivation of the dataset presented in this work, which provides the data captured by different sensors onboard an electric scooter under regular and accident conditions. A variety of accident kinds such as frontal collisions, lateral falls, etc. are considered, so the dataset may be valuable for the development of automatic engines to infer different riding situations.
Keywords: Scooter, Falls, Riding, Urban mobility, Intelligent transportation systems
Specifications Table
| Subject | Engineering & Materials science |
| Specific subject area | Personal mobility, Accidents, Smart-cities. |
| Type of data | Table, Image, Video Raw |
| Data collection | The data was collected under three different movement conditions: Static measurements were taken while the scooter was not in motion; regular riding data were captured while travelling around a medium-sized city in real conditions; and fall events were recreated in a controlled scenario. In all cases a series of sensors were employed to take measurements: 3-axes gyroscope, 3-axes accelerometer, GPS receiver, light sensor, or atmospheric pressure sensor, among others. The dataset includes the raw data (not normalized) measured by each of the employed sensors. |
| Data source location | Cartagena, Spain. |
| Data accessibility | Repository name: scooter-riding Data identification number: 10.5281/zenodo.14851613 Direct URL to data: 10.5281/zenodo.14887437 |
| Related research article | [1] R. Sanchez-Iborra, L. Bernal-Escobedo, J. Santa, and A. Skarmeta, “TinyML-Based Fall Detection for Connected Personal Mobility Vehicles,” Comput. Mater. Contin., vol. 71, no. 2, pp. 3869–3885, 2022, 10.32604/cmc.2022.022610. |
1. Value of the Data
-
•
This dataset includes riding and fall event records from multiple sensors in an On-Board Unit (OBU) attached to a real electric scooter. Most of the parameters in this dataset consider different-nature motion-related measurements, e.g., acceleration, gyroscope, compass, gravity, etc., but also metrics from other kinds of sensors such as illuminance or atmospheric pressure.
-
•
Regular riding data were collected under real conditions, while using the scooter in usual driving conditions in a medium-sized city, considering different types of pavements.
-
•
Multiple kinds of accidents are recreated: Frontal collisions, lateral falls, etc., so together with the regular riding data, different analysis before and after an accident occurs may be performed using this dataset.
-
•
Data can be employed to detect different driving conditions, including accident events, therefore being valuable for the research community in the field, aiming at developing automatic fall event detection systems or any other kind of inference engine.
2. Background
This dataset was generated under the research activities reported in [1]. This work focused on the development of an automatic fall event detection system implemented following the TinyML precepts, which is a technique in Machine Learning (ML) that enables the execution of learning algorithms on ultra-low-power devices like microcontrollers. The data were collected thanks to an OBU specifically designed and implemented for lightweight personal mobility vehicles [2] (Fig. 1), which was mounted onboard an electric scooter (Fig. 2). For this study, only the gyroscope and accelerometer data were employed to train a series of TinyML models to infer the occurrence of a fall event. However, this dataset also includes many other sources of information: Gravity, rotation vector, compass, GPS position, and even photos and videos, among others, that may be valuable for producing inference models with the same or any other target within the field of personal mobility devices that currently lacks this type of dataset.
Fig. 1.

Implemented on-board unit.
Fig. 2.

Electric scooter equipped with the implemented on-board unit.
Previously published related datasets have also focused on the measurement of falls events, but in the cases of human mobility (especially for elderly people) [[3], [4], [5]] and motorcycles [6], which present different physics and environmental conditions than the case considered in this dataset. There are related studies with e-scooters, such as the one in [7]. Here the authors collect data about vehicle dynamics and the person position while driving, although no data about falls are included. Sensors are affixed on different parts of the vehicle, not using a particular OBU that could be replicated to multitude of vehicles. The work in [8] measures vibration transmitted to e-scooter drivers. The acquisition system is composed of an OBU affixed on the steering bar, as in the current work, given that the top part of the vehicle reflects better the final user perception. The authors in [9] attach the sensors on the driver body to collect data from drivers in emergency situations, which is another strategy to gather detailed kinematics data for e-scooters, but it is focused on characterizing the dynamics of these vehicles, rather than extracting data for creating safety services.
3. Data Description
This dataset contains comprehensive data collected from an OBU mounted on an electric scooter. It includes parameters about acceleration, orientation, GPS position, gravity, illuminance, and atmospheric pressure, providing valuable insights into the scooter's performance and safety under different conditions.
The dataset is organized into a directory tree, with one folder containing data for a specific test, with a descriptive name indicating the nature of the scenario. Besides, inside each folder, there is a README file that includes relevant details about the conducted test.
There is a set of files within each folder, one for each collected parameter, in CSV format. Additional multimedia files have been included in the form of photos or videos to understand specific test scenarios, e.g., fall events. The contents of the dataset are detailed next in a tree-like format, removing the repetitive set of files for the sake of clarity.

The driving scenarios considered in the tests are cited in the name of each folder and the corresponding README file. These are:
-
•
Static: The OBU remained static.
-
•
Sidewalk: The e-scooter was driven on sidewalks paved with flagstones.
-
•
Bike lane: The e-scooter was driven on bike lanes paved as regular asphalt roads.
-
•
Regular road: The e-scooter was driven on regular asphalt roads with no potholes.
-
•
Cobblestones road: The e-scooter was driven in the old city center, where roads are paved with cobblestones.
-
•
Front collisions and lateral rollovers: The e-scooter was manually moved in a controlled room to gather synthetic front collisions against a foam wall, and lateral rollovers by leaving the scooter fall on a shock-absorbing material to prevent the vehicle to break.
All files available in the dataset contain raw data, with a common structure as depicted in Table 1.
Table 1.
Fields included in data files.
| Timestamp | Test time | Measure 1 | Measure 2 | … | Measure n |
|---|---|---|---|---|---|
| <y>-<m>-<d> <h>:<min>:<sec> | <milliseconds> | <value> | <value> | <value> |
The files included in each folder are:
-
•
Accelerometer.csv: Contains a timestamp, the number of milliseconds since the recording started, and the acceleration value for each axis as X, Y and Z, measured in meters per second squared (m/s²).
-
•
AccelerometerLinear.csv: Contains a timestamp, the number of milliseconds since the recording started, and the linear acceleration value for each axis as X, Y, and Z measured in meters per second squared (m/s²). These remove the influence of gravity in measurements.
-
•
Compass.csv: Contains a timestamp, the number of milliseconds since the recording started, and the magnetic field strength along the three axes as X, Y, and Z, which is measured in microteslas (µT).
-
•
Giroscope.csv: Contains a timestamp, the number of milliseconds since the recording started, and the angular velocity value for each axis X, Y, and Z measured in radians per second (rad/s).
-
•
GPS.csv: Contains a timestamp, the number of milliseconds since the recording started, and the geographical position in latitude, longitude, and altitude values. The latitude and longitude values are measured in degrees (°), and the altitude values are measured in meters (m). Consider that this file is in blank when an indoor test is performed, or when the GPS signal is not acquired during the test.
-
•
Gravity.csv: Contains a timestamp, the number of milliseconds since the recording started, and the acceleration due to gravity along the three axes X, Y, and Z, which is measured in meters per second squared (m/s²).
-
•
Light.csv: Contains a timestamp, the number of milliseconds since the recording started, and an illuminance value, which is measured in lux (lx), the standard unit for measuring the amount of light that hits a surface.
-
•
Pressure.csv: Contains a timestamp, the number of milliseconds since the recording started, and a pressure value in millibars (mbar), which is a common unit for measuring atmospheric pressure.
-
•
RotationVector.csv: Contains a timestamp, the number of milliseconds since the recording started, X, Y, and Z values, a cosine value, and a heading accuracy value. The X, Y, and Z values represent the components of the rotation vector in the three-dimensional space and are dimensionless and normalized from −1 to 1. The cosine value is a scalar component of the quaternion representing the rotation. The heading accuracy includes an indication of the measurement quality, when available.
X, Y and Z are the three axes in the space. For the measurements taken, the reference system is as depicted in Fig. 3. The Y axis is used for the forward movement of the scooter, X is the lateral movement, and Z is the vertical movement.
Fig. 3.
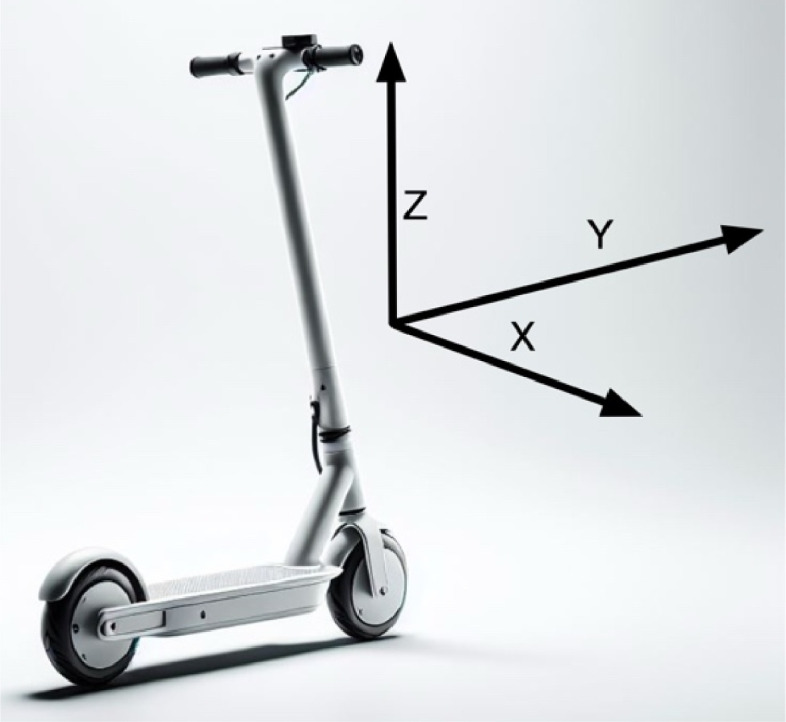
One of the electric scooters equipped with the implemented on-board unit.
Table 2 contains a piece of the Accelerometer.csv file, which includes acceleration data for each of the three axes in m/s² during a trial reporting a lateral rollover. In this case, a right overturn is carried out, with X, and Z values suddenly changing.
Table 2.
Example of data coming from the accelerometer registered during a right overturn.
| Timestamp | Test time | X | Y | Z |
|---|---|---|---|---|
| 2020-06-22 11:47:36 | 4921 | −0.847837 | 0.29698244 | −0.05748047 |
| 2020-06-22 11:47:36 | 4932 | −0.89573735 | −0.16286133 | 0.05748047 |
| 2020-06-22 11:47:36 | 4942 | −0.8909473 | −0.98195803 | 0.28261232 |
| 2020-06-22 11:47:36 | 4952 | −0.9436377 | −1.456172 | 0.43110353 |
| 2020-06-22 11:47:36 | 4962 | −1.1352394 | −2.5243506 | 0.67539555 |
| 2020-06-22 11:47:36 | 4972 | −1.0250684 | −2.8548634 | 0.6849756 |
| 2020-06-22 11:47:36 | 4982 | −1.1304493 | −3.8080812 | 0.96758795 |
| 2020-06-22 11:47:36 | 4992 | −0.17723145 | −2.548301 | 0.62749517 |
| 2020-06-22 11:47:36 | 5001 | −9.168135 | −1.1783496 | −41.34283 |
| 2020-06-22 11:47:36 | 5012 | −20.894152 | −8.234077 | −10.054293 |
| 2020-06-22 11:47:36 | 5022 | −26.215885 | −1.8585353 | −44.26475 |
Frontal collisions require inspecting data records during a wider timespan. An overview of the Accelerometer.csv file collected during a test involving five collisions is depicted in Fig. 4. Here, major changes are reported in Y (longitudinal movement) and Z (vertical) axes, since there is a sudden stop in the forward movement, together with an elevation of the rear part of the scooter due to the driver is held to the handlebars. The five collisions are clearly visible with peak values, as compared with regular scooter movements around the testing room with minor X (longitudinal) acceleration changes.
Fig. 4.

Plot of acceleration data registered during different frontal collisions.
4. Experimental Design, Materials and Methods
The OBU presented above was mounted on an electric scooter (Outsider E-Volution 8,5 Phoenix, from Cecotec) to gather sensor data considering various scenarios:
-
•
Static Conditions: Measurements taken while the scooter is stationary.
-
•
Conventional Driving Situations: Data recorded during regular driving on different types of pavements, such as asphalt, concrete, and gravel.
-
•
Lateral Rollovers: Readings captured during instances of the scooter tipping over sideways.
-
•
Frontal Collisions: Data obtained from front-impact collisions.
A single person performed the tests with the same scooter. He was a 37-years old man skilled in driving e-scooters but replicating a regular use following traffic rules. At the time the tests were carried out it was allowed do drive on sidewalks in Cartagena (Spain). The tests were carried out in different days from 25th May to 22nd June 2020, during the COVID-19 pandemic and when people were allowed to go outside at restricted time periods in Spain. For each of the tests (each one in a folder, as indicated above), data were continuously collected from the start to the end of the experiment.
A dedicated software was developed in Python to regularly access the accelerometer, gyroscope, compass, GPS, light sensor, and a clime sensor providing the atmospheric pressure. Data were recorded at 10 Hz rate on independent files. Concretely, the OBU was implemented by using a Raspberry Pi Zero W SBC, with a System on Chip (SoC) powered by a 1 GHz ARM11 CPU coupled with 512 MB of SDRAM. The following sensors are connected to this minicomputer:
-
•
Accelerometer/Gyroscope/Magnetometer: ST LSM9DS1.
-
•
GPS: Lantronix A2235-H GPS.
-
•
Atmospheric pressure: BME280.
-
•
Luxometer: BH1750.
Besides, the OBU is also equipped with a series of radio communication interfaces (not used under the scope of the production of this dataset), namely, WiFi, Blueetooth, LoRaWAN, and NB-IoT, and powered with a portable battery model RS PRO PB-A5200. Finally, all these components are allocated in the OBU case, which has been manufactured using a 3D printer and its dimensions are 15 × 7 × 5 cm (see Fig. 1).
After each of the tests were carried out, data files were extracted using a regular computer and inserted on an independent folder. Once all tests were carried out, those not reporting good data, due to bad operation of the unit (e.g., power failure), unit detached from the scooter in collisions, etc., were not considered to avoid the inclusion of outliers into the dataset. Then, good tests were later enriched with a README file with metadata about the scenario and, in some cases, for the sake of clarity, extra photos and videos were included, describing the way the tests were carried out, especially in the case of the recreated fall events. The whole dataset was provided with a general README file in the root folder, summarizing the description of the data. Finally, the dataset was uploaded to GitHub.
Overall, the measurements from 15 different tests were included into the dataset, obtaining for each one the files described above. A total of 6.207.066.824 data records compose this dataset, comprising about 3 hours of urban riding and 50 falls.
In order to make access and reference to the dataset easier, the GitHub repository has been linked with Zenodo so that each release in GitHub is provided with a Digital Object Identifier (DOI).
Limitations
It is important to consider the difference between the number of inputs from regular riding conditions and from fall events. Therefore, when training an ML model using these data, it should be considered that this raw dataset is unbalanced, due the scarcity of falls in comparison with the recorded hours of riding. Hence, adequate techniques to address this issue should be employed to obtain proper inference models.
Ethics Statement
The authors have read and followed the ethical requirements for publication in Data in Brief and confirm that the current work does not involve human subjects, animal experiments, or any data collected from social media platforms.
CRediT Author Statement
Ramon Sanchez-Iborra: Conceptualization, Methodology, Software, Validation, Writing. Luis Bernal-Escobedo: Software, Hardware, Data Curation, Writing. Jose Santa: Conceptualization, Methodology, Validation, Data Curation, Writing, Funding acquisition.
Acknowledgments
Financial support for this research has been provided under the projects ONOFRE-3 PID2020-112675RB, ONOFRE-4 PID2023-148104OB, WILLIOT CNS2022-136150, all funded by MCIN/ AEI /10.13039/501100011033/ and by ERDF/EU; the project MovIoT 22228/PDC/23, funded by Seneca Foundation - Science and Technology Agency of the Region of Murcia; and the NANCY project (Grant No. 101096456) funded by the European Commission.
Declaration of Competing Interest
The authors declare that they have no known competing financial interests or personal relationships that could have appeared to influence the work reported in this paper.
Data availability
References
- 1.Sanchez-Iborra R., Bernal-Escobedo L., Santa J., Skarmeta A. TinyML-Based Fall Detection for Connected Personal Mobility Vehicles. Comput. Mater. Contin. 2022;71:3869–3885. doi: 10.32604/cmc.2022.022610. [DOI] [Google Scholar]
- 2.Santa J., Bernal-Escobedo L., Sanchez-Iborra R. On-board unit to connect personal mobility vehicles to the IoT. Proc. Comput. Sci>. 2020;175:173–180. doi: 10.1016/j.procs.2020.07.027. [DOI] [Google Scholar]
- 3.A. Tošić, N. Hrovatin, and J. Vičič, Data about fall events and ordinary daily activities from a sensorized smart floor, Data Br. 37 (2021), 107253. 10.1016/j.dib.2021.107253. [DOI] [PMC free article] [PubMed]
- 4.E. Alam, A. Sufian, P. Dutta, M. Leo, I. A. Hameed, GMDCSA-24: A dataset for human fall detection in videos, Data Br. 57 (2024), 110892. 10.1016/j.dib.2024.110892. [DOI] [PMC free article] [PubMed]
- 5.Nandi P., et al. Inertial measurement and heart-rate sensor-based dataset for geriatric fall detection using custom built wrist-worn device. Data Br. 2024;52 doi: 10.1016/j.dib.2023.109812. [DOI] [PMC free article] [PubMed] [Google Scholar]
- 6.Boubezoul A., Dufour F., Bouaziz S., Larnaudie B., Espié S. Dataset on powered two wheelers fall and critical events detection. Data Br. 2019;23 doi: 10.1016/j.dib.2019.103828. [DOI] [PMC free article] [PubMed] [Google Scholar]
- 7.Garman C., Como S., Campbell I., Wishart J., O'Brien K., McLean S. Micro-mobility vehicle dynamics and rider kinematics during electric scooter riding. SAE Tech. Pap. 2020-01-0935. 2020 doi: 10.4271/2020-01-0935. [DOI] [Google Scholar]
- 8.Vella A.D., Digo E., Gastaldi L., Pastorelli S., Vigliani A. Statistical analysis of the vibrations transmitted from an electric kick scooter to riders. Exp. Tech. 2024;48:803–813. doi: 10.1007/s40799-023-00693-7. [DOI] [Google Scholar]
- 9.Terranova P., Liu S.-Y., Jain S., Engström J., Perez M.A. Kinematic characterization of micro-mobility vehicles during evasive maneuvers. J. Saf. Res. 2024;91:342–353. doi: 10.1016/j.jsr.2024.09.020. [DOI] [PubMed] [Google Scholar]
Associated Data
This section collects any data citations, data availability statements, or supplementary materials included in this article.