

Abstract
A founder effect can account for the presence of an allele at an unusually high frequency in an isolated population if the allele is selectively neutral and if all copies are identical by descent with a copy that either was carried by a founder individual or arose by mutation later. Here, a statistical test of both aspects of the founder-effect hypothesis is developed. The test is performed by a modified version of a program that implements the Slatkin-Bertorelle test of neutrality. The test is applied to several disease-associated alleles found predominantly in Ashkenazi Jews. Despite considerable uncertainty about the demographic history of Ashkenazi Jews and their ancestors, available genetic data are consistent with a founder effect resulting from a severe bottleneck in population size between a.d. 1100 and a.d. 1400 and an earlier bottleneck in a.d. 75, at the beginning of the Jewish Diaspora. The relatively high frequency of alleles causing four different lysosomal storage disorders, including Tay-Sachs disease and Gaucher disease, can be accounted for if the disease-associated alleles are recessive in their effects on reproductive fitness.
Introduction
A founder effect can result either from a true founder event (i.e., the establishment of a new population from individuals derived from a much larger population) or from an extreme reduction in population size (i.e., a bottleneck in size). In either case, alleles present in one copy immediately after the founder event or bottleneck may be found at a much higher frequency than they were previously and can reach even higher frequencies because of strong genetic drift occurring while the population is still small.
Founder effects have been used to explain the presence of high-frequency Mendelian diseases in many isolated populations (Thompson and Neel 1996; Vogel and Motulsky 1996). Even though disease-associated alleles are probably not neutral, even slightly deleterious alleles may increase in frequency because of founder effects. Both the founder effect and heterozygote advantage have been invoked to account for several disease-associated alleles in the Ashkenazi Jewish (AJ) population (Risch 2001). The hypothesis of heterozygote advantage is supported primarily by the fact that four of the diseases—Tay-Sachs disease, Gaucher disease, mucolipidosis type IV, and Niemann-Pick disease—are results of defects in sphingolipid storage (Zlotogora et al. 1988), defects that are quite rare in most other populations. This unusual concentration of lipid-storage diseases (LSDs) suggests that selection has favored heterozygous carriers of alleles affecting lipid metabolism and storage, possibly because of resistance to tuberculosis (Motulsky 1995). Further support for heterozygote advantage comes from the discovery that more than one disease-associated allele has been found to cause LSDs in Ashkenazi Jews, the logic being that it is unlikely that more than one allele at a locus would increase in frequency only because of a founder effect (Diamond 1994; Motulsky 1995). Selection favoring heterozygous carriers would, however, select for any alleles conferring that advantage. Rotter and Diamond (1987) argue also that the wide geographic range of AJ disease-associated alleles is evidence of heterozygote advantage.
Until the 1990s, heterozygote advantage was the favored explanation for LSDs in the AJ population. More recently, however, the founder-effect hypothesis has gained acceptance, because several studies have suggested that disease-associated alleles are identical by descent and arose relatively recently (Risch et al. 1995b; Goldstein et al. 1999; Niell et al. 2003; Frisch et al. 2004). Risch et al. (2003) recently compiled available data and argued that founder effects rather than heterozygote advantage accounted for all LSDs in the AJ population. Risch et al. (2003) showed that there was no difference between LSDs and non–lipid-storage diseases (NLSDs) in (a) estimated allele ages, (b) numbers of disease-associated alleles, and (c) inferred geographic origins of alleles. They then argued that heterozygote advantage could be ruled out for two reasons. First, some NLSDs (idiopathic torsion dystonia [ITY], breast cancer type 1, and breast cancer type 2) are caused by dominant alleles, making heterozygote advantage unlikely. Second, similarity of the two groups can be accounted for by selection only if all disease-associated alleles benefited heterozygous carriers, which is unlikely because the NLSDs include a wide variety of disorders, including cancers, blood diseases, and neuropathies.
Risch et al. (2003) concluded further that there is evidence of three founder events: one >100 generations ago, when the Jewish population of the Middle East was founded; the second ∼50 generations ago, when the Jewish populations of central Europe were founded; and the third ∼12 generations ago, when the Lithuanian Jewish population was founded (under the assumption of 25 years per generation).
In this article, I introduce a statistical test of the founder-effect hypothesis by adding to a test of neutrality a test of whether an allele either was present in a single copy at the time of a hypothesized founder event or arose by mutation afterwards. The new test is applied to alleles causing Mendelian diseases in Ashkenazi Jews. Although current uncertainty about the early demographic history of the AJ population will not allow a strong conclusion to be reached, the results show that the available genetic data for AJ disease alleles are consistent with the founder-effect hypothesis if plausible assumptions are made about early AJ population sizes. This analysis cannot prove that there was no heterozygote advantage, but it does show that selection is not needed to account for current information about AJ Mendelian diseases. The test also shows, however, that alleles with frequencies >1% could not be traced to the two recent founder events discussed by Risch et al. (2003). For those alleles, the important founder event was at the beginning of the Jewish Diaspora, after the destruction of the Second Temple in a.d. 70.
Statistical Test
To test the founder-effect hypothesis, two separate tests are needed. The first is a test that determines whether there is more linkage disequilibrium (LD) with a linked marker allele than is consistent with neutrality. The neutrality test used here is equivalent to the one introduced by Slatkin and Bertorelle (2001) and is similar to the that of Thompson and Neel (1997). The test assumes that the locus of interest is effectively diallelic, with allele A being associated with the presence of a disease and the alternative allele, a, representing all other variants at this locus. The A/a locus is linked to a diallelic marker locus with alleles M and m. The information needed for the test is (a) the history of population sizes; (b) i, the number of A-bearing chromosomes in a sample of n chromosomes; (c) x, the population frequency of A; and (d) jo, the number of A-bearing chromosomes that carry the marker allele presumed to have been on the ancestral A-bearing chromosome. Necessarily, jo⩽i, and, if jo=i, there is perfect LD between the marker locus and A, meaning that Lewontin’s (1964) D′=1. Although the identification of the ancestral marker allele can be difficult if two or more alleles are relatively common on A-bearing chromosomes, most applications, including all in this article, are to cases in which jo is large enough that it is clear which allele was ancestral. In general, x is estimated in very large population surveys and possibly in pooled clinical data, whereas i and jo are obtained from smaller studies performed to either map A or understand its history.
The test of neutrality is performed by simulating the neutral coalescent with n=i/x tips in a population of variable size and then examining each node to determine whether it has i descendents. If it does, then a mutation on the lineage leading to that node could give rise to an allele in i copies (see fig. 1). For each such node, called an “i-node,” the program computes the probability that j nonrecombinant chromosomes are found. That probability is weighted by the length of the ancestral branch, denoted by w in figure 1, and accumulated over numerous replicates to estimate P(j), the overall probability of finding j nonrecombinant chromosomes in a sample of i A-bearing chromosomes ( ). A one-tailed test of neutrality is obtained by finding the net probability that j⩾jo, where jo is the observed number of nonrecombinants. If
 |
then the data reject neutrality of A at significance level α. This tests whether A is too old to be consistent with the observed number of nonrecombinants. That is the appropriate test if the concern is with testing for positive selection on heterozygous carriers of a low-frequency allele, because heterozygote advantage, with or without lower fitnesses of homozygous individuals, tends to reduce allele age (author's unpublished numerical results). If the concern is whether A is younger than expected under neutrality, the appropriate test would be of the other tail of P(j). A two-tailed test could be used as well.
Figure 1.

Illustration of an intra-allelic genealogy for the case with i=4. t1 is the age of the allele A, t2 is the time of the most recent common ancestor (MRCA) of copies of A in the sample, and w is the length of branch on which A arose by mutation.
To test for a founder effect at a time tF in the past, the program computes and accumulates the numbers of lineages carrying A at tF for each i-node. As illustrated in figure 1, the number, m, of ancestral lineages at tF depends on tF and t2, the time of the most recent common ancestor of the intra-allelic genealogy. There are three possibilities. If t2⩾tF, then m⩾2, and the program records m. If t2⩽tF⩽t2+w, then, with probability p=(tF-t2)/w, A arose by mutation on the single lineage present after the population was founded, and, with probability 1-p, it arose before the population was founded and was present in one lineage at tF. In the latter case, the program records that m=1 weighted by 1-p. In the former case, the program records that m=0 (meaning that the allele arose by mutation after the population was founded) weighted by p. If t2+w⩽tF, the program records that m=0. The outcome for each i-node analyzed is weighted both by w—because that is the time during which A could have arisen by mutation—and by P(jo). By averaging over a large number of replicates, the program estimates Fm, the probability that m=0…i lineages carrying A were present at tF.
The data are consistent with the founder effect if m=0 or 1. A high probability of two or more founding lineages is inconsistent with the founder-effect hypothesis, because it implies that the allele was present at a substantial frequency at the time the population was founded. In the results, the probability that m=0 or 1, Pr(m⩽1)=F0+F1, is reported. If Pr(m⩽1)<α, then a founder event at tF is rejected with probability α.
In addition to estimating the number of lineages at the time of population founding, the program computes the posterior distribution of age. The posterior distribution takes account of the allele frequency, the history of population sizes, and the extent of LD with the linked marker. From the posterior distribution, averages of  and
and  and the associated 95% credible sets are estimated.
The program allows for arbitrary demographic histories. The current effective population size, Ne,0, as well as population sizes Ne,1,…,Ne,K at times T1,T2,…,TK, are specified, and the population is assumed to grow or decline exponentially at rate rk=log(Ne,k+1/Ne,k)/(Tk+1-Tk) between Tk and Tk+1, where T0=0. The growth rate before Tk must also be specified.
Copies of this computer program are freely available at the Slatkin Laboratory Genetics Software Web site.
Applications to AJ Diseases
History of AJ Population Sizes
To apply the founder-effect test to AJ diseases, estimates of past effective population sizes are needed. At present, Ashkenazi Jews comprise ∼80% of the 13–14 million Jews in the world, with most living in the United States and Israel (Motulsky 1995). Population sizes, especially before a.d. 1500, are not known accurately, and the historical record allows only rough estimates to be made.
Ashkenazi Jews are recognized as forming distinct branch of Judaism in the 13th and 14th centuries in present-day Poland, Lithuania, Belarus, the Ukraine, and Russia (Mourant et al. 1978). The ancestors of Ashkenazi Jews descended largely from Jewish populations in present-day Germany (Weinryb 1972). Before the beginning of the Crusades in a.d. 1096, Jewish populations in Germany, France, and England had grown and thrived and are estimated to have numbered at least 100,000 individuals (Engleman 1960; Risch 2001). With the Crusades began a long period of attacks on Jews and the wholesale destruction of Jewish communities, culminating with their expulsion from present-day England, France, and Germany by a.d. ∼1300. Jewish population sizes declined further in a.d. 1347 and 1348 because of the Black Death, during which mortality rates are estimated to have been as high as 50%; further mortality resulted from attacks stemming from the belief that Jews were responsible for the Black Death in non-Jewish communities (Fraikor 1977).
By a.d. 1500, the AJ population size in eastern Europe is estimated to have been 10,000–20,000. There followed a period of sustained population growth at a rate of ∼40% per generation until a.d. 1900, interrupted only by the Cossack massacres in 1648, which resulted in the death of ∼25% of the AJ population (Weinryb 1972; Risch et al. 1995a). To account for all available information in the context of a relatively simple model, I assumed the population sizes given in table 1. The population size in a.d. 2000 is based on Motulsky’s (1995) estimate. Sizes from a.d. 1500 to 1900 are from Risch (1995a). The size in a.d. 1096 is based on estimates of Engleman (1960) and Risch (2001). The size assumed at a.d. 70 (1,000,000) is a conservative estimate based on information presented by Barnavi (1992). The actual size and rate of exponential growth assumed before a.d. 70 (r=0.1 per generation) are not important for considering later founder events. Alleles that arose well before a.d. 70 and that were carried by several individuals ancestral to the AJ population in a.d. 70 were probably present at relatively high frequencies in the Jewish population as a whole and would therefore likely be present in other modern Jewish populations as well. To be restricted to Ashkenazi Jews, alleles had to have been carried by a single founder chromosome or have arisen by mutation after a.d. 70.
Table 1.
Population Sizes of Ashkenazi Jews and Their Ancestors Assumed in the Simulation Program
| Year (a.d.) | ta | NTb |
| 50 | 78 | 1,000,000c |
| 70 | 77.2 | N0d |
| 1096 | 36.16 | 150,000 |
| 1348 | 26.08 | N1e |
| 1500 | 20 | 15,000f |
| 1648 | 14.08 | 200,000f |
| 1667 | 13.32 | 160,000f |
| 1765 | 9.4 | 750,000f |
| 1900 | 4 | 6,000,000f |
| 2000 | 0 | 10,500,000g |
Generations before a.d. 2000, under the assumption of 25 years per generation.
The effective population size was assumed to be 1/3 of these sizes.
Based on figure 1 of Barnavi (1992).
Allowed to vary; values of 150, 600, and 3,000 were used.
Allowed to vary; values of 600, 3,000, and 6,000 were used.
From Risch et al. (1995a).
From Motulsky (1995).
There were at least two important bottlenecks in population size that could have led to a founder effect. The first is at the beginning of the Diaspora in a.d. 70. Although the Jewish population in present-day Israel and surrounding countries was large before a.d. 70, only small numbers made their way to the areas in western Europe in which ancestors of Ashkenazi Jews resided until the end of the 11th century. Historical records provide no information about the size of the founder group or groups. I used a range of values (150, 600, and 3,000) of N0, the assumed size in a.d. 70, to model founder events of different intensities. Another potential founder event occurred because of the persecutions during the Crusades and the mortality associated with the Black Death. I used a range of values of N1 in 1348 (600, 3,000, and 6,000) as the population size after the Black Death.
The intensity of genetic drift is determined by the effective population size, not the census size. With fertility and mortality rates typical of humans, the effective size is ∼1/3 the census size (Hill 1972). Ashkenazi Jews and their ancestors never comprised a randomly mating population but were instead dispersed over a wide geographic area. However, there was sufficient movement among AJ subpopulations that little genetic substructure developed (Risch 2001; Risch et al. 2003). In general, population subdivision increases effective population size, but, unless dispersal is greatly restricted, the increase is minor (Nordborg and Krone 2002).
A potential complicating factor in relating census to effective population size is that fertility in AJ populations was not evenly distributed among social and economic classes (Motulsky 1979; Risch et al. 1995a, 1995b). Wealthier and better-educated families had more offspring. Risch et al. (1995a, 1995b) have argued that this social stratification led to greatly reduced effective size and created the opportunity for extreme founder effects. This argument was challenged by Zoossmann-Diskin (1995), who noted that, although differences in fertility among social classes existed in AJ populations, the vast majority of individuals were in the lower social classes, so much of the high rate of population growth had to be attributable to them. It seems difficult to account for a population growth rate of ∼40% per generation with fertility excess only in wealthy and educated families.
Gaucher Disease
Type I Gaucher disease (MIM #230800) is a recessive nonlethal disorder caused by mutations at the glucocerebrosidase (GBA) locus on chromosome 1q21. The most common causative allele in the AJ population is N370S (also denoted as 1226G). Beutler et al. (1993) estimated the frequency of N370S in the AJ population to be 0.032±0.004. Diaz et al. (2000) found extensive LD between N370S and several closely linked marker loci. I will present the results from the analysis of one marker locus, D1S2464, in detail and briefly summarize the results for two others. In terms of the notation here, the genetic data for D1S2624 (with allele 5 ancestral) are as follows: i=268, jo=163, and pN, the frequency of the ancestral marker on chromosomes not carrying the disease allele, is 0.205 (table 3 of Diaz et al. 2000).
The value of θ, the recombination rate, is not known precisely. Values used by Diaz et al. (2000) appear to be somewhat too large. For D1S2624, Diaz et al. (2000 [their table 4]) reported values ranging from 0.009 to 0.036, with a median of 0.015. On the basis of the July 2003 build of the human genome (available at the UCSC Human Genome Browser Web site), D1S2624 is ∼1.4 Mb from GBA, and, according to the TSC SNP Linkage Map (Matise et al. 2003; TSC SNP Linkage Map Web site), the average recombination rate in this region is ∼0.5 cM/Mb, suggesting that θ=0.007 is a better estimate.
For all combinations of demographic parameter values considered, neutrality could not be rejected, but a recent founder event (tF=26, a.d. 1350) is rejected in all cases (table 2). For all combinations of N0 and N1, numerous lineages carrying N370S were present at that time (fig. 2). In contrast, a founder event in a.d. 70 (tF=77.2) was possible for all combinations of N0 and N1, although it was increasingly unlikely if neither N0 nor N1 was <3,000 (table 2). Similar results were obtained with θ=0.014.
Table 2.
Results of Analyzing Data for N370S at GBA and the Linked Marker Locus D1S2464[Note]
|
Population Sizea |
|||||
| N0 | N1 | Pr(j⩾jo) |
 b b
|
Pr(m⩽1) WhentF=26 | Pr(m⩽1) WhentF=77.2 |
| 150 | 600 | .72 | 104 (26, 184) | 0 | .95 |
| 150 | 3,000 | .73 | 113 (55, 188) | 0 | .95 |
| 150 | 6,000 | .75 | 111 (61, 187) | 0 | .95 |
| 600 | 600 | .66 | 110 (26, 186) | 0 | .81 |
| 600 | 3,000 | .64 | 116 (64, 199) | 0 | .75 |
| 600 | 6,000 | .65 | 118 (65, 197) | 0 | .74 |
| 3,000 | 600 | .59 | 111 (26, 190) | 0 | .40 |
| 3,000 | 3,000 | .34 | 143 (67, 188) | 0 | .10 |
| 3,000 | 6,000 | .31 | 147 (74, 192) | 0 | .05 |
Note.— Results for each combination of N0 and N1 are based on weighted averages of 10,000 replicates. Genetic parameters are x=.032, i=268, jo=163, pN=.205, and θ=.007.
N0 is the assumed population size in a.d. 70 (t=77.2), and N1 is the assumed size in a.d. 1648 (t=26.08).
Numbers in parentheses are the bounds of the 95% credible set based on the posterior distribution of t2.
Figure 2.

Estimated posterior probability distributions of the number of ancestral lineages, m, carrying N370S at GBA (which causes Gaucher disease) for the nine combinations of N0 (the population size at a.d. 70) and N1 (the population size at a.d. 1348) and two different hypothesized times of founder events (a.d. 75 and 1350).
These results also show that it is difficult to estimate the age of N370S with any confidence. Table 2 reports the expected time of the most recent common ancestor,  , and the 95% credible set, both based on the posterior distribution. The time t2, called the “coalescence time” by Risch et al. (2003), differs from t1, the time at which the allele arose by mutation (see fig. 1).
Similar results are found using two other marker loci. For D1S1600 (with allele 2 ancestral), i=258, jo=124, and pN=0.067. D1S1600 is ∼2.6 Mb from GBA, indicating θ=0.013. For no combination of N0 and N1 was neutrality rejected, and a founder event at tF=77.2 was possible under the same conditions as indicated by D1S2464. Similar results were obtained for D1S1595, considered by both Diaz et al. (2000) and Colombo (2000).
The other disease-associated mutation in AJ populations is 84GG, which has a frequency of ∼0.002 (Beutler et al. 1993). By use of the marker locus D1S2464 with allele 4 ancestral, i=32, jo=29, and pN=0.373 (Diaz et al. 2000). Neutrality was not rejected for any combination of N0 and N1. The difference from the results for N370S is that, for N1=600, the data are consistent with a founder event in a.d. 1348. Because 84GG is found at a much lower frequency than N370S, it could have attained its current frequency under drift alone if it arose more recently.
Mucolipidosis Type IV
Mucolipidosis type IV (MLIV [MIM #252650]) is an LSD caused by mutations at the MCOLN1 locus on chromosome 19p13.2-13.3. The most common disease-associated mutation in Ashkenazi Jews is an A→G transition in the acceptor spice site of the third intron (IVS3-1A→G) (Bargal et al. 2000). Slaugenhaupt et al. (1999) provided haplotype data for several linked marker loci. Here, I use the marker D19S406, which is ∼180 kb from MCOLN1. In this genomic region, the sex-averaged recombination rate is ∼2.5 cM/Mb (Matise et al. 2003), indicating θ=0.0045. From figure 2 of Slaugenhaupt et al. (1999), i=39, jo=38, and x=0.0036. Slaugenhaupt et al. (1999) did not genotype chromosomes not carrying IVS3-1A→G in the AJ population (S. Slaugenhaupt, personal communication), so I used a range of values of pN (0.1, 0.3, and 0.5). For all combinations of parameter values, neutrality was not rejected, and a founder event at a.d. 1348 was possible.
Adenomatous Polyposis Coli (APC)
The APC locus (MIM #175100) has an allele, I1307K (a T→A transition at nucleotide position 3920), that increases the relative risk of colorectal cancer by a factor of 1.5–2 (Niell et al. 2003). This allele presents an unusual opportunity to test the founder-effect hypothesis, because it has a high frequency in the AJ population, x=0.06, and it has a frequency >0.01 in Sephardi Jews. Niell et al. (2003) examined several closely linked marker loci and concluded from the application of the Slatkin-Bertorelle (2001) neutrality test that their data did not reject neutrality. That conclusion is confirmed for the more elaborate demographic model used here. In this case, to be consistent with the presence of this allele in the Sephardim at a significant frequency, a founder effect in the AJ population should be unlikely.
Results from the analysis of one of the linked markers, D5S135, are shown in table 3. The genetic parameters are i=87, jo=83, and pN=0.343. Two values of θ were used. The first, θ=0.0046, is based on the Kosambi map function calculation, and the second is 1/2 that value, which is slightly larger than the smallest recombination rate reported in the literature (based on table 5 of Niell et al. [2003]). Neutrality is not rejected in all cases with the smaller θ, but it was rejected in some cases with the larger θ.
Table 3.
Results of Analyzing Data for I1307K at APC and the Linked Marker Locus D5S135[Note]
|
Population Sizea |
Results When θ=.0046 |
Results When θ=.0023 |
|||||||||
| N0 | N1 | Pr(j⩾jo) | Pr(m⩽1)When tF=26 | Pr(m⩽1)When tF=77.2 |  |
Pr(j⩾jo) | Pr(m⩽1)When tF=26 | Pr(m⩽1)When tF=77.2 |  |
||
| 150 | 600 | .09 | 0 | .93 | .99 | .44 | 0 | .92 | 1.04 | ||
| 150 | 3,000 | .03 | 0 | .91 | 1.04 | .28 | 0 | .89 | 1.09 | ||
| 150 | 6,000 | .02 | 0 | .92 | 1.04 | .25 | 0 | .89 | 1.09 | ||
| 600 | 600 | .08 | 0 | .74 | 1.4 | .41 | 0 | .63 | 1.7 | ||
| 600 | 3,000 | .02 | 0 | .61 | 1.9 | .23 | 0 | .49 | 2.4 | ||
| 600 | 6,000 | .01 | 0 | .51 | 2.1 | .18 | 0 | .44 | 2.6 | ||
| 3,000 | 600 | .05 | 0 | .34 | 3.4 | .29 | 0 | .19 | 4.7 | ||
| 3,000 | 3,000 | .004 | 0 | 0 | 9.1 | .10 | 0 | .007 | 10.5 | ||
| 3,000 | 6,000 | .001 | 0 | 0 | 10.8 | .07 | 0 | 0 | 12.1 | ||
Note.— Results for each combination of N0 and N1 are based on weighted averages of 10,000 replicates. Genetic parameters are x=0.06, i=87, jo=83, and pN=0.343.
N0 is the assumed population size in a.d. 70 (t=77.2), and N1 is the assumed size in a.d. 1648 (t=26.08).
Table 3 shows that a founder event in a.d. 70 is likely for the smallest assumed population size, N0=150, but, even so, there is an ∼10% chance that two or more lineages carried I1307K. For N0=150 and 600, though, the inferred average number of lineages at a.d. 75 is small, suggesting that the allele had a low frequency before the founder event. Only if N0=3,000 is the average higher.
These results, combined with those for N370S for Gaucher disease, weakly constrain the possible demographic histories consistent with both data sets. N370S is rare in other Jewish populations and was probably introduced to them by later admixture with Ashkenazi Jews (Risch 2001). On the basis of table 2, data for N370S are consistent with the founder-effect hypothesis for any combination of N0 and N1, but a founder effect is least likely if N0=3,000 and N1=3,000 or 6,000. If I1307K at APC is present in Sephardi Jews because it originated before a.d. 70 and was carried by Sephardi ancestors, then results for N0=3,000 and N1=600 are most consistent with these two data sets considered together. The demographic model cannot be taken literally, but these results suggest that there was a severe reduction in population size during the period between a.d. 1100 and 1400 and a less severe reduction in size after a.d. 70. A severe bottleneck in a.d. 70 or additional bottlenecks between a.d. 70 and 1348 would make a founder effect in Ashkenazi Jews more likely and, hence, would make it more difficult for I1307K at APC not to have undergone a founder effect in a.d. 70.
Other NLSDs
Several other NLSDs are caused by alleles found only in AJ individuals. Table 4 shows results of the analysis of data from five such alleles. All of these alleles are present at lower frequencies than N370S and I1307K and, hence, are easier to fit with the founder-effect hypothesis. The results in table 4 were generated using only one demographic model, N0=3,000 and N1=600, but results for other combinations were similar. Neutrality cannot be rejected, and the data are consistent with a founder effect. Only for the allele in highest frequency (at DYS) is a founder effect at a.d. 1348 rejected.
Table 4.
Analysis of Alleles Causing NLSDs[Note]
| Locus | Allele | Marker | Referencea | x | i | jo | pN | θ | Pr(j⩾jo) | Pr(m⩽1)When tF=26 | Pr(m⩽1)When tF=77.2 |
| BRCA1 | 185delAG | D17S1320 | Neuhausen et al. 1996 | .01 | 15 | 15 | .27 | .005 | .26 | .15 | .97 |
| BLM | blmAsh | D15S1108 | Ellis et al. 1998 | .0047 | 52 | 43 | .1b | .00025 | .98 | .58 | .97 |
| DYS | 2057+6T→Cc | D9S261 | Blumenfeld et al. 1999 | .0158 | 435 | 403 | .53 | .008 | .33 | .02 | .93 |
| ITY1 | GAG deletiond | ASS | Risch et al. 1995b | .0005 | 54 | 47 | .09 | .018 | .07 | .98 | .99 |
| LDLR | G197del | D19S865 | Durst et al. 2001 | .0074 | 37 | 26 | .22 | .026 | .21 | .22 | .99 |
Note.— All results are based on 10,000 replicates with N0=3,000 and N1=600.
References are to the articles from which the genetic parameters (x, i, jo, pN, and θ) were extracted.
Ancestral marker allele frequency not available. Similar results were obtained for other values of pN.
Causative allele was identified and named by Anderson et al. (2001).
Causative allele was identified by Ozelius et al. (1997).
Allele Age and Allele Frequency
Although the results presented here support the main conclusion of Risch et al. (2003) that founder effects are sufficient to account for AJ Mendelian diseases, they do not support the more detailed conclusions concerning the times at which the founder events took place. In fact, they contradict the claim that the alleles with frequencies >1.5% (at GBA, APC, and DYS) could have reached those frequencies because of a founder event 40–50 generations ago. Instead, those alleles probably originated much earlier and were affected by the founder event in a.d. 70. The reason for this difference is that the method used here for estimating allele age takes explicit account of allele frequency, whereas Risch et al. (2003) and the studies cited therein use methods that estimate age only from the pattern of LD with linked markers (jo in the notation here) and not from the allele frequency.
To determine how much information about allele age is given by jo alone, I performed a simple forward simulation. In each replicate, a neutral allele was introduced in a single copy in a population with the history of population sizes given in table 1 (with N0=3,000 and N1=600). The time at which it was introduced (t1, the allele age) was chosen randomly from a distribution proportional to N(t), because the number of targets for mutation at a locus each generation is twice the population size. The simulation generated the number of copies in each generation between t=t1 generations in the past and t=0 (the present) by use of a Wright-Fisher model and retained the replicate if the frequency at 0 was within a specified range. For each replicate retained, a neutral coalescent process was run backwards to generate the intra-allelic genealogy of the i copies of A in a sample. On that genealogy, a two-state Markov chain was simulated, representing the transitions from AM to Am chromosomes and the reverse, given values of θ and pM and under the assumption that the ancestral A chromosome carried M at the marker locus. Each such replicate resulted in a value of jo, the observed number of AM chromosomes at t=0, and the value of t2, the time of the most recent common ancestor of the intra-allelic genealogy. Figure 3 shows the results of 1,000 replicates for parameter values chosen to mimic the N370S allele at GBA (cf. table 2 and fig. 2).
Figure 3.

Scatterplot of t2 (the coalescence time of all copies of A) and jo (the number of nonrecombinants) generated in 1,000 replicate forward simulations of a neutral allele that was in one copy t1 generations in the past and was found at t=0 with a frequency between 0.027 and 0.037 (i.e., x=0.032±0.005, which was chosen to match the frequency of N370S at GBA, 0.032). In each replicate, the allele age (t1) was chosen randomly from a probability distribution on t in which Pr(t) is proportional to N(t), where N(t) is based on table 1 with N0=600 and N1=3,000. Parameters for A and the linked marker are the same as for N370S at GBA: i=268, jo=163, pN=0.205, and θ=0.007 (cf. table 2).
It is clear from figure 3 that a given t2 is consistent with a wide range of values of jo and that a given jo is consistent with a wide range of values of t2. Similar results were obtained in other cases. The reason there is so much scatter is that a single recombination event early in the intra-allelic genealogy can result in multiple recombinant chromosomes, an effect similar to the well-known jackpot effect in the Luria-Delbrück model (Luria and Delbrück 1943). Under these assumptions, the correlation between jo and t2 is not strong enough for jo alone to provide a reliable estimate of t2.
To illustrate how difficult it is for a recent founder event to result in an allele having a relatively high frequency, I adapted Kimura’s (1955) model to allow for variable population size. When this theory, which is outlined in the appendix, is used, it is possible to compute the probability that an allele that exists initially as one copy in a.d. 1348 has a frequency y at least as large as a specified frequency x. Figure 4 shows the results for two different population sizes in a.d. 1348 (200 and 1,000, corresponding to census sizes of 600 and 3,000). Even with N1=200, there is only a very low probability (<0.02) that an allele carried by one of the 400 founder chromosomes could reach a frequency >0.015.
Figure 4.

The probability that an allele present in one copy at t=0 is still segregating and has a frequency of at least x 26.08 generations later. Calculations were made using the theory described in the appendix.
Discussion and Conclusions
The founder-effect hypothesis has two components: the allele is neutral, and all copies are descended from a copy that was either carried by one of the founding individuals or arose later by mutation. The method introduced here tests both parts of this hypothesis. The tests are model-based, meaning that an explicit population-genetic model is used. Any such model is only a crude approximation of reality, but it is useful if it incorporates the most important features of the processes considered and if the conclusions are robust to violations of the underlying assumptions.
For the application to AJ Mendelian disease alleles, the genetic assumptions are that chromosomes carrying the nonancestral allele were generated by recombination of A-bearing chromosomes with non-A chromosomes and that the frequency of marker alleles on non-A chromosomes did not change. The first of these assumptions requires that recombination between A-bearing chromosomes is sufficiently infrequent that it can be ignored, which is reasonable for the low-frequency disease-associated alleles considered here. The results are not sensitive to deviations from the second assumption. Temporal variation in the background marker frequencies result in only minor changes in the results of the neutrality test (author's unpublished simulations).
The demographic assumptions for the AJ population are more problematic. Estimated population sizes after a.d. 1500 are based on historical records, but, even so, there are differences of opinion about how those records are interpreted (Risch et al. 1995a; Zoossmann-Diskin 1995). Before 1500, the historical record is meager, and only a broad outline of the history of populations ancestral to Ashkenazi Jews is known. The demographic assumptions used here allow for a bottleneck in size in a.d. 1348, after the expulsion of Jews from France and Germany and after the Black Death. The actual date of the bottleneck is not as important as the fact that the effective size decreased dramatically after the peak in size at a.d. ∼1100. Varying N1 allows investigation of bottlenecks of varying severity.
Similarly, assuming a constant exponential growth rate from a size N0 in a.d. 70 until ∼1100 is not realistic, but it embodies the idea that there was a bottleneck early in the Diaspora. If there were additional bottlenecks, as seems likely, their effects are included in N0, which indicates the overall potential for a founder effect between a.d. 70 and 1100. Given the absence of more-detailed historical records during this period, more-elaborate demographic assumptions are not called for.
The model assumes no population subdivision and thus ignores the fact that, until the 20th century, movement among different parts of the AJ population must have been restricted. Because the disease-associated alleles considered here are widespread in the AJ population (Risch and Tang 2003), the problem is to explain the overall allele frequency and extent of LD with linked markers, not patterns of variation among different AJ subpopulations. When considering the populationwide allele frequencies, population subdivision can be allowed for by increasing the effective population size in a coalescent model (Nordborg and Krone 2002).
Statistical Power of the Neutrality Test
Although neutrality is not rejected for the alleles considered here, the test is not expected to have much statistical power unless selection is very strong. The reason is that, roughly speaking, the prior distribution of allele age, on which the test depends, is a function primarily of r+s, where r is the population growth rate and s is the selective advantage of heterozygous carriers (Slatkin 2002). During the past 500 years, the AJ population has grown at a rate of ∼40% per 25-year generation (r=0.4). Therefore, even selection thought to be strong—say, s=0.1—will not affect the prior distribution of age by much.
I determined the power of the neutrality test by using the forward simulation described above and assuming a selective advantage to heterozygous carriers of s=0.1. With parameters chosen to match I1307K at APC (see table 3), and with N0=3,000 and N1=600, neutrality was rejected for only 28.4% of the replicates if the allele was additive in its effect on fitness. Assuming heterozygote advantage makes little difference, because the allele frequency is so small. If homozygous individuals have a 20% lower fitness than normal homozygotes (i.e., 30% lower than heterozygotes), neutrality is rejected in 26.9% of the replicates.
The failure to reject neutrality for the alleles considered here does not provide strong evidence that they are actually neutral. But selection is not needed to account for their presence in the AJ population or the degree of LD with linked markers. A founder effect is sufficient.
Overrepresentation of LSDs
One of the strongest arguments in favor of heterozygote advantage is that alleles causing four different LSDs are found in relatively high frequency in the AJ population, despite their deleterious effects on homozygous individuals (Diamond 1994; Motulsky 1995). The analysis performed here shows that founder effects can account for the disease-associated alleles at GBA and MLIV, but it does not answer the question of why those loci and not others have alleles at relatively high frequencies in the AJ population. I suggest that alleles at the four LSD loci do not give a fitness advantage to heterozygous carriers, but they also do not reduce the fitness of carriers. Completely recessive alleles can increase in frequency when rare because of genetic drift alone. However, if those alleles are even slightly deleterious to heterozygotes, the chance of increasing in frequency in a small population is greatly diminished. In Drosophila, most mutations that are strongly deleterious to homozygous individuals also are slightly deleterious to heterozygotes (Crow 1979). If that is true in humans, then we would expect many apparently recessive genetic diseases to slightly decrease heterozygote fitness. Those that do not would be exceptional. If mutations at HEXA, responsible for Tay-Sachs disease, are completely recessive, that would help explain why Tay-Sachs has an elevated frequency in other isolated populations, including French Canadians, Acadians of Louisiana, and other populations (Risch 2001).
Acknowledgments
This research was supported by National Institutes of Health grant R01-GM40282 and by the Miller Institute for Basic Research in Science. I thank B. L. Niell and S. Slaugenhaupt for providing additional information about their papers; G. M. Cockeran for discussions that motivated the analysis of Ashkenazi Jewish diseases; and B. Rannala, L. Excoffier, A. Motulsky, B. L. Neill, N. Risch, M. P. H. Stumpf, and K. Wachter, for discussions and for comments on an earlier draft of this article.
Appendix
In a population of effective size N(t) at time t, the probability distribution of the frequency x of an allele is described approximately by the time-dependent diffusion equation
 |
(Kimura 1955), where φ(x,t) is the probability distribution of x at t. Time can be rescaled by defining
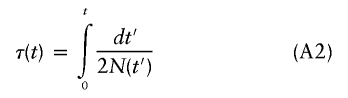 |
(Griffiths and Tavaré 1994), and equation (A1) can be rewritten, in terms of τ, as
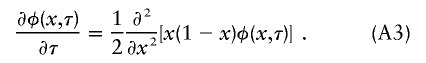 |
Kimura (1955) derived the complete solution to equation (A3) under the assumption that the frequency at 0 is p. The solution is an infinite sum of products of hypergeometric functions that is easy to evaluate using a computer algebra program. For a given N(t) and a particular time of interest—say, t*—it is necessary only to use equation (A2) to compute the corresponding τ*.
To find the probability that an allele initially present in one copy at t=0 has a frequency ⩾x at τ*, which is what is plotted in figure 4, the integral x1φ(y,τ*)dy is needed. It was much more efficient computationally to integrate each term in the series analytically and then compute the sum than it was to numerically integrate the series itself. The results plotted in figure 4 also account for the fact that the allele considered is still segregating at t*. In the model of the AJ population with t*=26.04 (a.d. 1348), τ*=0.00477 and p=0.0025 for N1=200, and τ*=0.00175 and p=0.0005 for N1=3,000.
Electronic-Database Information
The URLs for data presented herein are as follows:
- Online Mendelian Inheritance in Man (OMIM), http://www.ncbi.nlm.nih.gov/Omim/ (for type I Gaucher disease, MLIV, and APC)
- Slatkin Laboratory Genetics Software, http://ib.berkeley.edu/labs/slatkin/software.html
- TSC SNP Linkage Map, http://compgen.rutgers.edu/SNPmap/
- UCSC Human Genome Browser, http://genome.ucsc.edu/cgi-bin/hgGateway
References
- Anderson SL, Coli R, Daly IW, Kichula EA, Rork MJ, Volpi SA, Ekstein J, Rubin BY (2001) Familial dysautonomia is caused by mutations of the IKAP gene. Am J Hum Genet 68:753–758 [DOI] [PMC free article] [PubMed] [Google Scholar]
- Bargal R, Avidan N, Ben-Asher E, Olender Z, Zeigler M, Frumkin A, Raas-Rothschild A, Glusman G, Lancet D, Bach G (2000) Identification of the gene causing mucolipidosis type IV. Nat Genet 26:118–123 10.1038/79095 [DOI] [PubMed] [Google Scholar]
- Barnavi E (ed) (1992) A historical atlas of the Jewish people: from the time of the Patriarchs to the present. Knopf, New York [Google Scholar]
- Beutler E, Nguyen NJ, Henneberger MW, Smolec JM, McPherson RA, West C, Gelbart T (1993) Gaucher disease: gene frequencies in the Ashkenazi Jewish population. Am J Hum Genet 52:85–88 [PMC free article] [PubMed] [Google Scholar]
- Blumenfeld A, Slaugenhaupt SA, Liebert CB, Temper V, Maayan C, Gill S, Lucente DE, Idelson M, MacCormack K, Monahan MA, Mull J, Leyne M, Mendillo M, Schiripo T, Mishori E, Breakefield X, Axelrod FB, Gusella JF (1999) Precise genetic mapping and haplotype analysis of the familial dysautonomia gene on human chromosome 9q31. Am J Hum Genet 64:1110–1118 [DOI] [PMC free article] [PubMed] [Google Scholar]
- Colombo R (2000) Age estimate of the N370S mutation causing Gaucher disease in Ashkenazi Jews and European populations: a reappraisal of haplotype data. Am J Hum Genet 66:692–697 [DOI] [PMC free article] [PubMed] [Google Scholar]
- Crow JF (1979) Minor viability mutants in Drosophila. Genetics 92:s165–s172 [PubMed] [Google Scholar]
- Diamond JM (1994) Human genetics: Jewish lysosomes. Nature 368:291–292 10.1038/368291a0 [DOI] [PubMed] [Google Scholar]
- Diaz GA, Gelb BD, Risch N, Nygaard TG, Frisch A, Cohen IJ, Miranda CS, Amaral O, Maire I, Poenaru L, Caillaud C, Weizberg M, Mistry P, Desnick RJ (2000) Gaucher disease: the origins of the Ashkenazi Jewish N370S and 84GG acid β-glucosidase mutations. Am J Hum Genet 66:1821–1832 [DOI] [PMC free article] [PubMed] [Google Scholar]
- Durst R, Colombo R, Shpitzen S, Avi LB, Friedlander Y, Wexler R, Raal FJ, Marais DA, Defesche JC, Mandelshtam MY, Kotze MJ, Leitersdorf E, Meiner V (2001) Recent origin and spread of a common Lithuanian mutation, G197del LDLR, causing familial hypercholesterolemia: positive selection is not always necessary to account for disease incidence among Ashkenazi Jews. Am J Hum Genet 68:1172–1188 [DOI] [PMC free article] [PubMed] [Google Scholar]
- Ellis NA, Ciocci S, Proytcheva M, Lennon D, Groden J, German J (1998) The Ashkenazic Jewish Bloom syndrome mutation blmAsh is present in non-Jewish Americans of Spanish ancestry. Am J Hum Genet 63:1685–1693 [DOI] [PMC free article] [PubMed] [Google Scholar]
- Engleman UZ (1960) Sources of Jewish statistics. In: Finkelstein J (ed) The Jews: their history, culture and religion. Vol 2. Harper, New York, pp 1172–1197 [Google Scholar]
- Fraikor AL (1977) Tay-Sachs disease: genetic drift among the Ashkenazim Jews. Soc Biol 24:117–134 [DOI] [PubMed] [Google Scholar]
- Frisch A, Colombo R, Michaelovsky E, Karpati M, Goldman B, Peleg L (2004) Origin and spread of the 1278insTATC mutation causing Tay-Sachs disease in Ashkenazi Jews: genetic drift as a robust and parsimonious hypothesis. Hum Genet 114:366–376 10.1007/s00439-003-1072-8 [DOI] [PubMed] [Google Scholar]
- Goldstein DB, Reich DE, Bradman N, Usher S, Seligsohn U, Peretz H (1999) Age estimates of two common mutations causing factor XI deficiency: recent genetic drift is not necessary for elevated disease incidence among Ashkenazi Jews. Am J Hum Genet 64:1071–1075 [DOI] [PMC free article] [PubMed] [Google Scholar]
- Griffiths RC, Tavaré S (1994) Sampling theory for neutral alleles in a varying environment. Philos Trans R Soc Lond B Biol Sci 344:403–410 [DOI] [PubMed] [Google Scholar]
- Hill WG (1972) Effective size of populations with overlapping generations. Theor Popul Biol 3:278–289 [DOI] [PubMed] [Google Scholar]
- Kimura M (1955) Solution of a process of random genetic drift with a continuous model. Proc Natl Acad Sci USA 41:144–150 [DOI] [PMC free article] [PubMed] [Google Scholar]
- Lewontin RC (1964) The interaction of selection and linkage. I. General considerations; heterotic models. Genetics 49:49–67 [DOI] [PMC free article] [PubMed] [Google Scholar]
- Luria SE, Delbrück M (1943) Mutations of bacteria from virus sensitivity to virus resistance. Genetics 28:491–511 [DOI] [PMC free article] [PubMed] [Google Scholar]
- Matise TC, Sachidanandam R, Clark AG, Kruglyak L, Wijsman E, Kakol J, Buyske S, et al (2003) A 3.9-centimorgan-resolution human single-nucleotide polymorphism linkage map and screening set. Am J Hum Genet 73:271–284 [DOI] [PMC free article] [PubMed] [Google Scholar]
- Motulsky AG (1979) Possible selective effects of urbanization on Ashkenazi Jews. In: Goodman RM, Motulsky AG (eds) Genetic diseases among Ashkenazi Jews. Raven Press, New York, pp 301–314 [Google Scholar]
- ——— (1995) Jewish diseases and origins. Nat Genet 9:99–101 [DOI] [PubMed] [Google Scholar]
- Mourant AE, Kopec AC, Domaniewska-Sobczak K (1978) The genetics of Jews. Clarendon Press, Oxford [Google Scholar]
- Neuhausen SL, Mazoyer S, Friedman L, Stratton M, Offit K, Caligo A, Tomlinson G, Cannon-Albright L, Bishop T, Kelsell D, Solomon E, Weber B, Couch F, Struewing J, Tonin P, Durocher F, Narod S, Skolnick MH, Lenoir G, Serova O, Ponder B, Stoppa-Lyonnet D, Easton D, King MC, Goldgar DE (1996) Haplotype and phenotype analysis of six recurrent BRCA1 mutations in 61 families: results of an international study. Am J Hum Genet 58:271–280 [PMC free article] [PubMed] [Google Scholar]
- Niell BL, Long JC, Rennert G, Gruber SB (2003) Genetic anthropology of the colorectal cancer-susceptibility allele APC I1307K: evidence of genetic drift within the Ashkenazim. Am J Hum Genet 73:1250–1260 [DOI] [PMC free article] [PubMed] [Google Scholar]
- Nordborg M, Krone SM (2002) Separation of time scales and convergence to the coalescent in structured populations. In: Slatkin M, Veuille M (eds) Modern developments in theoretical population genetics. Oxford University Press, New York, pp 194–232 [Google Scholar]
- Ozelius LJ, Hewett JW, Page CE, Bressman SB, Kramer PL, Shalish C, De Leon D, Brin MF, Raymond D, Corey DP, Fahn S, Risch NJ, Buckler AJ, Gusella JF, Breakefield XO (1997) The early-onset torsion dystonia gene (DYT1) encodes an ATP-binding protein. Nat Genet 17:40–48 [DOI] [PubMed] [Google Scholar]
- Risch N (2001) Molecular epidemiology of Tay-Sachs disease. Adv Genet 44:233–252 [DOI] [PubMed] [Google Scholar]
- Risch N, de Leon D, Fahn S, Bressman S, Ozelius L, Breakefield X, Kramer P, Almasy L, Singer B (1995a) ITD in Ashkenazi Jews—genetic drift or selection?: in reply. Nat Genet 11:14–15 [DOI] [PubMed] [Google Scholar]
- Risch N, de Leon D, Ozelius L, Kramer P, Almasy L, Singer B, Fahn S, Breakefield X, Bressman S (1995b) Genetic analysis of idiopathic torsion dystonia in Ashkenazi Jews and their recent descent from a small founder population. Nat Genet 9:152–159 [DOI] [PubMed] [Google Scholar]
- Risch N, Tang H (2003) Selection in the Ashkenazi Jewish population unlikely—reply to Zlotogora and Bach. Am J Hum Genet 73:440–441 [DOI] [PMC free article] [PubMed] [Google Scholar]
- Risch N, Tang H, Katzenstein H, Ekstein J (2003) Geographic distribution of disease mutations in the Ashkenazi Jewish population supports genetic drift over selection. Am J Hum Genet 72:812–822 [DOI] [PMC free article] [PubMed] [Google Scholar]
- Rotter JI, Diamond JM (1987) What maintains the frequencies of human genetic diseases? Nature 329:289–290 10.1038/329289a0 [DOI] [PubMed] [Google Scholar]
- Slatkin M (2002) The age of alleles. In: Slatkin M, Veuille M (eds) Modern developments in theoretical population genetics. Oxford University Press, Oxford, pp 233–259 [Google Scholar]
- Slatkin M, Bertorelle G (2001) The use of intra-allelic variability for testing neutrality and estimating population growth rate. Genetics 158:865–874 [DOI] [PMC free article] [PubMed] [Google Scholar]
- Slaugenhaupt SA, Acierno JS Jr, Helbling LA, Bove C, Goldin E, Bach G, Schiffmann R, Gusella JF (1999) Mapping of the mucolipidosis type IV gene to chromosome 19p and definition of founder haplotypes. Am J Hum Genet 65:773–778 [DOI] [PMC free article] [PubMed] [Google Scholar]
- Thompson EA, Neel JV (1996) Private polymorphisms: how many? how old? how useful for genetic taxonomies? Mol Phylogenet Evol 5:220–231 10.1006/mpev.1996.0015 [DOI] [PubMed] [Google Scholar]
- ——— (1997) Allelic disequilibrium and allele frequency distribution as a function of social and demographic history. Am J Hum Genet 60:197–204 [PMC free article] [PubMed] [Google Scholar]
- Vogel F, Motulsky AG (1996) Human genetics: problems and approaches. Springer-Verlag, New York [Google Scholar]
- Weinryb BD (1972) The Jews of Poland: a social and economic history of the Jewish community in Poland from 1100 to 1800. Jewish Publication Society of America, Philadelphia [Google Scholar]
- Zlotogora J, Zeigler M, Bach G (1988) Selection in favor of lysosomal storage disorders? Am J Hum Genet 42:271–273 [PMC free article] [PubMed] [Google Scholar]
- Zoossmann-Diskin A (1995) ITD in Ashkenazi Jews—genetic drift or selection? Nat Genet 11:13–15 [DOI] [PubMed] [Google Scholar]