

Abstract
Purpose
Glutamine is an essential amino acid for the synthesis of glutathione (GSH), the major endogenous antioxidant which protects cells from oxidative injury. To evaluate the effects of glutamine concentrations, cell growth, GSH levels, oxidative stress, and chemosensitivity were evaluated in neuroblastoma cell lines.
Methods
Three human neuroblastoma cell lines (SMS-KCNR, SMS-KANR, SMS-LHN) were cultured with different concentrations of glutamine (2, 0.2 and 0 mM) under hypoxic (5% O2) or normoxic (20% O2) condition. Cell proliferation and chemosensitivity were determined by MTT assay, and the levels of intracellular GSH were measured by DTNB-GSSG reductase method. Cellular reactive oxidative species (ROS) were quantified by flow cytometry.
Results
There was a significant decrease of cell growth in low glutamine (0.2 and 0 mM) compared with control (2 mM) in all three cell lines (P < 0.01), while adding GSH partially restored the reduced cell proliferation by low glutamine. The levels of GSH in neuroblastoma cells decreased significantly in low glutamine compared with the levels of control cells cultured in 2 mM glutamine (P < 0.05), and the accumulation of cellular ROS was significantly higher in 0 mM glutamine compared to the control. Moreover, glutamine deprivation significantly enhanced cytotoxicity of L-PAM in all three cell lines, which was abolished after addition of GSH.
Conclusion
Glutamine deprivation decreased cell proliferation and enhances cell chemosensitivity in neuroblastoma, which is presumably associated with GSH depletion.
Keywords: Neuroblastoma, Glutamine, Glutathione (GSH), Chemosensitivity, L-PAM, Hypoxia, Oxidative stress
Introduction
Glutamine is the most abundant free amino acid in the bloodstream, accounting for 30–50% of the amino acid nitrogen in the plasma. It serves as a metabolic intermediate by contributing carbon and nitrogen to the synthesis of other amino acids, nucleic acids, fatty acids and proteins. Glutamine also regulates cellular proliferation and apoptosis, and promotes the synthesis of specific proteins (Neu et al. 1996; Wasa et al. 1996; Chang et al. 1999; Curi et al. 2005). Moreover, glutamine, via glutamate, is an essential amino acid for the synthesis of glutathione (GSH), the major endogenous antioxidant that protects cells from oxidative injury and detoxifies alkylating agents (Meister 1991; Roth et al. 2002). Previous studies showed that starving cells of glutamine results in energy depletion, decreased immune defense, increased apoptosis and a reduced level of GSH (Oehler and Roth 2003). It is also known that high intracellular GSH levels in cancer cells are associated with high cellular proliferation rates and drug resistance (Green et al. 1984; Fernandes and Cotter 1994, Anderson et al. 1997).
In contrast, some in vivo studies demonstrated that glutamine-enriched diets enhance tumor death and diminish GSH levels. It is not clear whether glutamine improves or impairs the efficacy of chemotherapeutic treatments, nor whether particular types of cancer patient might benefit from glutamine administration.
Neuroblastoma is the most frequent solid extracranial neoplasia in children, and is responsible for about 15% of all pediatric cancer deaths (Gurney et al. 1997). It is a tumor of the sympathetic nervous system and has been reported to produce increased amounts of oxygen intermediates during synthesis of catecholamines and to store high amounts of reduced iron that can interact with hydrogen peroxide to produce hydroxyl radical via the Fenton reaction (Anderson et al. 1999). In order to survive this oxidative stress, neuroblastomas depend on the presence of antioxidants, particularly GSH. Furthermore, GSH conjugates with alkylating agents, such as L-PAM, and detoxifies by transporting these alkylating agents out of cells (Tew et al. 1993; Schroder et al. 1996). Buthionine sulfoximine (BSO), which inhibits the synthesis of GSH, is known to be beneficial in patients with neuroblastoma and has been used in a clinical trial in combination with L-PAM (Anderson et al. 1998).
We evaluated the effects of glutamine deprivation in three neuroblastoma cell lines cultured under both normoxic and hypoxic conditions. We found that cellular proliferation rates, intracellular GSH levels and chemosensitivity of neuroblastoma cell lines varied depending on the concentration of extracellular glutamine. Additionally, we suggest that the decreased rates of cell proliferation and reduction in L-PAM resistance seen under conditions of low glutamine are mediated by GSH. Our data indicate that lowering systemic glutamine levels may be of therapeutic value to patients with neuroblastoma.
Methods
Cell culture
Human neuroblastoma cell lines (SMS-KCNR, SMS-KANR, SMS-LHN) were continuously cultured in RPMI 1640 medium (Sigma-Aldrich, St Louis, MO, USA) with 10% fetal bovine serum (FBS) and supplemented with 2 mM l-glutamine (GIBCO, Invitrogen Co., Carsbad, CA, USA) at 37°C in 5% CO2. Cells were grown without antibiotics. Puck’s Saline A plus EDTA was used to detach cells from culture plates or flasks. The culture medium was changed every 3 days until cells were confluent. Experiments were carried out at passages 15–30.
Cell growth
The cells (7,000 cells/well) were cultured in 96-well microtiter plates with various concentrations of glutamine (2 mM as control, 0.2 and 0 mM) under hypoxic (5% O2) or normoxic (20% O2) conditions in replicates of 8–16 wells per treatment group. Additionally, to examine if the effects of low glutamine could be restored by adding GSH, 1 mM GSH was added to the culture media. After 6 days of culture, cell growth rate was measured by the 3-(4-5-dimethylthiazol-2-yl)-2, 5-diphenyl tetrazolium bromide (MTT; Sigma) assay. The percent survival was calculated by dividing the OD reading of cells of a given treatment group by the OD reading for the same cells cultured in 2 mM glutamine (control), and multiplying by 100.
Cell viability was assessed using the trypan blue exclusion technique. The cells (1 × 10⁵ cells/well) were cultured in 12-well plates with different concentrations of glutamine. After 6 days of culture, trypan blue isotonic solution was added and the total numbers of cells were counted in four replicates. Deeply stained cells were counted as dead cells.
Microphotographs of SMS-KCNR cells cultured in the absence or presence (2 mM) of glutamine for 6 days were visualized and photographed using an Olympus phase contrast microscope.
Drug sensitivity assay
Prior to the assay, the cells were preincubated in culture media with 2, 0.2 or 0 mM glutamine for 7 days. The cells were seeded at a density of 7,000 cells/well in 96-well microtiter plates, with replicates of 16 wells per treatment group. At the end of the preincubation period, L-PAM (Sigma), at a concentration equivalent to the clinically achievable plasma level (0.0192–12 μg/ml), was added on day 0 and the cells were incubated for 6 days. Cell viability was determined by the MTT assay and calculated by dividing the OD reading of cells treated with a given concentration of L-PAM by the OD reading for the same cells cultured without L-PAM at each glutamine concentration (2, 0.2 and 0 mM), and multiplying by 100.
MTT assay
Cell proliferation rate and drug sensitivity were determined by means of the MTT assay. The cell culture medium was removed and replaced by serum-free-medium containing 50 μg/ml of MTT. The cells were then incubated for 2 h. This medium was removed and, after solubilization of the formazan crystals with dimethyl sulfoxide (Wako, Osaka, Japan), absorption at 570 nm was measured in a spectrophotometer. Cell viability was considered to be linearly proportional to the color intensity measurements. Each treatment group was tested in replicates of eight or more microwells.
Measurement of glutathione
Cells were seeded into 3.5 cm2 tissue culture flasks at 1 × 10⁵ cells/flask. The cells were cultured in various concentration of glutamine (2, 0.2 and 0 mM) for 6 days in 5% O2 (hypoxia) or 20% O2 (normoxia). For the SMS-KCNR cell line, GSH was added to the culture media to a final concentration of 1 mM. Cells were harvested using Puck’s EDTA, washed in phosphate-buffered saline (PBS), and lysed in 1% Triton-X in 10 mM HCl. Total GSH content was measured by the DTNB 5,5′-dithiobis-(2-nitrobenzoic acid)-GSSG reductase method (Vandeputte et al. 1994) using 96-well plates and a microplate reader (Bio-Rad, Hercules, CA, USA) for 2 min at 405 nm. OD values were converted to nanomoles of total GSH by the use of a standard curve generated from OD measurements of samples containing known concentrations of GSH (Sigma). The total amount of protein in the sample was determined and the level of GSH was expressed as the value per mg protein. Each determination was performed in triplicate.
Measurement of reactive oxygen species production
Intracellular redox levels were measured using the fluorescent dye 2′,7′-dichlorodihydrofluorescein diacetate (H2DCFDA) (Frenkel and Gleichauf 1991). DCFDA becomes oxidized to the fluorescent compound DCF in the presence of H2O2. SMS-KCNR cells (1 × 10⁶ cells in 25 cm2 flask) were incubated with either 2, 0.2 or 0 mM glutamine for 6 days in 20% O2. Cells were then washed with PBS, and resuspended in 500 μl PBS containing 5 μM H2DCFDA. Cellular reactive oxygen species (ROS) was analyzed using a FACS Caliber flow cytometer (Becton Dickinson, Franklin Lakes, NJ, USA): 1 × 10⁴ cells were analyzed in list mode and dead cells excluded by light scatter. The mean fluorescence intensity of control (2 mM) cells was set to 1, and the level of intracellular ROS was expressed relative to the mean fluorescence intensity of cells cultured with reduced (0.2 and 0 mM) glutamine. ROS measurements were performed in five replicates.
Statistical analysis
All data are expressed as mean ± standard errors. Two-sided Student’s t tests (Microsoft Excel 2000 software) were used to identify statistically significant differences. P < 0.05 was taken as statistically significant.
Results
Cell growth
A higher rate of proliferation was found under hypoxia compared to normoxia in all three cell lines. At glutamine concentrations of 0.2 and 0 mM, there was a statistically significant decrease in the rate of cellular proliferation compared with the control in all three cell lines.
After 6 days culture with 0.2 or 0 mM glutamine under normoxia (20% O2), the rate of cellular proliferation was reduced to 57.4 ± 6.3 or 47.7 ± 5.5%, respectively, of the control (2 mM glutamine) in SMS-KCNR, 84.3 ± 10.1 or 80.5 ± 8.5%, respectively, of control in SMS-KANR, and 80.1 ± 9.6 and 70.6 ± 7.3%, respectively, of control in SMS-LHN. In all cell lines, the reductions at 0.2 and 0 mM glutamine were highly significant (P < 0.01). Under hypoxia (5% O2), proliferation of SMS-KCNR cells cultured with 0.2 or 0 mM glutamine was reduced to 77.3 ± 5.9 or 51.6 ± 3.1%, respectively, of control (2 mM), 95.0 ± 5.2 or 76.2 ± 8.9%, respectively, in SMS-KANR, and 82.3 ± 4.6 or 64.8 ± 8.0%, respectively, of control in SMS-LHN. Statistical analyses showed these reductions to be significant (P < 0.01, except P < 0.05 for 0.2 mM in SMS-KANR). Thus, the effect of reducing glutamine concentration on cellular proliferation was greater under normoxia than hypoxia. Adding GSH to culture media in cells cultured with reduced glutamine (0.2 or 0 mM) partially restored the rate of cellular proliferation. Except 0 mM glutamine cultured at hypoxia in SMS-KCNR (P = 0.3), additional GSH improved the proliferation rate significantly (P < 0.05, 0.2 mM SMS-KCNR at hypoxia; P < 0.01, SMS-KCNR at normoxia; P < 0.01, SMS-KANR; P < 0.01, SMS-LHN) at the range between 4 and 27% (Fig. 1).
Fig. 1.

Effect of glutamine concentration on cell growth in SMS-KCNR, SMS-KANR and SMS-LHN. Cells were cultured in 2, 0.2 or 0 mM glutamine, with or without GSH under hypoxic (5% O2) or normoxic (20% O2) conditions. Bars show the mean OD, and error bars indicate SD. * P < 0.05, ** P < 0.01 compared to the control (2 mM glutamine)
The numbers of live cells were significantly lower in cells cultured with reduced glutamine (0.2 and 0 mM) compared to the control (P < 0.05, control vs. 0.2 mM; P < 0.01, control vs. 0 mM). In contrast, the numbers of dead cells were significantly higher in cells cultured with 0.2 and 0 mM glutamine compared to the control (P < 0.05, control vs. 0.2 mM; P < 0.01, control vs. 0 mM) (Fig. 2). Microphotographs of SMS-KCNR cells revealed that cells cultured in 2 mM glutamine appeared well spread whereas those cultured without glutamine appeared spherical or partially spread (Fig. 3). Thus, compared to controls, glutamine deprivation resulted in a decrease in cell numbers and a loss of typical cell shape.
Fig. 2.

Effect of glutamine concentration on cell viability in SMS-KCNR. The cells (1 × 10⁵ cells/well) were cultured in 12-well plates with 2, 0.2 or 0 mM glutamine for 6 days. The total numbers of cells of live and dead were assessed by using the trypan blue exclusion technique and counted in triplicates. Bars show the mean cell count, and error bars indicate SD. * P < 0.05, ** P < 0.01 compared to the control (2 mM glutamine)
Fig. 3.
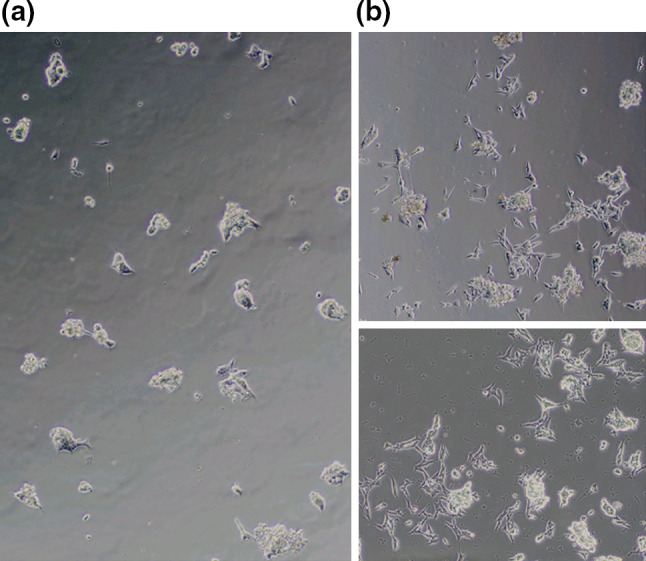
Microphotographs of SMS-KCNR cultured in the absence (0 mM, left) or presence (2 mM, right) of glutamine for 6 days, visualized and photographed using an Olympus phase contrast microscope. Control cells incubated with 2 mM glutamine reveals typical shape with extended neurites (right), whereas cells incubated without glutamine appears partially spread (left)
Glutathione levels
In all three cell lines, cells with reduced glutamine had significantly decreased levels of GSH under normoxia (P < 0.05) compared to controls (2 mM glutamine). In SMS-KCNR, the intracellular GSH level in the control (2 mM) was 125.1 ± 4.5 nmol/mg protein; this was significantly higher than 112.5 ± 6.7 or 94.8 ± 4.5 nmol/mg protein detected, respectively, in 0.2 or 0 mM glutamine (P < 0.05, control vs. 0.2 mM; P < 0.01, control vs. 0 mM). When GSH was added to the culture medium, intracellular GSH levels increased significantly. Similarly, GSH levels were higher in control cultures of SMS-KANR and SMS-LHN cell lines compared to those with reduced glutamine concentrations. In SMS-KANR, an intracellular GSH level in 2 mM of 144.2 ± 8.7 was obtained; this was significantly higher than the levels of 126.2 ± 1.0 or 110.9 ± 5.8 nmol/mg protein found, respectively, in those cultured with 0.2 or 0 mM glutamine. The reductions were statistically significant (P < 0.05, 2 vs. 0.2 mM; P < 0.01, 2 vs. 0 mM). In SMS-LHN, we observed 112.2 ± 1.1, 92.5 ± 0.8, or 85.5 ± 3.5 nmol/mg protein, respectively, in those cultured with 2, 0.2 or 0 mM of glutamine (P < 0.01 for both) (Fig. 4).
Fig. 4.

Effects of extracellular glutamine on intracellular GSH levels in SMS-KCNR, SMS-KANR and SMS-LHN cell lines. In all three cell lines, intracellular GSH levels were dependent on glutamine concentrations of the culture media. In SMS-KCNR, 1 mM GSH was added to the culture media and were incubated under hypoxia (5% O2) or normoxia (20% O2). Data are mean ± SD. * P < 0.05, ** P < 0.01 compared to the control (2 mM glutamine)
To examine GSH levels after culture under conditions with lower oxidative stress, SMS-KCNR cells were cultured at hypoxia (5% O2). Intracellular GSH levels were lower at hypoxia compared to normoxia, regardless of glutamine concentration. In these conditions we observed GSH levels of 79.7 ± 2.9, 64.3 ± 2.4 or 60.7 ± 2.8 nmol/mg protein in cultures with 2, 0.2, or 0 mM of glutamine, respectively (P < 0.05, 2 vs. 0.2 mM; P < 0.01, 2 vs. 0 mM) (Fig. 4).
Cytotoxicity assay
We examined the effect of glutamine deprivation on L-PAM cytotoxicity in all three cell lines. When SMS-KCNR cells were cultured with 0.096 μg/ml L-PAM, cell viability in cells cultured with 0 mM glutamine decreased to 51.9 ± 10.2% compared to 81.2 ± 15.9% in 2 mM glutamine (P < 0.01). At 0.48 μg/ml L-PAM, viability rates of 18.7 ± 3.75 or 3.7 ± 1.5%, respectively, were found in 0.2 or 0 mM, respectively, while 48.5 ± 7.8% survived in control (2 mM) (P < 0.01 for both). Similarly, viability of SMS-KANR and SMS-LHN cells was decreased in those cultured with reduced glutamine. At 0.48 μg/ml L-PAM, viability of SMS-KANR cells decreased to 9.4 ± 3.4% in 0 mM glutamine compared to 48.8 ± 5.4% in 2 mM (P < 0.01). For SMS-LHN cells exposed to 0.48 μg/ml L-PAM, reduced viability of 63.7 ± 3.3 or 52.0 ± 6.8% were observed at 0.2 or 0 mM glutamine, respectively, compared to 83.6 ± 4.4% in the control (2 mM) (P < 0.01 for both) (Fig. 5).
Fig. 5.

Dose response of SMS-KCNR, SMS-KANR and SMS-LHN cells to L-PAM cultured with 2, 0.2 or 0 mM glutamine. Cells were cultured with 0 mM (triangle), 0.2 mM (closed circle) or 2 mM glutamine (control, open circle) prior to the assay. L-PAM (0.0192–12 μg/ml) was added to the media at concentrations relevant to clinically achievable levels. After 6-day incubation, chemosensitivity was determined by the MTT assay. Data are mean ± SD.
To determine if enhanced chemosensitivity in cells cultured with reduced glutamine is mediated by GSH, 1 mM of GSH was added to the culture media. The increase in L-PAM sensitivity seen in SMS-KCNR cells cultured with reduced glutamine was abolished by adding GSH. At 0.2 μg/ml L-PAM, addition of GSH increased survival rate from 26.4 ± 14.2 to 62.8 ± 13.9% in 0 mM, and 50.9 ± 11.7 to 91.0 ± 19.2% in 0.2 mM (Fig. 6).
Fig. 6.

Effect of GSH supplementation on L-PAM-induced cytotoxicity in SMS-KCNR cells. Cells were preincubated with 2, 0.2 or 0 mM glutamine prior to the assay. L-PAM (0.2–5 μg/ml) was added to the culture media with a 0 mM glutamine (triangle) and b 0.2 mM glutamine (diamond) either with or without GSH. Cytotoxicity was analyzed with an MTT assay after 6-day incubation. Data are mean ± SD
ROS
We measured ROS by flow cytometry using H2DCFDA to determine whether low glutamine increased ROS. SMS-KCNR cells were incubated with 2, 0.2 or 0 mM glutamine and then examined for ROS content by flow cytometry of DCF fluorescence. The increase in DCF relative to that of the control (2 mM glutamine) was 1.3-fold (P = 0.3) in 0.2 mM glutamine and 1.7-fold in 0 mM glutamine (P < 0.5) (Fig. 7).
Fig. 7.

Measurement of reactive oxygen species (ROS) in SMS-KCNR. SMS-KCNR was cultured with 2, 0.2 or 0 mM glutamine for 6 days, and the cells were stained with 2′,7′-dichlorodihydrofluorescein diacetate (H 2 DCFDA). Dichlorofluorescein (DCF) intensity after H2DCFDA staining, which reflects total level of intracellular ROS, was measured with flow cytometry. ROS measurements were performed in five replicates. Bars show the mean fluorescence intensity, and error bars indicate SD. * P < 0.05
Discussion
This study showed that in neuroblastoma cell lines, the rate of cellular proliferation and intracellular GSH level was proportional to, and intracellular ROS is inversely proportional to the concentration of glutamine in the culture medium. Additionally, we demonstrated that adding GSH could ameliorate the reduced cell growth and chemosensitivity seen under conditions of low glutamine. From these results, we conclude that the decreased cell growth and chemosensitivity caused by glutamine deprivation was mediated by GSH reduction and, thereby, oxidative stress to some degree.
This is well supported by the evidence that cell growth was apparently increased at all conditions under hypoxia, where the effect of ROS is reduced. Conversely, it indicates how oxidative status has direct and great effect on cell growth. Recent studies indicate that the dosage of the redox signal is important in the modulation of cell function (Herrlich and Bohmer 2000). While high concentrations of ROS are pathogenic, moderate levels of oxidative stress act as mediators and signal transduction molecules and arrests cell cycle, whereas very low doses of ROS stimulate cell proliferation. Jogi et al. recently reported that hypoxia alters the expression of differentiation marker genes and affects the differentiation of human neuroblastoma cells, which develop an immature phenotype when grown under hypoxic conditions (Jögi et al. 2002, 2003). They proposed that dedifferentiation of neuroblastoma cells in hypoxic tumor regions contributes to the malignancy of the tumor (Jögi et al. 2003) and the expression of hypoxia-regulated genes such as tyrosine hydroxilase (TH), the rate-limiting enzyme in catecholamine synthesis, may contribute to cellular proliferation.
In this study, we also examined the GSH level under hypoxia in relation to cell proliferation rate. Under hypoxia, intracellular GSH was lower than normoxia at all glutamine concentrations. We suspect that this is because environmental oxidative stress is limited, and necessity and production of GSH may be kept low. On the other hand, intracellular GSH level correlated with environmental glutamine concentration even at hypoxia. Although hypoxia of 5% O2, it still has oxidative stress which is influenced by glutamine concentration dependent GSH production resulting in growth suppression.
However, decrease in GSH or increase of ROS may not be the only determinant that mediates glutamine deprivation induced suppression in cellular proliferation. For instance, glutamine may directly affect gene expression. Recent studies suggest that glutamine regulates the expression of several genes and activates intracellular signaling pathways in various cell cultures (Curi et al. 2005). Cell type specific apoptosis signaling mechanisms have been suggested to be an induced response to glutamine deprivation (Fuchs and Bode 2006). To date, however, no studies have yet been carried out on neuroblastomas.
Furthermore, adding GSH in cell culture may affect other mechanisms that might explain the present results. Firstly, it was shown that in A549 cells cultured under glutamine deficient conditions, the effect of extracellular GSH was correlated with a high level of gamma-glutamyltransferase activity. This enzyme converts glutamine to glutamate and thereby increases the intracellular level of glutamate; in turn, this enhances intracellular glutamine synthesis and thereby stimulates cell proliferation (Kang et al. 1994). Secondly, adding GSH might spare constituent amino acids, particularly glutamate, and thereby stimulate cell proliferation. In a previous report on the inhibition of GSH synthesis by BSO, increased cellular glutamate levels were suggested to be responsible for the BSO growth stimulating effect (Kang 1993).
However, previous in vivo studies showed that glutamine supplementation significantly decreased tumor GSH levels. In breast cancers of rats, it was suggested that dietary glutamine supplementation decreased tumor GSH levels and suppressed cells by activation of apoptosis in tumor cells (Todorova et al. 2004). Studies on Ehrlich ascites tumors (Carretero et al. 2000) and melanomas (Benlloch et al. 2006) demonstrated that a glutamine enriched diet increases glutaminase activity, promotes accumulation of cytosolic glutamate and inhibits GSH transport into mitochondria. These changes render tumor cells more susceptible to oxidative stress, and enhance the selectivity of antitumor drugs by protecting normal tissues. Although there may be a difference between cells growing in vivo and in vitro, another possibility is that the type of cell may be of relevance, for it is known that GSH content differs among different types of tumor cell. Because neuroblastomas have been reported to produce increased amounts of oxygen intermediates during synthesis of catecholamines and to store high amounts of reduced iron (Anderson et al. 1997), their GSH levels seem to be higher than those of other cell types reported previously. To date, there have been no in vivo studies of neuroblastoma cell lines, nor has it been shown that dietary glutamine decreases intracellular GSH in neuroblastoma cell lines. At least, with regard to neuroblastomas, another in vitro study of glutamine deprivation also identified decreased intracellular GSH (Soh et al. 2005). Recently, Fuchs et al. reviewed the roles of glutamine and GSH in various cancer cells in detail (Fuchs and Bode 2006), and concluded that an adequate supply of glutamine is required for the maintenance of the GSH economy in several cell types and that glutamine deprivation ultimately elicits apoptosis, depending on cell type.
Numbers of studies have shown that the high level of intracellular GSH is associated with a drug-resistant phenotype, and that the inhibition of GSH synthesis enhances chemosensitivity in neuroblastoma or other cancer cells (Green et al. 1984; Fernandes and Cotter 1994; Anderson et al. 1997). In this study, neuroblastoma cells were more sensitive to L-PAM in the condition of lower glutamine, and such effect of glutamine was abolished by adding GSH, suggesting that the change of biology in neuroblastoma under low environmental glutamine is mediated by GSH suppression.
Here, we studied three different cell lines: the MYCN-amplified cell lines SMS-KCNR and SMS-KANR; and the nonamplified cell line, SMS-LHN. Although a previous report suggested that the MYCN-amplified cell lines were more sensitive to GSH depletion than MYCN-nonamplified neuroblastoma (Anderson et al. 1997), our results showed that all were in fact similar.
Incidentally, we have to note that 10% of FBS used in this study contains a small amount of glutamine. To put it concretely, glutamine, together with glutamic acid, contains about 0.3 mM in the FBS. In brief, culture conditions may contain 0.03 mM glutamine at most even in 0 mM glutamine.
In conclusion, we have demonstrated that glutamine deprivation decreased cell proliferation and intracellular GSH, and enhanced cell chemosensitivity in three neuroblastoma cell lines. Moreover, adding GSH to the culture media partially restored the reduced rate of cell proliferation and chemosensitivity. From these results, we suggest that the decreased cell growth, increased oxidative stress and enhanced chemosensitivity induced by glutamine deprivation are mediated by GSH reduction. Lowering systemic glutamine levels may be of therapeutic value to patients with neuroblastoma.
References
- Anderson CP, Tsai JM, Chan W, Park CK, Tian L, Lui RM, Forman HJ, Reynolds CP (1997) Buthionine sulfoximine alone and in combination with melphalan (L-PAM) is highly cytotoxic for human neuroblastoma cell lines. Eur J Cancer 33:2016–2019 [DOI] [PubMed] [Google Scholar]
- Anderson CP, Seeger RC, Matthay KK et al (1998) Pilot study of buthionine sulfoximine (BSO) and melphalan (L-PAM) in children with recurrent neuroblastoma. Proc Am Soc Clin Oncol 17:531 [Google Scholar]
- Anderson CP, Tsai JM, Meek WE, Liu RM, Tang Y, Forman HJ, Reynolds CP (1999) Depletion of glutathione by buthionine sulfoxine is cytotoxic for human neuroblastoma cell lines via apoptosis. Exp Cell Res 246:183–192 [DOI] [PubMed] [Google Scholar]
- Benlloch M, Mena S, Ferrer P, Obrador E, Aseni M, Pellicer JA, Carretero J, Ortega A, Estrela JM (2006) Bcl-2 and Mn-SOD antisense oligodeoxynucleotides and a glutamine-enriched diet facilitate elimination of highly resistant B16 melanoma cells by tumor necrosis factor- and chemotherapy. J Biol Chem 281:69–79 [DOI] [PubMed] [Google Scholar]
- Carretero J, Obrador E, Pellicer JA, Pascual A, Estrela JM (2000) Mitochondrial glutathione depletion by glutamine in growing tumor cells. Free Radical Biol Med 29:913–923 [DOI] [PubMed] [Google Scholar]
- Chang WK, Yang KD, Shaio MF (1999) Lymphocyte proliferation modulated by glutamine: involved in the endogenous redox reaction. Clin Exp Immunol 117:482–488 [DOI] [PMC free article] [PubMed] [Google Scholar]
- Curi R, Lagranha CJ, Doi SQ, Sellitti DF, Procopio J, Pithon-Curi TC (2005) Glutamine-dependent changes in gene expression and protein activity. Cell Biochem Funct 23:77–84 [DOI] [PubMed] [Google Scholar]
- Fernandes RS, Cotter TG (1994) Apoptosis or necrosis: intracellular levels of glutathione influence mode of cell death. Biochem Pharmacol 48:675–681 [DOI] [PubMed] [Google Scholar]
- Frenkel K, Gleichauf C (1991) Hydrogen peroxide formation by cells treated with a tumor promoter. Free Radic Res Commun 12–13(Pt 2):783–794 [DOI] [PubMed] [Google Scholar]
- Fuchs BC, Bode BP (2006) Stressing out over survival: glutamine as an apoptotic modulator. J Surg Res 131:26–40 [DOI] [PubMed] [Google Scholar]
- Green JA, Vistica DT, Young RC, Hamilton TC, Rogan AM, Ozols RF (1984) Potentiation of melphalan cytotoxicity in human ovarian cancer cell lines by glutathione depletion. Cancer Res 44:5427–5431 [PubMed] [Google Scholar]
- Gurney JG, Ross JA, Wall DA, Bleyer WA, Severson RK, Robison LL (1997) Infant cancer in the U.S.: histology-specific incidence and trends, 1973 to 1992. J Pediatr Hematol Oncol 19:428–443 [DOI] [PubMed] [Google Scholar]
- Herrlich P, Bohmer FD (2000) Redox regulation of signal transduction in mammalian cells. Biochem Pharmacol 59:35–41 [DOI] [PubMed] [Google Scholar]
- Jögi A, Øra I, Nilsson H, Lindeheim A, Makino Y, Poellinger L, Axelson H, Påhlman S (2002) Hypoxia alters gene expression in human neuroblastoma cell lines toward an immature and neural crest-like phenotype. Proc Natl Acad Sci USA 99:7021–7026 [DOI] [PMC free article] [PubMed] [Google Scholar]
- Jögi A, Øra I, Nilsson H, Poellinger L, Axelson H, Påhlman S (2003) Hypoxia-induced dedifferentiation in neuroblastoma cells. Cancer Lett 197:145–150 [DOI] [PubMed] [Google Scholar]
- Kang YJ (1993) Buthionine sulfoximine spares intracellular glutamate: a possible mechanism for cell growth stimulation. Cell Mol Biol Res 39:675–684 [PubMed] [Google Scholar]
- Kang YJ, Freng Y, Hatcher EL (1994) Glutathione stimulates A549 cell proliferation in glutamine-deficient culture: the effect of glutamate supplementation. J Cell Physiol 161:589–596 [DOI] [PubMed] [Google Scholar]
- Meister A (1991) Glutathione deficiency produced by inhibition of its synthesis, and its reversal; applications in research and therapy. Pharmacol Ther 51:155–194 [DOI] [PubMed] [Google Scholar]
- Neu J, Shenoy V, Chakrabarti R (1996) Glutamine nutrition and metabolism: where do we go from here? FASEB J 10:829–837 [DOI] [PubMed] [Google Scholar]
- Oehler R, Roth E (2003) Regulative capacity of glutamine. Curr Opin Clin Nutr Metab Care 6:277–282 [DOI] [PubMed] [Google Scholar]
- Roth ER, Oehler R, Manahart N, Exner R, Wessner B, Strasser E, Spittler A (2002) Regulative potential of glutamine-relation to glutathione metabolism. Nutrition 18:217–221 [DOI] [PubMed] [Google Scholar]
- Schroder CP, Godwin AK, O’Dwyer PJ, Tew KD, Forman HJ, Reynolds CP (1996) Glutathione and drug resistance. Cancer Investig 14:158–168 [DOI] [PubMed] [Google Scholar]
- Soh H, Wasa M, Wang HS, Fukuzawa M (2005) Glutamine regulates acid transport and glutathione levels in a human neuroblastoma cell line. Pediatr Surg Int 21:29–33 [DOI] [PubMed] [Google Scholar]
- Tew KD, Houghton PJ, Houghton JA (1993) Preclinical and clinical modulation of anticancer drugs. CRC, Boca Raton, pp 13–17 [Google Scholar]
- Todorova VK, Harms SA, Kaufmann Y, Luo S, Luo KO, Babb K, Klimberg VS (2004) Effect of dietary glutamine on tumor glutathione levels and apoptosis-related proteins in DMBA-induced breast cancer of rats. Breast Cancer Res Treat 88:247–256 [DOI] [PubMed] [Google Scholar]
- Vandeputte C, Guizon I, Genestie-Denis I, Vannier B, Lorenzon G (1994) A microtiter plate assay for total glutathione and glutathione disulfide contents in cultured/isolated cells: performance study of a new miniaturized protocol. Cell Biol Toxicol 10:415–421 [DOI] [PubMed] [Google Scholar]
- Wasa M, Bode BP, Abcouwer SF, Collins CL, Tanabe KK, Souba WW (1996) Glutamine as a regulator of DNA and protein biosynthesis in human solid tumor cell lines. Ann Surg 224:189–197 [DOI] [PMC free article] [PubMed] [Google Scholar]