

Abstract
Purpose: The aim of this study was to evaluate the combination effect of pemetrexed disodium (MTA; Alimta; LY 231514) and gemcitabine (GEM) administered by hepatic artery and portal vein chemoembolization (HACE and PVCE) in a colorectal cancer rat liver metastasis model.
Materials and methods: Proliferation studies on CC531-lac-Z rat colon cancer cells were performed using the MTT assay to obtain the optimal combination schedule of the two antineoplastic agents. To generate diffuse liver metastasis, 4×10⁶ tumor cells were implanted into the portal vein of male WAG/Rij rats. MTA (30 mg/kg, 60 mg/kg, and 90 mg/kg) was administered locoregionally by portal vein chemoembolization (PVCE) and compared with repeated systemic intravenous injection. GEM (50 mg/kg) was also given locoregionally by hepatic artery chemoembolization (HACE) as well as systemically. All routes of administration were examined alone as well as in combination. Efficacy of treatment in terms of liver metastases burden was determined at the end of the experiment by measuring the β-galactosidase activity of CC531-lac-Z cells with a chemoluminescence assay.
Results: Combination experiments in vitro showed a more than additive tumor cell reduction after sequential exposure to MTA preceding GEM (observed/expected ratio [O/E] =0.73). Experiments with the reverse sequence (GEM→MTA) resulted only in additive combination effects (O/E ratio =1.08). Simultaneous drug exposure showed less than additive combination effects (O/E ratios ≥1.25). In vivo, locoregional administration by HACE with GEM was significantly more effective than systemic intravenous bolus treatment (P=0.03). Portal vein chemoembolization with MTA performed immediately after tumor cell inoculation was ineffective. Repeated systemic treatment with MTA yielded a slight reduction in tumor cell load that was significant versus control at the medium and high doses (60 mg/kg, P=0.009; 90 mg/kg, P=0.046) but not versus intraportal chemoembolization. The combination treatment of systemic (60 and 90 mg/kg) or locoregional (60 mg/kg) MTA with HACE using GEM (50 mg/kg) resulted in more than 80% tumor growth inhibition; this antineoplastic combination effect was maximally additive.
Conclusion: A regimen-dependent synergistic combination effect of both drugs was found in vitro. In animals, hepatic artery chemoembolization with GEM was superior to systemic intravenous bolus treatment. Portal vein chemoembolization with MTA was ineffective. The optimal in vitro regimen of MTA (intravenous or PVCE) preceding GEM (HACE) resulted in a maximally additive tumor growth inhibition. The results indicate that MTA and GEM can successfully be combined and favor further evaluation in patients.
Keywords: CC531-lac-Z, Chemoluminescence, Pemetrexed disodium, Gemcitabine, Chemoembolization
Introduction
Liver metastasis is the main factor contributing to death in patients suffering from colorectal cancer (Ruers and Bleichrodt 2002). The life expectancy of untreated patients is reduced to approximately 9 months after diagnosis. Complete surgical excision is the only treatment with curative potential, but unfortunately, 70–90% of these patients present with unresectable liver metastasis (Adam 2003, Geoghegan and Scheele 1999, Guimbaud 2004, Rudroff et al. 1999).
Palliative treatment options include physical methods such as radiofrequency ablation, cryotherapy, and selective internal radiation therapy, but pharmacological treatment regimens are used in most cases (Liu et al. 2003). In the situation of metastatic spread beyond the liver, systemic antineoplastic chemotherapy is the appropriate choice. It is based on protocols involving 5-fluorouracil (5-FU) and folinic acid as well as new cytotoxic agents such as oxaliplatin and irinotecan (Rougier and Mitry 2003, Ruers and Bleichrodt 2002). For patients with isolated liver metastasis, special locoregional treatment options, such as hepatic artery infusion (HAI), hepatic artery chemoembolization (HACE), or portal vein embolization (PVE), can be applied (Fiorentini et al. 2000, 2001; Liu et al. 2003).
The main steps for developing this type of therapy have been set by preclinical studies. Early experiments with rats bearing Novikoff hepatoma cells in their livers have shown that HAI is superior to portal vein infusion (PVI) or systemic administration when using drugs with a high first-path effect in the liver, such as 5-FU (Bartkowski et al. 1986). Subsequent studies with 5-FU in the same model demonstrated that HACE is superior to HAI and that the combination of HACE with PVI is more effective than single or combined regional infusion therapies and even minimally better than HACE alone (Bodeker et al. 2003, Kamphorst et al. 1999). More recent experiments used the colorectal rat adenocarcinoma cell line CC531 transfected with the lac-Z gene as marker in an orthotopic rat model simulating liver metastasis of colorectal cancer patients (Wittmer et al. 1999).
It was shown that drugs, even without significant first-path effect, such as irinotecan (Saenger et al. 2004) or gemcitabine (Seelig et al. 2004), can be used to reduce the tumor load in the liver more successfully than 5-FU when coadministered with starch microspheres into the hepatic artery (HACE).
To introduce more than one pharmacodynamic effect bringing about cytostatic activity and to possibly obtain synergy, combination experiments were designed involving two modern drugs, the difluorodeoxycytidine gemcitabine (GEM) and the novel multitargeted antifolate pemetrexed disodium (MTA; Alimta; LY 231514). This drug combination had been examined preclinically in vitro and in vivo with different tumor cell lines, such as HCT-8, HT29, LoVo, WiDr, and LRWZ colon carcinoma cells, resulting in controversial schedule-dependent synergy effects (Adjei 2001, Teicher et al. 2000, Tesei et al. 2002, Tonkinson et al. 1999). Clinical studies had shown activity of this combination in a variety of solid tumors (Adjei et al. 2000; Adjei 2002, 2004). Prolonged overall survival was seen in phase II–III studies on patients with non-small cell lung cancer (Fossella 2004, Monnerat et al. 2004) but not with pancreatic cancer (Richards et al. 2004).
In this study, the combination of MTA and GEM was evaluated in CC531-lac-Z rat colorectal cancer cells in vitro and in vivo. Proliferation studies were performed in vitro to determine the optimal combination schedule of the two antineoplastic agents. Based on these results, the combination was assessed in vivo in the CC531-lac-Z orthotopic rat liver metastasis model. This was realized by administering MTA systemically by intravenous injection (IV) or locoregionally by portal vein chemoembolization (PVCE). GEM was given locoregionally by hepatic artery chemoembolization (HACE).
This study was determined to evaluate whether the combination of MTA and GEM administered by chemoembolization would result in a useful strategy to treat extensive experimental colorectal cancer liver metastasis.
Materials and methods
Reagents and chemicals
Alimta (MTA) and gemcitabine (GEM) were provided (Eli Lilly, Bad Homburg, Germany) at a quality suited for clinical use. Before each experiment, the antimetabolites were dissolved and diluted in sterile 0.9% saline at appropriate concentrations. For in vivo chemoembolization, degradable starch microspheres (DSM; Spherex, Pharmacia, Erlangen, Germany) were used; the concentration of the stock suspension was 60 mg/ml.
Cell line and culture conditions
CC531 rat colon adenocarcinoma cells transfected with the bacterial lac-Z-gene (CC531-lac-Z) were grown in RPMI 1640 medium supplemented with 10% fetal calf serum and 2 mM glutamine. For propagation, 1×10⁶ CC531-lac-Z cells were transferred into a culture flask (75 cm2) containing 20 ml fresh medium and incubated in an incubator (Heraeus Holding, Hanau, Germany) with humidified atmosphere (37C°; 5% CO2). To maintain a logarithmic growth, the cells were passaged every 4 days.
MTT assay
CC531-lac-Z cells were seeded at a density of 3×10⁴ cells/ml (100 µl medium per well) into 96 well-plates (flat bottom, Becton Dickinson, Heidelberg, Germany) and grown for a period of 24 h. Thereafter, single, sequential, or simultaneous treatment was applied (see below). At the end of drug exposure, 10 µl MTT (3-[4.5-dimethylthiazol-2-yl]-2.5-diphenyl tetrazolium bromide) solution was added to form formazan crystals in tumor cells that had survived. After an incubation period of 3 h at 37°C, the medium was discarded, and the cells were lysed by adding 100 µl per well acidified 2-propanol (0.04 N HCl). After all formazan crystals were carefully dissolved, the absorption was measured at 540 nm (reference filter of 690 nm) in an automated microtiter plate spectrophotometer (Anthos Mikrosysteme, Krefeld, Germany). The absorption of exposed cells was given in percent of untreated control cells.
Experimental design of the in vitro experiment
Single drug exposure
To find out useful concentrations for combination therapy, both drugs were first tested individually. Cells were incubated with MTA (final concentrations: 0.0027/0.0053/0.011/0.02/0.04 µM) or GEM (final concentrations: 0.0025/0.005/0.01/0.02/0.04 µM) for 48 h (days 1–3) by adding 100 µl medium containing the drug. After this period, the drug-containing medium was totally removed, and 200 µl of fresh medium was added for another 48 h. To determine drug efficacy following a first incubation period, the cells were incubated in drug-free medium for 48 h (days 1–3) and then exposed to MTA (final concentrations: 0.02/0.08/0.34/1.36/5.43 µM or GEM (final concentrations: 0.04/0.16/0.64/2.56/10.24 µM) on days 3–5 (48 h).
Combination treatment
For sequential drug exposure, MTA (final concentration: 0.04 µM, days 1–3, 48 h) was followed by GEM (final concentrations: 0.04/0.16/0.64/2.56/10.24 µM, days 3–5, 48 h) dissolved in 200 µl medium. For the reverse sequence, GEM (final concentration: 0.02 µM, days 1–3, 48 h) was followed by MTA (final concentrations: 0.02/0.08/0.34/1.36/5.43 µM, days 3–5, 48 h). For simultaneous exposure, the cells were first incubated in drug-free medium on days 1–3 (48 h) and thereafter exposed to MTA (final concentration: 0.02 µM) plus GEM (final concentrations: 0.04/0.16/0.64/2.56/10.24 µM) or to GEM (final concentration: 0.04 µM) plus MTA (final concentrations: 0.02/0.08/0.34/1.36/5.43 µM) on days 3–5 (48 h), respectively (Table 1).
Table 1.
Design of the in vitro experiment
| Group no.a | Administrationb | Treatment days 1–3° | Treatment days 3–5c | |||
|---|---|---|---|---|---|---|
| Drug | Concentrationd | Drug | Concentrationd | |||
| 1 | A | Sequential | MTA | 0.04 | GEM | 0.04 |
| B | 0.16 | |||||
| C | 0.64 | |||||
| D | 2.56 | |||||
| E | 10.24 | |||||
| 2 | A | Sequential | GEM | 0.02 | MTA | 0.02 |
| B | 0.08 | |||||
| C | 0.34 | |||||
| D | 1.36 | |||||
| E | 5.43 | |||||
| 3 | A | Simultaneous | – | – | MTA/GEM | 0.02/0.04 |
| B | 0.02/0.16 | |||||
| C | 0.02/0.64 | |||||
| D | 0.02/2.56 | |||||
| E | 0.02/10.24 | |||||
| 4 | A | Simultaneous | – | – | GEM/MTA | 0.04/0.02 |
| B | 0.04/0.08 | |||||
| C | 0.04/0.34 | |||||
| D | 0.04/1.36 | |||||
| E | 0.04/5.43 | |||||
a)Groups a–e were treated alike initially (days 1–3) and thereafter by different drug concentrations (days 3–5)
b)3×10³ CC531 lacZ cells were grown for 24 h in 96-well plates and then exposed to treatment
c)the first treatment period was terminated by changing the medium and adding fresh medium containing the second treatment
d)µM
Animals
Male WAG/Rij rats were used for all in vivo experiments. They were obtained at an age of 6–7 weeks and a body weight of 120–160 g from Charles River, Sulzfeld, Germany. They were kept under specific pathogen-free (SPF) conditions in a ventilated rack with Macrolon-III cages (Ventirack, UNO Roestvaststaal, Zevenaar, The Netherlands), providing a 50-fold exchange of filtered air per hour as well as positive air pressure inside the cages. Constant room temperature (22±1°C), air humidity (50±10%), and dark-light rhythm (12 h) were maintained throughout. The animals had free access to autoclaved water and a standard laboratory diet. An acclimatization period of 7 days was adhered to before starting any experiments.
Tumor cell transplantation
CC531-lac-Z cells were trypsinized in the logarithmic growth period and suspended (4×10⁶ cells) in 0.15 ml phosphate-buffered saline (PBS) without calcium and magnesium ions, and 0.25 ml matrigel (Biomatrix EHS solution, Serva, Heidelberg, Germany). This suspension was stored on ice until injection. For tumor cell transplantation, the rats were anesthetized with isoflurane at 1.5 vol% together with 0.5 l/min oxygen and 1 l/min nitrous oxide. After a median laparotomy, the cecum was exteriorized onto a compress moistened with sterile physiologic saline, and a mesocolic vein was isolated from the mesenteric fat. Under microscopic control, the tumor cell suspension was injected into this vessel with a 28-gauge needle. Thereafter, the vessel was compressed with two cotton swabs for 1–2 min to prevent bleeding; the cecum was removed into the abdomen; the musculature was repaired with a running suture (4–0 Vicryl, Ethicon, Norderstedt, Germany); and the skin was closed with metal clips.
Intravenous (IV) injection
For systemic chemotherapy, drugs were diluted in sterile physiologic saline at appropriate concentration and injected into a tail vein. As indicated in Table 2, MTA was injected IV on days 1–5 to achieve a therapeutic concentration for an extended period of time. Based on preceding experiments, this dose was about as effective as a single dose of MTA administered by portal vein chemoembolization.
Table 2.
Design and mortality of the in vivo experiment
| Group no.a | No. of animalsb | MTA (treatment 1) | GEM (treatment 2) | Mortality (N [%])d | ||||||
|---|---|---|---|---|---|---|---|---|---|---|
| Dosage (mg/kg) | Administration route | Treatment periodc | Dosage (mg/kg) | Administration route | Treatment periodc | Tox | Tu | Op | ||
| 1A | 14 | – | – | – | – | – | – | 0 | 1 (7) | 1 (7) |
| 1 B | 14 | – | – | – | – | – | – | 0 | 1 (7) | 0 8 |
| 2 | 17 | – | – | – | 50 | HACEe | 8 | 0 | 0 | 4 (24) |
| 3 | 13 | – | – | – | IVf | 0 | 0 | 2 (15) | ||
| 4 | 13 | 30 | i.v.c) | 1–5 | – | – | – | 0 | 3 (23) | 0 |
| 5 | 10 | 60 | 0 | 0 | 0 | |||||
| 6 | 14 | 90 | 0 | 0 | 0 | |||||
| 7 | 14 | 30 | 50 | HACEf) | 8 | 0 | 0 | 2 (14) | ||
| 8 | 14 | 60 | 1 (7) | 0 | 2 (14) | |||||
| 9 | 12 | 90 | 1 (8) | 0 | 0 | |||||
| 10 | 13 | 30 | PVCEd) | 1 | – | – | – | 0 | 0 | 1 (8) |
| 11 | 11 | 60 | 0 | 0 | 0 | |||||
| 12 | 13 | 90 | 0 | 0 | 0 | |||||
| 13 | 14 | 30 | 50 | HACEf) | 8 | 0 | 0 | 4 (29) | ||
| 14 | 13 | 60 | 2 (15) | 0 | 0 | |||||
| 15 | 11 | 90 | 0 | 0 | 1 (9) | |||||
| Total 210 | 4 (2) | 5 (2) | 17 (8) | |||||||
| 26 (12) | ||||||||||
aThe two subgroups of the control groups reflect two subsequent experimental periods: Period A comprises groups 4–6 and 10–12; period B comprises groups 2, 3, 7–9, and 13–15
b4×106 CC531-lac-Z cells were implanted intraportally to male WAG-Rij rats (day 1)
cTreatment period (days) of drug administration after tumor cell implantation (day 1)
dAnimals that died within the experimental period (days 1–22) because of drug toxicity (Tox), tumor growth (Tu), or operation (Op)
eHepatic artery chemoembolization: Combined administration of starch microspheres (30 mg/kg) and the respective drug dosage
fIntravenous injection
gPortal vein chemoembolization: Combined administration of starch microspheres (30 mg/kg) and the respective drug dosage
Portal vein chemoembolization
Fifteen minutes after tumor cell implantation, portal vein chemoembolization (PVCE) with MTA was administered into the same mesocolic vein. The time interval was instrumental for controlling puncture site bleeding and facilitating a subsequent injection. The exteriorized large bowel was covered with a moistened compress to prevent exsiccation. For chemoembolization, the chemotherapeutic agent was coadministered with DSM over 1–2 min at a standardized volume (0.7 ml/200 g body weight) using a 28-gauge needle. After chemoembolization, the puncture site was compressed and the abdominal cavity closed as described above.
Hepatic arterial chemoembolization
For hepatic arterial chemoembolization (HACE), anesthetized rats underwent a relaparotomy on day 8 of the experiment. To get access to the liver hilum, the small bowel was exteriorized and covered with a wet compress. Next, two duodenal ligatures were placed proximal and distal to the common bile duct in order to bring in a caudal traction. The gastroduodenal artery was ligated with a silk (6–0) stitch proximal to its bifurcation into the right gastroepiploic and pancreaticoduodenal arteries. Thereafter, the common and proper hepatic arteries were encircled with a smooth Vicryl (3–0) stitch, and then the blood flow was stopped by two metal clips placed onto the arteries, thus facilitating an arteriotomy of the gastroduodenal artery. The tip of a PVC catheter (15 cm long, outer diameter 0.61 mm) was inserted for about 1 cm and fixed with a silk (6–0) ligature (Fig. 1). The chemoembolization suspension consisting of GEM and DSM was then administered at a standardized volume (0.7 ml/200 g body weight). The catheter was then removed, the artery was ligated proximal to the arteriotomy, and the abdomen was closed as described above.
Fig. 1.
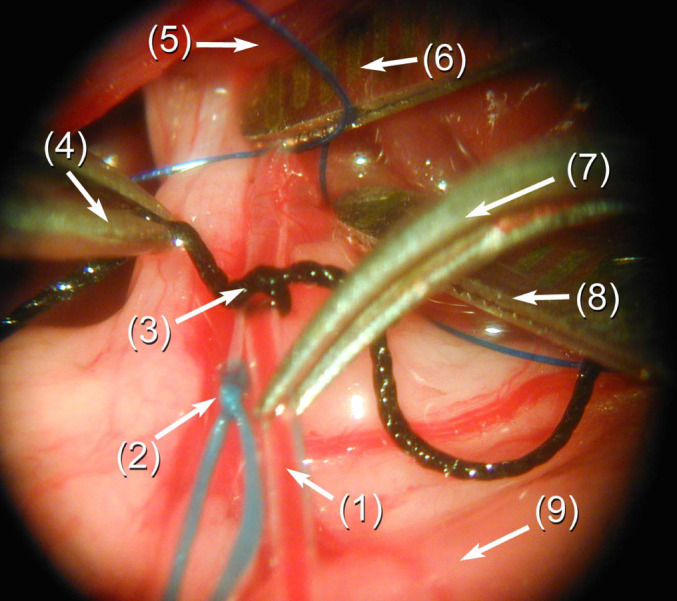
Operation site: the liver hilus has been prepared for inserting the PVC catheter into the gastroduodenal artery. Before injection of the chemoembolization treatment, the metal clip on the proper hepatic artery will be removed. (1) PVC catheter—tip in the gastroduodenal artery, (2) ligature of the gastroduodenal artery, (3) fixation of the catheter by a silk stitch, (4) straight microforceps, (5) liver, (6) metal clip on the proper hepatic artery, (7) curved microforceps, (8) metal clip on the common hepatic artery, (9) duodenum
Follow-up and liver section
The conditions and body weights of the animals were controlled until the termination of the in vivo experiment on day 28. On that day, the animals were killed by an overdose of anesthesia, the liver veins were rinsed with 0.9% NaCl, and the livers were excised. After the weights were recorded, the wet livers were deep-frozen at −80°C until further examination.
Quantification of tumor cells per liver
For quantification of tumor cells, the livers were mashed with a Turrax (Janke & Kunkel, Staufen, Germany) in the presence of lysis buffer (G2, Qiagen, Hilden, Germany; 2 ml/g liver tissue). After further homogenization and dilution (1:10) with lysis buffer, the homogenate was centrifuged at 15,000 rpm for 2 min. Thereafter, 2 µl of the supernatant was diluted in 200 µl Galacton-Plus assay buffer (Galacto-Light-Plus β-Galactosidase Reporter gene assay kit, Tropix, Weiterstadt, Germany) and incubated for 60 min at room temperature (25°C). After adding 300 µl of accelerator II, luminescence was measured for 30 min in a luminometer (Auto Lumat LB 953, EG&G Berthold, Wildbad, Germany). To obtain a standard curve, several concentrations of tumor cells (6.25E+05, 2.50E+06, 1.00E+07, 4.00E+07, 1.60E+08) were added to 1 g of healthy liver tissue, and the resulting luminescence signal was measured (Fig. 2).
Fig. 2.

Defined concentrations of tumor cells suspended in 1 g healthy rat liver were measured with the β-galactosidase assay kit to generate a standard curve of chemoluminescence. The data were fitted to obtain a linear trend according to the equation Y=133.66X+5×10⁶ (R2=0.99).
Experimental design of the in vivo experiment
As suggested by the in vitro experiment, the sequential regimen with MTA followed by GEM was tested as a combination approach. For comparison, monotherapy with MTA (PVCE and IV) and GEM (HACE and IV) was performed (Table 2). To adjust for variations in tumor growth, the experiment was split into two parts with one control group each.
Statistical analysis
Results are described as mean with standard error of the mean. Drug efficacy was expressed as percent of treated versus control animals (T/C×100). Predicted theoretical values for combination therapy were calculated by using the equation c=a×b/100, where a and b are the effects of the two monotherapies. Figures were made using Microsoft Excel. The multiple nonparametric Kruskal-Wallis test (ADAM, DKFZ Heidelberg) was used to compare tumor cell numbers and liver weights of treated animals with controls; P-values <0.05 were considered significant.
Results
MTT assay
Experiments with single drugs showed that early exposure of CC531-lac-Z cells to MTA or GEM for 48 h starting at 24 h after plating (days 1–3), resulted in IC50 values of 0.046 µM and 0.026 µM, respectively (Fig. 3a). Concentrations that decreased the cell growth by about 40% (MTA: 0.04 µM; GEM: 0.02 µM) were selected for subsequent combination experiments.
Fig. 3.

Single-drug exposure of CC531-lac-Z cells to Alimta (MTA) and gemcitabine (GEM) was tested on days 1–3 (top) and 3–5 (bottom) to determine the optimum range of concentrations for combination schedules. All concentrations were evaluated in 12 wells of a 96-well plate using the MTT assay. Results are shown as mean absorption in percent of untreated control cells with respective standard deviation (vertical bars).
Treatment with MTA and GEM on days 3–5 resulted in a less pronounced growth inhibition as shown by a tumor cell growth delay of 17% and 55%, respectively, following the highest concentrations used (Fig. 3b).
Sequential combination of MTA (days 1–3) and GEM (days 3–5) resulted in T/C values ranging from 11% to 26%, corresponding to a mean ratio of observed versus expected (O/E) cell growth of 0.73±0.04 (Fig. 4a, Table 3). The reverse sequence of GEM (days 1–3) followed by MTA (days 3–5) showed reduced overall activity as shown by T/C values ranging from 36% to 45%, corresponding to a mean O/E ratio of 1.08±0.13 (Fig. 4b, Table 3).
Fig. 4.

Results of sequential (a, b) and simultaneous (c, d) combination therapy with MTA and GEM using different schedules. Columns illustrate the absorption in percent control; besides single drug effects, the expected (white columns) and observed (dotted columns) combination effects are given. Bars symbolize standard deviation.
Table 3.
Type of combination effect observed in vitro
| Group no.a | Treatmentb | O/E ratiosc | Mean O/E ratio ± SDd | Type of interactione | |
|---|---|---|---|---|---|
| 1 | A | MTA 0.04→GEM 0.04 | 0.75 | 0.73±0.04 | More than additive |
| B | MTA 0.04→GEM 0.16 | 0.66 | |||
| C | MTA 0.04→GEM 0.64 | 0.73 | |||
| D | MTA 0.04→GEM 2.56 | 0.73 | |||
| E | MTA 0.04→GEM 10.24 | 0.77 | |||
| 2 | A | GEM 0.02→MTA 0.02 | 1.15 | 1.08±0.13 | Additive |
| B | GEM 0.02→MTA 0.08 | 1.27 | |||
| C | GEM 0.02→MTA 0.34 | 1.04 | |||
| D | GEM 0.02→MTA 1.36 | 0.94 | |||
| E | GEM 0.02→MTA 5.43 | 1.01 | |||
| 3 | A | MTA 0.02 + GEM 0.04 | 1.29 | 1.29±0.03 | Less than additive |
| B | MTA 0.02 + GEM 0.16 | 1.28 | |||
| C | MTA0.02 + GEM 0.64 | 1.26 | |||
| D | MTA 0.02 + GEM 2.56 | 1.33 | |||
| E | MTA 0.02 + GEM 10.24 | 1.31 | |||
| 4 | A | GEM 0.04 + MTA 0.02 | 1.29 | 1.25±0.05 | Less than additive |
| B | GEM 0.04 + MTA 0.08 | 1.32 | |||
| C | GEM 0.04 + MTA 0.34 | 1.23 | |||
| D | GEM 0.04 + MTA 1.36 | 1.18 | |||
| E | GEM 0.04 + MTA 5.43 | 1.24 | |||
aGroup numbers correspond to Table 1
bDetails of treatment are given in Table 1
cO/E = ratio of observed versus expected treatment effect
dMean O/E ratio with standard deviation
eAn O/E ratio equal to unity (±0.14) was considered an additive combination effect, an O/E ratio <0.86 was considered a more than additive combination effect, and an O/E ratio >1.14 was considered a less than additive combination effect
Simultaneous exposure to MTA (fixed concentration) plus GEM (variable concentration) or to GEM (fixed concentration) plus MTA (variable concentration) on days 3–5, respectively, lead to T/C values ranging from 61–84% and 88–96% with corresponding mean O/E ratios of 1.29±0.03 and 1.25±0.05, respectively (Fig. 4c, d; Table 3).
Based on the classification of additive combination effects, which are characterized by an O/E ratio of 1 (±0.14), the sequential combination of MTA followed by GEM resulted in a more than additive effect, whereas the reverse sequence showed only additive activity. Remarkably, the simultaneous exposure to both drugs showed less than additive activity. Based on these results, the sequential regimen MTA followed by GEM was used for the subsequent in vivo experiments.
In vivo experiments
Untreated animals showed mean tumor cell numbers of 4.1×10⁹ and 2.1×10⁹ per liver (control groups 1A and 1B, Table 4). Monotherapy with GEM administered by HACE (group 2) produced a significant mean tumor load reduction of 74% compared with the corresponding untreated control group 1B (T/C%=26; P=0.001, Fig. 5). In comparison, intravenous administration of GEM (group 3) reduced the tumor growth nonsignificantly by 42% (T/C%=58, P=0.09).
Table 4.
Influence of treatment with MTA and GEM on tumor cell load and liver weight
| Group no. | Treatment | Mean tumor cell number per livera ± SEb | O/E ratioc | Mean liver weight (g)d ± SEb | Increase in tumor cell numbere | aT1/2f | TCDg |
|---|---|---|---|---|---|---|---|
| 1A | Untreated | 4.1E+09±4.6E+08 | – | 34.2±2.7 | 1025 | 50.4 | 10.0 |
| 1B | Untreated | 2.1E+09±3.3E+08 | – | 28.4±2.7 | 525 | 55.8 | 9.0 |
| 2 | GEM 50 HACE | 5.5E+08±2.3E+08 | – | 11.1±1.0 | 136 | 71.1 | 7.1 |
| 3 | GEM 50 IV | 1.2E+09±3.3E08 | – | 15.9±2.0 | 306 | 61.0 | 8.3 |
| 4 | MTA 30 IV | 2.8E+09±7.5E+08 | – | 22.9±3.6 | 706 | 53.3 | 9.5 |
| 5 | MTA 60 IV | 2.5E+09±4.3E+08 | – | 17.1±2.8 | 614 | 54.4 | 9.3 |
| 6 | MTA 90 IV | 2.8E+09±3.7E+08 | – | 21.1±2.1 | 690 | 53.4 | 9.4 |
| 7 | MTA 30 (IV) + GEM 50 HACE | 8.3E+08±1.3E+08 | 2.19 | 12.7±0.8 | 206 | 65.6 | 7.7 |
| 8 | MTA 60 (IV) + GEM 50 (HACE) | 3.3E+08±1.6E+08 | 1.02 | 8.3±0.6 | 83 | 79.0 | 6.4 |
| 9 | MTA 90 (IV) + GEM 50 (HACE) | 4.2E+08±1.7E+08 | 1.14 | 9.6±1.0 | 105 | 75.1 | 6.7 |
| 10 | MTA 30 (PVCE) | 3.3E+09±6.6E+08 | – | 25.9±3.3 | 819 | 52.1 | 9.7 |
| 11 | MTA 60 (PVCE) | 3.6E+09±6.6E+08 | – | 29.1±4.0 | 907 | 51.3 | 9.8 |
| 12 | MTA 90 (PVCE) | 3.7E+09±5.7E+08 | – | 30.8±3.4 | 918 | 51.2 | 9.8 |
| 13 | MTA 30 (PVCE) + GEM 50 (HACE) | 1.4E+09±2.5E+08 | 2.38 | 15.7±2.0 | 260 | 62.8 | 8.0 |
| 14 | MTA 60 (PVCE) + GEM 50 (HACE) | 3.1E+08±2.0E+08 | 0.64 | 8.4±1.0 | 77 | 80.4 | 6.3 |
| 15 | MTA 90 (PVCE) + GEM 50 (HACE) | 1.2E+09±3.6E+08 | 2.45 | 14.6±2.1 | 300 | 61.3 | 8.2 |
aDetermined by ß-galactosidase assay
bStandard error of the mean
cO/E = ratio of observed versus expected treatment effect
dWet liver weight
eRatio of final and initial tumor cell numbers
fApparent tumor cell doubling time (h)
gNumber of tumor cell doublings
Fig. 5.

Summary of treatment effects; columns denote the respective therapeutic efficacy as quotient of treated and control values (T/C%) for (a) tumor cell number determined by β-galactosidase assay and (b) wet liver weight. White columns indicate the expected combination effect. Bars symbolize standard error of the mean.
MTA alone administered intravenously (groups 4–6) resulted in moderate tumor cell reductions as illustrated by T/C% values of 69 (nonsignificant), 60 (P=0.009), and 68 (P=0.05) following 30, 60, and 90 mg/kg, respectively. Single intraportal chemoembolization with the same MTA dosages (groups 10–12) appeared to be ineffective (80, 89, and 90 T/C%).
The combination of the low dose of MTA plus GEM administered by HACE induced a significant anticancer effect following both IV (group 7, T/C%=39, P=0.0005) and intraportal (group 13, T/C%=49, P=0.04) administration of MTA. The corresponding O/E ratios of 2.2 and 2.4 indicate less than additive combination effects (Table 4). A concentration-dependent increase in efficacy was seen when combining the medium dose of MTA intravenously (group 8, T/C%=16, P<0.0001) and intraportally (group 14, T/C%=15, P=0.0002) with GEM administered by HACE. For these groups, the corresponding O/E ratios of 1.02 and 0.64 point to additive combination effects.
Unexpectedly, the highest doses of intraportal MTA plus HACE-administered GEM showed the lowest effect of all combination groups, with a T/C% value of 57 (group 15, P=0.09) and an O/E ratio of 2.45, indicating less than additive combination effects. In partial contrast, the highest dose of IV MTA plus HACE-administered GEM showed a tumor cell decline similar to the respective medium MTA dosage used in this combination (T/C%=20; group 9, P=0.0001). The corresponding O/E value of 1.14 denotes an additive combination effect.
When tumor cell number was compared with liver weight as a parameter of therapeutic efficacy, the former was somewhat more sensitive than the latter, as shown for three groups receiving GEM by HACE (groups 2, 8, and 14), for which a more favorable treatment effect was seen on the basis of tumor cell number than on liver weight. For all other groups, a reasonably high correlation (R2=0.93) was obtained between the two parameters.
Discussion
In vitro exposure of CC531-lac-Z rat colon carcinoma cells to MTA and GEM showed a more than additive cell growth delay when pretreatment with MTA was followed by GEM. This series was chosen for the subsequent in vivo experiments, as the opposite sequence (GEM→MTA) produced an additive effect only and because concurrent drug exposure resulted in even less than additive activity.
The synergy seen after using MTA followed by GEM is in agreement with results from a clonogenic assay in HT-29 colon carcinoma cells (Tonkinson et al. 1999). Conflicting results were obtained with HCT-8 colon carcinoma cells (Adjei 2001). Here, cytotoxic synergy was achieved when MTA followed the treatment with GEM; simultaneous exposure yielded only additive cytotoxic effects, whereas the reverse sequence even showed antagonism. In line with this, exposure of other colon cancer cell lines (LoVo, WiDr, LRWZ) to GEM and thereafter to MTA produced a synergistic effect as well (Tesei et al. 2002).
These contradictory results for the experimental combination of MTA and GEM allow a conclusion that combination effects in vitro are mainly dependent on the cell line used. Based on our in vitro results, the sequential combination of MTA preceding GEM was chosen to be evaluated in the CC531-lac-Z rat colon carcinoma in vivo model.
Several animal models have been developed to imitate liver metastases by using CC531 colorectal cancer cells and to evaluate the efficacy of anticancer therapy (Gutt et al. 2000; Hagenaars et al. 2000a, 2000b; Mook et al. 2003; Thomas et al. 1993). In this study, a CC531 variant transfected with β-galactosidase was used, simulating liver metastasis of colorectal cancer patients by intraportal inoculation of CC531-lac-Z cells to male WAG/Rij rats (Wittmer et al. 1999). This model allows postmortem quantification of disseminated tumor cells in rat liver by measuring the β-galactosidase activity with a sensitive chemoluminescence assay.
The sequential administration of MTA and GEM was realized by taking into account the following considerations: After intraportal injection, tumor cells are supposed to stop in the sinusoids of the liver because of size restriction. There they are able to form tumors during the first 4 days (Mook et al. 2003). Because in this early stage portal vein chemotherapy can significantly reduce the development of liver metastases in animal experiments (Archer and Gray 1990) as well as in clinical studies (Ragnhammar et al. 2001), portal vein chemoembolization with MTA was administered in this study within a short period of time after tumor inoculation. Systemic treatment with MTA, starting at the same time and being maintained for a period of 5 days, was given for comparison. In this setting, repeated systemic monotherapy with MTA was slightly but not significantly more effective in reducing tumor cell number than was single portal vein chemoembolization.
At later stages, when tumor cells have invaded the liver and lesions have grown to a size of 0.5–1 mm, they are mainly vascularized by the hepatic artery (Ackerman 1974, Archer and Gray 1989, Blanchard et al. 1965, Breedis and Young 1954). Accordingly, GEM was coadministered with starch microspheres through the hepatic artery 7 days after tumor inoculation, when metastases first became visible on the liver surface. This locoregional chemoembolization was highly effective compared with the same dose given systemically as a single bolus (P=0.03).
Hepatic artery chemoembolization was based on starch microspheres as temporary embolizate for the entire liver. These particles have a size of 40±5 µm and achieve a transient occlusion at the arteriolar level for about 15–30 min until they are degraded by serum amylases (Civalleri et al. 1991). This application method increases the regional uptake of a coadministered drug and reduces the systemic drug concentration (Ball 1991, Starkhammar and Hakansson 1987). Recently it was demonstrated preclinically that HACE enables the locoregional use of drugs without significant first-path effect in the liver (Saenger et al. 2004, Seelig et al. 2004). To date, few clinical studies have shown a benefit in survival following HACE for certain lesions, such as hepatocellular carcinoma (Llovet et al. 2002) or liver metastases of colorectal cancer (Lang and Brown, Jr. 1993, Sanz-Altamira et al. 1997, Tellez et al. 1998). Exploitation of the new experimentally-gained knowledge might well improve this situation.
The aim of combining initial intraportal with subsequent intraarterial chemoembolization (MTA→GEM) was not only to surpass the effect of HACE with GEM but also to transfer the synergistic combination effect observed in vitro to the in vivo situation. Both aims, however, were not realized unequivocally, because only the medium dose of MTA resulted in a slightly but not significantly improved combination effect compared with HACE with GEM alone. This result is in agreement with that obtained in another model in which the effect of hepatic arterial chemoembolization was hardly improved by combination with intraportal infusion (Bodeker et al. 2003).
Nevertheless, the antineoplastic effect of this dual chemoembolization was equal to that of using a five-times-repeated systemic bolus of MTA in conjunction with HACE based on GEM.
Other groups have been more successful in demonstrating a synergistic combination effect when using MTA and GEM. Tonkinson et al. obtained greater than additive growth delay of HT-29 colon carcinoma cells growing subcutaneously in nude mice when MTA was administered followed by GEM (Tonkinson et al. 1999). Simultaneous combination treatment with MTA and GEM to nude mice bearing human H460 non-small cell lung carcinoma xenografts resulted in more than additive tumor growth delay (Teicher et al. 2000).
These results indicate that synergy between MTA and GEM in vivo may be dependent on the tumor type and model system used.
In summary, locoregional administration by hepatic artery chemoembolization with GEM was superior to systemic IV bolus treatment. Portal vein chemoembolization with MTA was ineffective. Repeated systemic treatment with MTA reduced the tumor cell load slightly, significant only versus control at the medium and high doses (60 mg/kg, P=0.009; 90 mg/kg, P=0.046), but not versus intraportal chemoembolization. The combination treatment of systemic (60 and 90 mg/kg) or locoregional (60 mg/kg) MTA with HACE using GEM (50 mg/kg) resulted in a maximally additive tumor growth inhibition of more than 80%.
These results suggest that MTA and GEM can be combined in vivo in a beneficial way.
References
- 1.Ackerman NB (1974) The blood supply of experimental liver metastases. IV. Changes in vascularity with increasing tumor growth. Surgery. 75:589–596 [PubMed] [Google Scholar]
- 2.Adam R (2003) Chemotherapy and surgery: new perspectives on the treatment of unresectable liver metastases. Ann Oncol 14(suppl 2):II13–II16 [DOI] [PubMed] [Google Scholar]
- 3.Adjei AA (2001) Gemcitabine and pemetrexed disodium combinations in vitro and in vivo. Lung Cancer 34(suppl 4):S103–S105 [DOI] [PubMed] [Google Scholar]
- 4.Adjei AA (2002) Pemetrexed in the treatment of selected solid tumors. Semin Oncol 29:50–53 [DOI] [PubMed] [Google Scholar]
- 5.Adjei AA (2004) Pemetrexed (ALIMTA), a novel multitargeted antineoplastic agent. Clin Cancer Res 10:4276s–4280s [DOI] [PubMed] [Google Scholar]
- 6.Adjei AA, Erlichman C, Sloan JA, et al. (2000) Phase I and pharmacologic study of sequences of gemcitabine and the multitargeted antifolate agent in patients with advanced solid tumors. J Clin Oncol 18:1748–1757 [DOI] [PubMed] [Google Scholar]
- 7.Archer SG, Gray BN (1989) Vascularization of small liver metastases. Br J Surg 76:545–548 [DOI] [PubMed] [Google Scholar]
- 8.Archer SG, Gray BN (1990) Comparison of portal vein chemotherapy with hepatic artery chemotherapy in the treatment of liver micrometastases. Am J Surg 159:325–329 [DOI] [PubMed] [Google Scholar]
- 9.Ball AB (1991) Regional chemotherapy for colorectal hepatic metastases using degradable starch microspheres. A review. Acta Oncol 30:309–313 [DOI] [PubMed] [Google Scholar]
- 10.Bartkowski R, Berger MR, Aguiar JL, et al. (1986) Experiments on the efficacy and toxicity of locoregional chemotherapy of liver tumors with 5-fluoro-2’-deoxyuridine (FUDR) and 5-fluorouracil (5-FU) in an animal model. J Cancer Res Clin Oncol 111:42–46 [DOI] [PMC free article] [PubMed] [Google Scholar]
- 11.Blanchard RJ, Grotenhuis I, Lafave JW, Perry JF, Jr. (1965) Blood supply to hepatic V2 carcinoma implants as measured by radioactive microspheres. Proc Soc Exp Biol Med 118:465–468 [DOI] [PubMed] [Google Scholar]
- 12.Bodeker H, Kamphorst EJ, Wunsch PH, et al. (2003) Superiority of combined chemoembolization and portal infusion with 5-fluorouracil over locoregional infusion concepts in Novikoff hepatoma-bearing rats. J Cancer Res Clin Oncol 129:655–661 [DOI] [PMC free article] [PubMed] [Google Scholar]
- 13.Breedis C, Young G (1954) The blood supply of neoplasms in the liver. Am J Pathol 30:969–977 [PMC free article] [PubMed] [Google Scholar]
- 14.Civalleri D, Esposito M, Fulco RA, et al. (1991) Liver and tumor uptake and plasma pharmacokinetic of arterial cisplatin administered with and without starch microspheres in patients with liver metastases. Cancer 68:988–994 [DOI] [PubMed] [Google Scholar]
- 16.Fiorentini G, Poddie DB, Cantore M, et al. (2001) Locoregional therapy for liver metastases from colorectal cancer: the possibilities of intraarterial chemotherapy, and new hepatic-directed modalities. Hepatogastroenterology 48:305–312 [PubMed] [Google Scholar]
- 17.Fiorentini G, Poddie DB, De Giorg Ui, et al. (2000) Global approach to hepatic metastases from colorectal cancer: indication and outcome of intra-arterial chemotherapy and other hepatic-directed treatments. Med Oncol 17:163–173 [DOI] [PubMed] [Google Scholar]
- 18.Fossella FV (2004) Pemetrexed for treatment of advanced non-small cell lung cancer. Semin Oncol 31:100–105 [DOI] [PubMed] [Google Scholar]
- 19.Geoghegan JG, Scheele J (1999) Treatment of colorectal liver metastases. Br J Surg 86:158–169 [DOI] [PubMed] [Google Scholar]
- 20.Guimbaud R (2004) Colorectal cancers: management of metastatic cancers. Rev Prat 54:167–176 [PubMed] [Google Scholar]
- 21.Gutt CN, Kim ZG, Gessmann T, et al. (2000) Hepatic tumor spread of colorectal cancer in a laparoscopic animal model. Surg Endosc 14:448–451 [DOI] [PubMed] [Google Scholar]
- 22.Hagenaars M, Ensink NG, Basse PH, et al. (2000a) The microscopic anatomy of experimental rat CC531 colon tumour metastases: consequences for immunotherapy? Clin Exp Metastasis 18:189–196 [DOI] [PubMed] [Google Scholar]
- 23.Hagenaars M, Koelemij R, Ensink NG, et al. (2000b) The development of novel mouse monoclonal antibodies against the CC531 rat colon adenocarcinoma. Clin Exp Metastasis 18:281–289 [DOI] [PubMed] [Google Scholar]
- 24.Kamphorst EJ, Bodeker H, Koroma S, et al. (1999) New technique for superselective arterial (chemo-) embolization of the rat liver. Lab Anim Sci 49:216–219 [PubMed] [Google Scholar]
- 25.Lang EK, Brown, CL, Jr. (1993) Colorectal metastases to the liver: selective chemoembolization. Radiology 189:417–422 [DOI] [PubMed] [Google Scholar]
- 26.Liu LX, Zhang WH, Jiang HC (2003) Current treatment for liver metastases from colorectal cancer. World J Gastroenterol 9:193–200 [DOI] [PMC free article] [PubMed] [Google Scholar]
- 27.Llovet JM, Real MI, Montana X, et al. (2002) Arterial embolisation or chemoembolisation versus symptomatic treatment in patients with unresectable hepatocellular carcinoma: a randomised controlled trial. Lancet 359:1734–1739 [DOI] [PubMed] [Google Scholar]
- 28.Monnerat C, Le Chevalier T, Kelly K, et al. (2004) Phase II study of pemetrexed-gemcitabine combination in patients with advanced-stage non-small cell lung cancer. Clin Cancer Res 10:5439–5446 [DOI] [PubMed] [Google Scholar]
- 29.Mook OR, Van Marle J, Vreeling-Sindelarova H, et al. (2003) Visualization of early events in tumor formation of eGFP-transfected rat colon cancer cells in liver. Hepatology 38:295–304 [DOI] [PubMed] [Google Scholar]
- 30.Ragnhammar P, Hafstrom L, Nygren P, Glimelius B (2001) A systematic overview of chemotherapy effects in colorectal cancer. Acta Oncol 40:282–308 [DOI] [PubMed] [Google Scholar]
- 15.Richards DA, Kindler HL, Oettle H, et al. (2004) A randomized phase III study comparing gemcitabine + pemetrexed versus gemcitabine in patients with locally advanced and metastatic pancreas cancer. J Clin Oncol 22:4007 [Google Scholar]
- 31.Rougier P, Mitry E (2003) Epidemiology, treatment and chemoprevention in colorectal cancer. Ann Oncol 14(suppl 2):II3–II5 [DOI] [PubMed] [Google Scholar]
- 32.Rudroff C, Altendorf-Hoffmann A, Stangl R, Scheele J (1999) Prospective randomised trial on adjuvant hepatic-artery infusion chemotherapy after R0 resection of colorectal liver metastases. Langenbecks Arch Surg 384:243–249 [DOI] [PubMed] [Google Scholar]
- 33.Ruers T, Bleichrodt RP (2002) Treatment of liver metastases, an update on the possibilities and results. Eur J Cancer 38:1023–1033 [DOI] [PubMed] [Google Scholar]
- 34.Saenger J, Leible M, Seelig MH, Berger MR (2004) Chemoembolization of rat liver metastasis with irinotecan and quantification of tumor cell reduction. J Cancer Res Clin Oncol 130:203–210 [DOI] [PMC free article] [PubMed] [Google Scholar]
- 35.Sanz-Altamira PM, Spence LD, Huberman MS, et al. (1997) Selective chemoembolization in the management of hepatic metastases in refractory colorectal carcinoma: a phase II trial. Dis Colon Rectum 40:770–775 [DOI] [PubMed] [Google Scholar]
- 36.Seelig MH, Leible M, Sanger J, Berger MR (2004) Chemoembolization of rat liver metastasis with microspheres and gemcitabine followed by evaluation of tumor cell load by chemiluminescence. Oncol Rep 11:1107–1113 [PubMed] [Google Scholar]
- 37.Starkhammar H, Hakansson L (1987) Effect of starch microspheres on the passage of labelled erythrocytes and a low molecular weight marker through the liver. Acta Oncol 26:361–365 [DOI] [PubMed] [Google Scholar]
- 38.Teicher BA, Chen V, Shih C, et al. (2000) Treatment regimens including the multitargeted antifolate LY231514 in human tumor xenografts. Clin Cancer Res 6:1016–1023 [PubMed] [Google Scholar]
- 39.Tellez C, Benson AB III, Lyster MT, et al. (1998) Phase II trial of chemoembolization for the treatment of metastatic colorectal carcinoma to the liver and review of the literature. Cancer 82:1250–1259 [DOI] [PubMed] [Google Scholar]
- 40.Tesei A, Ricotti L, De Paola F, et al. (2002) In vitro schedule-dependent interactions between the multitargeted antifolate LY231514 and gemcitabine in human colon adenocarcinoma cell lines. Clin Cancer Res 8:233–239 [PubMed] [Google Scholar]
- 41.Thomas C, Nijenhuis AM, Timens W, et al. (1993) Liver metastasis model of colon cancer in the rat: immunohistochemical characterization. Invasion Metastasis 13:102–112 [PubMed] [Google Scholar]
- 42.Tonkinson JL, Worzalla JF, Teng CH, MendelsohnLG (1999) Cell cycle modulation by a multitargeted antifolate, LY231514, increases the cytotoxicity and antitumor activity of gemcitabine in HT29 colon carcinoma. Cancer Res 59:3671–3676 [PubMed] [Google Scholar]
- 43.Wittmer A, Khazaie K, Berger MR (1999) Quantitative detection of lac-Z-transfected CC531 colon carcinoma cells in an orthotopic rat liver metastasis model. Clin Exp Metastasis 17:369–376 [DOI] [PubMed] [Google Scholar]