

SUMMARY
Chronic pain following peripheral nerve injury is accompanied by increased neuronal activity in the somatosensory cortex. However, whether and how cortical microglia contribute to these changes is less understood. To this end, we applied an optogenetic strategy to specifically target cortical microglia and investigate their function in behavioral pain sensitization. We found that optogenetic activation of microglia in the primary somatosensory cortex (S1) via red-activated channelrhodopsin (ReaChR) triggered pain hypersensitivity and affective-motivational responses in mice. Remarkably, S1-targeted optogenetic stimulation increased microglial landscape changes and ATP release. In addition, optogenetic stimulation altered the microglial proteomic profile, upregulated neuronal c-Fos expression, and enhanced neuronal Ca2+ signaling in the S1. Our results provide mechanistic evidence linking cortical microglia with neuronal hyperactivity and chronic pain behaviors.
Graphical Abstract
In brief
Yi et al. demonstrate that optogenetic activation of cortical microglia in the primary somatosensory cortex (S1) induces pain hypersensitivity and affective pain responses in mice. This process involves microglial landscape changes, ATP release, and enhanced neuronal activity, providing mechanistic insight into the role of cortical microglia in chronic pain.
INTRODUCTION
The primary somatosensory (S1) cortex plays a crucial role in the localization and discrimination of pain.1,2 Maladaptive changes in the S1 cortex, such as hyperexcitability and reorganization of neuronal connections, contribute to the development of chronic pain.3–5 Indeed, recent evidence suggests that the S1 cortex is a significant part of brain networks responsible for mediating and sustaining chronic pain. Nerve injury results in increased activation and reorganization of the S1 cortex.6–8 Advanced imaging techniques and various animal pain models have been used to investigate the functional and structural changes occurring in the S1 cortex.9,10 These studies have demonstrated that manipulation of the S1 cortex modulates neuronal activity in subsequent brain regions associated with pain signaling, including the anterior cingulate cortex (ACC) and thalamus.11,12 In conjunction, manipulating the S1 cortex has shown promising outcomes in alleviating chronic pain, highlighting the potential therapeutic implication of the S1 cortex in pain management.13,14
Despite the increasing recognition of the cerebral cortex in pain processing after nerve injury, the contribution of cortical microglia to chronic pain is less understood.15 Several studies have shown microglial activation after peripheral nerve injury in brain regions including the hippocampus, prefrontal cortex, amygdala, and nucleus accumbens,16–19 although microgliosis was not observed in the S1 cortex.20 However, recent work demonstrated that S1-targeted removal of microglial BDNF (brain-derived neurotrophic factor) alleviated mechanical allodynia after peripheral nerve injury.21 Clearly, there remain unsolved questions regarding the function of cortical microglia in chronic pain.
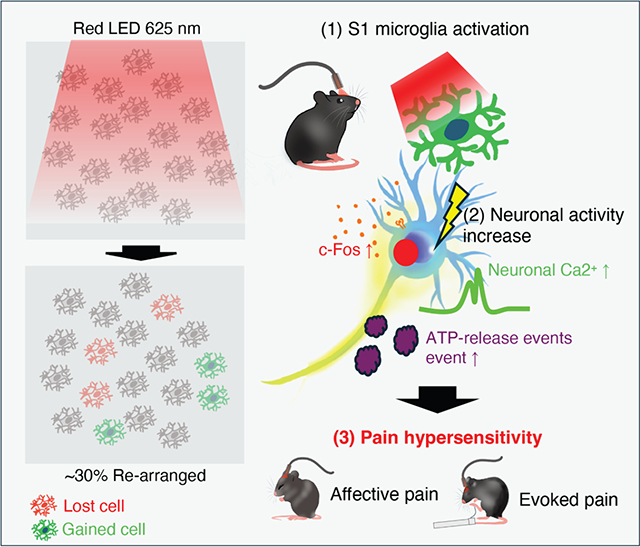
To directly address this question, we utilized CX3CR1creER/+:R26LSL-ReaChR/+ transgenic mice22 to optogenetically manipulate cortical microglia. We found that optogenetic activation of cortical microglia induced emotional/evoked pain hypersensitivity associated with increased neuronal activity and microglial landscape changes. These changes were characterized by daily physical positioning and cell translocation regulated by the microglia-specific P2Y12 receptor.23 Using a sensitive genetically encoded G protein-coupled receptor activation-based (GRAB) sensor to detect extracellular ATP in vivo,24 we found increased ATP release events in the S1 cortex following optogenetic stimulation of cortical microglia. Together, our results demonstrate that optogenetic stimulation of cortical microglia promotes neuronal activity, which likely contributes to pain hypersensitivity.
RESULTS
Optogenetic stimulation of cortical microglia reduces explorative behaviors
The contribution of cortical microglia to chronic pain remains poorly understood.16,20 To address this knowledge gap, we employed CX3CR1creER/+:R26LSL-ReaChR/+ transgenic mice (red-activated channelrhodopsin [ReaChR]) to optogenetically stimulate cortical microglia in vivo and examined their impact on pain behaviors. Our previous studies have validated the functional expression of ReaChR in spinal microglia.22 We performed whole-cell patch-clamp recordings in acute brain slices from ReaChR mice to evaluate the functionality of ReaChR in cortical microglia (Figure S1). When stimulated with red light (625 nm) via LED, microglia exhibited significant inward currents with minimal deactivation (Figures S1A and S1B). Using voltage ramp protocols combined with incrementally increasing light intensity (0%–20% from 0.2 to 121.8 mW), we observed that ReaChR currents increased in a proportional manner (Figures S1C–S1E). Additionally, current-clamp recordings from cortical microglia revealed ReaChR-dependent membrane depolarization in response to various light stimulation frequencies (persistent, 40, 20, 10, 5, 2, 1, 0.5, and 0.33 Hz) (Figure S1F). These findings demonstrate that ReaChR is functionally expressed in cortical microglia and mediates light-induced nonselective channel currents and membrane depolarization. To further support this finding, we confirmed the expression of ReaChR in Iba1+ microglia, but not in astrocytes or neurons, in the S1 cortex (Figure S2A). To target S1 cortical microglia, an optic ferrule was stereotaxically implanted above the S1 region, and an optogenetic fiber was inserted through the ferrule for light delivery (Figure 1A). Three weeks after tamoxifen treatment, mice were exposed to red light (625 nm, 45 ms light on, 5 ms light off, 20 Hz) through the optic fiber (Figure 1A).
Figure 1. Optogenetic activation of cortical microglia induces hypolocomotion and unpleasant affective pain.

(A) Timeline of experimental procedure for ReaChR induction, optogenetic stimulation, and open field test (OFT).
(B) Representative traces of locomotor activity.
(C) Averaged immobility time for control and ReaChR mice. Data presented as mean ± SEM. n = 8 mice/group, ****p < 0.0001, two-way ANOVA with multiple comparisons.
(D) Average total distance traveled for control and ReaChR mice. Data presented as mean ± SEM. n = 8 mice/group, ****p < 0.0001, two-way ANOVA with multiple comparisons.
(E) Averaged time spent in the central zone (time center) for each group.
(F) Rotarod latency to fall for each group. Data presented as mean ± SEM. n = 8 mice/group, ****p < 0.0001, two-way ANOVA with multiple comparisons.
(G) Experimental timeline of ReaChR induction and ultrasound vocalization (USV) measurement.
(H and I) Summarized data showing the number of vocalizations in control and ReaChR mice after light stimulation with recording frequencies range of 25–40 and 50 kHz. Data presented as mean ± SEM. n = 4 mice/group, ***p < 0.001, ****p < 0.0001, two-way ANOVA with multiple comparisons.
Ongoing and affective-motivational responses in various animal models often lead to reduced exploration.25,26 Here, we observed that light stimulation significantly increased immobility in ReaChR mice compared to controls in the open field test (Figures 1B, 1C, S2B, and S2C). Furthermore, optogenetic stimulation of cortical microglia significantly reduced travel distances and time spent in the central zone (Figures 1D and 1E). Importantly, light-induced immobility and reduced travel distance were not attributed to motor dysfunction, as we did not observe significant changes in motor coordination in the rotarod test (Figure 1F). Taken together, our findings indicate that optogenetic stimulation of cortical microglia triggers hypolocomotion and diminishes explorative behaviors in ReaChR mice.
Optogenetic stimulation of cortical microglia induces affective pain
Next, we measured ultrasonic vocalization (USV), which indicates ongoing pain in mice,27 after optogenetic stimulation of cortical microglia. Mice were acclimated to the recording chamber for 15 min, and baseline USV was recorded for 10 min before receiving light stimulation through the optic fiber (Figure 1G). Based on previous studies of USV in chronic pain,27–29 we chose the recording frequencies of 25–40 and 50 kHz.27 Notably, light stimulation increased USV at the 25–40 kHz recording frequencies in ReaChR mice (Figure 1H). This increase in USV persisted for 1 day after light stimulation in ReaChR mice compared to control mice. In contrast, the 50 kHz recording frequency only transiently increased during light stimulation (Figures 1H and 1I). There was no significant difference in the recording frequencies of 20–22 kHz (Figure S2D).
To verify whether the observed changes to USV were associated with pain behaviors, we administrated the nonsteroidal anti-inflammatory analgesic ibuprofen via drinking water prior to light stimulation. Indeed, the increases of 25–40 kHz USV in ReaChR mice after light stimulation were prevented by ibuprofen treatment (Figure S2E). Next, to assess light-induced ongoing pain,30,31 we recorded spontaneous facial expressions and calculated Mouse Grimace Scale (MGS) scores for both control and ReaChR mice (Figure S3). MGS scores of eye squinting and ear retraction were elevated in ReaChR mice compared to controls after light stimulation, an effect which persisted for up to 1 day post stimulation (Figures S3A–S3C). No notable changes were detected in the nose, whiskers, or cheeks (Figures S3D–S3F). Thus, these findings suggest that optogenetic stimulation of cortical microglia in ReaChR mice induced spontaneous pain, as indicated by the increase in USVs at specific frequencies and higher MGS scores in eyes and ears.
To evaluate the affective-motivational response of the pain behaviors induced by light stimulation of cortical microglia, we performed conditional place aversion (CPA) assays as previously described32 (Figures 2A and 2B). The time spent in the dark chamber at pre-conditioning day 1 (t1) and at post-conditioning day 6 (t2) was recorded, and the difference (Δt = t1 – t2) was used to quantify the degree of CPA. As a result, light induced robust CPA, with reduced time spent in the dark chamber in ReaChR mice compared to control mice (Figures 2C and 2D). We found that light stimulation resulted in an aversion in ReaChR mice, which learned to associate and avoid the “stimulation” chamber. Furthermore, light stimulation also led to an aversion to non-noxious stimuli (0.16 g von Frey filament) in ReaChR mice compared to control mice (Figures S4A–S4D). Therefore, these results indicate that optogenetic stimulation of cortical microglia is sufficient to trigger affective-motivational responses in ReaChR mice, impacting the emotional aspect of chronic pain.
Figure 2. Optogenetic activation of microglia induces emotional aversion and mechanical hypersensitivity.
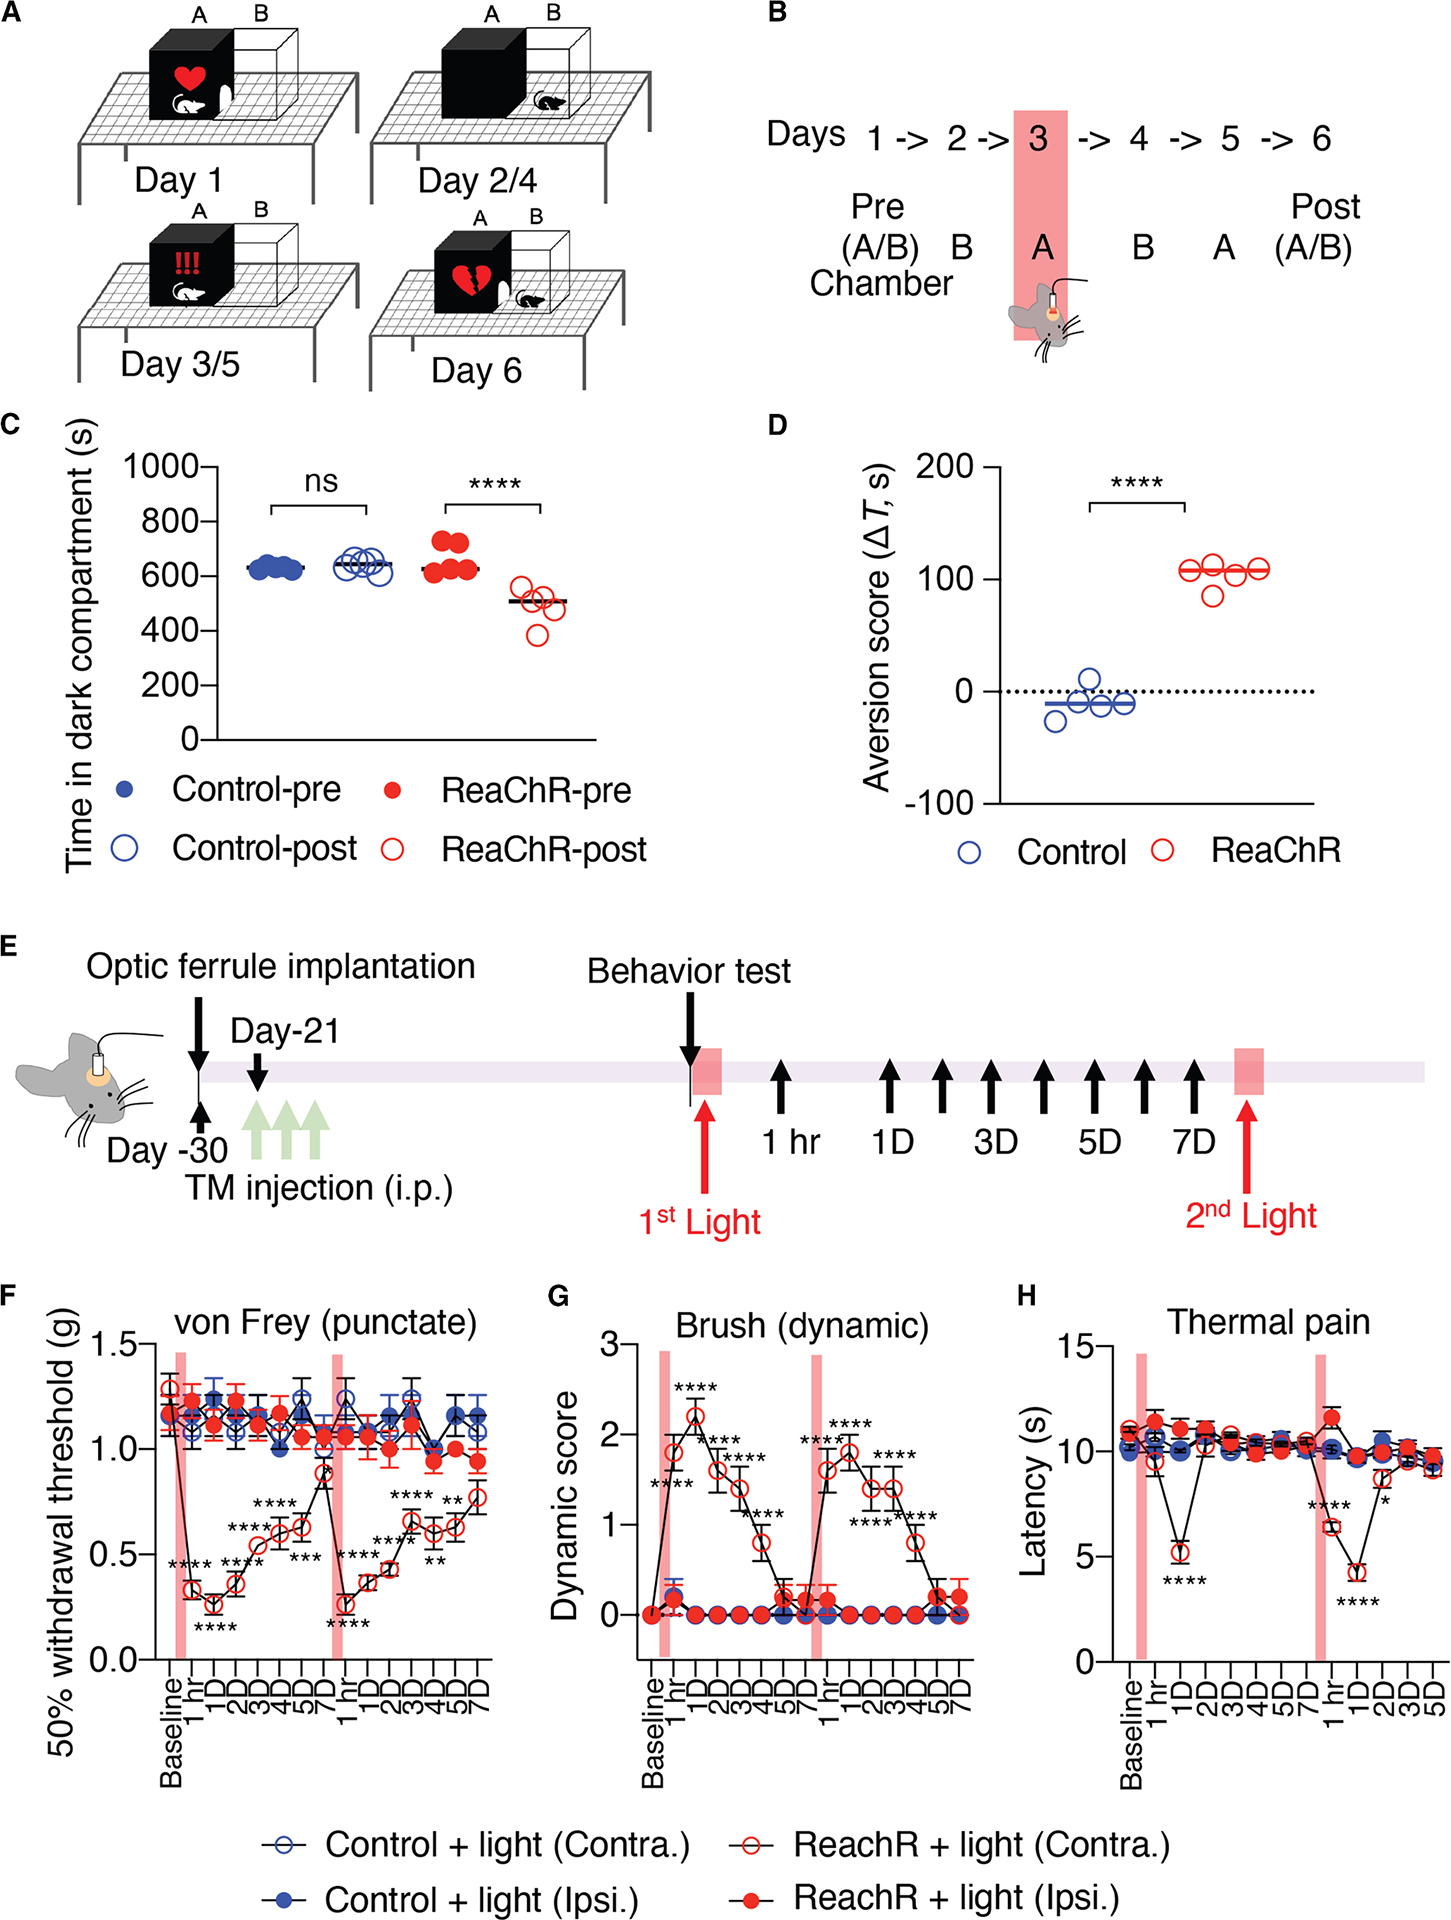
(A) Schematics of conditional place aversion (CPA) assay and experimental design. The dark and light chambers are labeled as “A” and “B,” respectively.
(B) At day 1 and day 6, the time spent in chamber A during a 15-min period was determined. On days 2–5, the mouse was placed in the indicated chamber for 20 min, with light stimulation on day 3.
(C) Absolute time (s) in chamber A before (pre) versus after (post) conditioning for various experimental groups. Data presented as mean ± SEM. n = 5 mice/group, ****p < 0.0001, one-way ANOVA with multi-comparisons.
(D) Aversion scores defined as the time difference in the A chamber before training subtracted by after training. Data presented as mean ± SEM. n = 5 mice/group, ***p < 0.001, unpaired Student t test.
(E) Experimental timeline for ReaChR induction, optogenetic stimulation, and behavior testing.
(F–H) Mechanical (F) and thermal (G) pain hypersensitivity, and dynamic hypersensitivity (H) of ReaChR mice after the first and second 30 min light stimulation. Red bar indicates the time points for light stimulation. Data presented as mean ± SEM. n = 6–7 mice/group. *p < 0.05, ***p < 0.001, ****p < 0.0001 Control Contra. vs. ReaChR Contra, two-way ANOVA with multi-comparisons.
Optogenetic stimulation of cortical microglia induces evoked pain hypersensitivity
In addition to affective-motivational responses, we next investigated the impact of light stimulation on evoked pain responses in ReaChR mice (Figure 2E). Utilizing the von Frey filament testing, we observed that optogenetic stimulation of cortical microglia induced mechanical allodynia in ReaChR mice compared with control mice (Figure 2F). In addition, brush-evoked dynamic hypersensitivity was triggered in the hind paw contralateral to the stimulated S1 cortex (Figure 2G). These pain responses emerged 1 h after optogenetic stimulation and lasted for at least 4 days. Following recovery from light-induced hypersensitivity, a second optogenetic stimulation reproduced similar hypersensitive behaviors in ReaChR mice (Figures 2F and 2G). Light-induced thermal hyperalgesia was observed to be more transient, lasting only 1 day after optogenetic stimulation (Figure 2H). In contrast, we did not observe mechanical or thermal hyperalgesia on the ipsilateral side of ReaChR mice or in control mice (Figures 2F–2H). Together, these results indicate that optogenetic stimulation of cortical microglia can trigger multiple forms of evoked pain hypersensitivity, illustrating the pro-found impact of cortical microglia activation on pain modulation.
Studies have indicated that microglia are implicated in neuropathic pain in a sex-dependent manner.33,34 Here, we sought to investigate whether pain status induced by optogenetic activation of cortical microglia is also influenced by sex. We found that optogenetic activation of S1 microglia did not induce a significant difference in mechanical allodynia between male and female ReaChR mice (Figure S5A). However, there were significant differences in light-induced thermal hypersensitivity, which lasted for approximately 1 day in male mice but persisted for several days in female mice (Figure S5B). These findings suggest that thermal hypersensitivity following optogenetic stimulation of cortical microglia is sex dependent.
Optogenetic stimulation of cortical microglia increases neuronal activity
In order to understand how light-induced cortical microglial stimulation leads to pain behaviors, we examined c-Fos expression, which is associated with neuronal hyperactivity.35 Two hours after light stimulation in ReaChR mice, we found increased neuronal c-Fos expression in the ipsilateral somatosensory cortex compared to the contralateral side, but not in the hippocampus or the control group (Figures 3A–3D, S6A, S6B, S6E, and S6F). In addition, we examined the ACC, which is critical for affective pain.36 Again, we found that neuronal c-Fos expression was significantly increased in the ipsilateral ACC compared to both contralateral and control mice (Figures 3E, 3G, and S6G). No significant difference was observed between the ipsilateral and contralateral amygdala or hypothalamus (Figures 3F, 3G, S6C, and S6D). Moreover, no significant changes were detected among regions in the control group (Figures S6E–S6H). These findings suggest that optogenetic stimulation of cortical microglia selectively induces neuronal hyperactivity in specific regions of the somatosensory cortex and ACC, potentially contributing to the development of pain behaviors.
Figure 3. Optogenetic stimulation increased neuronal activity in the S1 cortex.

(A) Representative images of c-Fos and NeuN immunostaining within the S1 cortex 2 h after light stimulation. Scale bar, 40 μm.
(B) Schematic image of light stimulation and brain area.
(C) Representative images of c-Fos and NeuN immunostaining within the hippocampus 2 h after light stimulation. Scale bar, 40 μm.
(D) Summarized data of c-Fos+ cell counts in the S1 cortex and hippocampus.
(E) Representative images of c-Fos and NeuN immunostaining within the anterior cingulate cortex (ACC). Scale bar, 100 μm.
(F) Representative images of c-Fos and NeuN immunostaining within the amygdala (Amy) 2 h after light stimulation.
(G) Summarized data of c-Fos+ cell counts in ACC and Amy. Scale bar, 40 μm. Data represented as mean ± SEM. n = 4 mice per group.
***p < 0.001, ****p < 0.0001, two-way ANOVA with multi-comparisons.
Next, we performed chronic in vivo two-photon imaging to directly observe neuronal activity following optogenetic stimulation of cortical microglia (Figures 4A and 4B). To this end, we virally transfected S1 cortical layer 2–3 excitatory neurons with a genetically encoded calcium indicator (AAV9.CaMKII. GCaMP6s). After light stimulation, there was increased spontaneous neuronal Ca2+ activity in ReaChR mice (Figures 4C and 4D), as observed in individual calcium traces (Figure 4D). This increase was manifested by both greater maximum calcium signal amplitude and a longer calcium transient duration, resulting in a significantly larger signal area (Figures 4C–4G). The augmented neuronal activity peaked at 1 day after light stimulation and declined by day 3 (Figures 4D–4G, Videos S1 and S2). In contrast, the light-induced increase in Ca2+ activity was not observed in controls, indicating that light stimulation itself does not alter neuronal activity (Figures 4C–4G). Together, these findings provide evidence that optogenetic stimulation of cortical microglia increases neuronal hyperactivity.
Figure 4. Optogenetic activation of cortical microglia induces neuronal calcium elevation.

(A) Experimental schematic of AAV9.CaMKIIa.GCaMP6s injections and in vivo imaging.
(B) Timeline of experimental design for all procedures.
(C) Representative images of neuronal calcium activity in ReaChR mice after light stimulation compared to controls, showing cumulative calcium signaling over the entire 15-min image-stacked period. Scale bar, 20 μm.
(D) Representative calcium-imaging traces of individual cells, marked by numbered circles, in both control and ReaChR mice, observed across specific time windows.
(E–G) Summarized data of max amp (DF/F), time active (s), and signal area (DF/Fxs). Data represented as mean ± SEM. n = 11–17 cells from 4 mice.
**p < 0.01, ****p < 0.0001, two-way ANOVA with multiple comparisons.
Optogenetic stimulation induces microglial landscape changes and increases ATP release
Despite growing evidence implicating brain microglia in chronic pain,21 conflicting results have been reported regarding the activation of cortical microglia.17–19 As such, we next evaluated cortical microglial response after optogenetic stimulation. After light stimulation, there were no significant changes to the number of Iba1+ microglia in the ipsilateral S1 cortex when compared to the contralateral side (Figures 5A, 5B, S7A, and S7B). Similarly, we observed no significant difference in the number of S1 microglia (Suppl. 7C–F) in either the SNT (L4 spinal nerve transection) or spared sciatic nerve injury models, where mechanical hypersensitivity was well maintained (Figures S7G and S7H). Next, using Sholl analysis, we compared the complexity of cortical microglia at 3 h and 1 and 3 days after light stimulation. We found that light stimulation induced both longer processes and a higher number of processes, resulting in increased complexity at 3 h and 1 day after light stimulation when compared to control animals (Figures 5C and 5D). Previous studies have reported that interleukin (IL)-1β expressed by optogenetically activated spinal microglia enhances neuronal activity.22 Therefore, we further investigated IL-1β expression in S1 microglia following optogenetic stimulation. Indeed, we observed that IL-1β expression was increased in S1 microglia from 2 h to 3 day post light stimulation (Figures S8A–S8C).
Figure 5. Optogenetic stimulation increases microglial complexity and ATP events in the S1 cortex.

(A) Representative images of Iba1 immunostaining of the ipsilateral S1 cortex 1, 3, and 5 days after light stimulation. Scale bar, 100 μm.
(B) Summarized data showing that Iba1+ cells did not increase in response to light stimulation. Data represented as mean ± SEM. n = 5 mice per group, two-way ANOVA with multiple comparisons.
(C) Representative single microglia images before and after image processing for Sholl analysis. Scale bar, 10 μm.
(D) Sholl analysis showing light stimulation in ReaChR mice increased microglial process complexity 3 h and 1 day after light stimulation. Data represented as mean ± SEM. n = 30 cells from 3 to 4 animals per group. *p < 0.05, ****p < 0.0001, two-way ANOVA with multiple comparisons.
(E) Representative images of cortical microglia showing “lost” (red) and “gained” (green) cells before and after optogenetic stimulations through chronic in vivo two-photon imaging. Scale bar, 200 μm.
(F) Summarized data showing rearrangement of microglia following optogenetic stimulation. Data represented as mean ± SEM. n = 5–7 animals per group. ****p < 0.0001, **p < 0.01, two-way ANOVA with multiple comparisons.
(G) Representative fluorescence images, pseudocolored images, and individual traces of fluorescence response of ATP1.0 measured 1 day after optogenetic stimulation. Scale bar, 200 μm.
(H) Number of ATP release events. Data represented as mean ± SEM. n = 7 mice per group. ****p < 0.0001, two-way ANOVA with multiple comparisons.
In our previous study, we demonstrated that microglial landscape in the somatosensory cortex can be modulated by severe seizures, acute injury, and sensory deprivation.23 Here, we monitored daily microglial landscape rearrangement in the cortex following optogenetic stimulation. Specific fields of view were re-located using blood vessels as fine landmarks. We found increased microglial landscape changes in superficial (50–120 μm) regions of the primary somatosensory cortex in ReaChR mice when compared to controls. Specifically, 30% of microglia were rearranged in ReaChR mice 1, 2, and 3 days after light stimulation when compared to their baseline of 10% change of microglial landscape (Figures 5E, 5F, and S9). However, in controls, there was no significant microglial rearrangement following light stimulation (Figure 5F) Additionally, in the SNT model, we observed an elevated rate of microglial landscape changes (Figures S10A–S10C), with a significant increase, particularly from day 2 to day 4 post SNT (Figures S10A and S10B). This rearrangement was especially pronounced in the superficial layers but not in the control group (Figures S10B, S10C, S11A, and S11B). ATP has been identified as a predominant activator of the P2Y12 receptor that mediates microglial landscape change.23 To understand whether optogenetic activation increases microglial landscape change via this mechanism, we tested ATP release within the S1 cortex using a genetically encoded GRAB hSyn-ATP1.0 sensor in vivo.24 We found that localized ATP release events increased in S1 on day 1 and day 2 after light stimulation in ReaChR mice but not in the control group (Figures 5G and 5H, Video S3). In addition, we observed a similar increase in ATP events in the SNT model (Figures S10D–S10J). Notably, ATP events exhibited diverse temporal patterns, which allowed us to categorize them into ATP-spike events and ATP-sustained events (Figures S10E–S10G). ATP-spike events are characterized by brief but intense bursts of ATP activity, where signals rapidly converge to generate sharp and pronounced peaks. These spike events were more frequent on day 3 post SNT (Figure S10E). In contrast, ATP-sustained events are marked by continuous and prolonged ATP activity, without the sharp peaks observed in spike events. Instead of intense bursts, sustained events manifest as steady and extended ATP signaling over time. These sustained events became predominant by day 5 post SNT (Figures S10F and S10G), revealing varying diameters of ATP events (Figures S10I and S10J). These results suggest that optogenetic stimulation of S1 cortex microglia increases their morphology complexity and landscape changes, potentially due to increased ATP release events.
Optogenetic stimulation of cortical microglia alters their proteomic profiles
We next sought to investigate the molecular mechanisms behind pain hypersensitivity mediated by optogenetically activated cortical microglia. To this end, we explored how optogenetic stimulation altered microglial properties that trigger pain behaviors using a proteomics approach. Protein was extracted from CD11b+ microglia isolated from the ipsilateral somatosensory cortex 1 day after light stimulation (Figure 6A). We identified a total of 3,771 proteins across all samples with 3,382 proteins being identified in both control and ReaChR mice. Of these, 44 proteins were significantly upregulated in optogenetically activated ReaChR microglia when compared to controls, while 66 proteins were downregulated (Figure 6B). The heatmap illustrates the relative expression of the top 20 differentially expressed proteins between the two groups, enabling us to compare absolute differences in protein expression and identify increases or decreases (Figure 6C). Of particular interest, upregulated proteins included STOM, PLRG, SEC62, transient receptor potential vanilloid 2 (TRPV2), and CELF1. Furthermore, gene set enrichment analysis revealed that upregulated proteins were involved in the “integral component of plasma membrane,” “receptor complex,” and “membrane invagination” in optogenetically activated microglia. This suggests an increase in cellular activities related to the plasma membrane, including recognizing external stimuli, transporting substances, and activating signal transduction pathways. Conversely, there was a decrease in protein expression related to mRNA processing, RNA splicing, and transcription regulation, indicating reduced RNA-related functions and gene expression control within the cells (Figure 6D).
Figure 6. Optogenetic activation alters the proteome profiles of cortical microglia.
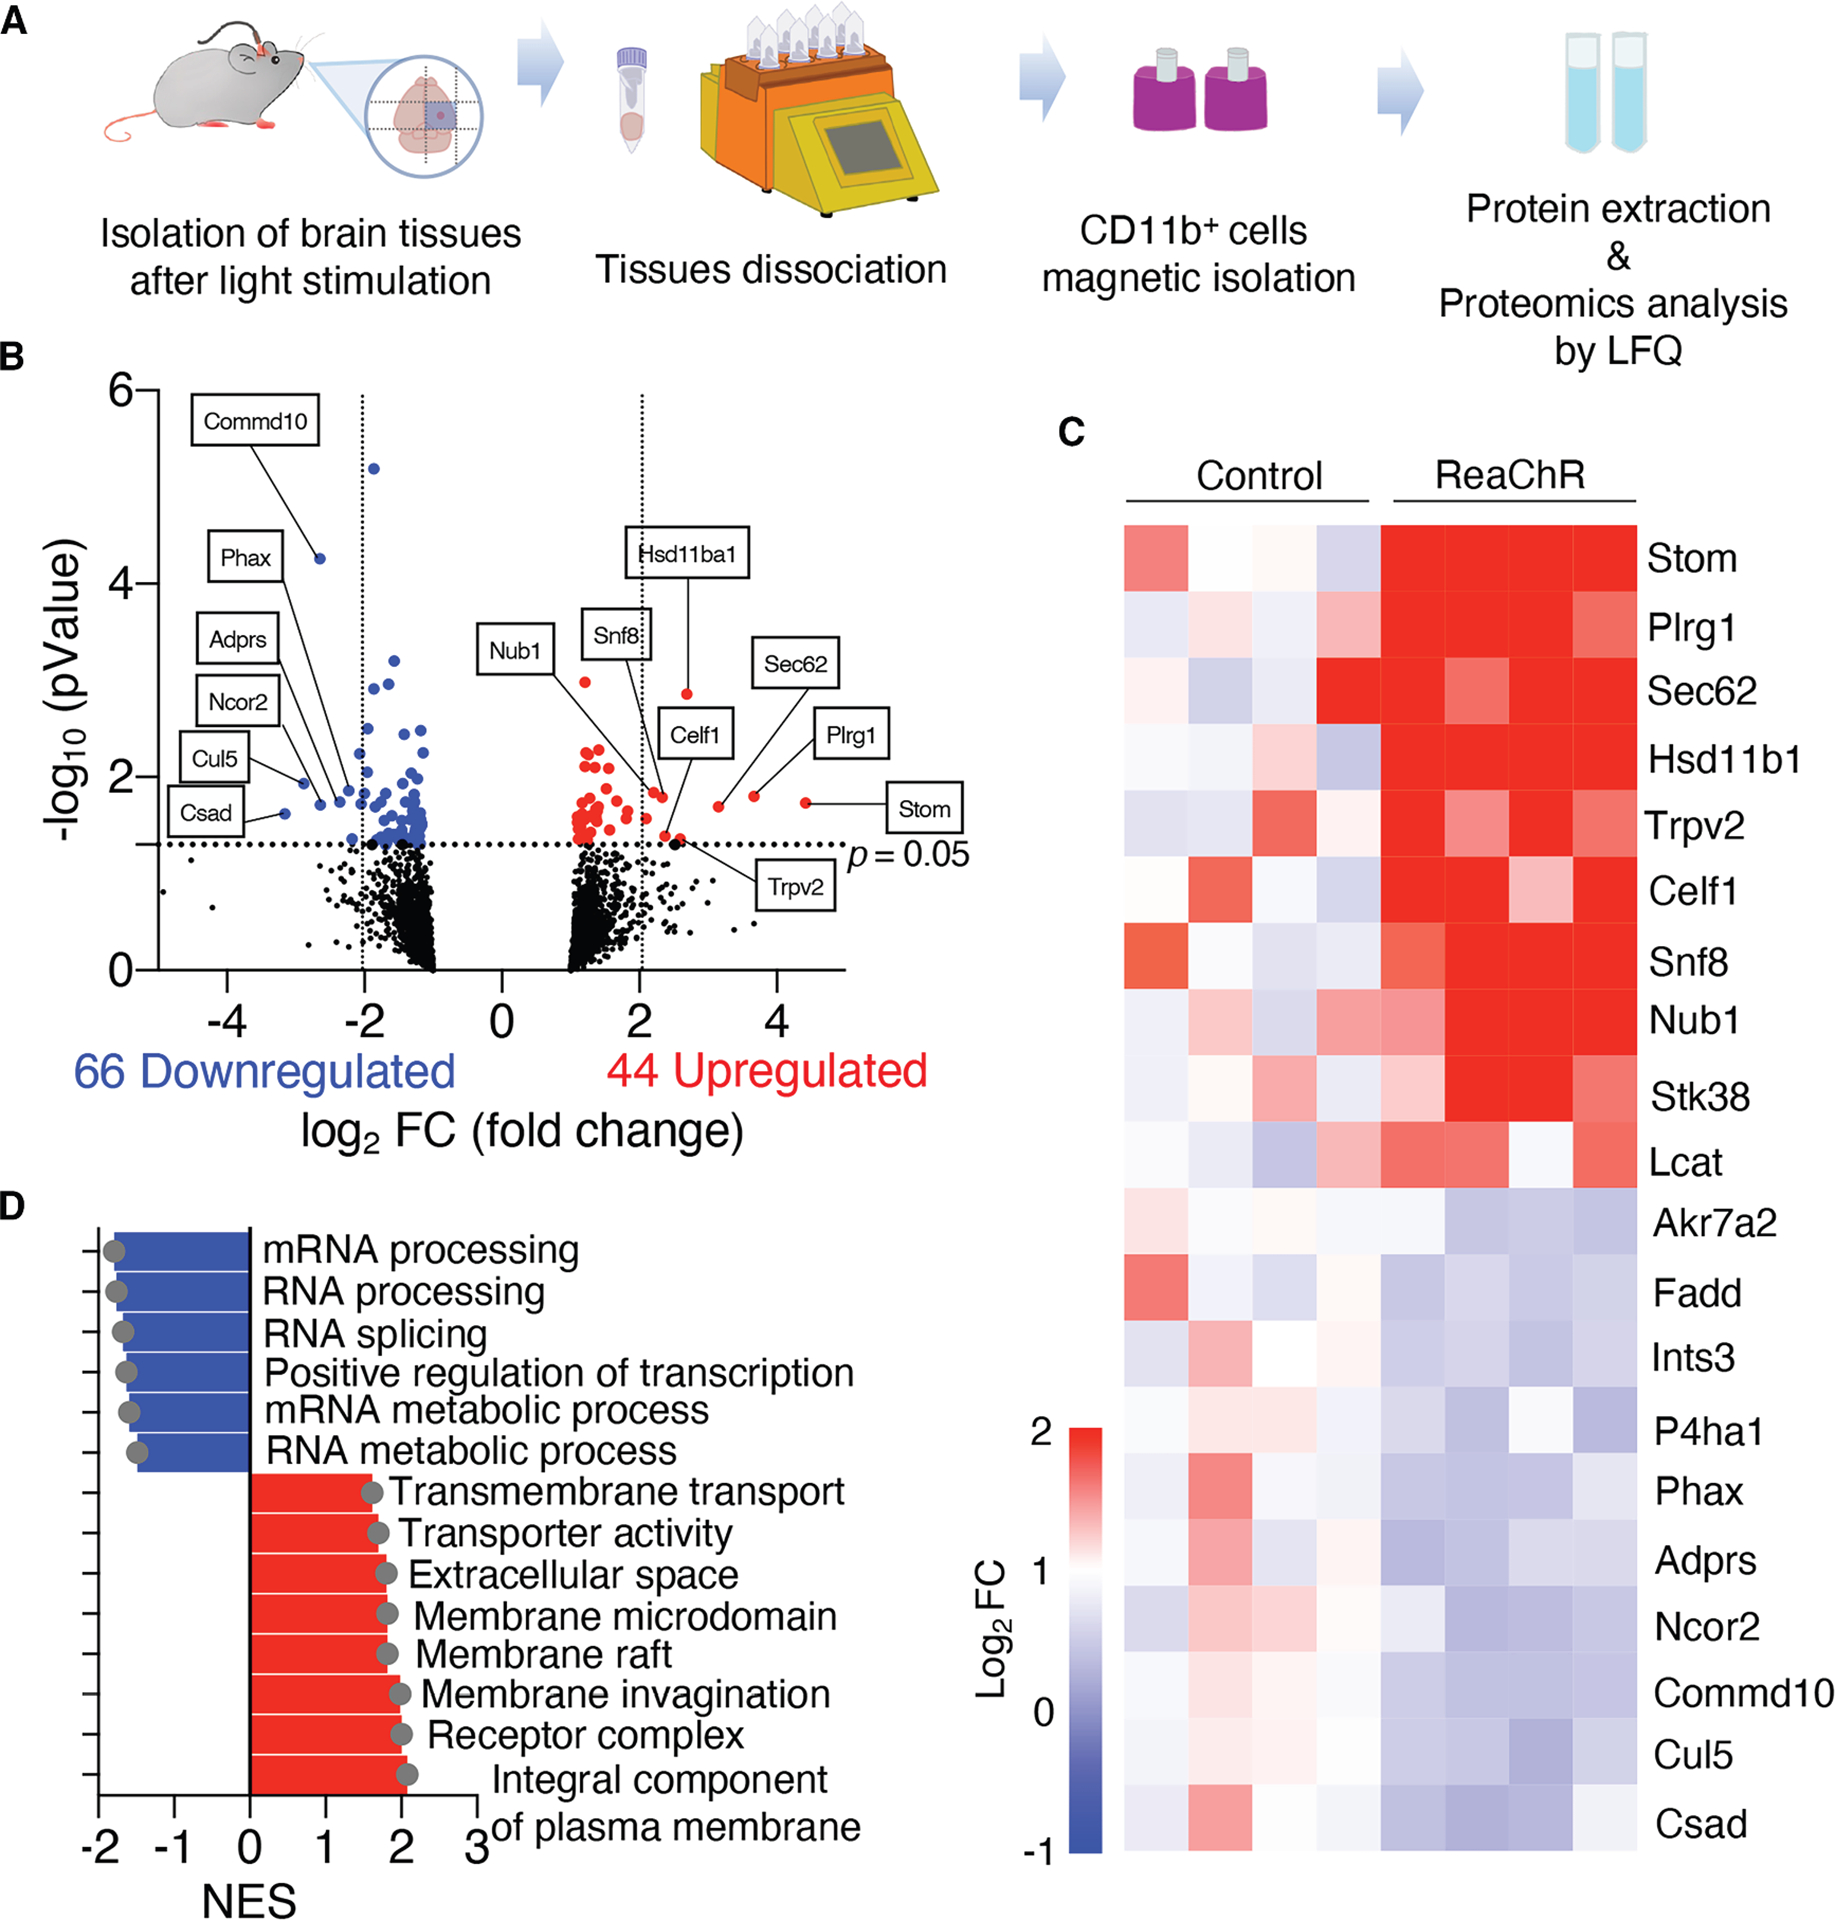
(A) Strategy for CD11b+ cell isolation from the S1 cortex and protein characterization via label-free quantification (LFQ).
(B) Volcano plot of differentially expressed proteins (DEPs) in ReaChR mice after light stimulation compared to control mice. DEPs upregulated/downregulated in ReaChR mice were labeled in red/blue. Threshold: p.adj < 0.05 and |log2 fold change| > 0.5.
(C) Heatmap of each DEPs.
(D) Boxplot of significant gene set enrichment analysis (GSEA).
Additionally, a Z score heatmap is presented to highlight how each protein expression deviates from the mean in the dataset, offering a normalized view of relative expression changes (Figure 7A). We also performed a comprehensive protein-protein interaction (PPI) analysis to investigate how differentially regulated proteins cooperate within the network to perform specific cellular functions (Figures 7B and 7C). The PPI network of upregulated proteins illustrates their enriched interactions and associated functional pathways (Figure 7B), while the PPI network of downregulated proteins highlights distinct interaction patterns within the network (Figure 7C). This analysis focused on identifying proteins that interact with upregulated and downregulated proteins involved in key biological processes such as regulation of translation and DNA-templated transcription. The proteins AKT1, EIF4A3, EPRS1, FXR2, PA2G4, RACK1, RPL13A, RPS14, RPS3, and RPS9 were identified as predicted translation regulatory proteins in PPI networks (Figure 7D). The findings suggest that these proteins play roles in various regulatory pathways, providing valuable insights into their functional implications in cellular homeostasis and gene expression control. Notably, upregulated proteins are involved in plasma membrane-related pathways, such as external stimulus recognition and signal transduction, highlighting their roles in various regulatory processes. Together, proteomics results provide valuable insights into molecular mechanisms underlying chronic pain induced by optogenetic activation of cortical microglia.
Figure 7. PPI networks of DEPs in ReaChR mice 1 day following light stimulation.

(A) The Z score heatmap shows how each protein’s expression deviates from the dataset mean. This normalized view enables a comparison of relative expression changes across the dataset.
(B and C) Three distinct functional clusters are evident within the network, associated with both upregulated (B) and downregulated (C) proteins. These functional clusters include translation proteins, regulation of translation, and DNA-templated transcription, each represented by a unique color to denote highly inter-connected nodes. Nodes in red and blue denote seed proteins, while white nodes indicate predicted proteins. Edges illustrate interactions between proteins.
(D) Table showing gene descriptions and predicted and hub status of translation regulatory proteins in PPI networks in (A) and (B).
DISCUSSION
In this study, we employed an optogenetic approach to stimulate S1 cortical microglia and explored their role in pain hypersensitivity. Using transgenic mice (CX3CR1creER/+:R26LSL-ReaChR/+) that inducibly express ReaChR in CNS microglia, we found that short-term activation of S1 cortical microglia via direct optogenetic stimulation reduced exploratory behaviors and triggered multiple pain behaviors, including unpleasant affective pain and evoked pain. Furthermore, optogenetic stimulation of S1 cortical microglia resulted in a noticeable increase in neuronal c-Fos expression and neuronal Ca2+ activity, accompanied by increased ATP release and changes in the microglial landscape. Mechanistically, optogenetic stimulation of S1 cortical microglia led to proteome alterations, potentially contributing to neuronal hyperactivity. These findings demonstrate that optogenetic approaches provide unique and controlled methods to selectively investigate cortical microglia function and pain induction in awake mice. Our study reveals that “microgliogenic” pain can be induced in mice via optogenetic manipulation of cortical microglia without injury. Thus, microglia in the S1 cortical region play a pivotal role in the development of chronic pain, offering a promising target for therapeutic intervention.
Microglial heterogeneity in response to optogenetic stimulations
While the development of chronic pain was similar following optogenetic stimulation of both spinal and cortical microglia, differences in microglial activation were evident. Stimulation of spinal microglia led to increased cell number, likely due to proliferation,22 whereas such responses were absent in cortical microglia. This distinction between microglial populations, especially in the context of neuropathic pain, has long been recognized. After peripheral nerve injury, microgliosis occurs in the spinal cord but not the cortex,20 suggesting potentially divergent roles of microglia in these CNS regions. Indeed, recent advances in single-cell RNA sequencing have revealed variations in microglial populations and their heterogeneity, possibly due to adaptation to the unique biological functions of their respective environments.37,38 The differences in responses of cortical and spinal microglia to optogenetic stimulation may stem from their local environments, supported by a previous study showing differences in microglial process complexity across various brain regions based on proximity to traumatic brain injury.39 In the current study, we observed a significant increase in cortical microglial process complexity 1 day after optogenetic stimulation, while spinal microglia exhibited shorter processes and less complexity following light stimulation. Although neuronal activity can regulate microglial morphology,40–43 the precise relationship between morphological changes of microglia and neuronal activity remains largely unknown. Further investigation is needed to fully elucidate the mechanisms governing microglial responses and their integration into neural circuits in different CNS regions underlying pain behaviors.
Additionally, we observed notable differences in the onset and duration of mechanical allodynia and thermal hypersensitivity, which may reflect the distinct roles of S1 microglia in pain processing. Specifically, optogenetic stimulation of S1 microglia induced both mechanical and thermal pain behaviors in both sexes. However, thermal pain in males was transient, resolving after 1 day, while in females, the thermal pain behaviors persisted for a longer duration. This suggests that while microglia play a critical role in initiating both types of pain, there may be sex-specific mechanisms involved in sustaining pain,44 with other immune cells such as T lymphocytes potentially playing a more prominent role in females.33 These findings highlight the need to further investigate the mechanisms underlying these sex differences in pain maintenance. Additionally, the transient nature of thermal pain in males raises questions about the distinct signaling pathways and cellular interactions involved. Addressing these discrepancies will require detailed exploration of the molecular and cellular processes, including the interactions between microglia and other immune cells, as well as potential sex-dependent regulatory pathways.
Unraveling the mechanisms of cortical microglia activation and chronic pain
In this study, optogenetic stimulation of cortical microglia resulted in somatic rearrangements and increased ATP release events in the S1 cortical areas. An important question remains regarding how optogenetic stimulation of cortical microglia triggers their landscape changes. Our previous study indicated that somatic rearrangements of microglia are regulated through P2Y12.23 Given that microglia optogenetic stimulation is associated with increased ATP release, it is possible that increased ATP release activates microglial P2Y12 to induce cortical microglia landscape change. Based on the pattern of ATP release spikes, it is unlikely that ATP is released directly from microglia. Instead, increased ATP might be associated with neuronal hyperactivity induced by optogenetic activation of cortical microglia. However, it is still unknown whether changes in microglial landscape are the cause or consequence of chronic pain.
How does microglia optogenetic activation lead to chronic pain? One straightforward mechanism is the increased ATP release and activation of microglial ATP receptors (P2X4, P2X7, and P2Y12).45 Alternative mechanisms might be linked to ReaChR as a nonselective cation channel with Ca2+ permeability. Indeed, many nonselective cation ion channels in microglia, including P2X4, P2X7, TRPV4, and TRPM2, have been reported to play critical roles in neuropathic pain induction.46 Furthermore, our previous studies showed that microglial Ca2+ may facilitate the ReaChR-induced release of IL-1β, a down-stream molecule that could mediate chronic pain hypersensitivity.22 However, further investigation is needed to understand how the opening of ReaChR in cortical microglia leads to increased ATP release, neuronal hyperactivity, and chronic pain behaviors. Particularly, future studies need to determine whether activated microglia stimulate specific cell types via IL-1β secretion, which may subsequently lead to ATP release.
Exploring the impact of ReaChR activation on the microglial proteome and neuronal activity
Our investigation revealed alterations of microglial proteome profiles following optogenetic stimulation. Among the identified proteins, adenylyl cyclase-associated protein 1 (CAP1) and TRPV2 are particularly interesting. CAP1 is well known for its expression in CD68+ macrophages and its involvement in various chemokine production processes.47 TRPV2 is a nonselective cation channel expressed in macrophages, sensory neurons, and several other cell types. It can be activated by various stimuli, including noxious heat, cannabinoids, and phosphatidylinositol-3-OH kinase signaling.48 Considering the Ca2+-permeable nature of TRPV2 and its role in triggering Ca2+ influx,49 it holds potential significance as a key participant in the pain pathogenesis induced by microglial activation. Previous studies have shown that optogenetic activation of spinal microglia leads to an increase in IL-1β expression.22 Similarly, although proteomics data did not detect IL-1β expression in the S1 cortical CD11b+ microglia, immunostaining revealed IL-1β expression following microglial ReaChR activation in the S1 cortex. This discrepancy is likely due to differences in sensitivity between the two methods, as well as protein abundance and detection limits. A recent study reported the critical role of microglial BDNF in neuropathic pain.21 Although BDNF is not among the most significantly upregulated proteins after optogenetic stimulation, our results provide converging evidence of microglial involvement in maladaptive plasticity within the S1 cortex, which is a significant pathophysiological feature of chronic pain.
In this study, we observed neuronal hyperactivity within the S1 cortical region following microglial ReaChR activation. Notably, previous research demonstrated that excitatory neurons and interneurons in the L2/3 and L5 pyramidal neurons of the S1 cortex exhibit hyperactivity in a neuropathic pain model after nerve injury.50 The striking similarities in neuronal hyperactivity suggest that the underlying cortical networks driving pain development are shared between the two models (peripheral nerve injury and optogenetic stimulation of microglia). Moreover, a recent study revealed a direct neuronal projection originating from a specific population of L5 neurons located in the S1 cortex to the spinal dorsal horn, which potentially plays a role in nociceptive processing and presents a promising target for chronic pain treatment.51 By understanding microglial contributions to neuronal activity and pain processing in the S1 cortex, we can potentially uncover novel avenues for managing chronic pain.
Limitations of the study
Several limitations warrant considerations in this study. First, the use of optogenetic stimulation represents an artificial approach to manipulate cellular activity. Previous studies have shown that the pain response is correlated with optogenetic stimulation of spinal microglia in a dose-dependent manner. In addition, we have titrated the stimulation intensity that might have biological relevance similar to cation channel activation in microglia in pain (such as P2X4 and P2X7).22 Nevertheless, a limitation of our study is that we cannot definitively determine whether the observed effects are physiologically relevant. Therefore, additional studies are needed to clarify the challenges associated with interpreting optogenetic manipulation in microglia and to elucidate its pathological significance. Furthermore, it will be important to investigate whether low-frequency stimulation (5 or 2 Hz) leads to neuronal activation and behavioral responses in future studies. Second, although the effects elicited by light stimulation might be potent, there is a possibility that these effects are transient in nature. Incorporating two-photon imaging in conjunction with light stimulation could facilitate the capture of acute effects on microglia. Third, while red light stimulation offers optimal tissue penetration properties, it is essential to verify the actual depth of penetration through electrophysiological measures. Such investigations would enhance the confidence of the findings in the study. Fourth, although we showed alterations of protein profile of optogenetically activated cortical microglia through a proteomics approach, the validation of these proteins in function of cortical microglia still remains a major challenge. Fifth, assessing changes in sensory-evoked neuronal activity following optogenetic stimulation of microglia is crucial. However, inducing sensory responses after optogenetic stimulation requires immobilizing the mouse through anesthesia, which can itself affect microglial activity.41,42,52 This technical challenge makes it difficult to precisely compare neuronal activity in this context and thus remains a limitation of the current study. Sixth, the experimental conditions, including the type of viral tools used to express opsins such as ChR253 or ReaChR (e.g., adeno-associated virus or lentivirus),54 the parameters of light stimulation, and the varying disease contexts such as spinal cord injury (SCI), epilepsy, or Parkinson’s disease, can lead to differences in results across different brain regions.55 Consequently, direct comparisons between findings in the hippocampus or other regions and the targeted S1 region may not be applicable. Finally, it is necessary to dissect molecular mechanisms underlying how microglial ReaChR activation leads to local ATP release as well as how microglial landscape change translates into pain hypersensitivity.
RESOURCE AVAILABILITY
Lead contact
Further information and requests for reagents may be directed to and will be fulfilled by the lead contact author, Long-Jun Wu (longjun.wu@uth.tmc.edu).
Materials availability
This study did not generate new, unique reagents.
Data and code availability
The proteomics datasets generated in this study have been deposited to the PRIDE (PRIDE: PXD062790) and the MassIVE (MassIVE: MSV000097580) repositories. These datasets will be publicly available upon publication. Accession numbers are also provided in the key resources table.
No original code was generated in this study.
Any additional information required to reanalyze the data reported in this paper is available from the lead contact upon request.
KEY RESOURCES TABLE
| REAGENT or RESOURCE | SOURCE | IDENTIFIER |
|---|---|---|
| Antibodies | ||
| rabbit-anti-Iba1 | Abcam | ab178847; RRID: AB_2832244 |
| goat-anti-Iba1 | Abcam | ab5076; RRID:AB_224402 |
| rabbit-anti-NeuN | Abcam | ab104225; RRID:AB_10711153 |
| mouse-anti-NeuN | Abcam | ab104224; RRID:AB_10711040 |
| rabbit-anti-c-Fos | Cell Signaling Technology | Cat#2250; RRID:AB_10828199 |
| goat anti-rat | Thermo Fisher Scientific | Cat#A-11006; RRID:AB_141373 |
| goat anti-rabbit | Thermo Fisher Scientific | Cat#A-11035; RRID:AB_143051 |
| donkey anti-goat | Thermo Fisher Scientific | Cat#A-11035; RRID:AB_143051 |
| donkey anti-goat | Thermo Fisher Scientific | Cat#A-11058; RRID:AB_142540 |
| goat anti-mouse | Thermo Fisher Scientific | Cat#A-11029; RRID:AB_2534088 |
| Bacterial and virus strains | ||
| AAV9.CaMKII.GCaMP6s.WPRE.SV40 | Addgene | #107790-AAV9 |
| AAV9.hSyn.ATP1.0 (B09) | WZ Bioscience | #YL006001-AV9 |
| Chemicals, peptides, and recombinant proteins | ||
| Tamoxifen | MilliporeSigma | T5648 |
| Fluoromount-G | SouthernBiotech | 0100-20 |
| Sucrose | Thermo scientific | A15583.0E |
| KCl | Sigma | P9333 |
| CaCl2 | Sigma | 21108 |
| MgCl2 | Sigma | M2670 |
| NaHCO3 | Sigma | S5761 |
| NaH2PO4 | Sigma | S8282 |
| glucose | Sigma | G8270 |
| NaCl | Sigma | S7653 |
| NaHCO3 | Sigma | S6014 |
| NaH2PO4 | Sigma | S5011-500G |
| K-Gluconate | Sigma | G4500 |
| HEPES | Sigma | H4034 |
| Mg-ATP | Sigma | A9187 |
| Na2-GTP | Sigma | 51120 |
| phosphocreatine disodium salt hydrate | Sigma | P-7936 |
| 4% paraformaldehyde (PFA)/10% Formaldehyde | Lab Chem | LC146705 |
| PBS | Corning | 21-040-CV; 46-013-CM |
| Dental glue | Ivoclar Vivadent | 27-143 |
| isoflurane | Piramal Critical Care | NDC 66794-017-25 |
| Deposited data | ||
| Proteomics analysis | This paper | PRIDE: PXD062790 MassIVE: MSV000097580 |
| Experimental models: Cell lines | ||
| Mouse: B6.129P2(Cg)-Cx3cr1tm1Litt/J | The Jackson Laboratory | JAX:005582 |
| Mouse: B6.Cg-Gt(ROSA)26Sortm2.2Ksvo/J | The Jackson Laboratory | JAX:026294 |
| Mouse: B6.129P2(Cg)-Cx3cr1tm2.1(cre/ERT2)Litt/WganJ | The Jackson Laboratory | JAX:021160 |
| ImageJ | National Inst. Of Health | http://rsb.info.nih.gov/nih-image/index.html |
| Fiji | National Inst. Of Health | https://imagej.net/software/fiji/downloads |
| pCLAMP | Molecular Device | NA |
| GraphPad Prism 10 | GraphPad | http://www.graphpad.com/ |
| STRING | ||
| Cytoscape software | National Resource for Network Biology | https://cytoscape.org/ |
| Other | ||
| EVOS FL | Thermo Fisher Scientific | AMF4300 |
| Ultrasonic vocalizing (USV) detector | Med Associates | MED-USA-1A-M |
| Four-lane Rotarod apparatus | Med Associates | ROTA-ROD 2 |
| Radiant heat source | IITC Life Science | NA |
STAR★METHODS
EXPERIMENTAL MODEL AND STUDY PARTICIPANT DETAILS
Ethics statement
All experimental protocols were conducted according to the National Institutes of Health (NIH) guidelines for animal research and approved by the Institutional Animal Care and Use Committee (IACUC) at Mayo Clinic (IACUC protocol # A00002735–17 and A00002777–17).
Animals and husbandry
Male mice, 7 to 12 weeks old, were used throughout the study unless the use of female mice was specifically indicated. Heterozygous (CX3CR1GFP/+) GFP reporter mice expressing GFP under control of the fractalkine receptor (CX3CR1) promotor (JAX:005582),56 C57BL/6J, R26LSL–ReaChR (JAX:026294),57 and CX3CR1CreER/CreER mice (JAX:021160)58 were purchased from Jackson Laboratory (Bar Harbor, Maine, United States of America). CX3CR1CreER/CreER mice were crossed with R26LSL–ReaChR mice to obtain CX3CR1creER/+: R26LSL–ReaChR/+ offspring used in experiments. These mice were assigned to an experimental group randomly. Experimenters were blind to genotype during behavioral testing. To induce ReaChR expression in microglia, 150 mg/kg TM (T5648, MilliporeSigma, Burlington, Massachusetts, USA) in corn oil (20 mg/mL) was administered via intraperitoneal (i.p.) injection once daily for 3 days.
METHOD DETAILS
Adeno-associated virus (AAV) injection
Under isoflurane anesthesia (4% induction, 1.5–2.5% maintenance), AAVs were injected into the somatosensory cortex (AP: −4.5, ML: +2.0) using a glass pipette (3-000-203-G/X, Drummond Scientific) and micropump (Nanoject II, Drummond Scientific). AAVs were targeted to both layer V neurons (DV: −0.5) and layer II/III neurons (DV: −0.2). A 400 nL volume was dispensed at each level at a 1 nL/s rate followed by a 15-min rest period for diffusion. To image neuronal Ca2+ activity in vivo, AAV9.CaMKII.GCaMP6s. WPRE.SV40 (Addgene, #107790-AAV9) was injected into somatosensory cortex. AAV9.hSyn.ATP1.0 (B09) (WZ Bioscience, #YL006001-AV9) were injected for monitoring ATP release event in somatosensory cortex (1:2 dilution in PBS).
Cranial window surgery
Cranial windows were implanted following standard techniques. Under isoflurane anesthesia (4% induction, 1.5–2.5% maintenance), a circular craniotomy (<4 mm diameter) was made over the somatosensory cortex (AP: −4.5, ML: +2.0) using a high-speed dental drill. A circular glass coverslip (3 mm diameter, Warner) was secured over the craniotomy using Loctite 401 at the lateral edges. A four-point headbar (NeuroTar) was placed over the window and secured using dental glue (Ivoclar Vivadent, Tetric EvoFlow, Schaan, LIE). In mice undergoing AAV injections, windows were implanted at the same site on the same day as the injection.
In vivo two-photon imaging
After recovery from cranial window surgery (2–4 weeks), mice were trained to move on an air-lifted platform (NeuroTar, Helsinki, Finland) while head-fixed under a two-photon microscope. Training occurred for 20 min/day for the first 3 days following surgery and once per week thereafter. Across all studies, mice were allowed 10 min to acclimate after being placed in the head restraint before imaging began. Mice were imaged using a two-photon imaging system (Scientifica, UK) equipped with a tunable Ti:Sapphire Mai Tai DeepSee laser (Spectra Physics, CA, USA). Laser wavelength was tuned to 920 nm to image GCaMP6s fluorescence and 940 nm to image CX3CR1GFP/+ microglia and GCaMP6s fluorescence. Imaging utilized a 40× water-immersion lens and a 180 × 180 μm field of view (512 × 512-pixel resolution). The microscope was equipped with a 565-nm dichroic mirror and the following emission filters: 525/50 nm (green channel) emission filters for GFP imaging. The laser power was maintained at 30–40 mW. Microglial landscape changes in cortex were observed at 50–120 μm beneath the pial surface (Layer I) or 180–240 μm depth (Layer II/III). Imaging neuronal calcium activity was conducted at 150 μm depth for a duration of 15 min. To capture ATP events, mice were imaged at 50 μm for 30 min.
Optogenetic ferrule implantation and light stimulation
Mice were anesthetized by 1.5–2% isoflurane anesthesia on a stereotaxic apparatus. An incision was made along the skin above the midline of the skull. The periosteum above the skull is then removed by swabbing the skull with a sterile single use cotton swab containing 5% hydrogen peroxide. The skull is then dried with a clean cotton swab. A small craniectomy was made through the bone using a high-speed dental drill. A ceramic ferrule (Thorlabs, CF230–10, ø2.5 mm, 10.5 mm, New Jersey, USA) securing a length of optic fiber (Thorlabs, FT200UMT, ø200 μm) was inserted into the hollow space of the ferrule. Following described previously,22 by making the ferrule and optic fiber equal in length, we can assess site of stimulation. Therefore, the optic fiber tip was exposed (within 0.3 mm), reaching the bone surface line for light delivery, in the S1 area. The ferrule was secured in place using dental glue (Ivoclar Vivadent, Tetric EvoFlow, Schaan, LIE). Mice were provided 2 weeks to recover from the surgery. To activate ReaChR in cortical microglia, light stimulation was delivered through the optic fiber implanted with the ferrule. We used 625-nm, red LED light (20 Hz: 45-ms light on, 5-ms light off, Thorlabs, M625F2, 13.2 mW) to activate the ReaChR. As a control, CX3CR1creER/+ mice with TM injection (i.p.) were also given identical stimulation patterns and protocols.
Behavioral measurement
Mechanical allodynia was assessed by measuring the paw withdraw threshold using a set of von Frey filaments (0.04–2 g; North Coast Medical, California, USA). Mice were placed on an elevated metal grid. The filament was applied to the plantar surface from the bottom at a vertical angle for up to 3 s. Fifty percent of withdrawal threshold values were determined using the up–down method.59
Thermal hyperalgesia was assessed by measuring the paw withdrawal latency in response to radiant heat stimuli. Mice were placed in elevated chambers with a plexiglass floor and allowed to habituate for 20 min. The radiant heat source (IITC Life Science, California, USA) was applied to the center of the plantar surface of the hind paw 4 times with 3-min intervals. The average withdrawal latency of the 4 trials was recorded as the response latency.
Rotarod tests were performed using a four-lane Rotarod apparatus (Med Associates, Vermont, USA). The rotarod speed started at 4 RPM and uniformly accelerated over a 5-min period to 40 RPM. Each mouse was tested 3 times in a day with a 15-min interval. The average daily latency per mouse from the 3 trials was used for analysis.
Dynamic mechanical hypersensitivity was assessed by light stroking (velocity is 2 cm/s) of external lateral side of the hind paw in the direction from heel to toe with a paintbrush (5/0, Princeton Art & Brush Co.). For the typical response of naive mice, very fast movement/lifting of stimulated paw (score 0) was observed. However, sustained lifting (more than 2 s) of the stimulated paw toward the body or a single gentle flinching of the stimulated paw (score 1) was observed in several pain -suggestive responses. Then, one strong lateral lifting above the level of the body such as kicking to the lateral side, not like flinching, but instead more like a super hindpaw withdrawal or a startle-like jumping (score 2), and multiple flinching responses or licking of the affected paw (score 3) was measured for dynamic mechanical hypersensitivity.32 The paintbrush was trimmed the tip and making it blunt and total length of brush is about 5 mm. We then removed the outer layer of hairs. We confirmed that modified paintbrushes in SNT (L4 spinal nerve transection). The brush would be suitable if the average score is close to zero for naıïve mice without SNT, but above 1.5 (more often around 2.0) in mice with SNT. Repeat the stimulation for three times at intervals of at least 3 minutes and obtain the average score for each mouse.
To perform the conditional place aversion (CPA) apparatus, we developed two chambers (10 × 10 × 15 cm per compartment), dark (“A”) and bright (“B”), and the chambers were placed onto the metal mesh (served as the chamber floor). The center was an inserted black (face to compartment “A”)/white (face to compartment “B”) plastic wall with a rectangular hole in the lower middle (4 × 8 cm). Mouse movement was recorded. The time a mouse spent in chamber A was evaluated by the experimenter after recording. On Day 1, each mouse was placed in the bright compartment (“B”) and allowed to freely explore between chambers A and B for 15 min (pre-test). With this apparatus design, most, if not all, naïve mice showed an initial preference for dark chamber A. A four-day period of conditioning was performed. On Days 2 and 4, the hole in the central wall was blocked by covering a dark film from the dark compartment. Mouse was put in the bright chamber B for 20 min. On Days 3 and 5, the hole in the central wall was blocked by covering a dark film from the bright compartment. Mouse was then put in the dark chamber A, and the mice received optogenetic stimulation for 30 min, with or without von Frey filament stimuli. On Day 6, the dark film that covered the hole in the central wall was removed. The individual mice were tested for their side compartment preference by placing them in the bright compartment first and allowing them to freely explore the entire apparatus for 15 min (post-test). The aversion score was measured as the time (s) spent in the dark compartment during pre-test subtracted with the time (s) spent in the dark compartment during post-test.
Ultrasonic vocalization detection was assessed by measuring quantity of vocalization using ultrasonic vocalizing (USV) detector (Cat# MED-USA-1A-M, Med Associates, USA). Mice were placed on chamber (add OFT) having USV detector. For each testing session, the pre-acclimatized animal is allowed free exploration in the environment in recording chamber (20 × 20 × 40).
To perform open field test (OFT), a mouse was placed in chamber (20 × 20 × 40) and was allowed to freely explore and move in the arena for 5 min in a test session. A central zone was defined by a 20 × 20 cm area in the center of the arena. Locomotor activity was recorded automatically by an automated video-tracking system (Med associates inc, SN ENV-022MD-27, MED Activity monitor Version 6.02). Time the mouse spent in the total distance traveled, central zone (time center), and latency to fall during the 5 min session were recorded and analyzed for each mouse. To avoid adapting to the same chamber, all chambers were cleaned, and distinct chamber was used for consecutive days.
Fluorescent immunostaining
Mice were deeply anesthetized with isoflurane (5% in O2) and perfused transcardially with 20-ml PBS followed by 20 ml of cold 4% paraformaldehyde (PFA) in PBS. The spinal cord was removed and postfixed by submersion in the same 4% PFA solution for 4 to 6 hours at 4°C. The samples were then transferred to a 30% sucrose in PBS solution overnight for cryoprotection. Sample sections (20 μm in thickness for immunohistochemistry [IHC] or 30-μm thickness for Sholl analysis) were prepared on gelatin-coated glass slides using a cryostat (Leica, Hesse, DEU). The sections were blocked with 5% goat or donkey serum and 0.3% Triton X-100 (Sigma Aldrich, Missouri, USA) in PBS buffer for 60 min, and then incubated overnight at 4°C with primary antibody: rabbit-anti-Iba1 (1:500, Abcam Cat# ab178847, RRID:AB_2832244), goat-anti-Iba1 (1:500, Abcam Cat# ab5076, RRID:AB_2224402), rabbit-anti-NeuN (1:500, Abcam Cat# ab104225, RRID:AB_10711153), mouse-anti-NeuN (1:500, Abcam Cat# ab104224, RRID:AB_10711153), rabbit-anti-c-Fos (Cell Signaling Technology Cat# 2250, RRID:AB_2247211). The sections were then washed and incubated for 60 min at room temperature with an appropriate secondary antibody: goat anti-rat (1:500, Thermo Fisher Scientific Cat# A-11006, RRID:AB_2534074, Massachusetts, USA), goat anti-rabbit (1:500, Thermo Fisher Scientific Cat# A-11035, RRID:AB_2534093), donkey anti-goat (1:500, Thermo Fisher Scientific Cat# A-11058, RRID:AB_2534105), or goat anti-mouse (1:500, Thermo Fisher Scientific Cat# A-11029, RRID:AB_2534088). The sections were mounted with Fluoromount-G (SouthernBiotech, Alabama, USA), and fluorescent images were obtained with the EVOS FL Imaging System.
Sholl analysis
Fixed tissue (30 μm) was used to acquire Z-stack images of microglia (3-μm step size) using a 40× objective and a confocal microscope (LSM510, Zeiss, Oberkochen, DEU). Consecutive Z-stack images were converted to a maximum intensity projection image using Fiji software. Over the maximum intensity projection image, concentric circles were drawn (concentric circles plugin, fiji), centered on the soma, beginning at a 0.5-μm radius and increasing in radius by 0.1-μm steps. Sholl analysis was manually performed for each cell by counting the number of intersections between microglia branches along each concentric circle to create a Sholl plot. Additional measures to characterize each cell included the process branch number, process length, and cell soma area.
Whole-cell recording of microglia in acute brain slices
Mice (8–12 weeks old) were anesthetized with isoflurane, and 350-μm brain slices were prepared in ice-cold sucrose-based artificial cerebrospinal fluid (ACSF) containing (in mM): sucrose 185, KCl 2.5, CaCl2 0.5, MgCl2 10, NaHCO3 26, NaH2PO4 1.2, and glucose 25. Slices were incubated for 1 hour in normal ACSF, which contained (in mM): NaCl 120, KCl 2.5, CaCl2 2, MgCl2 2, NaHCO3 26, NaH2PO4 1, and glucose 11, to allow for recovery. Whole-cell patch-clamp recordings were performed on cortical microglia in slices perfused with room temperature ACSF using recording pipettes with a resistance of 5–7 MΩ, filled with intracellular solution composed of (in mM): K-Gluconate 135, HEPES 10, Mg-ATP 4, Na2-GTP 0.3, and phosphocreatine disodium salt hydrate 10, adjusted to pH 7.2 and 290–300 mOsm. Throughout the preparation, recovery, and recording processes, the slices were kept protected from light to prevent photodamage. Microglia were held at a membrane potential of −60 mV during recordings, and their current–voltage relationships in response to ReaChR activation were examined using two protocols under voltage-clamp mode. In the first protocol, a ramp protocol was applied, shifting the membrane voltage from −140 mV to 40 mV over a duration of 500 ms, while in the second protocol, constant membrane voltage changes ranging from −140 mV to 40 mV were applied in 20-mV increments, with each step lasting 500 ms. Both protocols were conducted in the presence and absence of 625-nm red light stimulation, which was applied specifically during the 500-ms voltage shift. Current-clamp mode was also employed to assess membrane potential changes in response to red light stimulation. All recordings were amplified and filtered at 2 kHz using a patch-clamp amplifier (Axon Instruments, Axon 700B, CA, USA), digitized using DIGIDATA 1550 (Axon Instruments), and analyzed using pCLAMP software (Molecular Devices, Union City, CA, USA). Data were excluded from analysis if the input resistance of the cell changed by more than 20% during the recording session.
QUANTIFICATION AND STATISTICAL ANALYSIS
Statistical analysis
Quantification of Western blot results was done with Fiji software (Fiji, RRID:SCR_002285). Pain behaviors were analyzed using 2-way ANOVA with multi-comparisons to test for main effects between groups followed by post hoc testing for significant differences. Two-group analysis utilized the unpaired Student t test. Three-group analysis utilized a 1-way ANOVA design. Data are presented as mean ± SEM. All statistical analyses were performed using GraphPad Prism 10 software (GraphPad Prism 10, RRID:SCR_002798). Level of significance is indicated with *P < 0.05, **P < 0.01, ***P < 0.001, ****P < 0.0001.
Imaging data analysis
Z-stack images and time-series images were adjusted for focal plane displacement using ImageJ (National Institutes of Health, Bethesda, MD, https://imagej.nih.gov/ij/) with the plug-ins TurboReg and StackReg.60 To analyze time-series neuronal Ca2+ activity, an average intensity image of the entire video was generated for region of interest (ROI) selection. ROIs were manually drawn with the oval selection tool for all neuronal cell somas detected. Using these ROIs, mean fluorescent intensity (MFI) values were obtained and converted into ΔF/F.
For cell rearrangement analyses, microglia in field of views (FOVs) from consecutive days within a volume of 60 × 330 × 330 μm between 50 and 120 μm (or 180–240 μm) from the brain surface were compared. Individual cells were identified and marked with numbers from the previous day and transposed to the next day. Cell bodies were regarded as stable if they maintained their position within a 2-cell-body distance from the previous day (~10–15 μm). Cell bodies that were either absent or present at a distance of 2 cell bodies or more were marked as either “gained” if they were not there on the previous day or “lost” if they were there on the previous day but absent on the next day. The percent change of “rearranged” cells was determined as the number of both “gained” and “lost” cells divided by the total number of cells in each FOVs. Similar analysis, but specific for either “gained” or “lost” cells, was performed to determine the percent rearrangement of those cell groups.
Microglia isolation and proteomic analysis
Following PBS perfusion, brains from 7 to 12 weeks old mice were harvested, and the ipsilateral S1 cortex was extracted for microglia isolation. Four to five S1 cortex were pooled together, and microglia were isolated using magnetic CD11b cell sorting with MACS Adult Brain Dissociation kit (order no. 130-107-677, Miltenyi Biotech, Germany) following manufacturer’s instructions. Subsequently, samples were sent for protein characterization to Mayo Clinic Proteomics Core, which is a shared resource of the Mayo Clinic Cancer Center (NCI P30 CA15083). A significance threshold of p.adj < 0.05 and |log2 fold-change| > 0.5 was applied to identify differentially expressed proteins (DEPs) between conditions. GraphPad Prism 10 software (GraphPad Prism 10, RRID:SCR_002798) facilitated the visualization of DEPs onto the representative genome diagram.61 ClusterProfiler software was utilized for the Gene Set Enrichment Analysis (GSEA).62
Protein-protein interaction (PPI) network analysis
The search tool for the retrieval of interacting proteins (STRING; https://string-db.org), which integrates both known and predicted protein-protein interactions (PPIs), was utilized to predict functional interactions among differentially expressed proteins (DEPs) across various tissues. To identify potential interactions, the STRING tool was applied with active interaction sources, including text mining, experiments, databases, and co-expression data. The analysis was restricted to the species Mus musculus, with a minimum interaction confidence score of > 0.4 to construct the PPI networks. Cytoscape software (version 3.9.1) was then used to visualize these networks, where nodes represent proteins and edges signify their interactions. Active interaction sources comprised experimental data, computational predictions, and public text collections to enhance the robustness of the network analysis.
Supplementary Material
Supplemental information can be found online at https://doi.org/10.1016/j.celrep.2025.115717.
Highlights.
Optogenetic activation of S1 cortical microglia induces pain hypersensitivity
Cortical microglia activation enhances neuronal activity and ATP release
Optogenetic activation promotes microglial landscape changes
Optogenetic stimulation of cortical microglia alters their proteomic profiles
ACKNOWLEDGMENTS
This work was supported by the National Institutes of Health (R35NS132326 and R01NS112144) to L.-J.W. and the National Research Foundation of Korea (RS-2024-00342441) to M.-H.Y. The funders had no role in study design, data collection and analysis, decision to publish, or preparation of the manuscript. We are thankful to members of the Wu Lab at Mayo and UTHealth Houston for insightful discussions, for the assistance of the Mayo Clinic Proteomics Core, a shared resource of the Mayo Clinic Center (NCI P30 CA15083), and to Macrogen, Inc. for conducting the PPI analysis.
Footnotes
DECLARATION OF INTERESTS
The authors declare no competing interests.
REFERENCES
- 1.Bushnell MC, Duncan GH, Hofbauer RK, Ha B, Chen JI, and Carrier B (1999). Pain perception: is there a role for primary somatosensory cortex? Proc. Natl. Acad. Sci. USA 96, 7705–7709. 10.1073/pnas.96.14.7705. [DOI] [PMC free article] [PubMed] [Google Scholar]
- 2.Kim W, Kim SK, and Nabekura J (2017). Functional and structural plasticity in the primary somatosensory cortex associated with chronic pain. J. Neurochem 141, 499–506. 10.1111/jnc.14012. [DOI] [PubMed] [Google Scholar]
- 3.Costigan M, Scholz J, and Woolf CJ (2009). Neuropathic pain: a maladaptive response of the nervous system to damage. Annu. Rev. Neurosci 32, 1–32. 10.1146/annurev.neuro.051508.135531. [DOI] [PMC free article] [PubMed] [Google Scholar]
- 4.Liu Y, Latremoliere A, Li X, Zhang Z, Chen M, Wang X, Fang C, Zhu J, Alexandre C, Gao Z, et al. (2018). Touch and tactile neuropathic pain sensitivity are set by corticospinal projections. Nature 561, 547–550. 10.1038/s41586-018-0515-2. [DOI] [PMC free article] [PubMed] [Google Scholar]
- 5.Seifert F, and Maihöfner C (2009). Central mechanisms of experimental and chronic neuropathic pain: findings from functional imaging studies. Cell. Mol. Life Sci 66, 375–390. 10.1007/s00018-008-8428-0. [DOI] [PMC free article] [PubMed] [Google Scholar]
- 6.Flor H, Braun C, Elbert T, and Birbaumer N (1997). Extensive reorganization of primary somatosensory cortex in chronic back pain patients. Neurosci. Lett 224, 5–8. 10.1016/s0304-3940(97)13441-3. [DOI] [PubMed] [Google Scholar]
- 7.Flor H, Elbert T, Knecht S, Wienbruch C, Pantev C, Birbaumer N, Larbig W, and Taub E (1995). Phantom-limb pain as a perceptual correlate of cortical reorganization following arm amputation. Nature 375, 482–484. 10.1038/375482a0. [DOI] [PubMed] [Google Scholar]
- 8.Kim CE, Kim YK, Chung G, Jeong JM, Lee DS, Kim J, and Kim SJ (2014). Large-scale plastic changes of the brain network in an animal model of neuropathic pain. Neuroimage 98, 203–215. 10.1016/j.neuroimage.2014.04.063. [DOI] [PubMed] [Google Scholar]
- 9.Eto K, Ishibashi H, Yoshimura T, Watanabe M, Miyamoto A, Ikenaka K, Moorhouse AJ, and Nabekura J (2012). Enhanced GABAergic activity in the mouse primary somatosensory cortex is insufficient to alleviate chronic pain behavior with reduced expression of neuronal potassium-chloride cotransporter. J. Neurosci 32, 16552–16559. 10.1523/JNEUROSCI.2104-12.2012. [DOI] [PMC free article] [PubMed] [Google Scholar]
- 10.Kim SK, Hayashi H, Ishikawa T, Shibata K, Shigetomi E, Shinozaki Y, Inada H, Roh SE, Kim SJ, Lee G, et al. (2016). Cortical astrocytes rewire somatosensory cortical circuits for peripheral neuropathic pain. J. Clin. Investig 126, 1983–1997. 10.1172/JCI82859. [DOI] [PMC free article] [PubMed] [Google Scholar]
- 11.Monconduit L, Lopez-Avila A, Molat JL, Chalus M, and Villanueva L (2006). Corticofugal output from the primary somatosensory cortex selectively modulates innocuous and noxious inputs in the rat spinothalamic system. J. Neurosci 26, 8441–8450. 10.1523/JNEURO-SCI.1293-06.2006. [DOI] [PMC free article] [PubMed] [Google Scholar]
- 12.Eto K, Wake H, Watanabe M, Ishibashi H, Noda M, Yanagawa Y, and Nabekura J (2011). Inter-regional contribution of enhanced activity of the primary somatosensory cortex to the anterior cingulate cortex accelerates chronic pain behavior. J. Neurosci 31, 7631–7636. 10.1523/JNEUROSCI.0946-11.2011. [DOI] [PMC free article] [PubMed] [Google Scholar]
- 13.De Ridder D, De Mulder G, Menovsky T, Sunaert S, and Kovacs S (2007). Electrical stimulation of auditory and somatosensory cortices for treatment of tinnitus and pain. Prog. Brain Res 166, 377–388. 10.1016/S0079-6123(07)66036-1. [DOI] [PubMed] [Google Scholar]
- 14.Matsuzawa-Yanagida K, Narita M, Nakajima M, Kuzumaki N, Niikura K, Nozaki H, Takagi T, Tamai E, Hareyama N, Terada M, et al. (2008). Usefulness of antidepressants for improving the neuropathic pain-like state and pain-induced anxiety through actions at different brain sites. Neuropsychopharmacology 33, 1952–1965. 10.1038/sj.npp.1301590. [DOI] [PubMed] [Google Scholar]
- 15.Zhuo M, Wu G, and Wu LJ (2011). Neuronal and microglial mechanisms of neuropathic pain. Mol. Brain 4, 31. 10.1186/1756-6606-4-31. [DOI] [PMC free article] [PubMed] [Google Scholar]
- 16.Barcelon EE, Cho WH, Jun SB, and Lee SJ (2019). Brain Microglial Activation in Chronic Pain-Associated Affective Disorder. Front. Neurosci 13, 213. 10.3389/fnins.2019.00213. [DOI] [PMC free article] [PubMed] [Google Scholar]
- 17.Gui WS, Wei X, Mai CL, Murugan M, Wu LJ, Xin WJ, Zhou LJ, and Liu XG (2016). Interleukin-1β overproduction is a common cause for neuropathic pain, memory deficit, and depression following peripheral nerve injury in rodents. Mol. Pain 12, 1744806916646784. 10.1177/1744806916646784. [DOI] [PMC free article] [PubMed] [Google Scholar]
- 18.Taylor AMW, Mehrabani S, Liu S, Taylor AJ, and Cahill CM (2017). Topography of microglial activation in sensory- and affect-related brain regions in chronic pain. J. Neurosci. Res 95, 1330–1335. 10.1002/jnr.23883. [DOI] [PMC free article] [PubMed] [Google Scholar]
- 19.Xu N, Tang XH, Pan W, Xie ZM, Zhang GF, Ji MH, Yang JJ, Zhou MT, and Zhou ZQ (2017). Spared Nerve Injury Increases the Expression of Microglia M1 Markers in the Prefrontal Cortex of Rats and Provokes Depression-Like Behaviors. Front. Neurosci 11, 209. 10.3389/fnins.2017.00209. [DOI] [PMC free article] [PubMed] [Google Scholar]
- 20.Zhang F, Vadakkan KI, Kim SS, Wu LJ, Shang Y, and Zhuo M (2008). Selective activation of microglia in spinal cord but not higher cortical regions following nerve injury in adult mouse. Mol. Pain 4, 15. 10.1186/1744-8069-4-15. [DOI] [PMC free article] [PubMed] [Google Scholar]
- 21.Huang L, Jin J, Chen K, You S, Zhang H, Sideris A, Norcini M, Recio-Pinto E, Wang J, Gan WB, and Yang G (2021). BDNF produced by cerebral microglia promotes cortical plasticity and pain hypersensitivity after peripheral nerve injury. PLoS Biol. 19, e3001337. 10.1371/journal.pbio.3001337. [DOI] [PMC free article] [PubMed] [Google Scholar]
- 22.Yi MH, Liu YU, Umpierre AD, Chen T, Ying Y, Zheng J, Dheer A, Bosco DB, Dong H, and Wu LJ (2021). Optogenetic activation of spinal microglia triggers chronic pain in mice. PLoS Biol. 19, e3001154. 10.1371/journal.pbio.3001154. [DOI] [PMC free article] [PubMed] [Google Scholar]
- 23.Eyo UB, Mo M, Yi MH, Murugan M, Liu J, Yarlagadda R, Margolis DJ, Xu P, and Wu LJ (2018). P2Y12R-Dependent Translocation Mechanisms Gate the Changing Microglial Landscape. Cell Rep. 23, 959–966. 10.1016/j.celrep.2018.04.001. [DOI] [PMC free article] [PubMed] [Google Scholar]
- 24.Wu Z, He K, Chen Y, Li H, Pan S, Li B, Liu T, Xi F, Deng F, Wang H, et al. (2022). A sensitive GRAB sensor for detecting extracellular ATP in vitro and in vivo. Neuron 110, 770–782.e5. 10.1016/j.neuron.2021.11.027. [DOI] [PubMed] [Google Scholar]
- 25.Cho H, Jang Y, Lee B, Chun H, Jung J, Kim SM, Hwang SW, and Oh U (2013). Voluntary movements as a possible non-reflexive pain assay. Mol. Pain 9, 25. 10.1186/1744-8069-9-25. [DOI] [PMC free article] [PubMed] [Google Scholar]
- 26.Zhang MM, Liu SB, Chen T, Koga K, Zhang T, Li YQ, and Zhuo M (2014). Effects of NB001 and gabapentin on irritable bowel syndrome-induced behavioral anxiety and spontaneous pain. Mol. Brain 7, 47. 10.1186/1756-6606-7-47. [DOI] [PMC free article] [PubMed] [Google Scholar]
- 27.Kurejova M, Nattenmüller U, Hildebrandt U, Selvaraj D, Stösser S, and Kuner R (2010). An improved behavioural assay demonstrates that ultrasound vocalizations constitute a reliable indicator of chronic cancer pain and neuropathic pain. Mol. Pain 6, 18. 10.1186/1744-8069-6-18. [DOI] [PMC free article] [PubMed] [Google Scholar]
- 28.Ko SW, Chatila T, and Zhuo M (2005). Contribution of CaMKIV to injury and fear-induced ultrasonic vocalizations in adult mice. Mol. Pain 1, 10. 10.1186/1744-8069-1-10. [DOI] [PMC free article] [PubMed] [Google Scholar]
- 29.Han JS, Bird GC, Li W, Jones J, and Neugebauer V (2005). Computerized analysis of audible and ultrasonic vocalizations of rats as a standardized measure of pain-related behavior. J. Neurosci. Methods 141, 261–269. 10.1016/j.jneumeth.2004.07.005. [DOI] [PubMed] [Google Scholar]
- 30.Sotocinal SG, Sorge RE, Zaloum A, Tuttle AH, Martin LJ, Wieskopf JS, Mapplebeck JCS, Wei P, Zhan S, Zhang S, et al. (2011). The Rat Grimace Scale: a partially automated method for quantifying pain in the laboratory rat via facial expressions. Mol. Pain 7, 55. 10.1186/1744-8069-7-55. [DOI] [PMC free article] [PubMed] [Google Scholar]
- 31.Langford DJ, Bailey AL, Chanda ML, Clarke SE, Drummond TE, Echols S, Glick S, Ingrao J, Klassen-Ross T, Lacroix-Fralish ML, et al. (2010). Coding of facial expressions of pain in the laboratory mouse. Nat. Methods 7, 447–449. 10.1038/nmeth.1455. [DOI] [PubMed] [Google Scholar]
- 32.Cheng L, Duan B, Huang T, Zhang Y, Chen Y, Britz O, Garcia-Campmany L, Ren X, Vong L, Lowell BB, et al. (2017). Identification of spinal circuits involved in touch-evoked dynamic mechanical pain. Nat. Neurosci 20, 804–814. 10.1038/nn.4549. [DOI] [PMC free article] [PubMed] [Google Scholar]
- 33.Sorge RE, Mapplebeck JCS, Rosen S, Beggs S, Taves S, Alexander JK, Martin LJ, Austin JS, Sotocinal SG, Chen D, et al. (2015). Different immune cells mediate mechanical pain hypersensitivity in male and female mice. Nat. Neurosci 18, 1081–1083. 10.1038/nn.4053. [DOI] [PMC free article] [PubMed] [Google Scholar]
- 34.Chen G, Luo X, Qadri MY, Berta T, and Ji RR (2018). Sex-Dependent Glial Signaling in Pathological Pain: Distinct Roles of Spinal Microglia and Astrocytes. Neurosci. Bull 34, 98–108. 10.1007/s12264-017-0145-y. [DOI] [PMC free article] [PubMed] [Google Scholar]
- 35.Bullitt E (1990). Expression of c-fos-like protein as a marker for neuronal activity following noxious stimulation in the rat. J. Comp. Neurol 296, 517–530. 10.1002/cne.902960402. [DOI] [PubMed] [Google Scholar]
- 36.Bliss TVP, Collingridge GL, Kaang BK, and Zhuo M (2016). Synaptic plasticity in the anterior cingulate cortex in acute and chronic pain. Nat. Rev. Neurosci 17, 485–496. 10.1038/nrn.2016.68. [DOI] [PubMed] [Google Scholar]
- 37.Zheng J, Ru W, Adolacion JR, Spurgat MS, Liu X, Yuan S, Liang RX, Dong J, Potter AS, Potter SS, et al. (2021). Single-cell RNA-seq analysis reveals compartment-specific heterogeneity and plasticity of microglia. iScience 24, 102186. 10.1016/j.isci.2021.102186. [DOI] [PMC free article] [PubMed] [Google Scholar]
- 38.Xuan FL, Chithanathan K, Lilleväli K, Yuan X, and Tian L (2019). Differences of Microglia in the Brain and the Spinal Cord. Front. Cell. Neurosci 13, 504. 10.3389/fncel.2019.00504. [DOI] [PMC free article] [PubMed] [Google Scholar]
- 39.Morrison H, Young K, Qureshi M, Rowe RK, and Lifshitz J (2017). Quantitative microglia analyses reveal diverse morphologic responses in the rat cortex after diffuse brain injury. Sci. Rep 7, 13211. 10.1038/s41598-017-13581-z. [DOI] [PMC free article] [PubMed] [Google Scholar]
- 40.Eyo UB, Peng J, Swiatkowski P, Mukherjee A, Bispo A, and Wu LJ (2014). Neuronal hyperactivity recruits microglial processes via neuronal NMDA receptors and microglial P2Y12 receptors after status epilepticus. J. Neurosci 34, 10528–10540. 10.1523/JNEUROSCI.0416-14.2014. [DOI] [PMC free article] [PubMed] [Google Scholar]
- 41.Liu YU, Ying Y, Li Y, Eyo UB, Chen T, Zheng J, Umpierre AD, Zhu J, Bosco DB, Dong H, and Wu LJ (2019). Neuronal network activity controls microglial process surveillance in awake mice via norepinephrine signaling. Nat. Neurosci 22, 1771–1781. 10.1038/s41593-019-0511-3. [DOI] [PMC free article] [PubMed] [Google Scholar]
- 42.Haruwaka K, Ying Y, Liang Y, Umpierre AD, Yi MH, Kremen V, Chen T, Xie T, Qi F, Zhao S, et al. (2024). Microglia enhance post-anesthesia neuronal activity by shielding inhibitory synapses. Nat. Neurosci 27, 449–461. 10.1038/s41593-023-01537-8. [DOI] [PMC free article] [PubMed] [Google Scholar]
- 43.Zhao S, Umpierre AD, and Wu LJ (2024). Tuning neural circuits and behaviors by microglia in the adult brain. Trends Neurosci. 47, 181–194. 10.1016/j.tins.2023.12.003. [DOI] [PMC free article] [PubMed] [Google Scholar]
- 44.Mogil JS, Parisien M, Esfahani SJ, and Diatchenko L (2024). Sex differences in mechanisms of pain hypersensitivity. Neurosci. Biobehav. Rev 163, 105749. 10.1016/j.neubiorev.2024.105749. [DOI] [PubMed] [Google Scholar]
- 45.Inoue K (2008). Purinergic systems in microglia. Cell. Mol. Life Sci 65, 3074–3080. 10.1007/s00018-008-8210-3. [DOI] [PMC free article] [PubMed] [Google Scholar]
- 46.Inoue K, and Tsuda M (2018). Microglia in neuropathic pain: cellular and molecular mechanisms and therapeutic potential. Nat. Rev. Neurosci 19, 138–152. 10.1038/nrn.2018.2. [DOI] [PubMed] [Google Scholar]
- 47.Sato H, Muraoka S, Kusunoki N, Masuoka S, Yamada S, Ogasawara H, Imai T, Akasaka Y, Tochigi N, Takahashi H, et al. (2017). Resistin upregulates chemokine production by fibroblast-like synoviocytes from patients with rheumatoid arthritis. Arthritis Res. Ther 19, 263. 10.1186/s13075-017-1472-0. [DOI] [PMC free article] [PubMed] [Google Scholar]
- 48.Caterina MJ, Rosen TA, Tominaga M, Brake AJ, and Julius D (1999). A capsaicin-receptor homologue with a high threshold for noxious heat. Nature 398, 436–441. 10.1038/18906. [DOI] [PubMed] [Google Scholar]
- 49.Link TM, Park U, Vonakis BM, Raben DM, Soloski MJ, and Caterina MJ (2010). TRPV2 has a pivotal role in macrophage particle binding and phagocytosis. Nat. Immunol 11, 232–239. 10.1038/ni.1842. [DOI] [PMC free article] [PubMed] [Google Scholar]
- 50.Cichon J, Blanck TJJ, Gan WB, and Yang G (2017). Activation of cortical somatostatin interneurons prevents the development of neuropathic pain. Nat. Neurosci 20, 1122–1132. 10.1038/nn.4595. [DOI] [PMC free article] [PubMed] [Google Scholar]
- 51.Frezel N, Platonova E, Voigt FF, Mateos JM, Kastli R, Ziegler U, Karayannis T, Helmchen F, Wildner H, and Zeilhofer HU (2020). In-Depth Characterization of Layer 5 Output Neurons of the Primary Somatosensory Cortex Innervating the Mouse Dorsal Spinal Cord. Cereb. Cortex Commun 1, tgaa052. 10.1093/texcom/tgaa052. [DOI] [PMC free article] [PubMed] [Google Scholar]
- 52.Stowell RD, Sipe GO, Dawes RP, Batchelor HN, Lordy KA, Whitelaw BS, Stoessel MB, Bidlack JM, Brown E, Sur M, and Majewska AK (2019). Noradrenergic signaling in the wakeful state inhibits microglial surveillance and synaptic plasticity in the mouse visual cortex. Nat. Neurosci 22, 1782–1792. 10.1038/s41593-019-0514-0. [DOI] [PMC free article] [PubMed] [Google Scholar]
- 53.Lv Z, Chen L, Chen P, Peng H, Rong Y, Hong W, Zhou Q, Li N, Li B, Paolicelli RC, and Zhan Y (2024). Clearance of beta-amyloid and synapses by the optogenetic depolarization of microglia is complement selective. Neuron 112, 740–754.e7. 10.1016/j.neuron.2023.12.003. [DOI] [PubMed] [Google Scholar]
- 54.Lin JY, Knutsen PM, Muller A, Kleinfeld D, and Tsien RY (2013). ReaChR: a red-shifted variant of channelrhodopsin enables deep transcranial optogenetic excitation. Nat. Neurosci 16, 1499–1508. 10.1038/nn.3502. [DOI] [PMC free article] [PubMed] [Google Scholar]
- 55.Lindner M, Gilhooley MJ, Peirson SN, Hughes S, and Hankins MW (2021). The functional characteristics of optogenetic gene therapy for vision restoration. Cell. Mol. Life Sci 78, 1597–1613. 10.1007/s00018-020-03597-6. [DOI] [PMC free article] [PubMed] [Google Scholar]
- 56.Jung S, Aliberti J, Graemmel P, Sunshine MJ, Kreutzberg GW, Sher A, and Littman DR (2000). Analysis of fractalkine receptor CX(3) CR1 function by targeted deletion and green fluorescent protein reporter gene insertion. Mol. Cell Biol 20, 4106–4114. 10.1128/MCB.20.11.4106-4114.2000. [DOI] [PMC free article] [PubMed] [Google Scholar]
- 57.Hooks BM, Lin JY, Guo C, and Svoboda K (2015). Dual-channel circuit mapping reveals sensorimotor convergence in the primary motor cortex. J. Neurosci 35, 4418–4426. 10.1523/JNEUROSCI.3741-14.2015. [DOI] [PMC free article] [PubMed] [Google Scholar]
- 58.Parkhurst CN, Yang G, Ninan I, Savas JN, Yates JR, Lafaille JJ, Hempstead BL, Littman DR, and Gan WB (2013). Microglia promote learning-dependent synapse formation through brain-derived neurotrophic factor. Cell 155, 1596–1609. 10.1016/j.cell.2013.11.030. [DOI] [PMC free article] [PubMed] [Google Scholar]
- 59.Chaplan SR, Bach FW, Pogrel JW, Chung JM, and Yaksh TL (1994). Quantitative assessment of tactile allodynia in the rat paw. J. Neurosci. Methods 53, 55–63. 10.1016/0165-0270(94)90144-9. [DOI] [PubMed] [Google Scholar]
- 60.Thévenaz P, Ruttimann UE, and Unser M (1998). A pyramid approach to subpixel registration based on intensity. IEEE Trans. Image Process 7, 27–41. 10.1109/83.650848. [DOI] [PubMed] [Google Scholar]
- 61.Gu Z, Gu L, Eils R, Schlesner M, and Brors B (2014). circlize Implements and enhances circular visualization in R. Bioinformatics 30, 2811–2812. 10.1093/bioinformatics/btu393. [DOI] [PubMed] [Google Scholar]
- 62.Wu T, Hu E, Xu S, Chen M, Guo P, Dai Z, Feng T, Zhou L, Tang W, Zhan L, et al. (2021). clusterProfiler 4.0: A universal enrichment tool for interpreting omics data. Innovation 2, 100141. 10.1016/j.xinn.2021.100141. [DOI] [PMC free article] [PubMed] [Google Scholar]
Associated Data
This section collects any data citations, data availability statements, or supplementary materials included in this article.
Supplementary Materials
Data Availability Statement
The proteomics datasets generated in this study have been deposited to the PRIDE (PRIDE: PXD062790) and the MassIVE (MassIVE: MSV000097580) repositories. These datasets will be publicly available upon publication. Accession numbers are also provided in the key resources table.
No original code was generated in this study.
Any additional information required to reanalyze the data reported in this paper is available from the lead contact upon request.
KEY RESOURCES TABLE
| REAGENT or RESOURCE | SOURCE | IDENTIFIER |
|---|---|---|
| Antibodies | ||
| rabbit-anti-Iba1 | Abcam | ab178847; RRID: AB_2832244 |
| goat-anti-Iba1 | Abcam | ab5076; RRID:AB_224402 |
| rabbit-anti-NeuN | Abcam | ab104225; RRID:AB_10711153 |
| mouse-anti-NeuN | Abcam | ab104224; RRID:AB_10711040 |
| rabbit-anti-c-Fos | Cell Signaling Technology | Cat#2250; RRID:AB_10828199 |
| goat anti-rat | Thermo Fisher Scientific | Cat#A-11006; RRID:AB_141373 |
| goat anti-rabbit | Thermo Fisher Scientific | Cat#A-11035; RRID:AB_143051 |
| donkey anti-goat | Thermo Fisher Scientific | Cat#A-11035; RRID:AB_143051 |
| donkey anti-goat | Thermo Fisher Scientific | Cat#A-11058; RRID:AB_142540 |
| goat anti-mouse | Thermo Fisher Scientific | Cat#A-11029; RRID:AB_2534088 |
| Bacterial and virus strains | ||
| AAV9.CaMKII.GCaMP6s.WPRE.SV40 | Addgene | #107790-AAV9 |
| AAV9.hSyn.ATP1.0 (B09) | WZ Bioscience | #YL006001-AV9 |
| Chemicals, peptides, and recombinant proteins | ||
| Tamoxifen | MilliporeSigma | T5648 |
| Fluoromount-G | SouthernBiotech | 0100-20 |
| Sucrose | Thermo scientific | A15583.0E |
| KCl | Sigma | P9333 |
| CaCl2 | Sigma | 21108 |
| MgCl2 | Sigma | M2670 |
| NaHCO3 | Sigma | S5761 |
| NaH2PO4 | Sigma | S8282 |
| glucose | Sigma | G8270 |
| NaCl | Sigma | S7653 |
| NaHCO3 | Sigma | S6014 |
| NaH2PO4 | Sigma | S5011-500G |
| K-Gluconate | Sigma | G4500 |
| HEPES | Sigma | H4034 |
| Mg-ATP | Sigma | A9187 |
| Na2-GTP | Sigma | 51120 |
| phosphocreatine disodium salt hydrate | Sigma | P-7936 |
| 4% paraformaldehyde (PFA)/10% Formaldehyde | Lab Chem | LC146705 |
| PBS | Corning | 21-040-CV; 46-013-CM |
| Dental glue | Ivoclar Vivadent | 27-143 |
| isoflurane | Piramal Critical Care | NDC 66794-017-25 |
| Deposited data | ||
| Proteomics analysis | This paper | PRIDE: PXD062790 MassIVE: MSV000097580 |
| Experimental models: Cell lines | ||
| Mouse: B6.129P2(Cg)-Cx3cr1tm1Litt/J | The Jackson Laboratory | JAX:005582 |
| Mouse: B6.Cg-Gt(ROSA)26Sortm2.2Ksvo/J | The Jackson Laboratory | JAX:026294 |
| Mouse: B6.129P2(Cg)-Cx3cr1tm2.1(cre/ERT2)Litt/WganJ | The Jackson Laboratory | JAX:021160 |
| ImageJ | National Inst. Of Health | http://rsb.info.nih.gov/nih-image/index.html |
| Fiji | National Inst. Of Health | https://imagej.net/software/fiji/downloads |
| pCLAMP | Molecular Device | NA |
| GraphPad Prism 10 | GraphPad | http://www.graphpad.com/ |
| STRING | ||
| Cytoscape software | National Resource for Network Biology | https://cytoscape.org/ |
| Other | ||
| EVOS FL | Thermo Fisher Scientific | AMF4300 |
| Ultrasonic vocalizing (USV) detector | Med Associates | MED-USA-1A-M |
| Four-lane Rotarod apparatus | Med Associates | ROTA-ROD 2 |
| Radiant heat source | IITC Life Science | NA |