

Abstract
Background:
Ductus arteriosus stenting (DAS) is used to palliate infants with ductal-dependent pulmonary blood flow (DD-PBF), however patent ductus arteriosus (PDA) anatomy can be complex and heterogenous. We developed a novel tool to model and quantify PDA anatomy.
Methods:
We retrospectively identified 33 neonates with DD-PBF with a CTA prior to DAS. A novel custom workflow was implemented in 3D Slicer and SlicerHeart to semi-automatically extract centerlines of the course of the PDA and surrounding vessels. 3D ductal length, diameter, curvature and tortuosity were automatically calculated (3D automatic) and compared to manually adjusted 3D measurements (3D semi-automatic), and manual measurements of PDA dimensions in 2D projectional angiograms before and after stent angioplasty.
Results:
Ductal anatomy was successfully modeled and quantified in all subjects. 3D automatic and semi-automatic measurements of straight-line aortic to pulmonary artery length were not significantly different than 2D measurements. Semi-automatic 3D measurements were similar to 2D measurements of the total length. Minimum and maximum ductal diameters were not significantly different by 3D automatic and 2D measurements, however semi-automatic 3D diameters were significantly larger. Inter-reader reliability of ductal length and diameter was higher with manual adjustment of 3D centerlines compared to standard measurement of 2D angiograms. These differences were consistent across PGE doses between CTA and DAS.
Conclusions:
Automatic PDA modeling is feasible and efficient, enabling reproducible quantification of ductal anatomy for procedural planning of DAS in patients with DD-PBF. Further development is needed as well as investigation of whether 3D modeling-derived measurements influence procedural duration or outcome.
Keywords: 3D modeling, PDA stent, Congenital Heart Disease, CT angiography, Quantification
Introduction:
Several retrospective studies have demonstrated that stent angioplasty of the ductus arteriosus (DAS) is an attractive option for initial palliation of neonates with ductal-dependent pulmonary blood flow (DD-PBF), with mounting evidence that it is supplanting surgical shunts 1–7. Patent ductus arteriosus (PDA) anatomy is highly heterogeneous in this patient population, specifically in the angle of origin from the systemic artery, tortuosity, and variation in caliber 8. These variations in anatomy influence patient candidacy, optimal vascular access site and procedural difficulty in DAS.
Cross-sectional imaging, specifically computed tomographic angiography (CTA), has become a mainstay of the assessment of the neonate with DD-PBF due to its perceived potential to inform pre-procedural planning. With experience, interventional cardiologists can interpret imaging data with confidence. However, as use of this technique expands, tools that efficiently translate tomographic datasets into a 3D model have the potential to both improve safety acutely and accelerate the learning curve for these procedures. An ideal system would not only generate an accurate 3D model to aid visualization but also quantify clinically-relevant anatomic dimensions (PDA length and diameters) automatically and quickly, and in a readily accessible way. To date, there are few studies demonstrating use of 3D CT or MR-derived modeling to plan DAS 9,10. To our knowledge, a platform for automatic 3D quantitative analysis of ductal anatomy has not been developed and made available to the interventional cardiology community.
In order to meet this need, we developed custom open-source software designed for the semi-automatic quantification of PDA structure from routine tomographic imaging. We evaluated this novel tool retrospectively in a cohort of infants with DD-PBF, and compared 3D measurements (both automatic and semi-automatic) from the CTA to traditional 2D measurements from projectional angiograms performed during the case.
Materials and Methods:
Study design and population:
We performed a retrospective cohort study of neonates with DD-PBF who underwent DAS at our hospital as initial palliation between January 1, 2014 and October 5, 2020 with a preceding clinically-indicated CTA. We excluded patients with major aortopulmonary collaterals and those who required additional surgical or catheter-based interventions at time of initial palliation. We also excluded potential subjects who underwent DAS for reasons other than providing pulmonary blood flow (e.g., “hybrid” palliation for hypoplastic left heart syndrome or transcatheter ductal Potts shunt for pulmonary hypertension).
Study measures:
Clinical data:
Chart review was performed to abstract patient characteristics, imaging results, intervention history, and DAS procedural details followed by image analysis of pre-procedure CTA and procedural projectional angiography. All available medical records were reviewed, including all follow-up data through October 31, 2020. Collected patient data included age, weight, anatomic diagnosis, risk factors (e.g. prematurity, genetic syndromes, etc) and procedural details including PGE infusion and stents deployed. The study was reviewed and approved by the Children’s Hospital of Philadelphia institutional review board with waiver of the need for informed consent.
Segmentation:
The CTA data were imported as DICOM format into 3D Slicer (http://www.slicer.org), an open-source, NIH-supported image computing platform 11. Segmentation of the CTA was performed using thresholding and smoothed with a median filter ranging from 1–2mm in the Segments module in 3D Slicer. The segmentation was then cropped to a region of interest including the PDA, adjacent aorta and proximal branch pulmonary arteries. Segmentation workflow is demonstrated in the Supplemental Video with step-by-step guide in the Supplemental Protocol.
Quantitative Analysis:
The PDA segmentation was imported into a custom python-coded module in the SlicerHeart extension for 3D Slicer which we named the PDA Quantification module 11,12. The graphical user interface (GUI) guides the user through sequential steps for automatic extraction of vessel centerlines and branching pattern using custom code adapted from Vascular Modeling Toolkit (VMTK) libraries 13. Each step of the workflow is visualized in a GUI and the resulting 3D model can be manipulated and viewed from any perspective. The quantification workflow is summarized in Figure 1 and Supplemental Video. The quantification module outputs the following PDA dimensions: Euclidean length (distance from aortic to pulmonary artery ends of the PDA without overhang into each), total length (aortic to pulmonary artery ends without overhang), diameter (maximum, minimum, mean, interquartile range), tortuosity, curvature and torsion, as previously described and summarized in Figure 2 13. “3D automatic” measurements were directly output by the quantification module using extracted centerlines and segment lengths defined by inscribed spheres in the branching regions 13. Refinement of the lengths of centerlines of vascular segments, specifically adjusting the endpoints of the aortic and pulmonary artery ends of the PDA and refinement of diameter measurements, was performed for all subjects by each of three interventional cardiology fellows (M.G., Y.B.C., A.J.G.) to generate “3D semi-automatic” measurements while blinded to the 3D automatic and 2D measurements. The PDA quantification module calculated duct tortuosity of the 3D model according to the standard method, specifically dividing Euclidean length by total length 13. The vessel centerlines were also used to calculate angles of potential catheter access to the PDA from adjacent vessels (e.g. descending aorta, left common carotid artery, etc) (Figure 3). Commented code for all modeling is available at www.github.com/SlicerHeart and implemented in the SlicerHeart module for 3D Slicer (www.slicer.org) 11,12,14.
Figure 1:
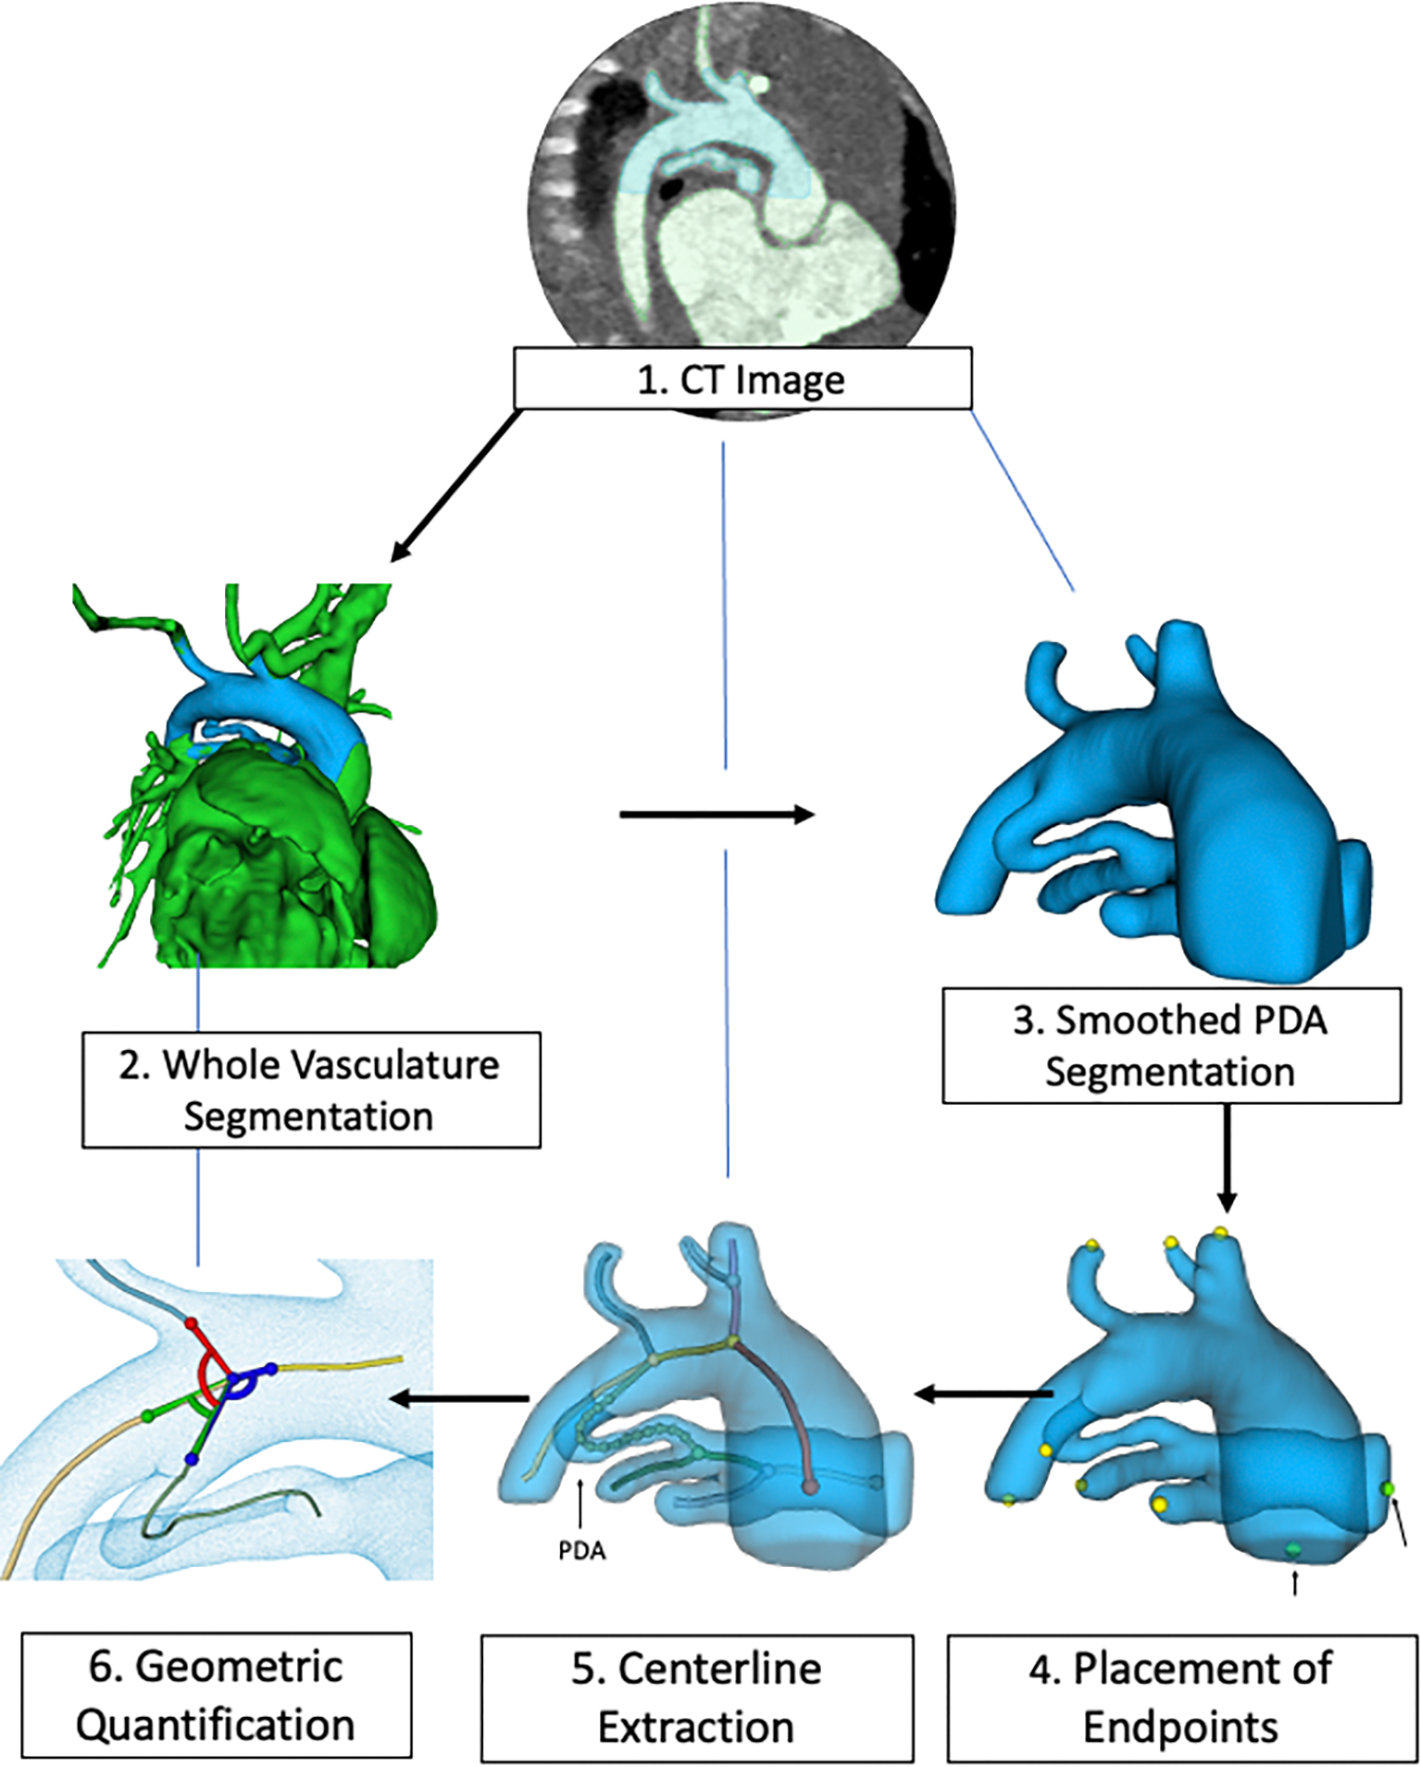
Image processing workflow for a patient with tricuspid atresia using a custom PDA quantification module created for 3D Slicer. (Steps 1, 2) CT angiogram obtained and imported to 3D Slicer to generate a whole vasculature segmentation. (Step 3) The segmentation is smoothed and cropped to visualize the PDA, aorta and pulmonary arteries. (Steps 4–5) The segmentation is imported to the SlicerHeart PDA Quantification module and vessel endpoints are selected to automatically extract the vessel centerlines using the vascular modeling toolkit VMTK). (Step 6) The PDA metrics are quantified and exported.
Figure 2.

PDA quantification metrics reported by the custom-built PDA Quantification module of SlicerHeart. A) Torsion. B) PDA total length. C) Curvature. D) Euclidian length (Aortic to pulmonary artery). E) Minimum (1) and maximum (2) diameters.
Figure 3.

I. Patient with left common carotid artery access. (a) All branch angles on PDA model (b) PDA to descending aorta angle (c) PDA to left common carotid artery (d) PDA to right common carotid artery II. Patient with right common carotid artery access. (a) All branch angles on PDA model (b) PDA to descending aorta (c) PDA to left subclavian artery (d) PDA to transverse aorta
2D projectional angiography and definitions:
Projectional angiograms were performed in a biplane catheterization laboratory with the catheter or sheath positioned near the aortic origin of the duct. For the purposes of the study, angiographic projections were selected that showed the full length of the duct and Euclidean length (straight line from the aortic to pulmonary artery ends of the PDA without overhang), total length (summation of straight line segments along the curvature of the PDA), minimum diameter and maximum diameter were measured. “Minimum stent length” was defined as the combined length of stents placed during DAS subtracting any overhang into the aorta or pulmonary arteries. The PDA morphology was classified as relatively straight (mildly tortuous, Type I), one turn distant from the PA or aortic ends (moderately tortuous, Type II), or complex with multiple turns (severely tortuous, Type III) according to a previously defined scheme 8. Angiographic ductal measurements were made using Siemens Syngo Dynamics software VA40H (Siemens Healthcare, Erlangen, Germany) using auto-calibration. Three interventional cardiology fellows (M.G., Y.B.C., A.J.G.) each independently performed measurements of all 33 subjects while blinded to the CTA and “3D automatic” measurements at the time.
Statistical analysis:
Descriptive statistics were calculated for subject-level demographics and characteristics were calculated as well as for all angiographic measurements. The measurements are presented as median (interquartile range) or mean ± standard deviation for continuous data and percent (n) for categorical data. For comparison of PDA measurements from 3D modeling and projectional angiography, a Friedman’s test (non-parametric two-way ANOVA) was performed with a Nemenyi post-hoc test to compare pairs of measurements. To further assess comparison of PDA measurements, and possible changes in prostaglandin E1 (PGE) dosing, Friedman’s test was performed on two subsamples of patients: Subgroup 1 - patients with no changes in PGE dosing between CTA acquisition and projection angiography (n=19) and Subgroup 2 - patients with changes in PGE dosing (n=14). Inter-reader reliability was calculated with an intraclass-correlation coefficient. Bland-Altman plots were generated to assess for whether systemic error changed along the ranges of PDA lengths and diameters. A Spearman’s coefficient was used to compare continuous variables with categorical data (e.g. 3D semi-automatic calculated tortuosity vs tortuosity classification).
Results
Patient description
A total of 35 patients had pre-procedural CT angiograms. Two patients were excluded for insufficient image quality to generate a three-dimensional segmentation due to motion artifact. 33 subjects underwent DAS for DD-PBF during the study period after obtaining a pre-procedural CTA (Table 1) The majority of patients had pulmonary atresia (73%) with 27% having expected single ventricle physiology and all with confluent pulmonary arteries. The median weight at first intervention was 2.9 kg (IQR 2.3–3.2 kg) with 27% (n=9) born at less than 37 weeks gestational age. 85% (n=28) were on PGE at the time of CTA and DAS procedure when 2D angiograms were performed. 42% (n=14) had a change in PGE dosing between CTA and DAS, typically transient discontinuation of PGE prior to DAS. Of note, two subjects (6%) had a coronary wire through the PDA at time of initial angiogram during DAS. The patients had a range of ductal anatomies, including right aortic arch, various brachiocephalic vessel branching patterns, tortuosity and ductal origins (Figure 4).
Table 1.
Baseline Characteristics of PDA Stent Cohort
| Characteristic | PDA stent (N=33) |
|---|---|
|
| |
| Age at CT angiogram, d | 2 (2–4) |
| Age at first intervention, d | 4 (3–8) |
| Weight at first intervention, kg | 2.8 (2.5–3.4) |
| PGE at CT and DAS | 28/33 (85%) |
| PGE dose change after CT | 5/33 (15%) |
| Anatomic diagnosis | |
|
| |
| Pulmonary atresia – IVS | 5 (15%) |
| Pulmonary atresia – VSD | 18 (55%) |
| Pulmonary stenosis – VSD | 7 (21%) |
| Tricuspid atresia - PS or PA | 3 (9%) |
| Expected 2-ventricle physiology | 24 (73%) |
| Antegrade pulmonary blood flow | 9 (27%) |
| Confluent PAs | 33 (100%) |
| Gestational age, weeks | 38 (36.5–39.2) |
| Prematurity (<37 weeks) | 9 (27%) |
| Birth weight, kg | 2.9 (2.3–3.2) |
| Genetic syndrome | 13 (39%) |
Abbreviations: CT, computerized tomography; PGE, prostaglandin E1; DAS, ductus arteriosus stenting; PDA, patent ductus arteriosus; IVS, intact ventricular septum; VSD, ventricular septal defect; PS, pulmonary stenosis; PA, pulmonary atresia; PAs, pulmonary arteries. Data are presented as count (% of total) or median (25th-75th percentiles).
Figure 4:

Extracted vessel centerlines in four patients with varying aortic arch anatomy. A) Highlighted PDA region with spheres indicating software-defined boundaries of the PDA for centerline extraction. B) Centerlines of left aortic arch with normal branching. C) Left aortic arch with common brachiocephalic trunk. D) Right aortic arch with mirror image branching.
Comparison of 3D Modeling to Angiographic Measurements
Modeling and quantification were applied to 33 patients, with the segmentation and measurement workflow requiring less than 30 minutes. Euclidean straight-line lengths from the aortic to pulmonary ends of the PDA and total lengths incorporating all the curves of the vessel from aortic to pulmonary end were visualized and measured from 2D angiograms and 3D-reconstructions (Figure 5). Systematic differences between measurements from 3D automatic, 3D semi-automatic and 2D methods are detailed in Table 2. There was no statistically significant difference in Euclidean straight-line length between both 3D methods and 2D angiography. Measured total length were similar between 2D and 3D semi-automatic methods while the 3D automatic measurements were significantly shorter. The minimum and maximum PDA diameters were systematically larger by 3D semi-automatic measurement than both 3D automatic and 2D methods, with no significant difference between 3D automatic and 2D measurements. These findings were consistent with subgroup analysis of patients with no change in PGE dose between CTA and DAS (subgroup 1, Table 3) or some change in PGE dose, specifically discontinuation of PGE following CTA in the majority of cases (subgroup 2, Table 3).
Figure 5.

PDA lengths measured in three different modalities for one patient. A) 3D segmentation of CT angiogram data. B) Near-sagittal slice of CT angiogram. C) 2D angiogram from DAS procedure. Euclidean (blue arrow) and total (red arrow) PDA lengths are noted.
Table 2:
Comparison of 2D projectional, 3D semi-automatic and 3D automatic measurements of ductal dimensions. Median lengths (Euclidean and total), minimum and maximum diameters were compared with Friedman’s with Nemenyi post-hoc test with p-value of Table 2a reflecting difference in PDA dimension between all three measurement methods and Table 2b reflecting difference in dimensions between method pairs. Inter-reader reliability for each comparison is calculated as intra-class correlation coefficients (ICC).
| Table 2a. PDA metric comparison by measurement method | ||||||
|---|---|---|---|---|---|---|
| Variable | 2D Manual | 2D Manual ICC | 3D Semi | 3D Semi ICC | 3D Automatic | p-value |
| Euclidean length, mm | 9.1 (7.8–11.4) | 0.82 | 8.2 (6.9–10.2) | 0.96 | 7.2 (6.3–9.2) | 0.103 |
| Total length, mm | 16.8 (12.7–19.0) | 0.86 | 16.5 (12.6–19.7) | 0.98 | 14.9 (9.8–16.6) | <0.001 |
| Minimum diameter, mm | 2.6 (1.9–3.2) | 0.74 | 3.8 (2.8–4.2) | 0.85 | 3.3 (2.3–3.8) | <0.001 |
| Maximum diameter, mm | 4.6 (3.8–5.0) | 0.76 | 5.2 (4.4–5.5) | 0.88 | 4.8 (4.0–5.4) | 0.002 |
| Table 2b. p-values for variable comparison by measurement method | |||
|---|---|---|---|
| Variable | 2D Manual – 3D Semi | 2D Manual – 3D Auto | 3D Semi – 3D Auto |
| Euclidean length | 1.00 | 0.15 | 0.15 |
| Total length | 0.365 | 0.037 | <0.001 |
| Minimum diameter | <0.001 | 1.00 | <0.001 |
| Maximum diameter | 0.003 | 0.741 | 0.026 |
Values listed are Median (IQR)
3D Semi = 3D Semi-automatic
ICC = Intra-class correlation coefficient
3D Semi = 3D Semi-automatic
3D Auto = 3D Automatic
Table 3:
Comparison of 2D projectional, 3D semi-automatic and 3D automatic measurements of ductal dimensions for two subgroups: patients with no PGE dose change between CTA and DAS (Subgroup 1) and patients with a change in PGE dose (Subgroup 2). Median lengths (Euclidean and total), minimum and maximum diameters were compared with Friedman’s with Nemenyi post-hoc test with p-value of Tables 3a and 3c reflecting difference in PDA dimension between all three measurement methods and Tables 3b and 3d reflecting difference in dimensions between method pairs.
| Table 3a. PDA metric comparison of subgroup 1 with no PGE changes between CTA and DAS (N=19) | ||||
|---|---|---|---|---|
| Variable | 2D Manual | 3D Semi | 3D Automatic | p-value |
| Euclidean length, mm | 9.8 (8–11.3) | 8.7 (7.4–10.4) | 7.8 (7.0–9.0) | 0.95 |
| Total length, mm | 17.6 (14.0–19.9) | 18.27 (13.5–19.6) | 15.3 (11.2–16.5) | 0.003 |
| Minimum diameter, mm | 3.1 (2.5–3.3) | 3.8 (3.1–4.1) | 3.3 (2.6–3.7) | <0.001 |
| Maximum diameter, mm | 4.6 (4.3–5.0) | 5.2 (4.8–5.4) | 4.9 (4.4–5.4) | 0.05 |
| Table 3b. p-values for variable comparison by measurement method, Subgroup 1 (N=19) | |||
|---|---|---|---|
| Variable | 2D Manual – 3D Semi | 2D Manual – 3D Auto | 3D Semi – 3D Auto |
| Euclidean length | 0.98 | 0.94 | 0.98 |
| Total length | 0.94 | 0.02 | 0.005 |
| Minimum diameter | <0.001 | 0.98 | <0.001 |
| Maximum diameter | 0.04 | 0.59 | 0.31 |
| Table 3c. PDA metric comparison of subgroup 2 with PGE changes between CTA and DAS (N=14) | ||||
|---|---|---|---|---|
| Variable | 2D Manual | 3D Semi | 3D Automatic | p-value |
| Euclidean length, mm | 8.4 (6.9–11.8) | 8.1 (6.2–9.8) | 6.5 (5.1–9.1) | 0.01 |
| Total length, mm | 15.2 (11.3–18.6) | 15.4 (10.2–20.6) | 11.6 (7.5–17.4) | 0.06 |
| Minimum diameter, mm | 2.0 (1.5–2.6) | 3.7 (2.2–4.4) | 3.1 (1.9–4.2) | 0.01 |
| Maximum diameter, mm | 4.3 (3.4–4.9) | 5.1 (3.6–5.7) | 4.4 (3.4–5.1) | 0.03 |
| Table 3d. p-values for variable comparison by measurement method, Subgroup 2 (N=14) | |||
|---|---|---|---|
| Variable | 2D Manual – 3D Semi | 2D Manual – 3D Auto | 3D Semi – 3D Auto |
| Euclidean length | 0.98 | 0.04 | 0.02 |
| Total length | 0.20 | 0.84 | 0.06 |
| Minimum diameter | 0.02 | 0.98 | 0.04 |
| Maximum diameter | 0.06 | 0.99 | 0.06 |
Subgroup 1 = Patients with no PGE changes between CTA and DAS
Subgroup 2 = Patients with PGE dose changes between CTA and DAS
Values listed are Median (IQR)
3D Semi = 3D Semi-automatic
3D Auto = 3D Automatic
The 2D and 3D semi-automatic measurements were generated by three readers for all subjects and the inter-reader reliability expressed as intra-class coefficient was higher using the 3D models than 2D angiograms for all four measured dimensions (Table 2).
Bland-Altman plots (Supplemental Figure 1) comparing the total length, Euclidean length, minimum and maximum diameters demonstrated agreement across the range of lengths and diameters for all three measurement methods. There were mean biases consistent with the median differences. There was not evidence of systematic bias at particular lengths or diameters.
Pre-procedure measurements compared to “minimum stent length”
The “minimum stent length” for each subject was determined retrospectively following DAS by measuring the combined length of one or more ductal stents on 2D angiography and subtracting any overhang into the pulmonary arteries or aorta. The “minimum stent length” was typically a value between the Euclidean and total lengths measured by 2D manual, 3D semi-automatic and 3D automatic methods (Figure 6).
Figure 6:

Plot of 33 subjects comparing “minimum stented length” (gray) measured by post-DAS 2D angiography to Euclidean (blue) and total PDA lengths (orange) measured by 2D angiography, 3D semi-automatic or 3D automatic method.
Assessment of Tortuosity
Ductal tortuosity was subjectively categorized by 2D projectional angiography and compared to tortuosity index calculated using 3D semi-automatic Euclidean and total lengths. By projectional angiography, there were four patients with type I tortuosity, eight patients with type II, and twenty-one patients with severely tortuous type III (Supplemental Figure 2). There was a trend towards greater semi-automatically calculated tortuosity index with higher, qualitative tortuosity type, however the correlation was not statistically significant (p=0.38).
Discussion:
We report a retrospective, single-center study describing the development of a novel semi-automatic modeling tool for visualization of CTA-derived images and 3D quantification of PDA metrics to inform procedural planning of DAS. We demonstrate that 3D semi-automatic measurements of total and straight-line PDA lengths were statistically equivalent to 2D measurements, but with higher inter-reader reliability. Fully automatic 3D measurements were consistently shorter than 2D manual measurements for total length but similar for straight-line length and diameters. Retrospectively determined “minimum stent length” fell between the straight-line and total lengths using 2D and 3D semi-automatic measurements in the majority of cases.
DAS to secure DD-PBF remains a technically challenging procedure, with numerous anatomic features affecting procedural success and rate of re-intervention 8,15–22. For example, patients with more tortuous ducts (Type II and III) have a higher rate of jailing the pulmonary artery and unplanned reintervention than Type I 8. Ductal curvature is also related to increased discrepancy in stented length and measured ductal length 8. Further, measurements of ductal length are critical for appropriate stent selection during DAS to maintain ductal patency. The consequences of under-sizing the stent length are severe include pulmonary artery coarctation or ductal constriction, which can manifest as cyanosis or pulmonary artery hypoplasia. Ductal tissue can extend to the proximal pulmonary artery, increasing the risk of pulmonary artery isolation following DAS. The PDA lengths measured in this study defined the PA end as ductal insertion to the pulmonary artery, however an area of future work is identifying patients with additional ductal tissue further along the proximal pulmonary artery. Further, the dynamics of ductal compliance and deformation are complex, with recent work demonstrating the effect that stent placement has on ductal length curvature 23. As such, determination of patient candidacy remains challenging, especially for centers earlier in their DAS experience3,6,24.
Given the complexity of PDA anatomy, pre-procedural CTA imaging is commonly performed to inform patient candidacy. A correlation between measurements of ductal dimensions by 2D projectional angiography and CTA imaging has been reported 9. Similarly, Chamberlain and colleagues demonstrated the use of 3D modeling to exclude patients from the procedure and inform access strategy 10. The 3D models also provide the operator an opportunity to visualize the ductal anatomy from multiple perspectives, potentially improving camera angle selection and visualization during the ductal stenting procedure. Their work demonstrated the feasibility of pre-procedural 3D modeling to guide technical decision-making. However, prior to this work there was no readily-available, automatic, and unbiased method for quantifying and reproducibly comparing 3D image-derived ductal anatomy. Since development of this modeling workflow, our group has utilized SlicerHeart with the PDA Quantification module as part of regular clinical practice to visualize and measure ductal dimensions prior to DAS. The models are distributed among proceduralists, fellows and imaging faculty to discuss access strategy, guide wire position and stent selection. The effects of pre-procedural modeling on clinical outcomes including case time and rates of complications are being evaluated.
We sought to meet this need and created a custom workflow which we have now released in our SlicerHeart extension in 3D Slicer 11,12,25. This module, and the surrounding 3D Slicer framework allows rapid visualization and modeling of complex anatomy, followed by semi-automatic quantification. Manual refinement of the 3D model centerlines by adjusting the aortic and pulmonary artery ends of the PDA while viewing the vessels from multiple viewpoints allowed for significantly higher inter-reader reliability. Measurement of 2D angiograms is limited by viewing the duct, aorta and pulmonary arteries in a maximum of two planes with double densities from overlapping vessels. While this may lead to foreshortening of the PDA in any one particular viewing angle, it also necessitates assumptions be made about the location of the vessel centerline, aortic end and pulmonary artery end. These assumptions manifest as lower inter-reader reliability for each of the four PDA dimensions measured in 2D in our study.
The open-source nature of the platform promotes further customization of this platform to catalyze collaborative development and application. Notably, DAS is currently being evaluated in the Pediatric Heart Network-supported COMPASS trial (Comparison of Methods of Pulmonary Blood Flow Augmentation in Neonates: Shunt versus Stent, NCT05268094) with each study subject obtaining cross-sectional imaging (either CTA or MRI) for assessment of PDA anatomy prior to randomization.
We acknowledge several limitations with this study. The retrospective review of this cohort selects for patients who later underwent ductal stenting, therefore patients with anatomy deemed unsuitable for PDA stent placement were excluded from analysis and modeling. The PDA is a dynamic, three-dimensional structure that changes size and conformation with PGE dose changes, however subgroup analysis did not demonstrate significant differences in measurements by each method amongst patients with or without PGE dose changes between DAS and CTA. The ductus also changes conformation once stiff wires or catheters are introduced, therefore the measured length on a CTA-derived model may differ from vessel length once the duct is instrumented. This was the case in two subjects whose initial angiograms already had a wire in the PDA. Fully automatic 3D measurements leveraged inscribed spheres which procedurally generated shorter segments than the “clinically measured” length. As such, while centerline extraction, branching, and quantification was almost fully automatic, manual refinement of the centerline endpoints was required to appropriately demarcate the aortic and pulmonary ends of the PDA. This creates an opportunity for human error or bias, however the visualization of the PDA in multiple planes and the relatively minor adjustments required to the PDA centerline improved reliability of the 3D measurements compared to 2D angiography. Similarly, manual measurement of CTA images has advantages to projectional angiography, however by utilizing an automated system for centerline extraction and visualizing the PDA in three dimensions, manual refinement of the 3D automatic measurements may help to minimize opportunities for human error in an entirely manual approach. In the future, refinement of the fully automatic approach may alleviate this need. Given the clinical consequences of stent undersizing, the manually-refined 3D measurements provide an estimation of a “minimum stent length,” however a larger stent with overhang into the pulmonary artery and aorta is necessary. The aim of this work is to provide a platform for visualizing and measuring ductal anatomy to inform procedural decision-making in conjunction with other image analysis and operator experience. By measuring a “minimum stent length” prior to the procedure, preparations such as having appropriate stents available in case of ductal spasm can aid with technical success. Finally, segmentation and labeling of the relevant vasculature was semi-automatic. In the future, machine learning may enable full automation of this process26.
Conclusion
Despite the limitations, we conclude that semi-automatic quantification of PDA anatomy enables patient-specific planning of DAS in the structurally heterogeneous population. Future research will validate these findings prospectively and evaluate the potential clinical benefit of 3D modeling.
Supplementary Material
Supplemental Video: Demonstration of PDA segmentation from CT angiogram DICOM and PDA quantification using custom 3D Slicer module.
Supplemental Protocol 1: Guide for implementing PDA segmentation and quantification workflow in 3D Slicer
Supplemental Figure 2: Distribution of tortuosity index quantified from 3D semi-automatic measurements ductal tortuosity type. Box plot graph demonstrating distribution of tortuosity type determined by projectional angiography (x-axis) by 3D semi-automatic tortuosity index (y-axis, expressed as inverse of tortuosity).
Supplemental Figure 1: Bland-Altman plots comparing projectional angiography, semi-automatic 3D and automatic 3D measurements of ductal Euclidean length, total length, maximum diameter and minimum diameter.
Acknowledgements:
This work was supported by NIH R01HL153166, an Additional Ventures Expansion Award, Additional Ventures Single Ventricle Research Fund, The Topolewski Endowed Chair at the Children’s Hospital of Philadelphia, T32 HL0097915, CHOP Cardiac Center Research Grant.
Abbreviations:
- PDA
Patent ductus arteriosus
- CTA
Computerized tomographic angiography
- DD-PBF
Ductal dependent pulmonary blood flow
- DAS
Ductus arteriosus stenting
- PGE
Prostaglandin E1
Footnotes
Conflicts of Interest Statement
No relevant conflicts of interest to disclose.
References:
- 1.Glatz AC, Petit CJ, Goldstein BH, et al. Comparison Between Patent Ductus Arteriosus Stent and Modified Blalock-Taussig Shunt as Palliation for Infants With Ductal-Dependent Pulmonary Blood Flow: Insights From the Congenital Catheterization Research Collaborative. Circulation 2018;137(6):589–601. DOI: 10.1161/CIRCULATIONAHA.117.029987. [DOI] [PubMed] [Google Scholar]
- 2.Boucek DM, Qureshi AM, Goldstein BH, Petit CJ, Glatz AC. Blalock-Taussig shunt versus patent ductus arteriosus stent as first palliation for ductal-dependent pulmonary circulation lesions: A review of the literature. Congenit Heart Dis 2019;14(1):105–109. DOI: 10.1111/chd.12707. [DOI] [PubMed] [Google Scholar]
- 3.Bauser-Heaton H, Price K, Weber R, El-Said H. Stenting of the Patent Ductus Arteriosus: A Meta-analysis and Literature Review. Journal of the Society for Cardiovascular Angiography & Interventions 2022:100392. DOI: 10.1016/j.jscai.2022.100392. [DOI] [PMC free article] [PubMed] [Google Scholar]
- 4.Bentham JR, Zava NK, Harrison WJ, et al. Duct Stenting Versus Modified Blalock-Taussig Shunt in Neonates With Duct-Dependent Pulmonary Blood Flow: Associations With Clinical Outcomes in a Multicenter National Study. Circulation 2018;137(6):581–588. DOI: 10.1161/CIRCULATIONAHA.117.028972. [DOI] [PubMed] [Google Scholar]
- 5.Lemley BA, Wu L, Roberts AL, et al. Trends in Ductus Arteriosus Stent Versus Blalock-Taussig-Thomas Shunt Use and Comparison of Cost, Length of Stay, and Short-Term Outcomes in Neonates With Ductal-Dependent Pulmonary Blood Flow: An Observational Study Using the Pediatric Health Information Systems Database. J Am Heart Assoc 2023;12(23):e030575. DOI: 10.1161/JAHA.123.030575. [DOI] [PMC free article] [PubMed] [Google Scholar]
- 6.Ratnayaka K, Nageotte SJ, Moore JW, et al. Patent Ductus Arteriosus Stenting for All Ductal-Dependent Cyanotic Infants: Waning Use of Blalock-Taussig Shunts. Circ Cardiovasc Interv 2021;14(3):e009520. DOI: 10.1161/CIRCINTERVENTIONS.120.009520. [DOI] [PubMed] [Google Scholar]
- 7.Gibbs JL, Rothman MT, Rees MR, Parsons JM, Blackburn ME, Ruiz CE. Stenting of the arterial duct: a new approach to palliation for pulmonary atresia. Br Heart J 1992;67(3):240–5. DOI: 10.1136/hrt.67.3.240. [DOI] [PMC free article] [PubMed] [Google Scholar]
- 8.Qureshi AM, Goldstein BH, Glatz AC, et al. Classification scheme for ductal morphology in cyanotic patients with ductal dependent pulmonary blood flow and association with outcomes of patent ductus arteriosus stenting. Catheter Cardiovasc Interv 2019;93(5):933–943. DOI: 10.1002/ccd.28125. [DOI] [PubMed] [Google Scholar]
- 9.Jadhav SP, Aggarwal V, Masand PM, Diaz E, Zhang W, Qureshi AM. Correlation of ductus arteriosus length and morphology between computed tomographic angiography and catheter angiography and their relation to ductal stent length. Pediatr Radiol 2020;50(6):800–809. DOI: 10.1007/s00247-020-04624-1. [DOI] [PubMed] [Google Scholar]
- 10.Chamberlain RC, Ezekian JE, Sturgeon GM, Barker PCA, Hill KD, Fleming GA. Preprocedural three-dimensional planning aids in transcatheter ductal stent placement: A single-center experience. Catheter Cardiovasc Interv 2020;95(6):1141–1148. DOI: 10.1002/ccd.28669. [DOI] [PMC free article] [PubMed] [Google Scholar]
- 11.Fedorov A, Beichel R, Kalpathy-Cramer J, et al. 3D Slicer as an image computing platform for the Quantitative Imaging Network. Magn Reson Imaging 2012;30(9):1323–41. DOI: 10.1016/j.mri.2012.05.001. [DOI] [PMC free article] [PubMed] [Google Scholar]
- 12.Lasso A, Herz C, Nam H, et al. SlicerHeart: An open-source computing platform for cardiac image analysis and modeling. Front Cardiovasc Med 2022;9:886549. DOI: 10.3389/fcvm.2022.886549. [DOI] [PMC free article] [PubMed] [Google Scholar]
- 13.Piccinelli M, Veneziani A, Steinman DA, Remuzzi A, Antiga L. A framework for geometric analysis of vascular structures: application to cerebral aneurysms. IEEE Trans Med Imaging 2009;28(8):1141–55. DOI: 10.1109/TMI.2009.2021652. [DOI] [PubMed] [Google Scholar]
- 14.Jolley MA, Lasso A, Nam HH, et al. Toward predictive modeling of catheter-based pulmonary valve replacement into native right ventricular outflow tracts. Catheter Cardiovasc Interv 2019;93(3):E143–E152. DOI: 10.1002/ccd.27962. [DOI] [PMC free article] [PubMed] [Google Scholar]
- 15.Rosenthal E, Qureshi SA, Tabatabaie AH, et al. Medium-term results of experimental stent implantation into the ductus arteriosus. Am Heart J 1996;132(3):657–63. DOI: 10.1016/s0002-8703(96)90252-5. [DOI] [PubMed] [Google Scholar]
- 16.Alwi M, Choo KK, Latiff HA, Kandavello G, Samion H, Mulyadi MD. Initial results and medium-term follow-up of stent implantation of patent ductus arteriosus in duct-dependent pulmonary circulation. J Am Coll Cardiol 2004;44(2):438–45. DOI: 10.1016/j.jacc.2004.03.066. [DOI] [PubMed] [Google Scholar]
- 17.Michel-Behnke I, Akintuerk H, Thul J, Bauer J, Hagel KJ, Schranz D. Stent implantation in the ductus arteriosus for pulmonary blood supply in congenital heart disease. Catheter Cardiovasc Interv 2004;61(2):242–52. DOI: 10.1002/ccd.10766. [DOI] [PubMed] [Google Scholar]
- 18.Santoro G, Gaio G, Giugno L, et al. Ten-years, single-center experience with arterial duct stenting in duct-dependent pulmonary circulation: early results, learning-curve changes, and mid-term outcome. Catheter Cardiovasc Interv 2015;86(2):249–57. DOI: 10.1002/ccd.25949. [DOI] [PubMed] [Google Scholar]
- 19.Aggarwal V, Petit CJ, Glatz AC, Goldstein BH, Qureshi AM. Stenting of the ductus arteriosus for ductal-dependent pulmonary blood flow-current techniques and procedural considerations. Congenit Heart Dis 2019;14(1):110–115. DOI: 10.1111/chd.12709. [DOI] [PubMed] [Google Scholar]
- 20.Onalan MA, Odemis E, Saygi M, et al. Early and midterm results of ductal stent implantation in neonates with ductal-dependent pulmonary circulation: a single-centre experience. Cardiol Young 2020;30(12):1772–1782. DOI: 10.1017/S104795112000267X. [DOI] [PubMed] [Google Scholar]
- 21.Shahanavaz S, Qureshi AM, Petit CJ, et al. Factors Influencing Reintervention Following Ductal Artery Stent Implantation for Ductal-Dependent Pulmonary Blood Flow: Results From the Congenital Cardiac Research Collaborative. Circ Cardiovasc Interv 2021;14(12):e010086. DOI: 10.1161/CIRCINTERVENTIONS.120.010086. [DOI] [PubMed] [Google Scholar]
- 22.Price K, Ryan JR, El-Said H. Stenting of the Patent Ductus Arteriosus. Interv Cardiol Clin 2024;13(3):421–430. DOI: 10.1016/j.iccl.2024.02.002. [DOI] [PubMed] [Google Scholar]
- 23.Cheng CP, Bondesson J, Hegde S, Acuero MT, El-Said HG. Impact of Stenting on PDA Length, Curvature, and Pulsatile Deformations Based on CT Assessment. Journal of the Society for Cardiovascular Angiography & Interventions 2023;2(6):101134. DOI: 10.1016/j.jscai.2023.101134. [DOI] [PMC free article] [PubMed] [Google Scholar]
- 24.Bahaidarah S, Al-Ata J, Alkhushi N, et al. Outcome of ductus arteriosus stenting including vertical tubular and convoluted tortuous ducts with emphasis on technical considerations. Egypt Heart J 2021;73(1):83. DOI: 10.1186/s43044-021-00210-4. [DOI] [PMC free article] [PubMed] [Google Scholar]
- 25.Scanlan AB, Nguyen AV, Ilina A, et al. Comparison of 3D Echocardiogram-Derived 3D Printed Valve Models to Molded Models for Simulated Repair of Pediatric Atrioventricular Valves. Pediatr Cardiol 2018;39(3):538–547. DOI: 10.1007/s00246-017-1785-4. [DOI] [PMC free article] [PubMed] [Google Scholar]
- 26.Herz C, Pace DF, Nam HH, et al. Segmentation of Tricuspid Valve Leaflets From Transthoracic 3D Echocardiograms of Children With Hypoplastic Left Heart Syndrome Using Deep Learning. Front Cardiovasc Med 2021;8:735587. DOI: 10.3389/fcvm.2021.735587. [DOI] [PMC free article] [PubMed] [Google Scholar]
Associated Data
This section collects any data citations, data availability statements, or supplementary materials included in this article.
Supplementary Materials
Supplemental Video: Demonstration of PDA segmentation from CT angiogram DICOM and PDA quantification using custom 3D Slicer module.
Supplemental Protocol 1: Guide for implementing PDA segmentation and quantification workflow in 3D Slicer
Supplemental Figure 2: Distribution of tortuosity index quantified from 3D semi-automatic measurements ductal tortuosity type. Box plot graph demonstrating distribution of tortuosity type determined by projectional angiography (x-axis) by 3D semi-automatic tortuosity index (y-axis, expressed as inverse of tortuosity).
Supplemental Figure 1: Bland-Altman plots comparing projectional angiography, semi-automatic 3D and automatic 3D measurements of ductal Euclidean length, total length, maximum diameter and minimum diameter.