

Abstract
Background
Bone cancer exhibits significant global disparities in incidence and mortality. Understanding these trends is essential for identifying high-risk populations and informing targeted interventions.
Methods
Using data from the Global Burden of Disease Study 2021 (GBD 2021) and the Cancer Incidence in Five Continents (CI5) database, this study analyzed bone cancer incidence (1993–2017) and mortality (1980–2021) trends. Age-standardized incidence rates (ASRs, per 100,000) and mortality rates were assessed across regions, countries, income levels, and health systems, focusing on gender differences and healthcare capacity.
Results
Bone cancer ASRs (1993–2017) ranged from 0.53 to 2.72 for females (China: Yunmeng County, 2.72 [2.16–3.28]) and 0.90–4.28 for males (China: Xiangfu District, 4.28 [3.25–5.31], p < 0.0001), with minimal rates near zero like Brazil: Jau and USA: Hawaii Chinese. Mortality rates (1980–2021) peaked in Eastern Europe and Central Asia, with male rates up to 2.90 (Romania, 2.90 [1.89–3.90], 1980) and female rates up to 2.34 (Greece, 2.34 [2.11–2.58], 1980), while high-income regions like Western Europe declined to 0.84 (males, 0.84 [0.76–0.90], 2021). By 2021, Upper Middle-Income countries (1.26 [0.85–1.62] for males) and Basic Health Systems (1.27 [0.85–1.59] for males) showed rising mortality, surpassing Advanced Health Systems (0.76 [0.71–0.81] for males), reflecting healthcare disparities. Thailand (males, 2.06 [1.18–3.01], 2021) and China saw increasing rates, unlike stable low rates in the USA (males, 0.71 [0.67–0.74], 2021).
Conclusions
Bone cancer incidence and mortality are heavily influenced by healthcare system capacity and socioeconomic factors.
Supplementary Information
The online version contains supplementary material available at 10.1007/s12672-025-02917-1.
Keywords: Chondrosarcoma, Global burden, Healthcare infrastructure, Osteosarcoma, Regional health disparities
Introduction
Bone cancer refers to a group rare but life-threatening malignant tumors that lead to significant morbidity and mortality, particularly in children and adolescents [1–3]. Malignant bone tumors account for approximately 6% of all childhood cancers, with an annual incidence of about 8.7 per million children under age 20 in the United States. This translates to 650–700 new cases per year, including around 400 cases of osteosarcoma and 200 cases of Ewing’s sarcoma [4]. In children aged 0–14 years in Europe, the age-standardized incidence rate for malignant bone tumors is approximately 5.5–5.6 per million, with osteosarcoma and Ewing’s sarcoma being the most common subtypes [5]. The incidence in children under 15 years was 5.5 per million, with osteosarcoma (2.8) and Ewing sarcoma (2.6) making up the majority. There was a slight annual increase of 0.7% in incidence over time [6]. Among children (0–14 years), the median incidence rate was 5.74 cases per million, with osteosarcoma showing the highest rates in older age groups (15–19 years) [7]. Osteosarcoma incidence increases with age during childhood and adolescence, with young males having a higher incidence than females.
Certain inherited conditions, such as hereditary retinoblastoma, significantly increase the risk of developing bone cancer [8, 9]. In the context of other cancers, such as breast or lung cancer, bone metastases are a notable risk factor for developing skeletal-related events, which can contribute to the severity of bone cancer [10–12]. The risk of bone cancer increased linearly with the cumulative dose of alkylating agents (P = 0.04, one-tailed test), suggesting a dose-response relationship; however, this association does not definitively prove causation due to potential confounding factors and the observational nature of the study [13]. Global studies on bone cancer incidence reveal significant geographic and demographic variations in age-standardized incidence rates (ASRs), influenced by environmental factors, genetic predispositions, and prior therapeutic exposures like radiation and chemotherapy [14, 15]. Research indicates that osteosarcoma (OS), Ewing sarcoma (ES), and chondrosarcoma (CS) exhibit distinct patterns, with ASRs ranging from 0.8 to 1.2 per 100,000 in men and 0.5–1.0 in women, varying by region and subtype [16, 17]. Population aging is expected to increase bone cancer cases by 2035, particularly in regions like China, the Middle East, and Northern Africa [17]. In children and adolescents, bone cancer accounts for 3.31% of cancer discharges in China [18] with high incidence reported in the USA [19]and it ranks as a leading cause of cancer mortality among Australian youth [20]. Incidence is rising among young adults in Canada [21] with OS—predominant in youth—showing higher rates in males and among Black and Hispanic children (Ottaviani & Jaffe, 2009; Ward et al., 2014) [22, 23].
OS often invades critical tissues like the lung, ES is an aggressive sarcoma common in youth, and CS arises in cartilage, typically requiring surgery [24–26]. Using Cancer Incidence in Five Continents (CI5) data from 1993 to 2017, this study analyzes global bone cancer trends, focusing on China due to its vast population and environmental challenges. We examine city-level ASRs from the top 20 cities worldwide to identify localized risk factors and inform targeted interventions. Our hypothesis is that environmental and genetic interactions drive significant variations in bone cancer incidence across global urban centers, with a novel approach using city-level ASRs to uncover regional epidemiological patterns and enhance prevention strategies. This study also focuses on China due to its vast population and significant environmental contamination, factors that amplify bone cancer incidence trends compared to global averages. While regions like Italy and Malawi also exhibit high ASRs, China’s unique combination of demographic scale and industrial pollution offers critical insights into the interplay of environmental and genetic drivers, distinguishing it as a priority for detailed epidemiological analysis.
Methods
Study design
This study employed a population-based approach to investigate global bone cancer incidence and mortality trends from 1993 to 2021, focusing on geographic, gender, and socioeconomic disparities across diverse populations. The design aimed to assess variations in age-standardized incidence rates (ASRs) for males and females, emphasizing regional, income-level, and health system differences over time. Incidence analysis targeted high- and low-incidence regions, with a specific focus on identifying areas with extreme ASR values worldwide. Mortality analysis examined rates across global regions, World Bank income levels, health system capacities, and selected countries to uncover epidemiological patterns linked to healthcare access and environmental factors. The study spanned 1993–2017 for incidence and 1980–2021 for mortality to capture long-term trends, enabling the identification of risk factors and informing public health strategies across varied healthcare contexts.
Data sources and data analysis
The bone cancer (ICD-10 C40, C41, C40 stands for malignant neoplasm of bone and articular cartilage of limbs, and C41 stands for malignant neoplasm of bone and articular cartilage of undefined sites) data for ASRs per 100,000 persons and cumulative (0–74) incidence (percent) were collected from the Cancer Incidence in Five Continents (CI5) series. Volumes VIII–XII (1993–2017), were published by the International Agency for Research on Cancer (IARC Scientific Publications, Lyon, France), covering 7 registries in 1993–1997, 16 in 2008–2012, and 455 registries across 588 populations in 70 countries by 2013–2017 [28–32]. ASRs per 100,000 persons were standardized using the WHO World Standard Population for comparability [33] while cumulative incidence (0–74 years, percent) reflects lifetime risk.
IARC ensures the reliability and comparability of the cancer incidence in CI5 dataset through a multifaceted quality control approach. IARC standardizes data collection by enforcing uniform reporting practices aligned with ICD-10 and Cancer Registration standards (https://publications.iarc.who.int › download), while also providing training to registry staff globally to enhance consistency [34]. Data validation involves rigorous verification of registry submissions, including case counts and population denominators, alongside internal checks using statistical methods to detect inconsistencies [35−38]. Completeness is assessed through histological verification rates and population coverage evaluations, with low-coverage or incomplete registries potentially excluded to maintain dataset integrity [39–42]. IARC classifies registries into high, moderate, or low quality based on case ascertainment, reporting consistency, and coverage, regularly updating these classifications as new data emerges [43]. Additionally, age-standardization with the WHO World Standard Population and harmonization of reporting periods ensure comparability across diverse demographics and timeframes, minimizing biases [36, 44]. Together, these efforts produce a robust, globally comparable cancer incidence dataset despite varying regional data quality.
Mortality data were obtained from the Global Burden of Disease Study 2021 (GBD 2021), provided by the Institute for Health Metrics and Evaluation (IHME, Seattle, USA; https://vizhub.healthdata.org/gbd-results/), spanning 1980–2021 and categorized by Global Regions, Income Levels (World Bank), Health System Grouping Levels (Advanced to Limited), Health Regions (WHO regions), and Country-Specific Categories. Data collection adhered to the Declaration of Helsinki [45]. Incidence analysis involved calculating ASRs and cumulative incidence for registered populations, with bar graphs of the top 20 cities’ ASRs generated.
The WHO’s methods directly address this concern by employing standardized data collection, rigorous validation, and harmonization techniques to ensure comparability despite varying healthcare infrastructures (https://www.who.int/docs/default-source/gho-documents/global-health-estimates/ghe2019_daly-methods.pdf?utm_source=chatgpt.com). For instance, the use of DisMod-MR 2.1 and envelope prevalences corrects for missing or inconsistent data, while age-standardization and comorbidity adjustments enable fair comparisons across regions. Uncertainty quantification further acknowledges limitations in data from less-developed countries, ensuring that regional variations are interpreted with an understanding of potential data quality constraints. These efforts collectively enhance the reliability of the Global Burden of Disease estimates, allowing for robust analysis of how healthcare infrastructure impacts treatment outcomes globally. By integrating these quality control measures, the WHO ensures that its estimates are as accurate and comparable as possible, addressing the comment’s concern about data quality variations and providing a solid foundation for understanding global health disparities.
Statistical analysis
Statistical analyses were performed using Python (version 3.9). To assess the distributional properties of bone cancer data, age-specific rates (per 100,000 persons) were stratified into groups (e.g., 70–74, 75–79, 80–84, 85–89, 90–94, and aggregated 70+, 75+, 80+, 85 + years) and evaluated for normality using Q-Q plots and the Shapiro-Wilk test, with significance set at p < 0.05. Tests were conducted separately for males and females to identify deviations from normality, with results reported as p-values. For incidence data, ASRs per 100,000 were calculated, and geographic variation was assessed using one-way ANOVA to compare rates across regions, with F-statistics and p-values reported (significance at p < 0.05). Gender differences were evaluated descriptively by comparing male and female ASRs across time periods (1993–2017). High and low ASRs were ranked to identify extreme values by region and period. For mortality data, rates per 100,000 were analyzed descriptively across time points (1980–2021), regions, income levels, health systems, and countries. Regional, income-level, and health system differences were tested using one-way ANOVA, with p-values reported to assess significance (p < 0.05). Gender differences were evaluated descriptively within each category, comparing male and female rates over time. Temporal trends were assessed by calculating rate changes between time points, with variations linked to income and health system quality through narrative analysis. Confidence intervals (95%) were provided for all rates to quantify uncertainty, reflecting GBD 2021’s estimation methods.
Results
Figures 1, 2, 3, 4, 5 and 6 collectively provide a visualization of global bone cancer (ICD-10 C40, C41) incidence and mortality trends from 1980 to 2021, offering nuanced insights into geographic, socioeconomic, and health system disparities. Figure 1 delineates age-standardized incidence rates (ASRs) per 100,000 for males and females from 1993 to 2017, with panels A–D ranking the top and bottom 20 demographic groups by gender, highlighting significant variation in disease burden across populations. Figure 2, comprising subfigures A–R, tracks global bone cancer mortality rates per 100,000 across nine time points (1980–2021), with paired male and female data revealing temporal declines in high-income settings and persistent burdens elsewhere. Figure 3 (A–R) maps mortality rates across 30 geographic regions, sourced from the Global Burden of Disease Study 2021 (GBD 2021), illustrating gender-specific trends and regional disparities over four decades. Similarly, Fig. 4 (A–R) employs bar plots to depict mortality by World Bank income levels, underscoring higher rates in lower-income groups and declines in wealthier nations, reflective of healthcare access inequities. Figure 5 (A–R) focuses on 20 countries, detailing country-specific mortality trajectories, while Fig. 6 (A–R) examines rates by health system capacity, emphasizing the role of advanced diagnostics and treatment in reducing mortality. Together, these figures, grounded in robust GBD 2021 data, elucidate the complex interplay of gender, geography, income, and health infrastructure in shaping bone cancer outcomes, providing a critical foundation for targeted public health interventions.
Fig. 1.


Global age-standardized incidence rates (ASRs) per 100,000 for bone cancer (ICD-10 C40, C41) among males and females from 1993 to 2017. It is divided into four panels: A, the 20 demographic groups with the highest ASRs for females. B, the 20 groups with the lowest ASRs for females. C, the 20 groups with the highest ASRs for males. D, the 20 groups with the lowest ASRs for males
Fig. 2.

Global map of bone mortality rates (per 100,000) for males and females from 1980 to 2021, across nine specific years: 1980, 1985, 1990, 1995, 2000, 2005, 2010, 2015, and 2021. It comprises 18 subfigures (2 A–2R), with each pair representing male and female rates for a given year: 2 A and 2B for 1980, 2 C and 2D for 1985, 2E and 2 F for 1990, 2G and 2 H for 1995, 2I and 2 J for 2000, 2 K and 2 L for 2005, 2 M and 2 N for 2010, 2O and 2P for 2015, and 2Q and 2R for 2021
Fig. 3.
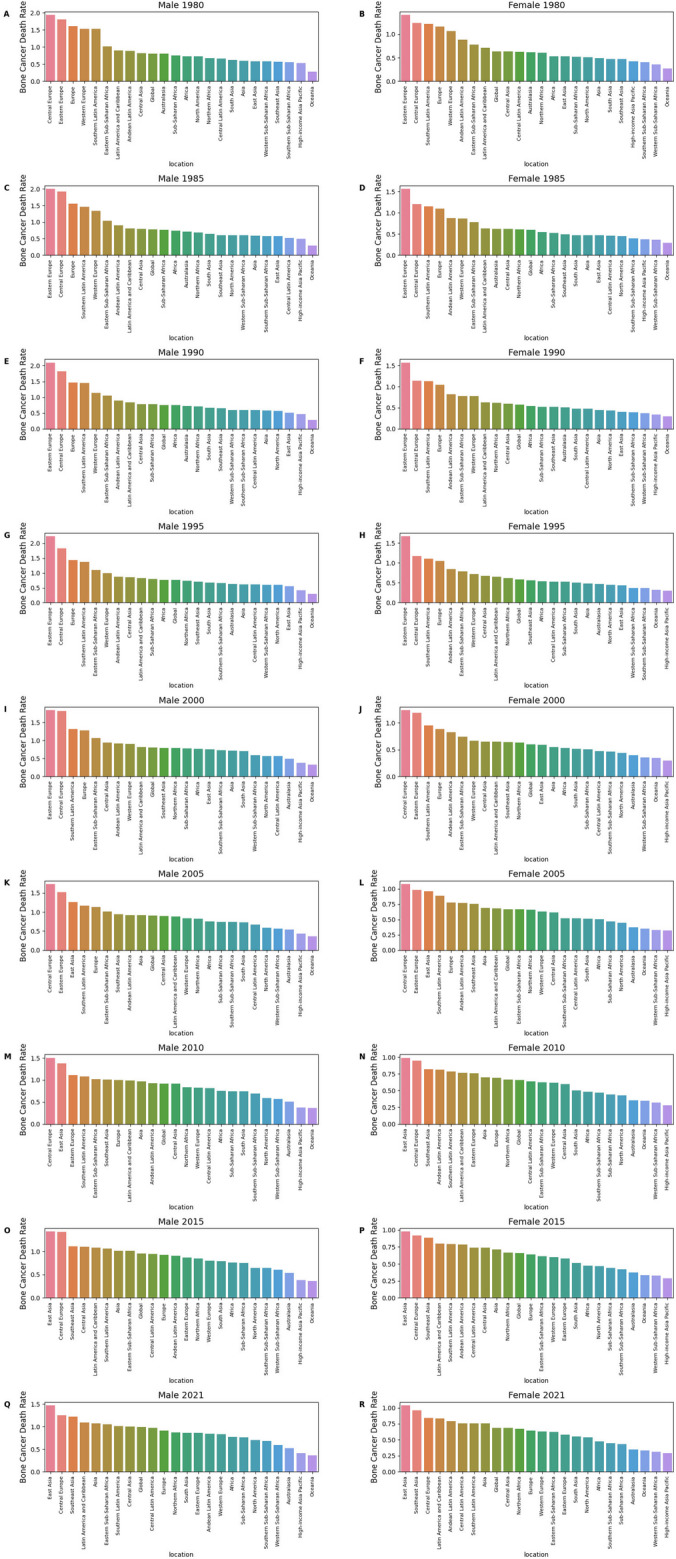
Bone cancer death rates by geographic regions (1980–2021). This figure illustrates the temporal evolution of bone cancer mortality rates per 100,000 persons across 30 geographic regions worldwide from 1980 to 2021, segmented by sex (Male and Female) over nine time points. Data are sourced from the Global Burden of Disease Study 2021, with each subfigure providing a snapshot of gender-specific mortality trends across continents and sub-regions. A: Male 1980, B: Female 1980, C: Male 1985, D: Female 1985, E: Male 1990, F: Female 1990, G: Male 1995, H: Female 1995, I: Male 2000, J: Female 2000, K: Male 2005, L: Female 2005, M: Male 2010, N: Female 2010, O: Male 2015, P: Female 2015, Q: Male 2021, R: Female 2021
Fig. 4.

Bone cancer death rates by income (1980–2021). This figure shows mortality rates per 100,000 people by income level (Low, Lower Middle, Upper Middle, High) and sex, across nine-time intervals. Higher death rates are seen in lower-income groups, with declines in high-income groups, reflecting healthcare and environmental disparities. Data from GBD 2021. A: Male 1980, B: Female 1980, C: Male 1985, D: Female 1985, E: Male 1990, F: Female 1990, G: Male 1995, H: Female 1995, I: Male 2000, J: Female 2000, K: Male 2005, L: Female 2005, M: Male 2010, N: Female 2010, O: Male 2015, P: Female 2015, Q: Male 2021, R: Female 2021
Fig. 5.

Bone cancer death rates by countries (1980–2021). This figure examines bone cancer mortality rates per 100,000 persons across specific countries (China, United States, Brazil) from 1980 to 2021, organized by sex and tracked across nine years (1980, 1985, 1990, 1995, 2000, 2005, 2010, 2015, 2021). Derived from GBD 2021 data, these subfigures offer detailed insights into country-level mortality trends over the study period. A: Male 1980, B: Female 1980, C: Male 1985, D: Female 1985, E: Male 1990, F: Female 1990, G: Male 1995, H: Female 1995, I: Male 2000, J: Female 2000, K: Male 2005, L: Female 2005, M: Male 2010, N: Female 2010, O: Male 2015, P: Female 2015, Q: Male 2021, R: Female 2021
Fig. 6.

Bone cancer death rates by health regions and system (1980–2021).
Sourced from GBD 2021, these subfigures underscore how health system capacity and coordination shape mortality outcomes. A: Male 1980, B: Female 1980, C: Male 1985, D: Female 1985, E: Male 1990, F: Female 1990, G: Male 1995, H: Female 1995, I: Male 2000, J: Female 2000, K: Male 2005, L: Female 2005, M: Male 2010, N: Female 2010, O: Male 2015, P: Female 2015, Q: Male 2021, R: Female 2021.
Bone cancer incidence (1993–2017)
Normal distribution in Q-Q plots across age groups for males and females
Both male and female populations follow a normal distribution, as evidenced by the Shapiro-Wilk test p-values greater than 0.05. For instance, the 90–94 years, 85–89 years, 85 + years, 80–84 years, and 80 + years age groups show normal distributions for both genders, with p-values of 0.445, 0.294, 0.256, 0.113 and 0.097 respectively (Figure S1). These values suggest no significant deviation from normality. However, for some age groups like 75–84 years, 75–79 years, and 75 + years, the male population exhibited non-normal distributions (p < 0.05), whereas the female population in these age groups showed normal distributions. Notably, the 70–74 years and 70 + years age groups exhibit non-normal distributions for the male population, while females in these age groups follow a normal distribution, with respective p-values of 0.019 (male) and 0.112 (female) for 70–74 years, and 0.035 (male) and 0.009 (female) for 70 + years.
Global ASRs of bone cancer
Figure 1 delineates age-standardized incidence rates (ASRs) per 100,000 for bone cancer (ICD-10 C40, C41) from 1993 to 2017, highlighting geographic, gender, and temporal variations. For females (Fig. 1A), ASRs ranged from 0.53 to 2.72 per 100,000 (F = 11.39, p = 1.35E-07), with high-incidence regions including China: Yunmeng County at 2.72 (2.16–3.28) in 2013–2017, China: Xiangfu District, Kaifeng City at 2.15 (1.71–2.58), and China: Fangcheng County at 1.85 (1.51–2.19) in the same period. Other notable regions include Brazil: Cuiaba at 2.16 (1.88–2.45) in 1998–2002, Thailand: Lopburi Province at 2.01 (1.59–2.43) in 2013–2017, and Italy: Lecco at 2.07 in 2008–2012. Low-incidence regions (Fig. 1B) reported ASRs approaching zero (F = 11.55, p = 1.10E-07), particularly in 2013–2017, including Central and South America and the Caribbean, Brazil: Jau, Canada: Yukon, USA: Rhode Island Black, and Australia: Northern Territory Indigenous, all at 0.00. Other low ASRs include Switzerland: Graubunden and Glarus at 0.04 in 1998–2002, USA: California: Los Angeles County Korean at 0.04 in 2013–2017, USA: Louisiana: New Orleans Black at 0.05 in 1993–1997, India: Karunagappalli at 0.05 in 1993–1997, Italy: Barletta at 0.05 in 2008–2012, and USA: Georgia Asian and Pacific Islander at 0.17 (0.17–0.17) in 2003–2007. For males (Fig. 1C), ASRs ranged from 0.90 to 4.28 per 100,000 (F = 9.99, p = 8.58E-07), with China: Xiangfu District, Kaifeng City at 4.28 (3.25–5.31) in 2013–2017, China: Ganzhou District, Zhangye City at 3.04 (2.52–3.56), and China: Jingtai County at 2.59 (2.22–2.96).
Earlier periods showed Italy: Ferrara Province at 2.26 (2.08–2.44) in 1993–1997, Brazil: Cuiaba at 2.22 (1.96–2.49) in 1998–2002, Philippines: Manila at 1.75 (1.30–2.20) in 1993–1997 and 1.83 (1.34–2.33) in 2003–2007, Philippines: Rizal at 1.68 (1.25–2.10) in 1993–1997 and 1.61 (1.18–2.05) in 2003–2007, Seychelles at 1.67 in 2013–2017, and French Polynesia at 2.06 (1.89–2.23) in 1998–2002. Low male ASRs (Fig. 1D) included Central and South America and the Caribbean, USA: Hawaii Chinese, and USA: Montana American Indian at 0.00 in 2013–2017 (F = 3.60, p = 0.009), with early periods showing Canada: Prince Edward Island at 0.04 in 1998–2002, USA: New Mexico American Indian at 0.10 in 1993–1997, USA: Massachusetts Black at 0.05 in 2008–2012, Japan: Akita Prefecture at 0.13 in 2013–2017, USA: California: Los Angeles Chinese at 0.11 in 1993–1997, UK: England: Oxford Region at 0.50 (0.40–0.60), and USA: California Asian and Pacific Islander at 0.51 (0.39–0.62) in 1998–2002. Males generally exhibited higher incidence than females, particularly in high-burden regions.
Bone cancer mortality (1980–2021)
Global mortality trends by region
Bone cancer mortality rates per 100,000 from 1980 to 2021, as depicted in Fig. 2A and R (maps) and 3A–R (regional rates), highlight significant regional and gender disparities. Starting with Fig. 2 in letter order, in 1980, Romania had a high male rate of 2.90 (1.89–3.90) (Fig. 2A), and Greece recorded a female rate of 2.34 (1.11–2.58) (Fig. 2B). In 1985, data for specific countries are not highlighted (Fig. 2C and D). By 1990, Italy’s male rate dropped from 2.50 (2.35–2.65) (Fig. 2A) to 1.65 (1.55–1.73) (Fig. 2E), with no specific female country data noted (Fig. 2F). In 1995, the Russian Federation reported male rates of 2.75 (2.69–2.82) (Fig. 2G) and female rates of 2.08 (2.02–2.13) (Fig. 2H). By 2000, Georgia’s male rate was 2.09 (1.66–2.54) (Fig. 2I), with no specific female country data noted (Fig. 2J). In 2005, no specific country data is highlighted (Fig. 2K and L). Similarly, in 2010 (Fig. 2M and N), 2015 (Fig. 2O and P), and 2021 (Fig. 2Q and R), no specific country-level data is noted for individual countries.
In 1980, Eastern Europe’s male rate was 1.81 (1.73–1.88, p = 0.835) (Fig. 3A) and female rate 1.41 (1.35–1.46, p = 0.959) (Fig. 3B), with Central Europe at 1.93 (1.59–2.20) for males (Fig. 3A) and 1.24 (1.10–1.37) for females (Fig. 3B), and Western Europe at 1.53 (1.45–1.58) for males (Fig. 3A) and 1.07 (1.01–1.10) for females (Fig. 3B). By 1985, Eastern Europe’s male rate rose to 2.00 (1.91–2.08, p = 0.785) (Fig. 3C) and female rate to 1.57 (1.51–1.61, p = 0.922) (Fig. 3D), with Central Europe at 1.92 (1.64–2.14) for males (Fig. 3C) and 1.20 (1.10–1.33) for females (Fig. 3D). In 1990, Eastern Europe peaked at 2.10 (2.01–2.17, p = 0.815) for males (Fig. 3E) and 1.57 (1.51–1.63, p = 0.918) for females (Fig. 3F), while Western Europe’s male rate fell to 1.13 (1.08–1.17, p = 0.815) (Fig. 3E) and female rate to 0.78 (0.73–0.81, p = 0.918) (Fig. 3F).
In 1995, Eastern Europe hit 2.24 (2.17–2.30, p = 0.799) for males (Fig. 3G) and 1.67 (1.62–1.72, p = 0.902) for females (Fig. 3H), with Central Europe at 1.83 (1.68–1.95) for males (Fig. 3G) and 1.17 (1.08–1.25) for females (Fig. 3H). In 2000, Eastern Europe’s male rate dropped to 1.84 (1.79–1.89, p = 0.933) (Fig. 3I) and female rate to 1.18 (1.15–1.22, p = 0.990) (Fig. 3J), with Central Asia at 0.94 (0.81–1.08) for males (Fig. 3I) and 0.65 (0.57–0.75) for females (Fig. 3J). By 2005, Eastern Europe’s male rate was 1.52 (1.47–1.57, p = 0.992) (Fig. 3K) and female rate 0.98 (0.95–1.01, p = 0.999) (Fig. 3L), with Central Europe at 1.73 (1.62–1.81) for males (Fig. 3K) and 1.08 (1.01–1.13) for females (Fig. 3L). In 2010, Eastern Europe’s male rate was 1.11 (1.08–1.14, p = 1.000) (Fig. 3M) and female rate 0.76 (0.73–0.78, p = 1.000) (Fig. 3N), with Central Latin America at 0.81 (0.78–0.84) for males (Fig. 3M) and 0.64 (0.62–0.66) for females (Fig. 3N). By 2015, Eastern Europe’s male rate fell to 0.87 (0.83–0.90, p = 1.000) (Fig. 3O) and female rate to 0.58 (0.55–0.60, p = 1.000) (Fig. 3P), while East Asia’s male rate rose to 1.43 (0.77–1.94) (Fig. 3O) and female rate to 0.98 (0.56–1.26) (Fig. 3P), with Central Asia at 1.10 (0.99–1.22) for males (Fig. 3O). In 2021, Eastern Europe’s male rate was 0.86 (0.75–0.96, p = 1.000) (Fig. 3Q) and female rate 0.58 (0.52–0.66, p = 1.000) (Fig. 3R), Western Europe’s male rate dropped to 0.84 (0.76–0.90, p = 1.000) (Fig. 3Q) and female rate to 0.63 (0.54–0.68, p = 1.000) (Fig. 3R), East Asia’s male rate reached 1.47 (0.84–2.08) (Fig. 3Q) and female rate 1.04 (0.61–1.47) (Fig. 3R), and Central Latin America’s male rate was 0.97 (0.86–1.08) (Fig. 3Q). High-income regions like Western Europe saw declines, while Eastern Europe peaked in the 1990 s (Fig. 3G and H), and East Asia’s rates rose by 2021 (Fig. 3Q and R), reflecting global disparities.
Mortality by income level
Figure 4 illustrates mortality by World Bank income levels. In 1980, high-income countries had the highest male rates at 1.17 (1.10–1.21) and female rates at 0.82 (0.78–0.85) (Fig. 4A–B, p = 0.004), followed by upper middle income at 0.79 (0.68–0.97) for males and 0.67 (0.57–0.94) for females, low income at 0.69 (0.46–0.92) for males and 0.57 (0.37–0.92) for females, and lower middle income at 0.65 (0.43–0.79) for males and 0.49 (0.33–0.68) for females. By 1985, high-income male rates declined to 1.03 (0.98–1.08) (Fig. 4C, p = 0.0009), and female rates to 0.71 (0.67–0.74) (Fig. 4D, p < 0.0001). In 1995, upper middle-income males peaked at 0.77 (0.68–1.02), surpassing high-income at 0.86 (0.83–0.89) (Fig. 4G, p = 0.0003); females were at 0.62 (0.55–0.83) in upper middle income and 0.62 (0.58–0.64) in high-income (Fig. 4H, p = 0.0001). By 2021, upper middle-income males reached 1.26 (0.85–1.62) and females 0.89 (0.63–1.12) (Fig. 4Q–R, p = 0.0002), while high-income stabilized at 0.74 (0.69–0.77) for males and 0.56 (0.49–0.59) for females, and low-income males were at 0.72 (0.54–1.01).
Mortality by country
Figure 5 details mortality across 20 countries. In 1980, Italy had the highest male rates at 2.50 (2.35–2.65), followed by France at 2.27 (2.00–2.47), Poland at 2.18 (2.10–2.27), Sri Lanka at 0.36 (0.24–0.47), and Japan at 0.54 (0.52–0.55) (Fig. 5A, p = 0.0276); females showed Italy at 1.72 (1.63–1.79), Poland at 1.51 (1.45–1.57), France at 1.39 (1.28–1.49), Sri Lanka at 0.25 (0.17–0.35), and Japan at 0.40 (0.39–0.42) (Fig. 5B, p = 0.0040). By 2021, Thailand led with male rates at 2.06 (1.18–3.01) and female rates at 1.51 (1.91–2.15), followed by China at 1.49 (0.85–2.11) for males and 1.04 (0.61–1.49) for females, and Brazil at 1.28 (1.19–1.36) for males (Fig. 5Q–R, p < 0.0001). The United States remained low at 0.65 (0.62–0.67) for males and 0.55 (0.50–0.58) for females (Fig. 5P–R).
Mortality by health system capacity
Figure 6 examines mortality by health system strength. In 1980, advanced health systems had male rates at 1.24 (1.16–1.30) and female rates at 0.91 (0.87–0.94) (Fig. 6A–B, p = 0.0015), followed by Region of the Americas at 0.87 (0.82–0.91) for males and 0.67 (0.63–0.69) for females, African Union at 0.72 (0.49–0.96) for males and 0.53 (0.38–0.84) for females, and Southeast Asia, East Asia, and Oceania at 0.58 (0.45–0.82) for males and 0.51 (0.37–0.87) for females. By 2021, basic health systems showed higher rates at 1.27 (0.85–1.59) for males and 0.92 (0.65–1.13) for females, and Southeast Asia, East Asia, and Oceania at 1.39 (0.81–1.86) for males and 1.01 (0.63–1.33) for females (Fig. 6Q–R, p = 0.0004), while advanced health systems stabilized at 0.76 (0.71–0.81) for males and 0.56 (0.50–0.60) for females, reflecting disparities in diagnostic and treatment access.
Discussion
Summary of the findings
From 1993 to 2021, global bone cancer incidence and mortality rates revealed significant geographic, gender, and socioeconomic disparities, with incidence data showing females with high ASRs ranging from 0.53 to 2.72 per 100,000, peaking in regions like China (Yunmeng County at 2.72 [2.16–3.28] in 2013–2017) and Brazil (Cuiaba at 2.16 [1.88–2.45] in 1998–2002), while low ASRs, often 0.00, were noted in areas like Central and South America and parts of North America, suggesting under-reporting or low prevalence (Fig. 1A and B), and males exhibiting higher ASRs, up to 4.28 per 100,000 (China: Xiangfu District at 4.28 [3.25–5.31] in 2013–2017), with notable rates in Italy and the Philippines, and similarly low rates approaching zero in regions like the USA and Japan (Fig. 1C and D); global bone death rates highlighted elevated mortality in Eastern Europe and Central Asia, with male rates like Romania’s 2.90 (1.89–3.90) in 1980 and female rates like Greece’s 2.34 (2.11–2.58) in 1980, while North America and Western Europe maintained lower rates (Fig. 2A and R), and over time, mortality decreased in high-income regions, but areas like Central Asia sustained high rates, with Georgia at 2.55 (1.96–3.27) for males in 2021, underscoring higher male susceptibility and regional variations driven by healthcare access and environmental factors. Geographic and socioeconomic analyses further clarified these trends, with Eastern Europe leading with male mortality peaking at 2.24 (2.17–2.30) in 1995, while East Asia’s rates rose significantly by 2021 to 1.47 (0.84–2.08) for males, reflecting growing burdens in Asia (Fig. 3A and R), and high-income countries initially having elevated rates (males at 1.17 [1.10–1.21] in 1980) but seeing declines to 0.74 (0.69–0.77) by 2021, while Upper Middle-Income countries surged to 1.26 (0.85–1.62), indicating shifting burdens to middle-income settings (Fig. 4A and R); country-specific data showed Italy’s male rates dropping from 2.50 (2.35–2.65) in 1980 to 1.00 (0.90–1.11) in 2021, while Thailand and China rose, with Thailand at 2.06 (1.18–3.01) for males in 2021 (Fig. 5A and R), and health system analysis revealed Advanced Health Systems declining from 1.24 (1.16–1.30) for males in 1980 to 0.76 (0.71–0.81) in 2021, while Basic Health Systems peaked at 1.27 (0.85–1.59), highlighting how limited healthcare capacity drove higher mortality (Fig. 6A and R), with low p-values across analyses (p < 0.0001 in Figs. 5Q and R and 6E and J) confirming significant disparities, with males consistently facing higher risks and low-resource settings bearing increasing mortality burdens over time.
The international datasets reveal significant geographic and gender disparities in bone cancer incidence and mortality in China, contrasting with the broader, more averaged trends reported in Chinese studies. The CI5 data from 1993 to 2017 highlight exceptionally high ASRs in specific Chinese regions, particularly in 2013–2017, with females in Yunmeng County reaching 2.16 per 100,000, Xiangfu District at 1.71, and Fangcheng County at 1.505, while males in Xiangfu District peaked at 3.245, followed by Ganzhou District (2.52) and Jingtai County (2.22). These rates substantially exceed the national crude incidence of 1.76–1.77 per 100,000 and age-standardized incidence (ASI) of 1.32–1.35 per 100,000 reported by Xia et al. (2019) [46] and Xi et al. (2023) [47] which cover 309.5 million persons across 368 registries in 2014 and recent years, respectively. Chinese studies also confirm higher male rates and rural-urban disparities, aligning with CI5’s gender trends, but report a 2.2% annual decline [47] a temporal trend absent in CI5’s static snapshot. Specific subtype analyses, such as Pingping et al. (2019) in Tianjin (bone sarcoma ASR: 0.6 per 100,000) [48] and Guo et al. (1999) noting elevated osteosarcoma frequency [49] suggest CI5’s broader ICD-10 C40–C41 category captures regional hotspots not reflected in national averages, potentially inflated by diverse bone cancer types like giant cell tumors (GCT), estimated at 0.149–0.257 per 100,000 [50].
For mortality, the Global Burden of Disease Study 2021 (GBD) lacks China-specific granularity, aggregating data within East Asia (moderate rates: males 0.7–1.4, females 0.5–1.0 per 100,000) and Central Asia (higher rates: males 1.5–2.0, females 1.0–1.6), contrasting with detailed Chinese estimates. National crude mortality rates of 1.26–1.31 per 100,000 [46, 47] and age-standardized mortality rates (ASMRW: 0.86–0.88) align with GBD’s East Asia trends, but fall below Central Asia’s peaks, suggesting western China may contribute to regional highs. Chinese data emphasize male predominance and a 4.8% annual decline [47] with rural rates exceeding urban, while GBD’s static 1980–2021 analysis highlights persistent high mortality in Central Asia without isolating China’s trajectory. Tianjin’s bone sarcoma mortality ASR of 0.2 per 100,000 is notably lower than GBD’s regional estimates [48] reflecting urban specificity or subtype focus, whereas Zhang et al. (2023) report a 70% 5-year osteosarcoma survival rate [51] hinting at improved outcomes not captured in GBD’s aggregated mortality. This comparison underscores that international data spotlight China’s high-incidence and high-mortality regions, while Chinese studies provide a declining national trend enriched by subtype and survival insights, highlighting the interplay of regional variation, data scope, and healthcare context.
Research foundations and emerging trends
Research foundations
The study of ASR of bone cancer from 1993 to 2012 underscores significant demographic and regional variations, with a notable prevalence in males and an increasing trend in the 60 + age group across diverse regions such as Europe, Asia, North America, and others. While global ASR and cumulative incidence rates have remained relatively stable, China has experienced a significant increase, exceeding the worldwide average. This highlights the dynamic nature of cancer epidemiology, with shifts in the cities recording the highest incidences over time, reflecting the complex interplay of geographic, demographic, and healthcare factors.
Emerging trends
Projected trends indicate a continuing rise in bone cancer incidence in China, correlating with its significant contribution to cancer mortality. Analysis of high-incidence areas, defined as ASR > 3.0 per 100,000 persons, reveals fluctuating patterns with regions like China, Italy, Brazil, and Malawi emerging at different times as areas with the highest rates. Despite these fluctuations, cities such as Jiashan and Harbin in China, and Mania in the Philippines consistently appear among the top 20 cities with high incidence. Furthermore, the persistent prevalence of osteosarcoma in youths, especially in countries like the Philippines, Brazil, and Italy, underscores the need for targeted research and healthcare strategies in these areas.
The possible causes of bone cancer
Finally, the reason the bone cancer incidence in males higher than that in females remains unclear. Previous work revealed a male predominance in incidence for a majority of cancers in Jiashan County (China). Gender disparities in bone cancer incidence, as observed in our study, may be partially attributable to differential exposure to environmental and behavioral risk factors, such as smoking. Tobacco smoke, containing over 7,000 chemicals, has been established as a significant risk factor for various cancers, with emerging evidence suggesting a link to bone cancer [52]. For instance, a six-year study of 2,721 cancer patients under 35 in Khuzestan province identified smoking as a predisposing factor, particularly among younger populations, though specific associations with bone cancer require further validation [52]. Additionally, a meta-analysis by Xiong et al. reported an 8.17% prevalence of smoking among Chinese adolescents, with notable geographic and gender variations—males exhibited higher rates than females—potentially contributing to the elevated bone cancer incidence observed in certain regions and demographics in our data [53]. This aligns with trends in lung cancer incidence, where smoking-driven increases have been well-documented, rising from 27.58 to 111.24 per 100,000 in Jiashan county between 1987 and 2016 [54]. However, the precise mechanisms linking smoking to bone cancer, such as the role of carcinogenic compounds in bone marrow or skeletal tissue, remain underexplored and warrant targeted mechanistic studies to clarify causality and quantify risk.
Environmental factors, particularly air pollution, may also play a critical role in the observed patterns of bone cancer incidence, especially in pediatric and young adult populations. Outdoor air pollution, identified as a major global contributor to cancer incidence, includes particulate matter (PM) and other pollutants that have been causally linked to lung cancer and are hypothesized to influence other malignancies, including bone cancer [55]. Turner et al. (2020) highlight that PM exposure, prevalent in areas exceeding WHO air-quality guidelines, may induce systemic inflammation and oxidative stress—biological pathways potentially relevant to bone carcinogenesis [55]. Similarly, Lupo et al. (2019) suggest that low environmental quality, encompassing air pollution alongside ionizing radiation and pesticides, could elevate pediatric cancer risk, though evidence specific to bone cancer remains limited [56]. In our study, regions with high bone cancer incidence may overlap with areas of poor air quality, such as industrialized zones in China, yet this correlation lacks robust statistical substantiation due to insufficient data on exposure levels and confounding variables. To address these gaps, future research should integrate longitudinal exposure assessments and molecular analyses to elucidate how air pollutants interact with skeletal tissues, offering a more comprehensive understanding of their contribution to bone cancer disparities across gender and geography.
The etiology of primary bone cancers, such as osteosarcoma, Ewing sarcoma, and chondrosarcoma, varies significantly across age groups due to differences in incidence peaks, tumor locations, and underlying biological factors. Osteosarcoma predominantly affects adolescents and young adults, peaking at ages 10–14, often linked to rapid bone growth during puberty, particularly in long bones like the distal femur and proximal tibia, though it can also arise later in life from malignant transformation of benign conditions like Paget’s disease or prior radiation exposure [57–59]. Ewing sarcoma is more common in children and teenagers, with a peak in the second decade, typically occurring in long bones and the pelvis, and its etiology may involve distinct biological pathways unrelated to pubertal growth [60, 61]. In contrast, chondrosarcoma primarily affects adults over 40, increasing steadily with age, and is frequently found in the pelvis and ribs, often arising as a primary tumor or from pre-existing benign lesions, with most cases being low-grade and less metastatic [60, 62]. Genomic analysis further reveals age-specific mutation patterns, with NCOR1 and CCND3 mutations more prevalent in juvenile patients, potentially tied to growth-related pathways, while H3F3A mutations predominate in adults, suggesting different oncogenic mechanisms [63]. These variations highlight how pubertal bone growth, pre-existing conditions, and genetic alterations contribute to age-dependent etiologies of bone cancers, influencing their clinical presentation and management.
Figure S2 reveals the disease burden across age groups and gender reveals statistically significant differences, as confirmed by ANOVA for both females (F = 403.12, p < 0.0001) and males (F = 212.67, p < 0.0001). Notably, a high disease burden is already present among youth and children, particularly in the 0–14 years group, where males exhibit a mean value of 4.30 and females 4.14—levels comparable to those seen in elderly groups. This early-life burden suggests a concerning trend of elevated disease exposure or vulnerability in childhood, especially among boys. While disease burden generally increases with age, peaking in the 70–84-year range for both genders (e.g., female mean ≈ 5.75 in 80–84 years, male mean ≈ 5.62 in 70–74 years), the unexpectedly high values in the youngest age group highlight the need for targeted early-life interventions and further investigation into pediatric disease factors.
Bone cancer incidence varies geographically due to a complex interplay of environmental, demographic, and healthcare-related factors, as evidenced by the significant disparities in ASRs from 1993 to 2017. High-incidence areas like China (Xiangfu District: 3.245 per 100,000) and Malawi (Blantyre: 1.885) may reflect greater exposure to environmental risks such as industrial air pollution, including particulate matter (PM), which induces systemic inflammation and oxidative stress potentially linked to bone carcinogenesis, alongside higher smoking prevalence among males (8.17% in Chinese adolescents, Xiong et al., 2019) [53] a known risk factor for various cancers. In contrast, regions with near-zero ASRs, such as Brazil: Jau and USA: Hawaii Chinese (0.0 in 2013–2017), likely experience underreporting due to limited healthcare surveillance and registry coverage, as suggested by the Results’ minimal rates in less-developed systems. Demographic factors, like rapid bone growth driving osteosarcoma in youths (Philippines, Brazil), and industrialized urban settings in China (Jiashan, Harbin), further amplify incidence in specific hotspots, while lower rates in high-income areas like North America (0.3–0.4) may reflect better prevention and detection. These variations underscore the need for targeted research to quantify environmental exposures and healthcare disparities driving geographic differences.
Study limitations
This study provides a comprehensive analysis of bone cancer incidence and mortality trends, yet several limitations warrant consideration, particularly regarding potential biases, data constraints, and unexpected findings. The reliance on ASRs from 1993 to 2017 (CI5 data) and mortality data from 1980 to 2021 (GBD 2021) reveals distinct regional patterns, but data quality variations—such as incomplete registry coverage in low-incidence areas (Brazil: Jau at 0.0)—may bias results toward underreporting, potentially masking true disease burden. Conversely, high ASRs in regions like China (Xiangfu District: 3.245 in 2013–2017) could reflect over ascertainment due to robust surveillance, introducing a detection bias. The threshold of ASR > 3.0 per 100,000 to define “highest incidence” captures extreme cases but overlooks subtler shifts, such as the decreasing trend in high-income regions (Western Europe: 0.4 to 0.3 per 100,000) versus increases in Central Asia (males: 2.0 in 2021). This discrepancy may stem from improved healthcare interventions in wealthier areas, environmental exposures in developing regions, or differential reporting accuracy, yet these alternatives remain underexplored due to limited exposure data.
Further, the fluctuating prominence of high-incidence cities like Jiashan and Harbin in China, and Manila in the Philippines, among the top 20, alongside projections of rising ASRs in China by 2050, suggests dynamic epidemiological patterns potentially driven by unexamined factors—such as industrial pollution, genetic predispositions, or socioeconomic shifts—not fully addressed by the study’s methodology. For instance, the consistent ranking of these cities could indicate localized risk factors, but data limitations preclude causal analysis, and contradictory trends (stable global ASRs vs. China’s rise) may reflect aggregation bias across diverse registries. These challenges are compounded by the GBD 2021’s broad categorization (income levels, health systems), which may obscure country-specific nuances, and the absence of race-specific data, limiting insights into demographic variations. These limitations underscore the need for future studies with longitudinal exposure assessments, refined registry validation, and more granular methodologies to resolve apparent contradictions and capture the evolving global landscape of bone cancer epidemiology.
Conclusions
Bone cancer incidence and mortality exhibit significant global disparities, strongly influenced by healthcare system capacity and socioeconomic factors. From 1993 to 2017, age-standardized incidence rates (ASRs) varied widely, with highs in China (4.28 for males in Xiangfu District) and lows near zero in areas like Brazil and the USA, while mortality rates from 1980 to 2021 peaked in Eastern Europe and Central Asia but declined in high-income regions like Western Europe. By 2021, rising mortality in Upper Middle-Income countries and Basic Health Systems, compared to lower rates in Advanced Health Systems, underscored the critical role of healthcare access. Increasing trends in countries like Thailand and China, contrasted with stable low rates in the USA, highlight the need for targeted interventions to address socioeconomic and healthcare disparities driving these patterns.
Electronic supplementary material
Supporting Figure S1. Shapiro-Wilk test and Q-Q plots for normality of age-specific data in male and female populations. The plots show the results of the Shapiro-Wilk normality test for different age groups in male and female populations. The Q-Q plots depict the distribution of data points against a standard normal distribution, where deviations from the diagonal line suggest non-normality. Each plot includes the p-value from the Shapiro-Wilk test, which is used to assess the null hypothesis that the data is normally distributed. Age groups that exhibit a normal distribution are labeled as “Normal,” while those with non-normal distributions are labeled as “Non-normal.” Supplementary Material 1
Supporting Figure S2. Distribution of disease burden by age group and gender. This boxplot illustrates the distribution of disease burden (measured as val) across various age groups, stratified by gender. Each box represents the interquartile range (IQR) for the respective age-gender group, with the central line denoting the median. Supplementary Material 2
Author contributions
P.L. and H.L. conceptualized and designed the study, overseeing the overall research framework and methodology for analyzing global bone cancer incidence and mortality trends using data from the Global Burden of Disease Study 2021 (GBD 2021) and the Cancer Incidence in Five Continents (CI5) database. Y.L. and Z.L. performed data curation and statistical analysis of age-standardized incidence rates (ASRs) and mortality rates across regions, countries, income levels, and health systems, focusing on gender differences and healthcare capacity, and wrote the main manuscript text. X.Y. interpreted the results, particularly identifying key disparities such as the high incidence rates in China (e.g., Yunmeng County, 2.72 for females) and rising mortality in Upper Middle-Income countries and Basic Health Systems, and provided critical revisions to the manuscript. H.H. supervised the project, ensured the accuracy of conclusions regarding the influence of healthcare system capacity and socioeconomic factors on bone cancer outcomes, and coordinated the overall effort. All authors reviewed the manuscript.
No Funding.
Data availability
The bone cancer incidence data analyzed in this study, covering age-standardized incidence rates (ASRs) and cumulative incidence (0–74 years) for ICD-10 C40–C41, were derived from the CI5 series, Volumes VIII–XII (1993–2017), published by the IARC and are accessible via the CI5 database (https://ci5.iarc.fr) upon registration, subject to IARC’s data-sharing policies. Mortality data, spanning 1980–2021 and categorized by regions, income levels, and health system quality, were sourced from the GBD 2021, provided by the IHME, and are freely available through the GBD Results Tool (https://vizhub.healthdata.org/gbd-results/) under IHME’s open-access policy for non-commercial research. All data use adhered to the Declaration of Helsinki, with no additional access restrictions beyond those set by IARC and IHME.
Declarations
Ethics approval and consent to participate
Not applicable.
Competing interests
The authors declare no competing interests.
Footnotes
Publisher’s note
Springer Nature remains neutral with regard to jurisdictional claims in published maps and institutional affiliations.
References
- 1.Ucci A, Giacchi L, Rucci N. Primary bone tumors and breast Cancer-Induced bone metastases: in vivo animal models and new alternative approaches. Biomedicines. 2024;12(11):2451. [DOI] [PMC free article] [PubMed] [Google Scholar]
- 2.Nyeko R, Geriga F, Angom R, Kambugu JB, Van Heerden J. The management of osteosarcoma in children and adolescents in a resource-limited setting: quality improvement considerations to improve treatment outcomes. BMC Cancer. 2024;24(1):1061. [DOI] [PMC free article] [PubMed] [Google Scholar]
- 3.Papakonstantinou E, Athanasiadou KI, Markozannes G, et al. Prognostic factors in high-grade pediatric osteosarcoma among children and young adults: Greek nationwide registry for childhood hematological malignancies and solid tumors (NARECHEM-ST) data along with a systematic review and meta-analysis. Cancer Epidemiol. 2024;90:102551. [DOI] [PubMed] [Google Scholar]
- 4.Leon-Ferre RA, Zambrano E. Pediatric neoplasia. In: Pediatric bone tumors. NJ: Humana Totowa; 2012. [Google Scholar]
- 5.Stiller CA, Bielack SS, Jundt G, Steliarova-Foucher E. Bone tumours in European children and adolescents, 1978–1997. Report from the automated childhood Cancer information system project. Eur J Cancer Sep. 2006;42(13):2124–35. 10.1016/j.ejca.2006.05.015. [DOI] [PubMed] [Google Scholar]
- 6.Kaatsch P, Strothotte J, Becker C, Bielack S, Dirksen U, Blettner M. Pediatric bone tumors in Germany from 1987 to 2011: incidence rates, time trends and survival. Acta Oncol Sep-Oct. 2016;55(9–10):1145–51. 10.1080/0284186X.2016.1195509. [DOI] [PubMed] [Google Scholar]
- 7.Balmant NV, Reis RS, Santos MO, Maschietto M, Camargo B. Incidence and mortality of bone cancer among children, adolescents and young adults of Brazil. Clin (Sao Paulo). May 2019;13:74:e858. 10.6061/clinics/2019/e858. [DOI] [PMC free article] [PubMed] [Google Scholar]
- 8.Thongkumkoon P, Sangphukieo A, Tongjai S, et al. Establishment, characterization, and genetic profiling of patient-derived osteosarcoma cells from a patient with retinoblastoma. Sci Rep. 2024;14(1):11056. [DOI] [PMC free article] [PubMed] [Google Scholar]
- 9.Bielack SS, Baumhoer D, Hecker-Nolting S, et al. Osteosarcomas in retinoblastoma-survivors. A report of 28 affected patients from the cooperative osteosarcoma study group (COSS). EJC Pediatr Oncol. 2024;3:100158. [DOI] [PubMed] [Google Scholar]
- 10.Cui Y, Shi X, Wang S, et al. Machine learning approaches for prediction of early death among lung cancer patients with bone metastases using routine clinical characteristics: an analysis of 19,887 patients. Front Public Health. 2022;10:1019168. [DOI] [PMC free article] [PubMed] [Google Scholar]
- 11.Wang Q-L, Wang L, Li Q-Y, et al. Micafungin exerts antitumor effect on breast cancer and osteosarcoma through preventing EMT in tumor cells in an USP7/AKT/GSK-3β pathway-dependent manner. Naunyn Schmiedebergs Arch Pharmacol. 2024;397(6):4447–59. [DOI] [PubMed] [Google Scholar]
- 12.Wang P, Yang L, Dong J, et al. The sEVs miR-487a/Notch2/GATA3 axis promotes osteosarcoma lung metastasis by inducing macrophage polarization toward the M2-subtype. Cancer Cell Int. 2024;24(1):301. [DOI] [PMC free article] [PubMed] [Google Scholar]
- 13.Hawkins MM, Wilson LM, Burton HS, et al. Radiotherapy, alkylating agents, and risk of bone cancer after childhood cancer. J Natl Cancer Inst Mar. 1996;6(5):270–8. 10.1093/jnci/88.5.270. [DOI] [PubMed] [Google Scholar]
- 14.Valery PC, Laversanne M, Bray F. Bone cancer incidence by morphological subtype: a global assessment. Cancer Causes Control Aug. 2015;26(8):1127–39. 10.1007/s10552-015-0607-3. [DOI] [PubMed] [Google Scholar]
- 15.Li K, Jiang C, Tan H, et al. Identification and characterization of a novel glucomannanase from Paenibacillus polymyxa. 3 Biotech. 2021;11(3):129. 10.1007/s13205-021-02676-0. [DOI] [PMC free article] [PubMed] [Google Scholar]
- 16.Anfinsen KP, Devesa SS, Bray F, et al. Age-period-cohort analysis of primary bone cancer incidence rates in the united States (1976–2005). Cancer Epidemiol Biomarkers Prev Aug. 2011;20(8):1770–7. 10.1158/1055-9965.Epi-11-0136. [DOI] [PubMed] [Google Scholar]
- 17.Pilleron S, Sarfati D, Janssen-Heijnen M, et al. Global cancer incidence in older adults, 2012 and 2035: a population‐based study. Int J Cancer. 2019;144(1):49–58. [DOI] [PubMed] [Google Scholar]
- 18.Li Z, Zheng R, Xu X, et al. Pediatric cancer surveillance in china: A hospital-based introduction. Pediatr Invest. 2021;5(2):81. [DOI] [PMC free article] [PubMed] [Google Scholar]
- 19.Holden DM, Ilaslan H, Sundaram M. An imaging approach to bone tumors. In: Tumors and tumor-like lesions of bone. Springer; 2020. p. 13–59. [Google Scholar]
- 20.Roder DM, Warr A, Patterson P, Allison KR. Australian adolescents and young adults: trends in cancer incidence, mortality, and survival over three decades. J Adolesc Young Adult Oncol. 2018;7(3):326–38. [DOI] [PubMed] [Google Scholar]
- 21.Heer EV, Harper AS, Sung H, Jemal A, Fidler-Benaoudia MM. Emerging cancer incidence trends in canada: the growing burden of young adult cancers. Cancer. 2020;126(20):4553–62. [DOI] [PubMed] [Google Scholar]
- 22.Ottaviani G, Jaffe N. The epidemiology of osteosarcoma. Pediatr Adolesc Osteosarcoma. 2009:3–13. [DOI] [PubMed]
- 23.Ward E, DeSantis C, Robbins A, Kohler B, Jemal A. Childhood and adolescent cancer statistics, 2014. CA Cancer J Clin. 2014;64(2):83–103. 10.3322/caac.21219. [DOI] [PubMed] [Google Scholar]
- 24.Slade AD, Warneke CL, Hughes DP, et al. Effect of concurrent metastatic disease on survival in children and adolescents undergoing lung resection for metastatic osteosarcoma. J Pediatr Surg. 2015;50(1):157–60. [DOI] [PubMed] [Google Scholar]
- 25.Grünewald TG, Cidre-Aranaz F, Surdez D, et al. Ewing sarcoma. Nat Reviews Disease Primers. 2018;4(1):1–22. [DOI] [PubMed] [Google Scholar]
- 26.Stevenson JD, Laitinen MK, Parry MC, Sumathi V, Grimer RJ, Jeys LM. The role of surgical margins in chondrosarcoma. Eur J Surg Oncol. 2018;44(9):1412–8. [DOI] [PubMed] [Google Scholar]
- 27.Xu J, Xu K, Li Z, et al. Forecast of dengue cases in 20 Chinese cities based on the deep learning method. Int J Environ Res Public Health. 2020;17(2):453. [DOI] [PMC free article] [PubMed] [Google Scholar]
- 28.Parkin D, Whelan S, Ferlay J, Teppo L, Thomas D. Cancer incidence in five continents VIII Lyon. Int Agency Res Cancer. 2002.
- 29.Cancer IAfRo. Cancer incidence in five continents. Vol. IX. International Agency for Research on Cancer; 2007.
- 30.Forman D, Bray F, Brewster D, Gombe Mbalawa C, Kohler B, Piñeros M. Cancer incidence in five continents, Vol. X (electronic version). Lyon, France: International Agency for Research on Cancer; 2013. 2017.
- 31.Bray F, Colombet M, Mery L, et al. editors. Cancer incidence in five continents. 2017.
- 32.Bray F, Colombet M, Aitken JF, et al. Cancer incidence in five continents, vol. XII (IARC cancerbase no. 19). Lyon: International Agency for Research on Cancer; 2023. [Google Scholar]
- 33.Saika K, Matsuda T. Cancer incidence rates in the world from the Cancer incidence in five continents XI. Jpn J Clin Oncol. 2018;48(1):98–9. [DOI] [PubMed] [Google Scholar]
- 34.Bray F, Ferlay J, Laversanne M, et al. Cancer incidence in five continents: inclusion criteria, highlights from X and the global status of cancer registration. Int J Cancer Nov. 2015;1(9):2060–71. 10.1002/ijc.29670. [DOI] [PubMed] [Google Scholar]
- 35.Ferlay J, Steliarova-Foucher E, Antoni S, Masuyer E. Data processing. IARC Sci Publ. 2014;164:107–11. [PubMed] [Google Scholar]
- 36.Bray F, Ferlay J. Age-standardization. Cancer Incidence Five Continents. 2002;8:87–9. [Google Scholar]
- 37.Hemminki K, Miller AB. Special section editorial: cancer incidence in five continents including Africa. Wiley Online Library; 2015. p. 2043–4. [DOI] [PubMed] [Google Scholar]
- 38.Jouhet V, Defossez G, Burgun A, et al. Automated classification of free-text pathology reports for registration of incident cases of cancer. Methods Inf Med. 2012;51(03):242–51. [DOI] [PubMed] [Google Scholar]
- 39.Shin H-R, Masuyer E, Ferlay J, Curado M-P. Cancer in Asia-Incidence rates based on data in cancer incidence in five continents IX (1998–2002). Asian Pac J cancer Prevention: APJCP. 2010;11:11–6. [PubMed] [Google Scholar]
- 40.Parkin D, Shanmugaratnam K, Sobin L, Ferlay J, Whelan S. Histological groups. IARC Sci Publ; 1997. p. 34–44. [Google Scholar]
- 41.Saraiya M, Tangka FK, Asma S, Richardson LC. Importance of economic evaluation of cancer registration in the resource limited setting: laying the groundwork for surveillance systems. Cancer Epidemiol. 2016;45(Suppl 1):S1. [DOI] [PMC free article] [PubMed] [Google Scholar]
- 42.Parkin D, Whelan S, Ferlay J, Teppo L, Thomas D. Cancer incidence in five continents VIII. IARC Sci Publication. 2002;(155).
- 43.Shin H, Curado M, Ferlay J, Heanue M, Edwards B, Storm H. Chapter 5: comparability and quality of data. Cancer Incidence Five Continents. 2007;9:67–94. [Google Scholar]
- 44.Bray F, Ferlay J, Laversanne M, et al. Cancer I Ncidence in F Ive C ontinents: inclusion criteria, highlights from X and the global status of cancer registration. Int J Cancer. 2015;137(9):2060–71. [DOI] [PubMed] [Google Scholar]
- 45.Sprumont D, Girardin S, Lemmens T. The Helsinki declaration and the law: an international and comparative analysis. History Theory Hum experimentaion–the Declaration Helsinki Mod Med Ethics. 2007:223–52.
- 46.Xia L, Zheng R, Xu Y, et al. Incidence and mortality of primary bone cancers in china, 2014. Chin J Cancer Res. 2019;31(1):135. [DOI] [PMC free article] [PubMed] [Google Scholar]
- 47.Xi Y, Qiao L, Na B, et al. Primary malignant bone tumors incidence, mortality, and trends in China from 2000 to 2015. Chin Med J. 2023;136(17):2037–43. [DOI] [PMC free article] [PubMed] [Google Scholar]
- 48.Pingping B, Yuhong Z, Weiqi L, et al. Incidence and mortality of sarcomas in shanghai, china, during 2002–2014. Front Oncol. 2019;9:662. [DOI] [PMC free article] [PubMed] [Google Scholar]
- 49.GUO W, XU W, Andrew GH, John HH, FENG C. Comparative frequency of bone sarcomas among different Racial groups. Chin Med J. 1999;112(12):1101–4. [PubMed] [Google Scholar]
- 50.Liede A, Hernandez RK, Tang E-T, et al. Epidemiology of benign giant cell tumor of bone in the Chinese population. J Bone Oncol. 2018;12:96–100. [DOI] [PMC free article] [PubMed] [Google Scholar]
- 51.Zhang C, Wu H, Xu G, et al. Incidence, survival, and associated factors Estimation in osteosarcoma patients with lung metastasis: a single-center experience of 11 years in tianjin, China. BMC Cancer. 2023;23(1):506. [DOI] [PMC free article] [PubMed] [Google Scholar]
- 52.Madmoli M, Shaidaei MFB, Rohani A, Madmoli Y, Khodadadi M. Some predisposing factors and affecting cancer under the age of 35: A 6-year study on 2721 cancer patients. Int J Ayurvedic Med. 2019;10(1):62–7. [Google Scholar]
- 53.Xiong PS, Xiong MJ, Liu ZX, Liu Y. Prevalence of smoking among adolescents in china: an updated systematic review and meta-analysis. Public Health. 2020;182:26–31. [DOI] [PubMed] [Google Scholar]
- 54.Li C, Zhu Y, Yang J, et al. Incidence of lung cancer in jiashan, Zhejiang province: trend analysis from 1987 to 2016 and projection from 2017 to 2019. Zhejiang Da Xue Xue Bao Yi Xue ban = J Zhejiang Univ Med Sci. 2018;47(4):367–73. [DOI] [PMC free article] [PubMed] [Google Scholar]
- 55.Turner MC, Andersen ZJ, Baccarelli A, et al. Outdoor air pollution and cancer: an overview of the current evidence and public health recommendations. Cancer J Clin. 2020;70(6):460–79. [DOI] [PMC free article] [PubMed] [Google Scholar]
- 56.Lupo PJ, Petrick LM, Hoang TT, et al. Using primary teeth and archived dried spots for exposomic studies in children: exploring new paths in the environmental epidemiology of pediatric cancer. BioEssays. 2021;43(9):2100030. [DOI] [PMC free article] [PubMed] [Google Scholar]
- 57.Keil L. Bone tumors: primary bone cancers. FP Essentials. 2020;493:22–6. [PubMed] [Google Scholar]
- 58.Ferguson JL, Turner SP. Bone cancer: diagnosis and treatment principles. Am Family Phys. 2018;98(4):205–13. [PubMed] [Google Scholar]
- 59.Savage SA, Mirabello L. Using epidemiology and genomics to understand osteosarcoma etiology. Sarcoma. 2011;2011(1):548151. [DOI] [PMC free article] [PubMed] [Google Scholar]
- 60.Chow WA. Bones: the adult sarcoma drama. J Oncol Pract. 2016;12(3):219–20. [DOI] [PubMed] [Google Scholar]
- 61.Arora RS, Alston RD, Eden TO, Geraci M, Birch JM. The contrasting age-incidence patterns of bone tumours in teenagers and young adults: implications for aetiology. Int J Cancer. 2012;131(7):1678–85. [DOI] [PubMed] [Google Scholar]
- 62.Sundaram M, Vanel D. Tumors and tumor-like lesions of bone. In: Musculoskeletal diseases: diagnostic imaging and interventional techniques. Springer; 2005. p. 62–7. [Google Scholar]
- 63.Xie X, Yin J, Bian Y, et al. Comprehensive Understanding of genomic profile of bone cancer by the combination of DNA and RNA detection. Wolters Kluwer Health; 2021.
Associated Data
This section collects any data citations, data availability statements, or supplementary materials included in this article.
Supplementary Materials
Supporting Figure S1. Shapiro-Wilk test and Q-Q plots for normality of age-specific data in male and female populations. The plots show the results of the Shapiro-Wilk normality test for different age groups in male and female populations. The Q-Q plots depict the distribution of data points against a standard normal distribution, where deviations from the diagonal line suggest non-normality. Each plot includes the p-value from the Shapiro-Wilk test, which is used to assess the null hypothesis that the data is normally distributed. Age groups that exhibit a normal distribution are labeled as “Normal,” while those with non-normal distributions are labeled as “Non-normal.” Supplementary Material 1
Supporting Figure S2. Distribution of disease burden by age group and gender. This boxplot illustrates the distribution of disease burden (measured as val) across various age groups, stratified by gender. Each box represents the interquartile range (IQR) for the respective age-gender group, with the central line denoting the median. Supplementary Material 2
Data Availability Statement
The bone cancer incidence data analyzed in this study, covering age-standardized incidence rates (ASRs) and cumulative incidence (0–74 years) for ICD-10 C40–C41, were derived from the CI5 series, Volumes VIII–XII (1993–2017), published by the IARC and are accessible via the CI5 database (https://ci5.iarc.fr) upon registration, subject to IARC’s data-sharing policies. Mortality data, spanning 1980–2021 and categorized by regions, income levels, and health system quality, were sourced from the GBD 2021, provided by the IHME, and are freely available through the GBD Results Tool (https://vizhub.healthdata.org/gbd-results/) under IHME’s open-access policy for non-commercial research. All data use adhered to the Declaration of Helsinki, with no additional access restrictions beyond those set by IARC and IHME.