

Abstract
Oral small molecule inhibitors of tumor necrosis factor alpha (TNFα) are emerging as attractive therapeutic agents for the treatment of various autoimmune diseases. Balinatunfib (SAR441566), a novel oral inhibitor of tumor necrosis factor receptor 1 (TNFR1) signaling, changes the configuration of the soluble TNFα (sTNFα) trimer and prevents its heterotrimerization with TNFR1 but not TNFR2, thereby blocking TNFR1 signaling. Herein, we report the results from a first‐in‐human (FIH) study that evaluated the safety, pharmacokinetics (PK), and pharmacodynamics (PD) following single ascending doses (SAD) and multiple ascending doses (MAD) of balinatunfib in healthy male participants. Single (5–600 mg) and multiple (100–600 mg total daily dose for up to 14 days) oral doses of balinatunfib were well‐tolerated in all participants. Consistent PK data were obtained across the studies, with a median t max of 2.5–5 hours, a mean terminal half‐life of 22–30 hours, and a time to steady state of 5–6 days. A supra‐proportional exposure increase was observed in both SAD and MAD studies, which was less pronounced at doses ≥ 180 mg. Food had no relevant effects on the PK characteristics of balinatunfib. As the main PD read‐out, complete TNFα occupancy was shown at all tested time points after the treatment started. Balinatunfib, as the first clinically tested oral TNFR1 signal inhibitor, demonstrated a good safety profile along with favorable PK/PD characteristics that allowed both once and twice daily dosing, confirming a successful preclinical‐to‐clinical translation and guiding dose selection for further clinical efficacy studies.
Study Highlights.
WHAT IS THE CURRENT KNOWLEDGE ON THE TOPIC?
Biologic tumor necrosis factor α (TNF‐α) inhibitors have emerged as therapeutic agents for the treatment of various inflammatory diseases. However, severe adverse effects with biologics led to further research. Oral small molecule inhibitors of human TNF might evolve as novel therapeutic agents for the treatment of these diseases with a differentiated profile based on the selective TNFR1 inhibition and sparing of TNFR2 signaling.
WHAT QUESTION DID THIS STUDY ADDRESS?
This study investigated the safety and PK and PD characteristics following the administration of oral single and multiple ascending doses of balinatunfib, the first selective inhibitor of TNFR1 signaling, in healthy participants.
WHAT DOES THIS STUDY ADD TO OUR KNOWLEDGE?
Balinatunfib was well tolerated following a single dose up to 600 mg and repeated doses up to 300 mg BID. This study also demonstrated a favorable clinical PK and PD profile of balinatunfib.
HOW MIGHT THIS CHANGE CLINICAL PHARMACOLOGY OR TRANSLATIONAL SCIENCE?
The PK and PD properties observed in this study were in alignment with the expectations reported previously, confirming a successful preclinical‐to‐clinical translation; the target occupancy results also aid in making informed decisions on the dosage regimen in further clinical investigations of balinatunfib.
Tumor necrosis factor alpha (TNFα), a pleiotropic cytokine that regulates both proinflammatory and immunoregulatory functions, is crucial for the pathogenesis of many chronic autoimmune diseases, including psoriasis and rheumatoid arthritis. 1 , 2 , 3 It is expressed as soluble TNFα (sTNFα) and membrane‐bound TNFα (mTNFα), which regulate the functional activities of TNFα by engaging TNF receptor 1 (TNFR1) and TNF receptor 2 (TNFR2), respectively. 1 , 2 , 4 , 5 TNFR1 mediates cytotoxic and proinflammatory activities, while TNFR2 plays a role in the homeostatic activities of TNF. 1 , 2 , 4 , 5 , 6 , 7 , 8 TNFR2 signal is also crucial for the sustained activation of regulatory T cells and tissue repair. 9
Anti‐TNFα biologics represent a class of drugs that changed the clinical outcome for many patients with autoimmune diseases. 3 , 9 , 10 However, biologic TNF blockers cause side effects, such as injection site reactions, the development of anti‐drug antibodies limiting the duration of clinical response, and an increased risk of opportunistic and serious infections requiring an extended washout time in case of safety concerns, and they are perceived as inconvenient and uncomfortable as injectables. 11 , 12 This led to further investigations into developing an orally available, small molecule to target the TNFα pathway. 6 , 13
He et al. 14 were the first to describe the small molecule inhibitors of TNFα in 2005. In 2019, O'Connell et al. 13 described a series of small molecules based on the TNF trimer disruption mechanism, 14 wherein balinatunfib (SAR441566) was identified as a promising drug candidate. 13 , 15 These small molecules might offer advantages by avoiding biologic‐ and immunogenicity‐related adverse effects and loss of clinical efficacy, as well as by allowing a more convenient route of administration. 15 , 16 Development of neutralizing anti‐drug antibodies against anti‐TNF injectables is one of the main reasons for their loss of response in patients on those therapies. 16 As small molecules are expected to overcome immunogenicity‐related concerns, balinatunfib may exhibit a durable effect with less probability of loss of response compared to commercially available anti‐TNF agents.
Balinatunfib binds to a pocket in the center of the sTNFα trimer. 13 , 15 This results in the allosteric stabilization of a naturally occurring, asymmetric form of sTNFα that has an impaired capacity to engage TNFR1 and thereby inhibits TNFR1 signaling. 13 , 15 Balinatunfib demonstrated complete TNF occupancy and strong TNF inhibition in vitro, as well as antibody‐like efficacy in a collagen‐induced arthritis mouse model in vivo within a consistent range of balinatunfib concentrations (16 nM was the concentration leading to 90% occupancy of TNFα [OCC90], 35 nM the 50% inhibitory concentration [IC50], and 24 nM the average free efficacious exposure in mice). 15 In preclinical studies, balinatunfib demonstrated optimal pharmacokinetic (PK) properties including moderate to high bioavailability across animal species, low metabolic clearance (in human hepatocytes) with a direct intestinal elimination of parent compound (in a mass balance study), high tissue distribution, and high fraction unbound, making it a promising candidate for therapeutic use. 15 The preclinical pharmacology and toxicology data supported further advancement of balinatunfib into clinical trials as the first oral inhibitor of TNFR1 signaling to be administered in humans.
Herein, we report the safety, PK, and PD properties of balinatunfib following its first‐in‐human (FIH) administration of single and multiple ascending doses in healthy adult participants.
METHODS
Study design
This was a single‐center, phase I, FIH, double‐blind, randomized, placebo‐controlled SAD and MAD trial (EudraCT: 2020‐004416‐10), including a food interaction study. The SAD (in fasted condition) and MAD (in fasted and fed conditions) assessed the safety, tolerability, PK, and PD properties of balinatunfib. The effect of food on the PK of balinatunfib was also investigated in a two‐period, one‐sequence, non‐randomized, open‐label crossover design.
Population
This study included healthy male participants, with ages 18–55 years and a body mass index of 18–30 kg/m2. Only male volunteers were included in SAD and MAD due to pending characterization on reproductive and embryo/fetal development toxicity potential of balinatunfib at the time of study initiation. The participants who had normal vital signs, standard 12‐lead electrocardiogram (ECG) parameters at screening, and laboratory parameters within the normal range were included.
Randomization and treatment
SAD study
The participants (N = 48) were randomized at a 3:1 ratio (six verum and two placebo in each cohort) into six SAD cohorts to receive either balinatunfib (5–600 mg) or placebo orally in fasted conditions (Figure S1a ).
Food effect study
Eight participants received 200 mg of balinatunfib in fasted and fed (with a high‐fat meal) conditions in an open‐label, two‐way crossover design (Figure S1b ).
MAD study
The participants (N = 40) were randomized at a 4:1 ratio (eight verum and two placebo in each cohort) into four MAD cohorts to receive either balinatunfib (100–600 mg daily) or placebo (Figure S1c ). Cohort 1 received a dose of 100 mg balinatunfib or placebo once daily (QD) in the fasted state, and Cohorts 2–4 received a dose of 100, 200, or 300 mg balinatunfib or placebo twice daily (BID) in the fed state for 14 days.
All studies included a screening period of 2–28 days and a follow‐up period of 6–8 days. The dose escalation process in the SAD and MAD was based on the review of safety and PK data by the investigator.
Assessments
Safety and tolerability
The safety and tolerability of treatments were assessed throughout the studies by physical examination, clinical laboratory evaluation, vital signs, ECGs, and the assessment of adverse events (AEs), treatment‐emergent adverse events (TEAEs), including serious adverse events (SAEs), potentially clinically significant abnormalities (PCSAs), and adverse events of special interest (AESIs). The AESIs included alanine aminotransferase (ALT) increased (ALT ≥ 2 × Upper Limit of the Normal [ULN]), QT prolongation (QTcF ≥ 500 ms), photosensitivity (a Grade 2 and above AE due to sun exposure), pregnancy in the female partner, and symptomatic overdose. The AEs were coded using the latest version of the Medical Dictionary for Regulatory Activities (MedDRA) at the time of database lock (version 24.0 for the SAD study and version 24.1 for the MAD study).
Pharmacokinetics
During the SAD study, plasma samples were collected at pre‐dose and 1, 2, 3, 4, 6, 8, 12, 18, 24, 36, 48, 60, 72, and 96 hours post‐dose (plasma sampling for PK at 96 hours was performed only for dose levels 4–6) for the quantification of balinatunfib in plasma. The same sampling scheme was applied to the food effect study. During the MAD study, plasma samples were collected at pre‐dose and 8 hours post‐dose time points on Day 1; at pre‐dose and 3 hours post‐dose on Days 4, 7, and 12; at pre‐dose and up to 120 hours post‐dose for the last dose in the morning of Day 14. Urine samples were collected over a 24‐hour interval at steady state to assess the elimination of balinatunfib in urine. The plasma and urine samples were assayed using a validated and qualified liquid chromatography‐mass spectrometry/mass spectrometry (LC–MS/MS) method, respectively, with a lower limit of quantification (LLOQ) of 2 ng/mL in both matrices.
The PK parameters (Tables 3 and 4 ) were calculated by a non‐compartmental analysis using Phoenix WinNonlin version 8.1.
Table 3.
Pharmacokinetic parameters of balinatunfib in the SAD and food effect studies and statistical assessment of the food effect
| SAD study—summary of PK parameters: mean ± SD (geometric mean) [CV%] | |||||
|---|---|---|---|---|---|
| PK parameters | 20 mg Balinatunfib | 60 mg Balinatunfib | 180 mg Balinatunfib | 400 mg Balinatunfib | 600 mg Balinatunfib |
| N | 6 | 6 | 6 | 6 | 6 |
| C max (ng/mL) | 5.25 ± 1.24 | 21.0 ± 5.08 | 122 ± 43.7 | 285 ± 139 | 525 ± 206 |
| (5.12) [24] | (20.5) [24] | (117) [36] | (261) [49] | (483) [39] | |
|
t max a (h) |
5.00 | 2.50 | 2.50 | 3.00 | 3.00 |
| (3.00, 8.00) | (2.00, 6.00) | (1.00, 4.00) | (2.00, 4.00) | (3.00, 6.00) | |
|
t last a (h) |
18.05 | 48.00 | 96.21 | 96.16 | 96.01 |
| (12.18, 36.00) | (36.00, 72.72) | (72.02, 96.98) | (72.25, 96.43) | (96.00, 97.73) | |
|
AUClast (ng·h/mL) |
70.4 ± 35.9 | 344 ± 84.9 | 2,270 ± 720 | 4,400 ± 2,210 | 9,290 ± 3,440 |
| (62.8) [51] | (335) [25] | (2,170) [32] | (4,050) [50] | (8,570) [37] | |
|
AUC (ng·h/mL) |
101b ± NC | 420 ± 103 | 2,450 ± 782 | 4,580 ± 2,240 | 9,640 ± 3,540 |
| (NC) [NC] | (409) [25] | (2,330) [32] | (4,220) [49] | (8,900) [37] | |
|
t 1/2z (h) |
15.0c ± 7.21 | 21.6 ± 6.14 | 27.4 ± 4.74 | 24.7 ± 6.47 | 24.4 ± 5.43 |
| (13.6) [48] | (20.9) [28] | (27.1) [17] | (24.0) [26] | (23.9) [22] | |
| Food effect study—summary of PK parameters: mean ± SD (geometric mean) [CV%] | ||
|---|---|---|
| PK parameters | 200 mg Balinatunfib, Fasted | 200 mg Balinatunfib, Fed |
| N | 8 | 6d |
|
C max (ng/mL) |
123 ± 39.5 | 138 ± 48.1 |
| (119) [32] | (132) [35] | |
|
t max a (h) |
3.00 | 4.00 |
| (3.00, 6.00) | (2.00, 6.00) | |
|
t lag a (h) |
0.00 | 0.00 |
| (0.00, 0.00) | (0.00, 1.00) | |
|
AUClast (ng·h/mL) |
1,980 ± 527 | 2,310 ± 804 |
| (1,930) [27] | (2,210) [35] | |
|
AUC (ng·h/mL) |
2,060 ± 539 | 2,430 ± 815 |
| (2,010) [26] | (2,340) [33] | |
|
t 1/2z (h) |
22.5 ± 5.23 | 27.6 ± 4.84 |
| (21.9) [23] | (27.3) [18] | |
| Assessment of the food effect on C max, AUClast, and AUC—point estimates and 90% CI for the geometric mean ratio of food condition (fed vs. fasted) | |||
|---|---|---|---|
| Comparison | Parameter | Point estimate | 90% CI |
| Fed vs. fasted | C max | 1.14 | (1.07–1.22) |
| AUClast | 1.16 | (1.07–1.26) | |
| AUC | 1.18 | (1.09–1.27) | |
In the SAD study, all doses were administered under fasted conditions. The PK parameters were not calculable for any participant receiving a single dose of 5 mg balinatunfib, as all concentrations were below the LLOQ (2 ng/mL).
AUC, area under the plasma concentration–time curve from time 0 to infinity; AUClast, AUC from time 0 to the last measurable non‐zero concentration; CI, confidence interval; C max, maximum observed concentration in plasma; CV, coefficient of variation; LLOQ, lower limit of quantification; NC, not calculated; PK, pharmacokinetic; SAD, single ascending dose; SD, standard deviation; t lag, time delay between drug administration and the first quantifiable concentration; t last, time of the last measurable concentration; t max, time to the maximum observed concentration; t 1/2z, terminal half‐life.
Median (min, max).
n = 1, the percentage of AUC determined by extrapolation exceeded 30% for four participants; therefore, their AUC values were excluded from statistics. Additionally, AUC was not calculable for one participant because there were < 3 quantifiable concentrations occurring after C max in the PK profile.
n = 5; t1/2z and AUC were not calculable for one participant because there were < 3 quantifiable concentrations occurring after C max in the PK profile.
Two participants were withdrawn from the study following Period 1 (fasted) and had no PK samples collected in Period 2 (fed).
Table 4.
Pharmacokinetic parameters of balinatunfib in the MAD study
| Mean ± SD (geometric mean) [CV%] pharmacokinetic parameters for balinatunfib on Day 1 following first dosing | ||||
|---|---|---|---|---|
| PK parameters | Cohort 1: 100 mg QD (fasted) | Cohort 2: 100 mg BID (fed) | Cohort 3: 200 mg BID (fed) | Cohort 4: 300 mg BID (fed) |
| N | 8 | 8 | 8 | 8 |
|
C max (ng/mL) |
88.6 ± 34.0 | 42.6 ± 21.2 | 139 ± 43.9 | 278 ± 85.4 |
| (83.1) [38] | (38.1) [50] | (132) [32] | (268) [31] | |
|
t max a (h) |
3.00 (3.00, 3.00) | 6.00 (2.00, 8.00) | 5.00 (2.00, 6.00) | 4.00 (3.00, 6.00) |
|
C av (ng/mL) |
29.5 ± 9.33 | 30.4 ± 16.2 | 94.5 ± 29.5 | 190 ± 60.4 |
| (28.1) [32] | (27.0) [53] | (90.3) [31] | (182) [32] | |
|
AUC0‐12 (ng·h/mL) |
559 ± 194 | 364 ± 194 | 1,130 ± 354 | 2,280 ± 725 |
| (527) [35] | (324) [53] | (1,080) [31] | (2,180) [32] | |
|
AUC0‐24 b (ng·h/mL) |
708 ± 224 (674) [32] |
NA | NA | NA |
| Mean ± SD (geometric mean) [CV%] pharmacokinetic parameters for balinatunfib on Day 14 following multiple oral administration | ||||
|---|---|---|---|---|
| PK parameters | Cohort 1: 100 mg QD (fasted) | Cohort 2: 100 mg BID (fed) | Cohort 3: 200 mg BID (fed) | Cohort 4: 300 mg BID (fed) |
| N | 8 | 7f | 8 | 8 |
|
C max (ng/mL) |
161 ± 49.2 | 189 ± 86.3 | 547 ± 193 | 982 ± 261 |
| (153) [31] | (173) [46] | (511) [35] | (947) [27] | |
|
t max c (h) |
3.00 (2.00, 4.00) | 3.00 (1.00, 4.00) | 3.00 (2.00, 8.00) | 3.00 (2.00, 6.00) |
|
C trough (ng/mL) |
37.2 ± 11.5 | 136 ± 70.8 | 383 ± 163 | 676 ± 215 |
| (35.2) [31] | (122) [52] | (349) [43] | (639) [32] | |
|
C av (ng/mL) |
72.9 ± 19.6 | 155 ± 74.4 | 448 ± 167 | 806 ± 221 |
| (70.0) [27] | (141) [48] | (416) [37] | (774) [27] | |
|
FLrel (%) |
171 ± 34.1 | 46.9 ± 9.16 | 46.2 ± 12.3 | 48.0 ± 13.7 |
| (168) [20] | (46.1) [20] | (44.7) [27] | (46.1) [29] | |
|
AUC0‐tau (ng·h/mL) |
1,750 ± 471 | 1,860 ± 892 | 5,370 ± 2,010 | 9,670 ± 2,650 |
| (1,680) [27] | (1,690) [48] | (4,990) [37] | (9,290) [27] | |
|
t 1/2z (h) |
30.3 ± 8.43 | 23.8 ± 3.18g | 24.1 ± 3.28 | 21.7 ± 4.92 |
| (29.5) [28] | (23.6) [13] | (23.9) [14] | (21.3) [23] | |
|
CLss/F (L/h) |
62.5 ± 23.4 | 64.6 ± 28.2 | 43.7 ± 20.6 | 33.9 ± 12.7 |
| (59.5) [37] | (59.1) [44] | (40.1) [47] | (32.3) [37] | |
|
V z/F (L) |
2,700 ± 1,020 | 2,500 ± 1,270f | 1,590 ± 983 | 1,030 ± 299 |
| (2,530) [38] | (2,250) [51] | (1,380) [62] | (991) [29] | |
| R ac”Cmax” | 1.87 ± 0.400 | 4.77 ± 0.730 | 3.91 ± 0.612 | 3.62 ± 0.861 |
| (1.84) [21] | (4.72) [15] | (3.87) [16] | (3.53) [24] | |
| R ac | 2.52 ± 0.431 | 5.46 ± 0.951 | 4.65 ± 0.654 | 4.40 ± 1.22 |
| (2.50) [17] | (5.38) [17] | (4.60) [14] | (4.25) [28] | |
|
(%) |
9.07 ± 1.85 | 9.41 ± 4.66 | 11.9 ± 3.54 | 15.6 ± 4.40 |
| (8.91) [20] | (8.18) [50] | (11.4) [30] | (15.0) [28] | |
|
(L/h) |
5.53 ± 1.67 | 5.16 ± 2.10 | 4.62 ± 0.862 | 4.92 ± 0.929 |
| (5.30) [30] | (4.83) [41] | (4.55) [19] | (4.85) [19] | |
AUC0–tau, AUC to the end of the dosing period; AUC0–12, area under the plasmaconcentration‐time curve from time 0 to 12 hours post‐dose; AUC0–24, AUC from time 0 to 24 hours post‐dose; BID, twice daily; C av, average plasma concentration; CLss/F, apparent total body clearance after oral administration at steady state; CLR, renal clearance; C trough, concentration observed at the last planned time point prior to dosing; CV, coefficient of variation; Fe0–24, cumulative fraction of the dose excreted as unchanged parent in urine over the 24‐hour collection interval; FLrel, relative fluctuation; NA, not applicable; MAD, multiple ascending dose; PK, pharmacokinetic; QD, once daily; R ac, accumulation ratio; R ac“Cmax”, accumulation ratio based on C max; SD, standard deviation; V z/F, apparent volume of distribution.
Median (min, max).
Calculated by extrapolation.
Median (min, max).
24‐hour urine PK collection occurred on Day 13.
CLR was calculated using Day 14 AUC0‐24; for the BID cohorts, AUC0‐24 was calculated as AUC0‐tau*2.
One participant withdrew and did not have PK samples collected after Day 1.
n = 6; t 1/2z and V z/F for one participant were excluded from statistics, as the terminal elimination phase could not be adequately characterized; this participant's Day 14 concentration data starting at 18 hours post‐dose and onward were excluded because the participant received a second daily dose on Day 14 in error.
Pharmacodynamics
sTNFα target occupancy was assessed in the 400 and 600 mg dose cohorts in the SAD study and in all dose cohorts in the MAD study using an ex vivo stimulation method as a translational PD marker as described for anti‐TNF biologics. 17 For this purpose, blood samples were collected at pre‐dose and 3 hours post‐dose (~t max) in the SAD study, as well as at pre‐dose on Day 1 and pre‐dose and 3 hours post‐dose (~t max) on Day 14 in the MAD study. Stimulation was conducted with zymosan, and the levels of total TNFα and balinatunfib‐occupied TNFα were determined by Enzyme Linked Immunosorbent Assay to derive the percentage of occupied TNFα, using capture and detection antibodies as reported earlier. 18 , 19 The percent change in sTNFα target occupancy from baseline was evaluated for respective time points during the treatment period.
Statistical analysis
The safety analyses were performed using the safety population that included all participants who were exposed to balinatunfib. The TEAEs were summarized by primary system organ class (SOC), preferred term (PT), and dose levels with descriptive statistics.
The PK and PD analyses were performed using the PK and PD populations, respectively, which included all participants with no major or critical deviations related to balinatunfib administration or PK and PD measurement, and for whom the PK and PD data were sufficient and interpretable. In cases where the percentage of AUC determined by extrapolation exceeded 30%, the PK parameters AUC, CL/F, and Vz/F were excluded from descriptive and inferential statistics.
In both SAD and MAD studies, a dose proportionality assessment on C max and the respective AUC parameter was conducted across the investigated dose range using an empirical power model fitted on the log‐transformed scale. The individual time to steady state values following the QD and BID dose regimens of balinatunfib were determined by a nonlinear mixed effects model.
The differences in the PK characteristics between prandial conditions (fed vs. fasted) were assessed using a linear model on log‐transformed C max, AUClast, and AUC.
sTNFα occupancy, as raw data and percent change from baseline, was summarized by descriptive statistics by treatment group and scheduled time of measurement.
Ethics statement
The study protocol was reviewed and approved by the Institutional Ethics Committee (State Office for Health and Social Affairs, Office of the Ethics Committee, State of Berlin ‐ Germany) before the study was initiated. This study was conducted in accordance with the protocol and consensus ethical principles derived from international guidelines, including the Declaration of Helsinki and the International Council for Harmonization of Technical Requirements for Pharmaceuticals for Human Use (ICH) guidelines for Good Clinical Practice (GCP), and all applicable laws, rules, and regulations. All participants signed an informed consent form.
RESULTS
Participants
All 48 participants who were exposed to balinatunfib/placebo in the SAD study completed the study. Six of the eight participants in the food effect study completed the study, while two participants discontinued the study following Period 1 (one participant discontinued because of an AE (neutropenia) and the other because of a personal reason).
Out of the 40 participants who were exposed to balinatunfib/placebo in the MAD study, 39 completed the study, and one participant from the 100 mg BID cohort discontinued the study on Day 1 after the morning dose because of a personal reason.
In the SAD and MAD studies, the demographic and participant characteristics at baseline were similar between each balinatunfib dose cohort and placebo group, as well as compared to the eight white male participants in the food effect study (Table S1 ).
Safety and tolerability
SAD study
The incidence of TEAEs was comparable between different dose groups. Overall, five of 36 (13.9%) participants in the balinatunfib groups and two of 12 (16.7%) participants in the placebo group experienced at least one TEAE during the study. No participants experienced any Grade ≥ 3 TEAE, treatment‐emergent SAEs, TEAEs leading to permanent study discontinuation, or treatment‐emergent AESIs (Table 1 ). No QT interval corrected by Fridericia formula (QTcF)‐related PCSAs were observed in any of the tested cohorts in the SAD study (Table S3 ).
Table 1.
The number (%) of participants with TEAE(s) by primary SOC and PT (safety population) in the SAD and food effect studies
| SAD study | ||||||||||||||
|---|---|---|---|---|---|---|---|---|---|---|---|---|---|---|
| Primary SOC PT, n (%) | Placebo (N = 12) | Balinatunfib dose cohorts | ||||||||||||
| 5 mg (N = 6) | 20 mg (N = 6) | 60 mg (N = 6) | 180 mg (N = 6) | 400 mg (N = 6) | 600 mg (N = 6) | |||||||||
| n (%) | E | n (%) | E | n (%) | E | n (%) | E | n (%) | E | n (%) | E | n (%) | E | |
| Any event | 2 (16.7) | 2 | 0 | 0 | 0 | 0 | 1 (16.7) | 1 | 0 | 0 | 2 (33.3) | 4 | 2 (33.3) | 3 |
| Infections and infestations | 0 | 0 | 0 | 0 | 0 | 0 | 1 (16.7) | 1 | 0 | 0 | 0 | 0 | 1 (16.7) | 1 |
| Nasopharyngitis | 0 | 0 | 0 | 0 | 0 | 0 | 0 | 0 | 0 | 0 | 0 | 0 | 1 (16.7) | 1 |
| Tooth infection | 0 | 0 | 0 | 0 | 0 | 0 | 1 (16.7) | 1 | 0 | 0 | 0 | 0 | 0 | 0 |
| Psychiatric disorders | 0 | 0 | 0 | 0 | 0 | 0 | 0 | 0 | 0 | 0 | 0 | 0 | 1 (16.7) | 1 |
| Insomnia | 0 | 0 | 0 | 0 | 0 | 0 | 0 | 0 | 0 | 0 | 0 | 0 | 1 (16.7) | 1 |
| Nervous system disorders | 0 | 0 | 0 | 0 | 0 | 0 | 0 | 0 | 0 | 0 | 2 (33.3) | 3 | 0 | 0 |
| Dysgeusia | 0 | 0 | 0 | 0 | 0 | 0 | 0 | 0 | 0 | 0 | 2 (33.3) | 2 | 0 | 0 |
| Headache | 0 | 0 | 0 | 0 | 0 | 0 | 0 | 0 | 0 | 0 | 1 (16.7) | 1 | 0 | 0 |
| Gastrointestinal disorders | 1 (8.3) | 1 | 0 | 0 | 0 | 0 | 0 | 0 | 0 | 0 | 1 (16.7) | 1 | 1 (16.7) | 1 |
| Hypoaesthesia oral | 0 | 0 | 0 | 0 | 0 | 0 | 0 | 0 | 0 | 0 | 0 | 0 | 1 (16.7) | 1 |
| Abdominal pain | 0 | 0 | 0 | 0 | 0 | 0 | 0 | 0 | 0 | 0 | 1 (16.7) | 1 | 0 | 0 |
| Diarrhea | 1 (8.3) | 1 | 0 | 0 | 0 | 0 | 0 | 0 | 0 | 0 | 0 | 0 | 0 | 0 |
| Skin and subcutaneous tissue disorders | 1 (8.3) | 1 | 0 | 0 | 0 | 0 | 0 | 0 | 0 | 0 | 0 | 0 | 0 | 0 |
| Rash | 1 (8.3) | 1 | 0 | 0 | 0 | 0 | 0 | 0 | 0 | 0 | 0 | 0 | 0 | 0 |
| Food effect study | ||||
|---|---|---|---|---|
| Balinatunfib | ||||
| Primary SOC, PT, n (%) | 200 mg fed (N = 6) | 200 mg fasted (N = 8) | ||
| n (%) | E | n (%) | E | |
| Any event | 4 (66.7) | 6 | 5 (62.5) | 7 |
| Blood and lymphatic system disorders | 0 | 0 | 1 (12.5) | 1 |
| Neutropenia | 0 | 0 | 1 (12.5) | 1 |
| Nervous system disorders | 1 (16.7) | 1 | 2 (25.0) | 2 |
| Headache | 1 (16.7) | 1 | 1 (12.5) | 1 |
| Loss of consciousness | 0 | 0 | 1 (12.5) | 1 |
| Gastrointestinal disorders | 1 (16.7) | 1 | 2 (25.0) | 2 |
| Diarrhea | 1 (16.7) | 1 | 1 (12.5) | 1 |
| Flatulence | 0 | 0 | 1 (12.5) | 1 |
| Skin and subcutaneous tissue disorders | 0 | 0 | 1 (12.5) | 1 |
| Dry skin | 0 | 0 | 1 (12.5) | 1 |
| Musculoskeletal and connective tissue disorders | 2 (33.3) | 2 | 0 | 0 |
| Muscle tightness | 1 (16.7) | 1 | 0 | 0 |
| Tendonitis | 1 (16.7) | 1 | 0 | 0 |
| General disorders and administration site conditions | 1 (16.7) | 1 | 0 | 0 |
| Fatigue | 1 (16.7) | 1 | 0 | 0 |
| Investigations | 1 (16.7) | 1 | 1 (12.5) | 1 |
| Blood pressure orthostatic decreased | 1 (16.7) | 1 | 1 (12.5) | 1 |
E, events; PT, preferred term; SAD, single ascending dose; SOC, system organ class; TEAE, treatment‐emergent adverse event.
Food effect study
The number of participants with at least one TEAE was comparable between fasted and fed conditions (five of eight [62.5%] vs. four of six [66.7%] participants) in this cohort. One out of the eight participants reported a TEAE (neutropenia, a neutrophil count of 1.42 × 10⁹/L [normal range: 1.46–5.85 × 10⁹/L], Grade 2; related to balinatunfib; no clinical symptoms or any other laboratory changes indicative of an infection; recovered), leading to permanent intervention discontinuation and permanent study discontinuation during Period 1 (fasted condition). No participants experienced any Grade ≥ 3 TEAE, treatment‐emergent SAEs, or treatment‐emergent AESIs (Table 1 ).
MAD study
Overall, 12/32 (37.5%) participants in the balinatunfib groups and one (12.5%) participant in the placebo group experienced at least one TEAE during the study. No participants experienced any Grade ≥ 3 TEAE, treatment‐emergent SAEs, or TEAEs leading to permanent study intervention discontinuation or study discontinuation. AESIs (ALT increase) were reported in four participants in the balinatunfib groups (three [37.5%] participants in the 100 mg QD cohort with an ALT > 2 ULN and one [12.5%] participant in the 300 mg BID cohort); the event in the 300 mg cohort group was reported as an ALT > 3 ULN (181 IU/L on Day 18, 4 days after the last dose). This event, though asymptomatic and recovered on Day 21, was considered related to balinatunfib by the investigator (Table 2 ).
Table 2.
The number (%) of participants with TEAE(s) by primary SOC and PT (safety population) in the MAD study
| MAD study | ||||||||||
|---|---|---|---|---|---|---|---|---|---|---|
| Primary SOC, PT, n (%) | Placebo (N = 8) | Balinatunfib dose cohorts | ||||||||
| 100 mg QD (N = 8) | 100 mg BID (N = 8) | 200 mg BID (N = 8) | 300 mg BID (N = 8) | |||||||
| n (%) | E | n (%) | E | n (%) | E | n (%) | E | n (%) | E | |
| Any event | 1 (12.5) | 1 | 4 (50.0) | 9 | 2 (25.0) | 3 | 4 (50.0) | 7 | 2 (25.0) | 3 |
| Nervous system disorders | 1 (12.5) | 1 | 1 (12.5) | 1 | 0 | 0 | 1 (12.5) | 1 | 0 | 0 |
| Dysgeusia | 0 | 0 | 0 | 0 | 0 | 0 | 1 (12.5) | 1 | 0 | 0 |
| Headache | 1 (12.5) | 1 | 1 (12.5) | 1 | 0 | 0 | 0 | 0 | 0 | 0 |
| Respiratory, thoracic, and mediastinal disorders | 0 | 0 | 0 | 0 | 2 (25.0) | 2 | 2 (25.0) | 2 | 0 | 0 |
| Nasal dryness | 0 | 0 | 0 | 0 | 0 | 0 | 2 (25.0) | 2 | 0 | 0 |
| Oropharyngeal pain | 0 | 0 | 0 | 0 | 1 (12.5) | 1 | 0 | 0 | 0 | 0 |
| Sneezing | 0 | 0 | 0 | 0 | 1 (12.5) | 1 | 0 | 0 | 0 | 0 |
| Gastrointestinal disorders | 0 | 0 | 2 (25.0) | 3 | 0 | 0 | 1 (12.5) | 1 | 1 (12.5) | 2 |
| Abdominal pain | 0 | 0 | 1 (12.5) | 1 | 0 | 0 | 0 | 0 | 1 (12.5) | 1 |
| Constipation | 0 | 0 | 0 | 0 | 0 | 0 | 0 | 0 | 1 (12.5) | 1 |
| Diarrhea | 0 | 0 | 2 (25.0) | 2 | 0 | 0 | 1 (12.5) | 1 | 0 | 0 |
| Skin and subcutaneous tissue disorders | 0 | 0 | 0 | 0 | 0 | 0 | 2 (25.0) | 2 | 0 | 0 |
| Dry skin | 0 | 0 | 0 | 0 | 0 | 0 | 2 (25.0) | 2 | 0 | 0 |
| Musculoskeletal and connective tissue disorders | 0 | 0 | 1 (12.5) | 1 | 0 | 0 | 0 | 0 | 0 | 0 |
| Neck pain | 0 | 0 | 1 (12.5) | 1 | 0 | 0 | 0 | 0 | 0 | 0 |
| Reproductive system and breast disorders | 0 | 0 | 0 | 0 | 1 (12.5) | 1 | 0 | 0 | 0 | 0 |
| Testicular mass | 0 | 0 | 0 | 0 | 1 (12.5) | 1 | 0 | 0 | 0 | 0 |
| General disorders and administration site conditions | 0 | 0 | 0 | 0 | 0 | 0 | 1 (12.5) | 1 | 0 | 0 |
| Medical device site reaction | 0 | 0 | 0 | 0 | 0 | 0 | 1 (12.5) | 1 | 0 | 0 |
| Investigations | 0 | 0 | 3 (37.5) | 3 | 0 | 0 | 0 | 0 | 1 (12.5) | 1 |
| Alanine aminotransferase increased | 0 | 0 | 3 (37.5) | 3 | 0 | 0 | 0 | 0 | 1 (12.5) | 1 |
| Injury, poisoning, and procedural complications | 0 | 0 | 1 (12.5) | 1 | 0 | 0 | 0 | 0 | 0 | 0 |
| Wound | 0 | 0 | 1 (12.5) | 1 | 0 | 0 | 0 | 0 | 0 | 0 |
BID, twice daily; MAD, multiple ascending dose; QD, once daily; PT, preferred term; SOC, system organ class; TEAE, treatment‐emergent adverse event.
A few PCSAs were observed in clinical laboratory parameters, with no notable differences across the balinatunfib and placebo groups. However, none of the PCSAs were considered clinically relevant by the investigator, except for the event of ALT increase reported in the 300 mg BID cohort. No clinically meaningful findings were reported in the vital signs' measurements or ECG assessments (no PCSAs for QTcF > 450 ms and/or change from baseline QTc > 60 ms) related to safety in this study. QTcF‐related PCSA's with an increase from baseline of 30–60 msec were observed in four participants with the highest dose tested (300 mg BID cohort) in the MAD study (Table S3 ).
Overall, all single and repeated oral doses of balinatunfib were well tolerated by all participants. No safety issues were found throughout the studies.
Pharmacokinetics
The PK results were consistent across the SAD, MAD, and food effect studies, supporting both QD and BID dosing.
SAD and food effect study
Balinatunfib concentrations at the 5 mg dose level were below the LLOQ (2 ng/mL). In the food effect study, two participants withdrew from the study following Period 1 (fasted condition) and had no PK samples collected in Period 2 (fed condition).
The mean (+SD) plasma concentration–time profiles of balinatunfib following a single oral administration at different dose levels are depicted in Figure 1 a . A summary of the PK parameters for the SAD and food (high‐fat meal) effect studies is provided in Table 3 .
Figure 1.
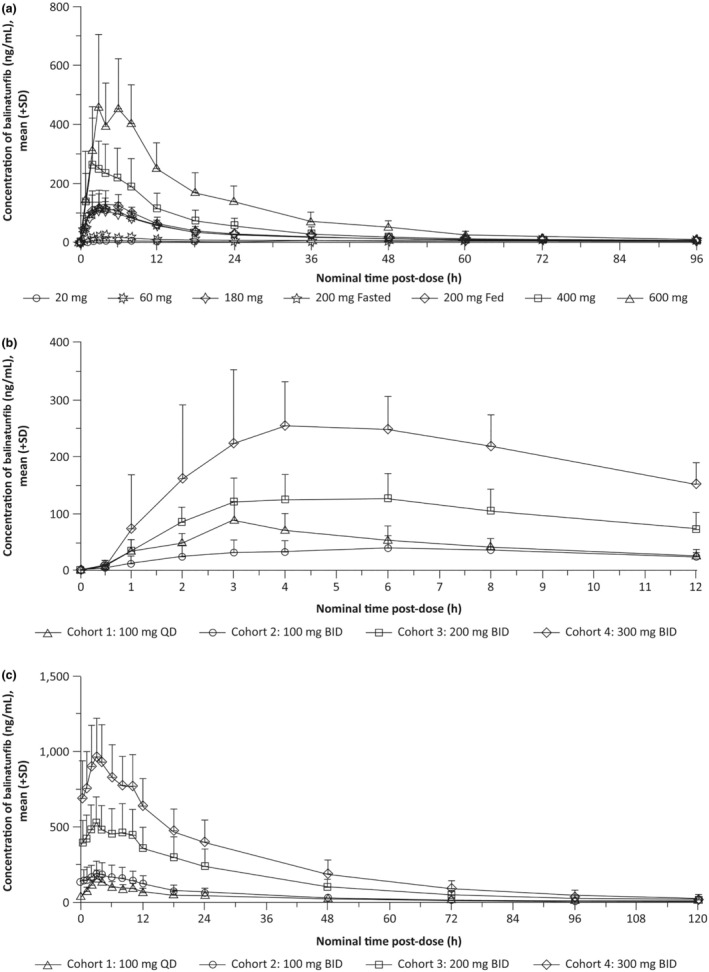
Mean (+SD) plasma concentrations of balinatunfib following (a) single ascending doses of balinatunfib in the SAD study, and (b) multiple ascending doses of balinatunfib on Day 1 (first dose) and (c) on Day 14 in the MAD study.
Balinatunfib was administered in the fasted state for Cohort 1 and in the fed state for Cohorts 2 through 4 in the MAD study (panels b and c). MAD, multiple ascending dose; SAD, single ascending dose; SD, standard deviation.
Over the dose range of 20–600 mg balinatunfib, AUCs and C max increased supra‐proportionally, with the slopes (90% CIs) for C max, AUClast, and AUC being 1.34 (1.25–1.43), 1.43 (1.32–1.53), and 1.29 (1.15–1.43), respectively. This effect was predominant for low doses and less pronounced for high doses ≥ 180 mg (Table S2 ). Dose‐normalized geometric means with 90% CIs for C max and AUClast are shown in Figure 2 .
Figure 2.
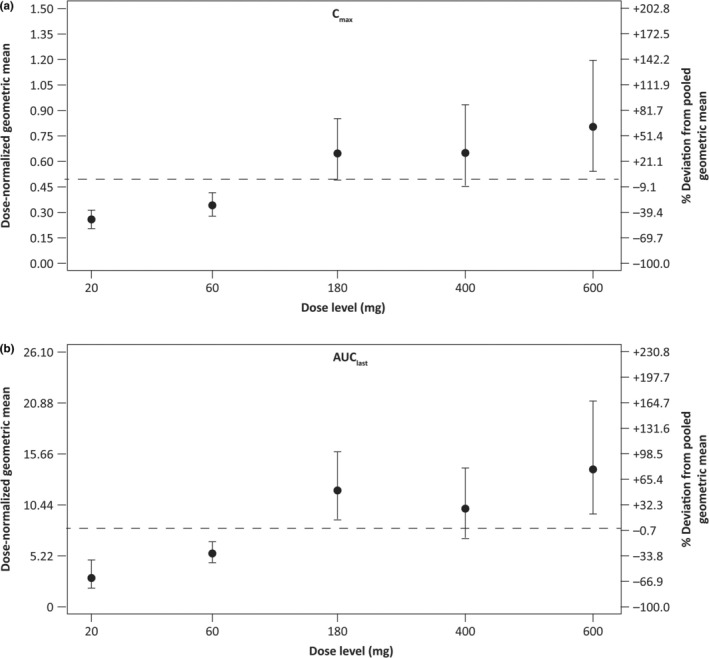
Dose proportionality assessment in the SAD study. Dose‐normalized geometric means with 90% CIs for (a) C max and (b) AUClast. AUC, area under the plasma concentration–time curve; AUClast, AUC from time 0 to the last measurable non‐zero concentration; CI, confidence interval; C max, maximum observed concentration in plasma; SAD, single ascending dose.
In the fed condition, the maximum plasma concentrations were obtained 1 hour later compared to the fasted state. No lag time was observed for both dietary conditions. C max, AUClast, and AUC were similar between the fasted and fed states; i.e., only 14%, 16%, and 18% higher, respectively, in the fed state than in the fasted state (Table 3 ).
MAD study
The mean (+SD) plasma concentration–time profiles of balinatunfib following the first administration on Day 1 and multiple oral administrations for 14 days are shown in Figure 1 b,c , respectively. The PK parameters of balinatunfib following the first dose (Day 1) and repeated doses (Day 14) are summarized in Table 4 .
Following both first and multiple administrations over the dose range of 100–300 mg BID balinatunfib in the fed state, C max and AUC0–12h increased supra‐proportionally with slopes (90% CIs) of 1.78 (1.48–2.07) and 1.74 (1.44–2.03) for Day 1, and 1.55 (1.24–1.86) and 1.55 (1.23–1.87) for Day 14. Dose‐normalized geometric means with 90% CIs for C max and AUC0–12h are depicted in Figure S2 for Day 1 and in Figure S3 for Day 14.
The time to steady state (90% CI) was 5.82 (5.61–5.82) days following QD dosing in the fasted condition and 5.45 (5.36–5.92) days following BID dosing in the fed condition.
The fraction of the dose excreted in the urine as unchanged drug over a 24‐hour interval on Day 13 was low, ranging from 9.07% to 15.6% across the investigated range of 100–400 mg total daily dose.
Pharmacodynamics
sTNFα target occupancy was determined as a translational PD marker using an ex vivo stimulation method 18 and evaluated based on the available information from anti‐TNF antibodies 17 : In the SAD study, complete occupancy (~100%) was observed in the 400 mg and 600 mg dose cohorts at 3 hours after dosing. In the placebo group, no difference was seen in the level of sTNFα target occupancy between baseline (4.9%) and 3 hours (5.2%) post‐dose (Table 5 ). In the MAD study also, very high occupancy (95%–100%) was observed in all cohorts measured on Day 14 at pre‐dose and 3 hours post‐dose. In the placebo group, no difference was observed in the levels of sTNFα target occupancy between baseline and Day 14 (Table 5 ).
Table 5.
sTNFα occupancy (%) in the SAD and MAD studies
| N | Mean | SD | SEM | Median | Min | Max | |
|---|---|---|---|---|---|---|---|
| SAD study | |||||||
| Placebo | |||||||
| Baseline | 4 | 4.9 | 2.5 | 1.2 | 4.4 | 3.0 | 8.0 |
| D1 3 h | 4 | 5.2 | 2.2 | 1.1 | 4.6 | 3.0 | 8.0 |
| Balinatunfib 400 mg | |||||||
| Baseline | 6 | 6.3 | 0.5 | 0.2 | 6.3 | 5.0 | 7.0 |
| D1 3 h | 6 | 102.2 | 7.5 | 3.0 | 105.3 | 89.0 | 109.0 |
| Balinatunfib 600 mg | |||||||
| Baseline | 6 | 3.3 | 1.1 | 0.5 | 3.4 | 1.0 | 4.0 |
| D1 3 h | 6 | 109.3 | 8.1 | 3.3 | 109.2 | 97.0 | 119.0 |
| MAD study | |||||||
| Placebo | |||||||
| Baseline | 8 | 2.8 | 0.8 | 0.3 | 2.7 | 2.0 | 4.0 |
| D14 0 h | 8 | 2.5 | 0.4 | 0.1 | 2.6 | 2.0 | 3.0 |
| D14 3 h | 8 | 2.6 | 0.5 | 0.2 | 2.5 | 2.0 | 3.0 |
| Balinatunfib 100 mg QD | |||||||
| Baseline | 8 | 3.8 | 2.7 | 1.0 | 2.8 | 2.0 | 9.0 |
| D14 0 h | 8 | 95.0 | 9.4 | 3.3 | 96.8 | 83.0 | 109.0 |
| D14 3 h | 8 | 97.2 | 6.2 | 2.2 | 98.4 | 85.0 | 105.0 |
| Balinatunfib 100 mg BID | |||||||
| Baseline | 7 | 2.6 | 0.6 | 0.2 | 2.9 | 2.0 | 3.0 |
| D14 0 h | 7 | 103.1 | 9.2 | 3.5 | 104.0 | 85.0 | 116.0 |
| D14 3 h | 7 | 104.9 | 5.0 | 1.9 | 105.3 | 97.0 | 111.0 |
| Balinatunfib 200 mg BID | |||||||
| Baseline | 8 | 3.9 | 1.0 | 0.34 | 3.8 | 3.0 | 5.0 |
| D14 0 h | 8 | 101.1 | 1.8 | 0.62 | 101.8 | 97.0 | 103.0 |
| D14 3 h | 8 | 105.2 | 6.9 | 2.43 | 106.6 | 91.0 | 114.0 |
| Balinatunfib 300 mg BID | |||||||
| Baseline | 8 | 2.4 | 0.5 | 0.16 | 2.2 | 2.0 | 3.0 |
| D14 0 h | 8 | 101.3 | 7.0 | 2.48 | 101.8 | 87.0 | 110.0 |
| D14 3 h | 8 | 99.8 | 16.4 | 5.81 | 102.8 | 63.0 | 117.0 |
BID, twice daily; D, day; h, hour; MAD, multiple ascending dose; QD, once daily; SAD, single ascending dose; SD, standard deviation; SEM, standard error of the mean; TNFα, tumor necrosis factor alpha; sTNFα, soluble TNFα.
DISCUSSION
Balinatunfib is an orally administered, small molecule targeting the TNF pathway by inhibiting TNFR1 signaling. This FIH study evaluated the safety, tolerability, and PK and PD of single and multiple ascending doses of balinatunfib in healthy adult male participants. Balinatunfib was well tolerated in healthy participants up to a 600 mg single and total daily dose for up to 14 days.
A starting dose of 5 mg was selected in the SAD study based on balinatunfib plasma exposures observed pre‐clinically at the no‐observed‐adverse‐effect level in the most sensitive species in a 3‐month general toxicity study and the lowest predicted human clearance using allometric scaling (data not shown). The dose escalation in the SAD study was based on the review of safety and PK data from previous doses and stopped at 600 mg, a dose level that was anticipated and confirmed to have reached a full biological effect without any safety concerns.
The food effect was investigated at a 200 mg single dose, half of the clinically well‐tolerated dose determined in the fasted condition at that stage. The dose levels in the MAD study were selected based on the available safety, tolerability, and PK data from the SAD and food effect studies.
No serious or severe TEAEs or AESIs were reported in the SAD or the food effect study, except for one participant who reported a Grade 2 event of neutropenia that led to treatment discontinuation in the food effect study as per the protocol‐defined criteria and was not associated with any clinical symptoms. No other findings based on clinical chemistry, urinalysis, vital signs' parameters, or ECG assessments were clinically meaningful in both studies. In the MAD study, no events leading to treatment discontinuation and no serious or severe TEAEs were observed. AESIs (ALT increase) were observed in four participants in the MAD cohorts; the ALT increase was reversible without any dose dependency, and examinations (hepatobiliary ultrasonography and recommended laboratory parameters per the protocol) revealed no abnormalities. QTcF‐related PCSA observed with the highest dose cohort in the MAD study suggested dose‐dependent effects that require further investigation according to regulatory guidelines. 20 Overall, balinatunfib was well tolerated in all three studies. None of the major AEs (e.g., severe infections) associated with anti‐TNF biologics (infliximab, etanercept, adalimumab, certolizumab, and golimumab) 10 were observed, suggesting a favorable safety profile of balinatunfib in this FIH study.
Following oral administration in the healthy participants, balinatunfib was steadily absorbed with a median t max of 2.5–5.0 hours. The apparent volume of distribution was high (> 1,000 L), and a minor fraction of the administered dose was found as unchanged drug excreted in urine (9.1%–15.6% within 24 hours at steady state). This is in line with the reported preclinical PK data of balinatunfib, 15 suggesting that, in contrast to anti‐TNF biologics, the compound can bind TNF intracellularly and is likely mainly excreted via feces.
The mean terminal half‐life (t 1/2z) was comparable across the investigated dose range following single and repeated oral administration of balinatunfib, ranging from about 22 to 30 hours. Based on % coefficient of variation (CV), low‐to‐moderate total variability was noted for AUClast, AUC, and C max, with values ranging from 25% to 51%.
The time to steady state of approximately 5 days and the observed accumulation of 2.52‐fold after QD dosing and 4.40‐ to 5.46‐fold after BID dosing are in line with the expectations based on the single‐dose data.
The increases in the systemic exposure (C max, AUC, and AUC0–tau) were greater than dose proportional following single (20–180 mg, fasted) and repeated oral administration (100–300 mg BID, fed state). Between the 180 and 600 mg single doses in the fasted condition, there appeared to be little deviation from dose proportionality. According to in vitro studies, balinatunfib is a substrate of active transport by P‐glycoprotein (P‐gp). 13 Contribution and saturation of P‐gp‐mediated intestinal efflux might be a potential reason for the supra‐proportional exposure increase observed in healthy participants. Taking the totality of preclinical 15 and clinical data into account, it seems unlikely that P‐gp mediated efflux might markedly restrict bioavailability at the therapeutically relevant doses.
Following a single 200 mg oral dose, exposure to SAR441566 was slightly increased in the presence of food (Table 3 ), which is considered not clinically relevant given the narrow confidence interval of the effect (upper bound < 1.30), the low‐to‐moderate PK variability, and the good safety profile up to the highest dose tested in the MAD under fed conditions.
The consistent PK characteristics for different dosing regimens and the negligible impact of a high‐fat meal on balinatunfib bioavailability suggest that both QD and BID dosing regimens, regardless of food intake, may be adequate for further clinical development.
The evaluation of sTNFα target occupancy indicated an interaction of balinatunfib with sTNFα at the doses tested in the SAD and MAD studies. This was in alignment with the suggested mechanism of action of balinatunfib, which is expected to act via binding to the center of the sTNFα trimer at low nanomolar concentrations. 13 , 15 Based on anti‐TNF antibody data reported in the literature, 17 the observed TNF occupancy at all doses in the MAD study is expected to be clinically relevant for efficacy in many immune‐mediated diseases. In a previous work, we predicted the TNFα occupancy using a quantitative systems pharmacology model 15 which demonstrated that full TNFα occupancy (achieved by anti‐TNF biologics) can be reached with the high doses selected for SAD/MAD, even if TNF levels are higher in patients. While TNFα levels in the circulation are similar in patients and healthy volunteers, 21 there seem to be higher levels of TNFα in inflamed tissues. Depending on the study and assay used, a meta‐analysis showed a two‐fold difference based on median TNFα levels in synovial fluid compared to blood in selected arthritic diseased populations (Table S4 ). 22 , 23 , 24 , 25 , 26 , 27 , 28 , 29 , 30 , 31 , 32 , 33 , 34 Of note, TNF secretion was stimulated ex vivo in the present occupancy assay, mimicking TNFα levels in inflamed tissues. Therefore, similar TNF occupancy results can be expected with the same doses of balinatunfib when administered in patients.
Overall, the PK and PD results were consistent across the studies reported herein and in alignment with the expectation based on in vitro, animal, and in silico data reported previously. 15
These studies have certain limitations. The cohort size was relatively small in both studies but usual for FIH studies. As these studies were conducted in healthy participants, ex vivo stimulated assays were performed to analyze the target occupancy after clinical treatment with balinatunfib. Further, the target occupancy evaluation was performed using only the high doses in the SAD study. Hence, the dose–response relationship could not be fully elucidated from these investigations. The dose–response relationship will be investigated in further studies in patients, including efficacy read‐out, since target occupancy may not linearly translate into clinical response. Nevertheless, the very high and comparable target occupancy observed at time points corresponding to C trough and C max of balinatunfib across all doses in the MAD study suggests that target saturation can be achieved at the selected dose regimens throughout the dosing interval.
The advantages of orally bioavailable small molecules such as balinatunfib over protein/peptides 35 , 36 combined with favorable clinical pharmacology properties justify the advancement of balinatunfib into further clinical studies. Overall, these studies demonstrated that orally administered balinatunfib was well tolerated and achieved ~100% target occupancy in humans at feasible dose regimens, including both QD and BID dosing. The preclinical‐to‐clinical translation was proven successful for this first oral small molecule inhibitor of TNFR1 signaling that has entered into clinical development for the treatment of TNF‐mediated autoimmune diseases. Currently, balinatunfib is under clinical investigation for the treatment of patients with Crohn's disease 37 and Rheumatoid Arthritis, among other inflammatory diseases. 38
FUNDING
This study was sponsored by Sanofi.
CONFLICTS OF INTEREST
N.N., F.R., D.W., M.R., M.K., F.S., A.L., A.K., L.P., M.W., and M.A.N.: Employees of Sanofi and may hold stocks/stock options in the company. J.G.: Was an employee of Sanofi at the time this study was conducted and may hold stocks/stock options in the company. Currently, he is an employee of Provadis School of International Management and Technology, Frankfurt, Germany. F.‐D.W.: Declared no competing interests for this work.
AUTHOR CONTRIBUTIONS
N.N. and M.A.N. wrote the manuscript; N.N., M.A.N., F.R., and D.W. designed the research; F.‐D.W. and N.N. performed the research; N.N., M.A.N., M.K., J.G., L.P., M.R., A.L., F.S., A.K., and M.W. analyzed the data.
Supporting information
Data S1
ACKNOWLEDGMENTS
Balinatunfib (SAR441566) was identified in a research collaboration with UCB. The authors acknowledge Agnès Tardat and Sandrine Logerot, from Sanofi, for their operational support during the study conduct. Medical writing support for this manuscript was provided by Sindhu Doppalapudi, PhD, from Sanofi, according to the Good Publication Practice guidelines.
DATA AVAILABILITY STATEMENT
Qualified researchers may request access to patient‐level data and related study documents, including the clinical study report, study protocol with any amendments, blank case report form, statistical analysis plan, and dataset specifications. Participant‐level data will be anonymized, and study documents will be redacted to protect the privacy of the trial participants. Further details on Sanofi's data‐sharing criteria, eligible studies, and process for requesting access can be found at: https://www.vivli.org/.
References
- 1. Jang, D.I. et al. The role of tumor necrosis factor alpha (TNF‐α) in autoimmune disease and current TNF‐α inhibitors in therapeutics. Int. J. Mol. Sci. 22, 2719–2734 (2021). [DOI] [PMC free article] [PubMed] [Google Scholar]
- 2. Kalliolias, G.D. & Ivashkiv, L.B. TNF biology, pathogenic mechanisms and emerging therapeutic strategies. Nat. Rev. Rheumatol. 12, 49–62 (2016). [DOI] [PMC free article] [PubMed] [Google Scholar]
- 3. Monaco, C. , Nanchahal, J. , Taylor, P. & Feldmann, M. Anti‐TNF therapy: past, present and future. Int. Immunol. 27, 55–62 (2015). [DOI] [PMC free article] [PubMed] [Google Scholar]
- 4. Dömling, A. & Li, X. TNF‐α: the shape of small molecules to come? Drug Discov. Today 27, 3–7 (2022). [DOI] [PubMed] [Google Scholar]
- 5. Edmunds, J. Untangling perception and reality: small‐molecule TNF‐α inhibitors. In 2019 medicinal chemistry reviews, Vol. 54 (ed. Bronson, J.J. ) 127–144 (Medicinal Chemistry Division of the American Chemical Society, Boston, MA, 2019). [Google Scholar]
- 6. Chédotal, H. et al. Small‐molecule modulators of tumor necrosis factor signaling. Drug Discov. Today 28, 103575 (2023). [DOI] [PubMed] [Google Scholar]
- 7. Zhang, H. & Xiao, W. TNFR1 and TNFR2 differentially mediate TNF‐α‐induced inflammatory responses in rheumatoid arthritis fibroblast‐like synoviocytes. Cell Biol. Int. 41, 415–422 (2017). [DOI] [PubMed] [Google Scholar]
- 8. Zhang, N. , Wang, Z. & Zhao, Y. Selective inhibition of tumor necrosis factor receptor‐1 (TNFR1) for the treatment of autoimmune diseases. Cytokine Growth Factor Rev. 55, 80–85 (2020). [DOI] [PubMed] [Google Scholar]
- 9. Salomon, B.L. Insights into the biology and therapeutic implications of TNF and regulatory T cells. Nat. Rev. Rheumatol. 17, 487–504 (2021). [DOI] [PubMed] [Google Scholar]
- 10. Willrich, M.A. , Murray, D.L. & Snyder, M.R. Tumor necrosis factor inhibitors: clinical utility in autoimmune diseases. Transl. Res. 165, 270–282 (2015). [DOI] [PubMed] [Google Scholar]
- 11. Megna, M. et al. Psoriatic disease treatment nowadays: unmet needs among the “jungle of biologic drugs and small molecules”. Clin. Rheumatol. 37, 1739–1741 (2018). [DOI] [PubMed] [Google Scholar]
- 12. Murdaca, G. , Colombo, B.M. , Cagnati, P. , Gulli, R. , Spanò, F. & Puppo, F. Update upon efficacy and safety of TNF‐α inhibitors. Expert Opin. Drug Saf. 11, 1–5 (2012). [DOI] [PubMed] [Google Scholar]
- 13. O'Connell, J. et al. Small molecules that inhibit TNF signalling by stabilising an asymmetric form of the trimer. Nat. Commun. 10, 5795 (2019). [DOI] [PMC free article] [PubMed] [Google Scholar]
- 14. He, M.M. et al. Small‐molecule inhibition of TNF‐α. Science 310, 1022–1025 (2005). [DOI] [PubMed] [Google Scholar]
- 15. Vugler, A. et al. An orally available small molecule that targets soluble TNF to deliver anti‐TNF biologic‐like efficacy in rheumatoid arthritis. Front. Pharmacol. 13, 1037983 (2022). [DOI] [PMC free article] [PubMed] [Google Scholar]
- 16. Kalden, J.R. & Schulze‐Koops, H. Immunogenicity and loss of response to TNF inhibitors: implications for rheumatoid arthritis treatment. Nat. Rev. Rheumatol. 13, 707–718 (2017). [DOI] [PubMed] [Google Scholar]
- 17. Tani, K. , Takayanagi, R. , Yokoyama, H. & Yamada, Y. Theoretical analysis of efficacy of biological agent for rheumatoid arthritis based on target molecular binding occupancy. Rheumatol. Int. 33, 1791–1795 (2013). [DOI] [PubMed] [Google Scholar]
- 18. Hickford, E.S. et al. Target occupancy biomarker assay development using a conformation‐selective antibody against small‐molecule‐bound TNF. Bioanalysis 15, 343–359 (2023). [DOI] [PubMed] [Google Scholar]
- 19. Lightwood, D.J. et al. A conformation‐selective monoclonal antibody against a small molecule‐stabilised signalling‐deficient form of TNF. Nat. Commun. 12, 583 (2021). [DOI] [PMC free article] [PubMed] [Google Scholar]
- 20. ICH E14 clinical evaluation of QT/QTc interval prolongation and proarrhythmic potential for non‐antiarrhythmic drugs ‐ scientific guideline. ICH E14 Clinical evaluation of QT/QTc interval prolongation and proarrhythmic potential for non‐antiarrhythmic drugs ‐ Scientific guideline|European Medicines Agency (EMA). Accessed 14 February 14, 2025.
- 21. Berkhout, L.C. et al. Dynamics of circulating TNF during adalimumab treatment using a drug‐tolerant TNF assay. Sci. Transl. Med. 11, eaat3356 (2019). [DOI] [PubMed] [Google Scholar]
- 22. Wright, H.L. , Bucknall, R.C. , Moots, R.J. & Edwards, S.W. Analysis of SF and plasma cytokines provides insights into the mechanisms of inflammatory arthritis and may predict response to therapy. Rheumatology (Oxford) 51, 451–459 (2012). [DOI] [PubMed] [Google Scholar]
- 23. Perry, M.G. , Jessop, D.S. , Hunt, L.P. , Sharif, M. & Kirwan, J.R. Overnight variations in IL‐6 in synovial fluid and plasma in patients with active rheumatoid arthritis. Int. J. Clin. Rheumtol. 5, 593–600 (2010). [Google Scholar]
- 24. Andrés Cerezo, L. et al. Calgizzarin (S100A11): a novel inflammatory mediator associated with disease activity of rheumatoid arthritis. Arthritis Res. Ther. 19, 79 (2017). [DOI] [PMC free article] [PubMed] [Google Scholar]
- 25. Ng, C.T. et al. Synovial tissue hypoxia and inflammation in vivo. Ann. Rheum. Dis. 69, 1389–1395 (2010). [DOI] [PMC free article] [PubMed] [Google Scholar]
- 26. Cañete, J.D. et al. Differential Th1/Th2 cytokine patterns in chronic arthritis: interferon gamma is highly expressed in synovium of rheumatoid arthritis compared with seronegative spondyloarthropathies. Ann. Rheum. Dis. 59, 263–268 (2000). [DOI] [PMC free article] [PubMed] [Google Scholar]
- 27. Horiuchi, T. et al. The increase of parathyroid hormone‐related peptide and cytokine levels in synovial fluid of elderly rheumatoid arthritis and osteoarthritis. Endocr. J. 46, 643–649 (1999). [DOI] [PubMed] [Google Scholar]
- 28. Ribbens, C. et al. Increased synovial fluid levels of interleukin‐12, sCD25 and sTNF‐RII/sTNF‐RI ratio delineate a cytokine pattern characteristic of immune arthropathies. Eur. Cytokine Netw. 11, 669–676 (2000). [PubMed] [Google Scholar]
- 29. Lettesjö, H. et al. Synovial fluid cytokines in patients with rheumatoid arthritis or other arthritic lesions. Scand. J. Immunol. 48, 286–292 (1998). [DOI] [PubMed] [Google Scholar]
- 30. Westacott, C.I. , Whicher, J.T. , Barnes, I.C. , Thompson, D. , Swan, A.J. & Dieppe, P.A. Synovial fluid concentration of five different cytokines in rheumatic diseases. Ann. Rheum. Dis. 49, 676–681 (1990). [DOI] [PMC free article] [PubMed] [Google Scholar]
- 31. Avrămescu, C. , Vere, C.C. , Mărgăritescu, C. , Turculeanu, A. , Bălăşoiu, M. & Rogoz, S. Cytokinin panel in rheumatoid arthritis and correlation with histological patterns of synovitis ‐‐ active type of disease. Romanian J. Morphol. Embryol. 46, 87–92 (2005). [PubMed] [Google Scholar]
- 32. Manicourt, D.H. , Triki, R. , Fukuda, K. , Devogelaer, J.P. , Nagant de Deuxchaisnes, C. & Thonar, E.J. Levels of circulating tumor necrosis factor alpha and interleukin‐6 in patients with rheumatoid arthritis. Relationship to serum levels of hyaluronan and antigenic keratan sulfate. Arthritis Rheum. 36, 490–499 (1993). [DOI] [PubMed] [Google Scholar]
- 33. Chen, D.Y. , Chen, Y.M. , Chen, H.H. , Hsieh, C.W. , Lin, C.C. & Lan, J.L. Increasing levels of circulating Th17 cells and interleukin‐17 in rheumatoid arthritis patients with an inadequate response to anti‐TNF‐α therapy. Arthritis Res. Ther. 13, R126 (2011). [DOI] [PMC free article] [PubMed] [Google Scholar]
- 34. Barrera, P. , Joosten, L.A. , den Broeder, A.A. , van de Putte, L.B. , van Riel, P.L. & van den Berg, W.B. Effects of treatment with a fully human anti‐tumour necrosis factor alpha monoclonal antibody on the local and systemic homeostasis of interleukin 1 and TNFalpha in patients with rheumatoid arthritis. Ann. Rheum. Dis. 60, 660–669 (2001). [DOI] [PMC free article] [PubMed] [Google Scholar]
- 35. Barclay, N. , Tarallo, M. , Hendrikx, T. & Marett, S. PMS78 ‐ patient preference for oral versus injectable and intravenous methods of treatment for rheumatoid arthritis. Value Health 16, A568 (2013). [Google Scholar]
- 36. Hsiao, B. & Fraenkel, L. Patient preferences for rheumatoid arthritis treatment. Curr. Opin. Rheumatol. 31, 256–263 (2019). [DOI] [PMC free article] [PubMed] [Google Scholar]
- 37. A study to investigate efficacy and safety of SAR441566 in patients with Crohn's disease. <https://clinicaltrials.gov/study/NCT06637631>. Accessed February 14, 2025.
- 38. A study to evaluate SAR441566 efficacy and safety in adults with rheumatoid arthritis. <https://clinicaltrials.gov/study/NCT06073093>. Accessed February 14, 2025.
Associated Data
This section collects any data citations, data availability statements, or supplementary materials included in this article.
Supplementary Materials
Data S1
Data Availability Statement
Qualified researchers may request access to patient‐level data and related study documents, including the clinical study report, study protocol with any amendments, blank case report form, statistical analysis plan, and dataset specifications. Participant‐level data will be anonymized, and study documents will be redacted to protect the privacy of the trial participants. Further details on Sanofi's data‐sharing criteria, eligible studies, and process for requesting access can be found at: https://www.vivli.org/.