


Abstract
Molecular glues are an emerging modality that induces or enhances an interaction between two proteins. Molecular glues can target proteins via proximity-induced degradation or sequestration and can, therefore, provide opportunities for therapeutic intervention to targets that cannot be modulated by traditional small-molecule approaches. Due to their modest molecular weight, molecular glues may not encounter the bioavailability issues associated with PROTACs. Characterization of molecular glues in hit finding and hit optimization settings can be challenging, as both the affinity of the glue for the target protein and the resulting improvement in affinity between the proteins of interest need to be assessed in parallel. Here, we propose and validate a workflow to derive both key parameters from a classic concentration response experiment. Furthermore, we provide a method for the rational determination of optimum biochemical assay conditions to identify and characterize molecular glues.
Keywords: drug discovery, drug screening, high-throughput screening (HTS), protein-protein interaction, fluorescence resonance energy transfer (FRET), mathematical modeling
Advances in genomics, molecular biology, and target validation techniques have identified numerous potential drug targets. However, many of these are transcription factors and scaffolding proteins that have been considered undruggable with classical small-molecule modulators. In principle, these challenging targets could be modulated via protein-protein interactions (PPIs), where a compound induces or enhances an interaction between a target (T) and an effector protein (E). The target protein can thus be modulated through any mechanism regulated by the interaction of two proteins, including promoting degradation through enhancing the interaction with an E3 ligase or via sequestration, for example, through binding to cyclophilin A (1, 2). Furthermore, inhibition and activation should both be achievable through gluing to a relevant partner protein (3).
Targeted protein degradation has been achieved via PROTACs: these heterobifunctional molecules have one moiety binding to the target and one binding to an E3 ligase (Fig. 1A). The resulting induced proximity leads to the ubiquitination of the target and subsequent proteasomal degradation. However, because of their bifunctional nature and their resulting high molecular weight, developing bioavailable PROTACs has proven more challenging than small molecules (4). Molecular glues are a promising emerging modality which could circumvent these issues.
Figure 1.

Possible binding schemes illustrating binary and ternary complex formation induced by PROTACSand molecular glues,L = Ligand (PROTAC or molecularglue), T = Target proteinandE = Effector protein.A, schematic illustration of the thermodynamic cycles of a PROTAC (L) induced ternary complex between a T and E. B, a general case illustrating all possible pathways and complexes that a molecular glue could elicit in a two-protein system. C, simplified version of (B) when a molecular glue binds to E but not to T. D, simplified version of (B) when a molecular glue binds to T but not to E.
Unlike PROTACS, molecular glues are often described as small molecules that lack two separate warheads that bind to the effector and target proteins, and instead bind preferentially to only one of the two interacting proteins (1, 5). As illustrated in Figure 1B, molecular glues can bind to either the target protein or the effector protein and can elicit an enhancement of ternary complex formation by facilitating additional interactions between the two (Fig. 1, C and D).
As PROTACs have affinity for both proteins of interest, they often display a bell-shaped curve or “hook effect” at high concentrations: binding sites on both proteins are saturated by the PROTAC, leading to a reduction in the desired ternary complex (Fig. 1A) (6). In contrast, this phenomenon is not observed with molecular glues as they predominantly bind to only one of the two target proteins (Fig. 1, C and D). In addition, most molecular glues are smaller than PROTACs, enabling better physiochemical properties. For the abovementioned reasons, molecular glues may prove to be a broadly applicable modality to regulate protein function and levels (7).
Molecular glues increase the levels of the desired protein-protein complex by initially forming a complex with one of the two proteins of interest, and upon binding, induce confirmational changes that enhance affinity for the other protein. Alternatively, they can bind to an already established protein-protein complex and stabilize it further (Fig. 1, C and D). The potency of a molecular glue is therefore a composite of its affinity for the relevant protein species and the resulting change in affinity between the two interacting proteins induced by the glue, herein referred to as KD shift (also referred to as cooperativity) (7). Therefore, as a molecular glue is optimized, accurate measurements of both aspects are needed to enable understanding of the structure–activity relationship (SAR).
Due to their high throughput and low protein requirements, fluorescence-based biochemical assays are commonly used for the discovery and characterization of novel chemical equities. However, designing such assays to identify and characterize molecular glues requires additional considerations as the resulting signal in a biochemical assay will be driven by both the glues binding affinity and the resulting KD shift it induces, as highlighted by the four extremes shown in Fig. S1 (high vs low affinity, large vs small KD shift). To assess both the glues affinity for its target and the KD shift it induces, the ideal biochemical experiment would involve a dual titration of one of the binding partners and the putative glue, while keeping the other protein partner fixed (Fig. 2A). Such an approach often requires large quantities of reagents, especially if the protein-protein interaction is weak to start with. Furthermore, the high number of combinations needed per molecular glue is not compatible with established high-throughput screening strategies, and seeking more sustainable options would be beneficial.
Figure 2.

Biochemical assays for the characterization of a molecular glue (modeled data).A, example modeled data from a Molecular Glue; Target protein matrix at fixed effector protein concentration (For the current case, we assume the molecular glue binds to the effector protein). Steady state data modeling was performed using KinTek (10), see experimental methods for details. B, same as (A) but showing data from a KD shift assay format. The molecular glue and effector protein concentration is fixed, and the target protein is titrated. C, same as (A) but showing data from a concentration response assay format. Both target and effector proteins are fixed, and the molecular glue is titrated.
Another possibility is to perform experiments that measure the affinity of the two protein partners in the absence and presence of a fixed concentration of the molecular glue (preferably saturating) (Fig. 2B). The resulting change in apparent KD, termed “KD shift”, in the presence of the glue can then be assessed and used to drive compound optimization. This method can still be reagent-intensive and, importantly, does not measure the affinity of the molecular glue for its binding partner.
The most commonly used method for compound optimization is the generation of concentration—response curves, where all assay components are at fixed concentrations and the compound of interest is varied, giving an EC50 value (Fig. 2C). This allows accurate assessment of the affinity of a protein for a compound under these assay conditions but does not directly determine the KD shift induced by the glue.
In the work presented here, we establish a streamlined workflow that enables the quantification of a molecular glue-induced KD shift from the span of concentration-response curves. This methodology is high throughput and facilitates SAR assessment. In addition, this approach offers a more sustainable and cost-effective alternative than a full matrix as it requires significantly less plasticware and reagents.
Results
Biochemical characterization of the β-TrCP1:β-catenin molecular glue NRX-252262
To explore the connection between EC50 values and glue induced KD shift, we selected the β-transducin repeat-containing protein 1 (β-TrCP1) E3 ligase and one of its native protein substrates, β-catenin, as a model system for which a validated molecular glue has been identified (NRX-252262) (Fig. 3A) (8, 9). We first measured the basal interaction affinity between β-TrCP1 and a FAM-labeled monophosphorylated short β-catenin peptide (peptide 1) via direct binding using time-resolved fluorescence resonance energy transfer (TR-FRET). Competition experiments with an unlabeled diphosphorylated peptide (peptide 2) were also performed using the same system (Fig. S2). The KD values that we obtained here are similar to what was reported previously by Simonetta et al. (430/570 nM vs 600 nM for peptide 1 and 1.4 nM vs 2 nM for peptide 2) (8). We then measured the affinity between β-TrCP1 and peptide 1 in the absence or presence of saturating concentrations of NRX-252262 using a TR-FRET assay (Fig. 3B). As previously reported, NRX-252262 dramatically enhances the interaction between β-TrCP1 and β-catenin (8).
Figure 3.

Characterization of the β-TrCP1:β-catenin molecular glue NRX-252262.A, Left: X-ray structure showing the binding pose of the NRX-103094 (an analogue of NRX-252262), bound to the β-catenin peptide:β-TrCP1 complex (6M91) (8). X-ray structure illustration was prepared using PyMOL (9). Orange = β-catenin peptide, Blue = β-TrCP1, Green = NRX-103094, Grey = SKP1. Right: The chemical structures of NRX-252262 and NRX-103094. B, determination of the basal and NRX-252262-induced KD for the β-catenin:β-TrCP1 interaction. The FAM-labeled β-catenin peptide 1 was titrated in the presence or absence of a saturating concentration of NRX-252262. The basal KD was too weak to fully define the binding isotherm, and therefore, the maximum signal value from NRX-252262 was used as a constraint during the basal KD fit. C, concentration-response curves for NRX-252262 at different FAM-β-catenin peptide 1 concentrations: β-TrCP1 is at a fixed concentration while NRX-252262 is titrated. D, schematic illustration of the thermodynamic cycles of a molecular glue showing the dominant pathway at the bottom of a concentration-response curve (left), and the top of a concentration-response curve (right). The black arrow shows that the transition between these two states, the span of a concentration-response curve, is driven by the change from KD1 to αKD1. Molecular glue = L, Target protein = T, and Effector protein = E, Grayed out pathways and species are providing no or negligible contribution to the behaviour of the system under the stated conditions.
We then performed titrations of the molecular glue NRX-252262 at fixed β-TrCP1 and varying β-catenin peptide 1 concentrations (peptide 1 at 1×, 0.1×, and 0.01× of the basal KD). As illustrated in Figure 3C, we observed that the maximum span reached in the EC50 experiments was dependent on the peptide concentration. Interestingly, we also observed that the EC50 values increased as peptide concentration decreased.
From these observations, we hypothesized that there was a generalizable relationship between the span of the concentration-response curves and the KD shift a glue induces (Fig. 3D). This relationship would be dependent on the protein concentration used in the concentration-response experiment relative to the basal KD. To confirm this hypothesis, we employed both an analytical and a numerical thermodynamic modeling approach.
Mathematical relationship between the glue-induced KD shift and the resulting EC50 span
In order to understand the relationship between a glue-induced KD shift and the resulting span from a concentration–response curve, we have derived an algebraic solution under non-tight binding conditions. For small molecule enzyme inhibitors, non-tight binding conditions are met when the free inhibitor is not depleted through direct binding to the enzyme. This is normally achieved by using inhibitor concentrations that are >10-fold in excess over enzyme, and at an enzyme concentration that is >10-fold lower than the inhibition constant for a given inhibitor (Ki). For the present case, the system requires an additional consideration, where both the molecular glue and the varied protein binding to the fixed protein should not be under tight-binding conditions.
Our derivation (see Experimental procedures) yielded Equation 1:
| (1) |
Sn represents the normalized span from a concentration–response assay, defined as the change in assay signal divided by the signal at 100% protein-protein complex (Bmax): for example, a Sn of 1 represents an increase from 0% to 100% protein-protein complex, and a Sn of 0 represents no change in the amount of complex. fKD represents the concentration of the varied protein at which the concentration-response experiment is performed, expressed as a fraction of the basal KD. KD1 represents the basal affinity between the two proteins of interest, αKD1 represents the affinity of the glue-protein complex for the other protein, and α represents the cooperativity (αKD1/KD1) between the two proteins upon glue binding and is always <1. 1/α is therefore equivalent to the glue-induced fold change from KD1 to αKD1. It is also of note that the relationship, KD1/αKD1 = KD2/αKD2, holds for the thermodynamic schemas of Figure 1, C and D.
Equation 1 relates the glue-induced KD shift and the normalized span to each other. At a given fKD, this enables the conversion between glue-induced KD shift and the normalized span from a concentration-response assay. The results of modeling Equation 1 is shown in Figure 4.
Figure 4.

Modeled data showing the predicted relationship between glue induced KD shifts (1/α) and the span of an EC50 curve (Sn) for an EC50 assay, which is set at different fractions of the basal KD (fKD). Results of modeling Equation 1. This plot shows how the normalized span (Sn) of an EC50 curve changes for a wide range of glue-induced affinity shifts. fKD refers to the fraction of basal KD the EC50 assay has been set at, e.g. fKD of 1 = 1 × KD, fKD of 0.1 = 0.1 × KD, fKD of 0.01 = 0.01 × KD.
In practice, one may experimentally determine the normalized span Sn, and use Equation 2 to calculate the glue-induced KD shift (1/α). The only other parameter needed for the calculation is fKD, which is known.
| (2) |
We independently validated the derivation using KinTek Explorer (10) by modeling the steady state levels of protein-protein complex for the same set of fKD values, via numerical integration of the associated differential equations. We modeled two different example systems with 100-fold different basal KDs and a 10-fold difference in the glues affinity for the effector protein (Fig. S3). Importantly, when normalized to the fraction of basal KD, the results of both of these example systems are identical to the model shown in Figure 4, validating the analytical derivation and confirming this is a general model for molecular glues effect on protein-protein complex levels when at saturating concentrations of the glue.
Experimental validation of the relationship between Sn and KD shift
To assess the applicability of the modeling presented earlier, we synthesized seven analogs of NRX-252262, generating a panel of glues to be used in KD shift and concentration-response experiments (Fig. 5). In the KD shift experiments, we measured the affinity of the β-TrCP1:β-catenin peptide 1 interaction in absence of, and at saturating concentrations of the glues (Fig. 6A) and compared them to the basal KD. We then conducted concentration-response experiments at different concentrations of the β-catenin peptide 1 and computed the Span (Sn) for each of the fits. This is illustrated in Figure 6B using compound 6 as an example.
Figure 5.

Chemical structure of NRX-252262 and the seven analogues which were synthesized (Denoted as compounds 1–7).
Figure 6.

Comparison between experimental and predicted Sn as a function of molecular glue-induced KD shift.A, determination of glue-induced KD values for β-TrCP1:β-catenin. The FAM-labeled β-catenin peptide was titrated in the absence or presence of 100 μM of each molecular glue. B, concentration-response curves for Compound 6 at different FAM-β-catenin peptide concentrations. β-TrCP1 is at a fixed concentration while Compound 6 is titrated. Colored double arrows indicate the Span of the EC50 curves. C, plots showing the normalized span (Sn) of the concentration-response curves of panel B at different fKDversus the KD fold shift values obtained from panel A. The solid lines represent the predicted relationship between span and KD fold shift at each fKD value according to Equation 1. D, plot illustrating the actual versus predicted span, demonstrating the performance of the model for the β-TrCP1:β-catenin glues. The red dotted line represents the line of identity.
The experimentally determined span values were then normalized (Sn) and plotted against the experimentally determined glue-induced KD shift values (symbols in Fig. 6C). Overlaid on the same graph is the model’s prediction (solid lines in Fig. 6C). Figure 6D is a direct correlation plot between the actual and predicted Sn values. Together, the plots in Figure 6, C and D demonstrate a good correlation between the predicted and the observed values of Sn. Therefore, a good estimate of the KD shift can be derived from EC50 parameters extracted from traditional concentration-response curves. Furthermore, diagnostic plots indicate no systematic error in the model’s prediction (Fig. S4).
Discussion
The efficacy of a molecular glue is a composite of its binding affinity and the resulting change in KD between the two binding partners (Fig. 1). Therefore, to build a successful molecular glue assay, the impact of both parameters must be considered (Fig. 2). We demonstrated that, by elucidating the relationship between KD shift and Span, a classical concentration-response assay can be used to obtain both key parameters (Figs. 4 and 6).
As shown in Figure 4, the dynamic range of KD detection depends on how the protein concentration is set with respect to the basal KD. Understanding the KD detection limit is essential and can be used to identify compounds that are outside the dynamic range of the assay. Furthermore, the tight binding limit (half of the E concentration) must also be considered as it represents the limit of detection for the binding affinity to the target protein for a given glue (Table 1).
Table 1.
A summary of assay detection limits for molecular glue screening for an effector protein binding molecular glue
| Limit | Effect | Challenge | Solution |
|---|---|---|---|
| Tight binding limit | EC50 loses correlation with Ki | EC50 value close to protein concentration | Lower concentration of effector protein |
| KD detection limit | Small Sn variations represent very large KD shifts | Span value approaching the theoretical limit | Lower fraction of basal KD (fKD) |
As long as the assay remains robust, there is little downside to decreasing the amount of effector protein, and therefore improving the tight binding limit. However, by lowering the fKD the assay is set at, the assay will become desensitized to molecular glues that induce a small KD shift. Therefore, during a molecular glue optimization campaign, it may be necessary to start with a relatively high fKD (0.1–0.5), which is subsequently decreased as compounds reach the detection limit, re-adjusting the dynamic range of KD detection as compounds' gluing ability is improved. We validated this approach using the β-TrCP1:β-catenin molecular glue NRX-252262 and its analogues as a model system and observed good correlation between the predicted and actual spans (Fig. 6).
Taken together, the data presented above validate the implementation of a broadly applicable workflow for the design of biochemical assays for the identification and optimization of molecular glues (Fig. 7). Once the KD of the basal interaction has been determined, our modeling approach can be used to understand the range of KDs that can be estimated at a given set of assay conditions.
Figure 7.

Proposed workflow for molecular glue assay development and screening. Schematic showing a proposed workflow for the identification and characterization of molecular glues during a drug discovery campaign for cases where molecular glues bind to the effector protein. An iterative process of assay development and compound screening is required to ensure that assay conditions remain suitable as the molecular glue's affinity for the effector protein and the KD shift they induce both improve during compound optimization cycles. A similar workflow can be used for molecular glues that bind to the target protein.
Prediction of the assay window
We have demonstrated that Equations 1 and 2 allow the determination of KD shift values from the span of a concentration-response curve. However, when designing an assay for a molecular glue with a known KD shift value, we have not provided guidance on how to optimize assay conditions. Equations 1 and 2 can be used to fine-tune assay conditions based on the anticipated KD shift of the molecular glue under investigation. A practical approach to optimizing assay conditions is to apply a sensitivity analysis, which involves computing the partial derivative of Equation 1 with respect to fKD:
| (3) |
This calculation provides insights into how changes in fKD affect the window of the assay, allowing for a more informed selection of . By solving Equation 3 and finding the roots, it can be shown that for a given glue, the maximum span is obtained with (4):
| (4) |
For example, if we are expecting a glue to enhance the complex affinity 100-fold ( = 0.01), setting [T] at approximately a one-tenth () of the basal KD would provide an optimal Sn. Likewise, if the glue-induced KD was 4-fold ( = 0.25) then setting [T] at half () of basal KD would be optimal.
Conclusion
Molecular glues are an emerging modality for drugging previously intractable targets. However, the optimization of molecular glues poses new challenges for SAR screening. In this work, we have established the relationship between the span of the EC50 curve and the enhancement of affinity induced by a molecular glue. We then validated this approach using the β-TrCP1:β-catenin system and a panel of novel analogues of NRX-252262.
The mathematical model presented and validated above is at the core of a streamlined workflow for biochemical assay development and screening of molecular glues. We illustrate that this method is not limited to estimating affinity shifts from traditional concentration-response assays; it also enables the determination of the dynamic range for detecting shifts in KD values. Furthermore, it provides guidance for assay developers on optimizing reagent concentrations to enhance the assay window, leveraging the observed KD shift induced by specific interactions.
As molecular glues develop as a promising modality to modulate diverse targets, the work presented provides a basis for streamlined drug discovery and optimization cascades.
Experimental procedures
Derivation of the relationship between glue-induced KD shift and the resulting EC50 span
First, for a KD shift experiment, as shown in Figure 8, the signal can be described as:
| (5) |
where Bmax is the maximum potential signal and KDapp is the apparent affinity at the given concentration of glue. Using the notations from Figure 1C, in the absence or at saturating concentration of glue, (5) can be rewritten as (6) and (7) respectively:
| (6) |
| (7) |
where KD1 is the basal affinity and αKD1 is the induced affinity.
Figure 8.

The relationship between signal, Span and KD shift for an example molecular glue in a concentration-response and KD shift experiment KinTek modeled data showing the relationship between Signal (Y) and Span (Sinf-S0) in a KD shift (black) and concentration-response experiment (red) respectively, for an example molecular glue. Y = E:T + E:T:L, equivalent to the total amount of protein-protein complex.
We then considered a concentration-response experiment where the glue is titrated at a fixed [T]. At [glue] = 0, the signal Y = S0, and similarly, at saturation of glue, Y = Sinf (Fig. 8). We can hence deduce that the span of the EC50 curve (S) is given by (8):
| (8) |
After factorization and rearrangement to the same denominator (8) can be expressed as (9):
| (9) |
Further rearrangement yields (10):
| (10) |
To generalize the model, we introduce the term “the fraction of basal KD” (abbreviated fKD), which we define as fKD = [T]/KD1, where [T] is the concentration of target in the concentration-response assay. This term is useful as it informs what the [T] was in an experiment relative to the basal KD, obviating the need to explicitly state the actual value, which will differ depending on the system that is used. For example, if one sets [T] at KD, then fKD = 1, if one sets [T] at ½×KD then fKD = 0.5, and so on. fKD therefore represents how the concentration-response assay is balanced regarding the basal affinity of T for E (see Results). In addition, as Bmax is subject to experimental variability: to minimize the impact of these variations, we defined the normalized Span, Sn = S/Bmax.
We can then rearrange (10) into Equations 1 and 2 as shown in results – “Mathematical relationship between the glue induced KD shift and the resulting EC50 Span”.
Thermodynamic modeling using KinTek explorer
The data in Figures 2, A–C, 8, and S3 was modeled using KinTek Explorer (kintekcorp) (10). Steady State values were exported (T = 1000 s) and plotted in Prism (GraphPad). E:T:L + E:T are shown on the graph. E = Effector protein, T = Target protein and L = Molecular glue. The kinetic parameters and reagent concentrations used to perform the modeling of Figures 2, A–C and 8 are shown in Tables 2 and 3.
Table 2.
| Term | Reaction | KD (μM) | kon (μM−1 s−1) | koff (s−1) |
|---|---|---|---|---|
| KD1 | E + T ⇄ E:T | 15 | 1 | 15 |
| KD2 | E + L ⇄ E:L | 10 | 1 | 10 |
| αKD1 | E:T + L ⇄ E:T:L | 0.5 | 0.5 | 0.25 |
| αKD2 | E:L + T ⇄ E:T:L | 0.333 | 1 | 0.33333 |
Table 3.
| Name | Concentration (μM) |
||
|---|---|---|---|
| Glue-effector protein matrix format | KD shift format | Dose response format | |
| T | 0–120 | 0–60 | 0.939 |
| E | 0.01 | 0.01 | 0.01 |
| L | 0–200 | 200.00 | 0–200 |
The kinetic parameters and reagent concentrations used to perform the modeling of Fig. S3 - Example system 1 are shown in Tables 4 and 5.
Table 4.
Kinetic and steady state parameters used in the modeling for Supporting Figure S3 - Example system 1
| Term | Reaction | KD | kon (μM−1 s−1) | koff (s−1) |
|---|---|---|---|---|
| KD1 | E + T ⇄ E:T | 15 μM | 1 | 15 |
| KD2 | E + L ⇄ E:L | 10 μM | 1 | 10 |
| αKD1 | E:T + L ⇄ E:T:L | 15 μM–762 pM | 1 | 15–0.000762 |
| αKD2 | E:L + T ⇄ E:T:L | 10 μM−508 pM | 1 | 10–0.000508 |
Table 5.
The concentrations of reaction components used in the modeling for Supporting Figure S3 - Example system 1
| Name | Concentration (μM) |
|---|---|
| T | 15, 1.5, 0.15 |
| E | 0.01 |
| L | 10,000 |
The kinetic parameters and reagent concentrations used to perform the modeling of Fig. S3 - Example system 2 are shown in Tables 6 and 7.
Table 6.
Kinetic and steady state parameters used in the modeling for Supporting Figure S3 - Example system 2
| Term | Reaction | KD | kon (μM−1 s−1) | koff (s−1) |
|---|---|---|---|---|
| KD1 | E + T ⇄ E:T | 150 nM | 100 | 15 |
| KD2 | E + L ⇄ E:L | 100 μM | 1 | 100 |
| αKD1 | E:T + L ⇄ E:T:L | 150 nM–7.62 pM | 1 | 0.15–0.00000762 |
| αKD2 | E:L + T ⇄ E:T:L | 100 μM–5 nM | 1 | 100–0.005 |
Table 7.
The concentrations of reaction components used in the modeling for Supporting Figure S3 - Example system 2
| Name | Concentration (μM) |
|---|---|
| T | 0.150, 0.015, 0.0015 |
| E | 0.01 |
| L | 10,000 |
Materials
Generation of β-catenin peptides
The following peptides were synthesized by WuXi AppTec and confirmed to be greater than 95% pure by HPLC (“p” denotes phosphorylation of the serine residues):
Peptide 1: FAM-CDRKAAVSHWQQQSYLDpSGIHSGATTTAPSLSG
Peptide 2: CDRKAAVSHWQQQSYLDpSGIHpSGATTTAPSLSG
Expression and purification of βTrCP1
Expression
The human β-TrCP1-SKP1 complex was cloned into pFastBac vectors as His-ZZ-Tev-β-TrCP1(139–569)-Avi and Skp1ΔΔ(delta38–43 and delta71–82) and co-expressed in SF21 insect cells using separate baculoviruses. The inoculated SF21 insect cells were grown at 27 °C and 140 RPM for 48 h before the cells were harvested.
Purification
All purification steps were conducted at 4 °C unless stated otherwise. The cell pellet was resuspended in lysis buffer (50 mM Hepes pH 7.5, 300 mM NaCl, 20 mM Imidazole, 2 mM TCEP, benzonase (produced in-house), Protease Complete EDTA free inhibitors (Roche)) and lysed by freeze-thaw. The lysate was clarified by centrifugation at 16,000 RPM using a JLA 16.250 rotor and an Avanti JXN-26 centrifuge for 1.5 h.
The clarified lysate was loaded onto a 5 ml HisTrap FF column (Cytiva) equilibrated with NiA buffer (40 mM Hepes pH 7.5, 500 mM NaCl, 20 mM imidazole, 1 mM TCEP, 5% glycerol). The HisTrap FF column was washed with 40 CV NiA buffer before the protein was eluted using a linear gradient of 0 to 100% NiB buffer (40 mM Hepes pH 7.5, 500 mM NaCl, 500 mM imidazole, 1 mM TCEP, 5% glycerol). Eluent was cleaved using His-tagged TEV (produced in-house) and dialysed overnight into NiA buffer for HisTrap repurification to remove TEV and any un-cleaved protein. The cleaved protein was biotinylated and dephosphorylated overnight using the Biotinylation Avidity kit (Avidity, BirA500) as instructed in the manual and using Lamba-phosphatase (produced in-house) and MnCl2 (Sigma). The biotinylated and dephosphorylated protein complex was then purified by gel filtration chromatography using 25 mM Hepes pH 8.0, 200 mM NaCl, 1 mM TCEP. The βTrCP1-SKP1 complex was then concentrated using an Amicon Ultra-15 centrifugal filter unit with a 10 MWCO (Merck) to 1 to 5 mg/ml, frozen and stored at −80 °C. 12.5 mg of the final protein product was obtained from the original 10 L grow.
Expressed protein sequences
His-ZZ-Tev-β-TrCP1(139–569)-Avi
MHHHHHHHHSSGMCMAGLAQHDEAVDNKFNKEQQNAFYEILHLPNLNEEQRNAFIQSLKDDPSQSANLLAEAKKLNDAQAPKVDNKFNKEQQNAFYEILHLPNLNEEQRNAFIQSLKDDPSQSANLLAEAKKLNDAQAPKVDANSAGKSTGGGENLYFQGSMLQRDFITALPARGLDHIAENILSYLDAKSLCAAELVCKEWYRVTSGMLWKKLIERMVRTDSLWRGLAERRGWGQYLFKNKPPDGNAPPNSFYRALYPKIIQDIETIESNWRCGRHSLQRIHCRSETSKGVYCLQYDDQKIVSGLRDNTIKIWDKNTLECKRILTGHTGSVLCLQYDERVIITGSSDSTVRVWDVNTGEMLNTLIHHCEAVLHLRFNNGMMVTCSKDRSIAVWDMASPTDITLRRVLVGHRAAVNVVDFDDKYIVSASGDRTIKVWNTSTCEFVRTLNGHKRGIACLQYRDRLVVSGSSDNTIRLWDIECGACLRVLEGHEELVRCIRFDNKRIVSGAYDGKIKVWDLVAALDPRAPAGTLCLRTLVEHSGRVFRLQFDEFQIVSSSHDDTILIWDFLNDPAAQAEPPRSPSRTYTYISRGSGLNDIFEAQKIEWHE
Skp1ΔΔ(delta38–43 and delta71–82)
MPSIKLQSSDGEIFEVDVEIAKQSVTIKTMLEDLGMDPVPLPNVNAAILKKVIQWCTHHKDDPPDDIPVWDQEFLKVDQGTLFELILAANYLDIKGLLDVTCKTVANMIKGKTPEEIRKTFNIKNDFTEEEEAQVRKENQWCEEK
Biochemical assays
The following buffer was used for all biochemical assays: 50 mM Tris pH 7.5 (Sigma: T2319), 150 mM NaCl (Sigma: S9888), 0.01% (v/v) Pluronic-F127 (Invitrogen: P6866), 1 mM TCEP, 1.52 μM BSA and 1 mM EDTA (Sigma: E7889) in MilliQ water.
Basal and glue-induced affinity determinations (KD shift experiments)
A 6 μl reaction volume was used in 384-well black non-binding plates (Greiner Bio-One 781900). β-TrCP1:Skp1ΔΔ was fixed at 1 nM, Streptavidin-Terbium (Revvity, 610SATLB) at 0.25 nM. The β-catenin FAM-peptide was titrated from 1 μM to 45 nM using 1.25-fold serial dilutions. The assay signal was measured after 4 h using 10 flashes per well on a PHERAstar FSX Microplate Reader (BMG Labtech), TR-FRET ratio was calculated by dividing the signal from channel A (λ = 520 nm) by the one from channel B (λ = 490 nm). The data was fitted with “One Site – Total” equation in GraphPad Prism 9 (GraphPad) “Y=Bmax×X/(KD+X)” (Fig. S2A).
The measured affinity was confirmed by generating displacement data with a matrix of labeled and unlabeled β-catenin peptides and fitting to the Cheng-Prusoff equation (Fig. S2, B and C). IC50 values were obtained by fitting the displacement matrix to “Y=Bottom + (Top-Bottom)/(1+(IC50/X)∧Hillslope)” in GraphPad Prism. The IC50 values were then plotted against the concentration of β-catenin FAM-peptide and fitted to the Cheng-Prusoff equation “IC50=Ki+Ki×[L]/KD” where L is the β-catenin FAM-peptide.
For KD shift experiments, the β-catenin FAM-peptide was serially diluted 3-fold from 1 μM to 5 pM, in the presence of 100 μM of the stated molecular glue. The data were fitted in GraphPad Prism 9 (GraphPad) with “Y=Bmax∗X/(KD+X)”.
EC50 determinations (concentration-response experiments)
A 6 μl reaction volume was used in 384 well black non-binding plates (Greiner Bio-One 781900). β-TrCP1:Skp1ΔΔ protein was fixed at 1 nM, Streptavidin-Terbium at 0.25 nM, and the β-catenin FAM-peptide at 570 nM (fKD = 1), 57 nM (fKD = 0.1), and 5.7 nM (fKD = 0.01) respectively. Compounds were titrated between 100 μM and 320 pM using a 12 point 3.16-fold serial dilution. Assay plates were measured after 4 h, using 10 flashes per well on a PHERAstar FSX Microplate Reader (BMG Labtech). All wells were normalized to a final concentration of 1% DMSO (v/v). Data was analysed in GeneData Screener using the GeneData Smart Fit curve fitting algorithm.
Preparation of compounds for EC50 and KD shift experiments
All assayed compounds were prepared as 10 mM stocks in DMSO by AstraZeneca's Compound Management team, compounds were transferred to the assay plate using an Echo 650 (Beckman Coulter).
Normalization methods
The raw TR-FRET data were captured in the same fashion in the concentration-response and KD shift experiments (no extra gain adjustment). Consequently, we can assume the signal at 100% protein-protein complex is the same in both assay formats. In addition, in the KD experiment, the background signal was negligible. As a result, we used Bmax = maxEC50, where maxEC50 represents the signal in the EC50 assay where all of the β-TrCP1:Skp1ΔΔ protein is in complex with the β-catenin FAM-peptide.
Figure preparation and presentation
All graphs were made in GraphPad Prism version 9.4.0, KD measurements are shown ± standard error.
General methods (Chemistry)
Solvents and chemicals used were of reagent grade. Anhydrous solvents (THF, DCM, acetonitrile, and DMF) were purchased from Aldrich. All experiments were carried out under an inert atmosphere of nitrogen and at ambient temperature unless otherwise stated. Microwave reactions were performed using one of the following reactors: Biotage initiator, Personal Chemistry Emrys optimizer, Personal Chemistry SmithCreator, or CEM Explorer. Workup procedures were carried out using traditional phase separating techniques or by using strong cation exchange (SCX) chromatography using Isolute SPE flash SCX-2 column (International Sorbent Technology Limited, Mid Glamorgan, S9 U.K.). When necessary, organic solvents were dried over anhydrous MgSO4 or Na2SO4. Flash chromatography purifications were performed on automated Presearch (ISCO) CombiFlash companions using prepacked Merck normal phase Si60 silica cartridges (granulometry: 15–40 or 40–63 μm) obtained from Merck, Darmstadt, Germany, silicycle silica cartridges or GraceResolv silica cartridges. Preparative reverse phase HPLC was performed on a Waters instrument (600/2700 or 2525) fitted with a ZMD or ZQ ESCi mass spectrometers and a Waters X-Terra or a Waters X-Bridge or a Waters SunFire reverse-phase column (C-18, 5 μm silica, 19 mm or 50 mm diameter, 100 mm length, flow rate of 40 ml/min) using decreasingly polar mixtures of water (containing 1% ammonia) and acetonitrile or decreasingly polar mixtures of water (containing 0.1% formic acid) and acetonitrile as eluents. Intermediates were not necessarily purified, but their structures and purity were assessed by TLC, NMR, HPLC, and mass spectral techniques and are consistent with the proposed structures. The purity of compounds for biological testing were assessed by NMR, HPLC, and mass spectral techniques and are consistent with the proposed structures; purity was ≥95%. Electrospray mass spectral data were obtained using a Waters ZMD or Waters ZQ LC/mass spectrometer acquiring both positive and negative ion data, and generally, only ions relating to the parent structure are reported; proton NMR chemical shift values were measured on the delta scale using either a Bruker DPX300 spectrometer operating at a field strength of 300 MHz, a Bruker DRX400 operating at 400 MHz, a Bruker DRX500 operating at 500 MHz, or a Bruker AV700 operating at 700 MHz. NMR spectra were determined in CDCl3, DMSO-d6, or MeOH-d4. Chemical shifts are reported in ppm relative to TMS (0.00 ppm) or relative to the residual solvent peak as the internal reference. The following abbreviations have been used: s, singlet; d, doublet; t, triplet; q, quartet; m, multiplet; br, broad; p, pentet; and sept, septet. Optical rotations were measured on a BS ADP440+ polarimeter at 589 nm wavelength unless noted otherwise. Compounds were optionally isolated as the methanesulfonate salt by dissolving the isolated base in DCM and treating with 1 M methanesufonic acid in DCM (1.1 equiv) and stirring at ambient temperature. The solvent was removed in vacuo and if required the residue triturated with diethyl ether to afford the desired salt. Where the synthesis of an intermediate or reagent is not described then it is available from commercial sources. Racemic mixtures are denoted using the prefix rac-, e.g., rac-(1R,2R). Enantiomerically pure compounds of known stereochemistry are denoted without prefix, e.g., (1R,2R). Enantiomerically pure compounds of unknown absolute stereochemistry are denoted by the prefix rel-, e.g., rel-(1R,2R). No unexpected or unusually high-risk safety hazards were encountered.

NRX-252262: 4-((2,6-dichlorophenyl)thio)-3-(5,6-dimethoxyisoindoline-2-carbonyl)-6-(trifluoromethyl)pyridin-2(1H)-one: Synthesized following the procedures described by Simonetta et al. (8). White solid. 1H NMR (400 MHz, DMSO-d6) δ 3.71 (s, 3H), 3.76 (s, 3H), 4.43 to 4.7 (m, 2H), 4.77 (s, 2H), 6.31 (s, 1H), 7.00 (d, J = 17.2 Hz, 2H), 7.63 (dd, J = 8.6, 7.6 Hz, 1H), 7.76 (d, J = 8.0 Hz, 2H), 12.84 (s, 1H); MS (ESI) m/z = 544 [M-1].

4-Chloro-2-oxo-6-(trifluoromethyl)-1,2-dihydropyridine-3-carboxylic acid: Synthesized following the procedures described by Simonetta et al. (8). White solid. 1H NMR (500 MHz, DMSO-d6) δ 7.60 (s, 1H); MS (ESI) m/z = 240 [M-1].

4-chloro-3-(5,6-dimethoxyisoindoline-2-carbonyl)-6-(trifluoromethyl)pyridin-2(1H)-one: A solution of T4P in EtOAc (28.3 g, 39.33 mmol) was added dropwise to 4-chloro-2-oxo-6-(trifluoromethyl)-1,2-dihydropyridine-3-carboxylic acid (3.8 g, 15.73 mmol), 5,6-dimethoxyisoindoline HCl (4.07 g, 18.88 mmol) and N,N-Diisopropylethylamine (8.24 ml, 47.20 mmol) in DMF (20 ml) at 0°C. The resulting mixture was stirred at r.t. for 1 h 1M NaOH aq. (131 ml, 786.59 mmol) was added, and the resulting mixture was stirred at r.t. for 1 h. The reaction mixture was quenched with water (200 ml), extracted with EtOAc (3 × 100 ml), the organic layer was dried over Na2SO4, filtered, and evaporated to afford crude product. The crude product was purified by flash silica chromatography, elution gradient 0 to 25% EtOAc in petroleum ether. Pure fractions were evaporated to dryness to afford the title compound (5.80 g, 92%). White solid. 1H NMR (300 MHz, DMSO-d6) δ 3.70 (s, 3H), 3.76 (s, 3H), 4.36 to 4.56 (m, 2H), 4.76 (s, 2H), 6.89 (s, 1H), 7.02 (s, 1H), 7.68 (s, 1H), 13.10 (s, 1H); MS (ESI) m/z = 403 [M+1].
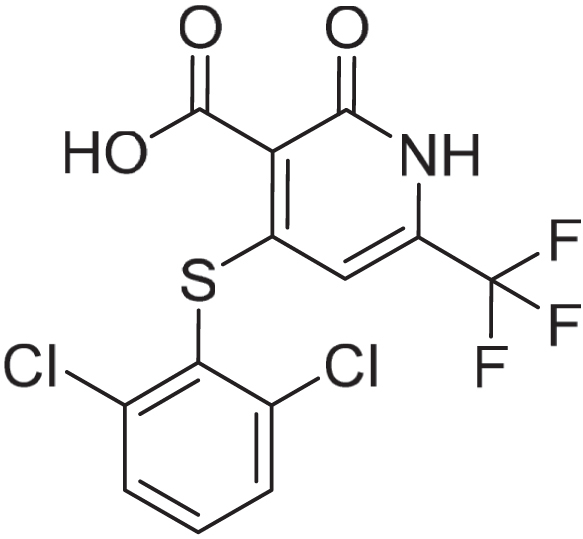
4-((2,6-dichlorophenyl)thio)-2-oxo-6-(trifluoromethyl)-1,2-dihydropyridine-3-carboxylic acid: To a solution of 4-chloro-2-oxo-6-(trifluoromethyl)-1,2-dihydropyridine-3-carboxylic acid (480 mg, 1.99 mmol) and 2,6-dichlorobenzenethiol (534 mg, 2.98 mmol) in NMP (10 ml) was added K2CO3 (1099 mg, 7.95 mmol). The solution was stirred at 110 °C for 1 h. The reaction mixtue was diluted with EtOAc (10 ml) and washed with water (10 ml) and brine (10 ml). The aqueous layer was extracted with EtOAc (1 x 40 ml) and the combined organic layers were collected via a hydrophobic frit to afford crude product. The crude product was purified by reverse phase chromatography (Interchim C18-HP Flash column, 175 g), using decreasingly polar mixtures of water (containing by volume 1% NH4OH (28–30% in H2O)) and MeCN as eluents. Fractions containing the desired compound were evaporated to remove MeCN and acidified with 2M HCl. The aqueous solution was extracted with DCM (2 x 100 ml) before being concentrated in vacuo to afford the title compound (129 mg, 0.336 mmol, 16.9%). The aqueous layer was collected and filtered to afford a further crop of the title compound (353 mg, 0.918 mmol, 46.2%). Off white solid. 1H NMR (500 MHz, DMSO-d6) δ 3.18 (s, 3H), 6.03 (s, 1H), 7.65 (dd, J = 8.6, 7.6 Hz, 1H), 7.76 to 7.8 (m, 2H); MS (ESI) m/z = 382 [M-1].

Compound 1: 3-(5,6-dimethoxyisoindoline-2-carbonyl)-4-((2-methylbenzyl)thio)-6-(trifluoromethyl)pyridin-2(1H)-one: Into a 40 ml vial, 2-methylbenzylthiol (0.3 mmol, 42 mg) was added to 4-chloro-3-(5,6-dimethoxy-2,3-dihydro-1H-isoindole-2-carbonyl)-6-(trifluoromethyl)-1,2-dihydropyridin-2-one (0.10 mmol, 51 mg), NMP (1 ml), K2CO3 (0.3 mmol, 42 mg). The mixture was stirred at 150 °C for 3h. The crude product was purified by prep-HPLC with the following conditions: Xbridge prep C18 5vm 30∗150 mm and Welch Ultimate XB-C18:50∗250 mm,10vm. 5% - 90% MeCN in formic acid aq. (0.05%) or 5% - 90% MeCN in NH4HCO3 (10 mmol/L) to afford the title compound (7.8 mg, 14%). Off white solid. 1H NMR (600 MHz, DMSO-d6) δ 2.27 (s, 3H), 3.71 (s, 3H), 3.75 (s, 3H), 4.10 (d, J = 13.6 Hz, 1H), 4.37 (d, J = 13.6 Hz, 1H), 4.46 (d, J = 12.5 Hz, 1H), 4.49 (d, J = 12.2 Hz, 1H), 4.68 (s, 2H), 6.83 (s, 1H), 6.98 (s, 1H), 7.11 (dd, J = 7.6, 5.8 Hz, 2H), 7.15 to 7.21 (m, 1H), 7.27 to 7.31 (m, 1H), 7.56 (s, 1H), 12.39 (s, 1H). MS (ESI) m/z = 505 [M+1].

Compound 2: 4-((2,6-dichlorophenyl)thio)-3-(6-methylindoline-1-carbonyl)-6-(trifluoromethyl)pyridin-2(1H)-one: Into a 40 ml vial, 6-methylindoline (0.15 mmol, 20 mg) was added to 4-((2,6-dichlorophenyl)thio)-2-oxo-6-(trifluoromethyl)-1,2-dihydropyridine-3-carboxylic acid (0.10 mmol, 38 mg), HOBt (0.20 mmol, 27 mg), 1-ethyl-3-(3-dimethylaminopropyl)carbodiimide (0.20 mmol, 31 mg), N,N-diisopropylethylamine (0.30 mmol, 39 mg), and DMF (2 ml). The mixture was stirred at room temperature for 16 h. The crude product was purified by Prep-HPLC with the following conditions: Xbridge prep C18 5 vm 30∗150 mm and Welch Ultimate XB-C18, 50∗250 mm,10 vm. 5% - 90% MeCN in formic acid aq. (0.05%) or 5%-90 % MeCN in NH4HCO3 (10 mmol/L) to afford the title compound (3.1 mg, 6%). Off white solid. 1H NMR (600 MHz, DMSO-d6) δ 2.34 (s, 3H), 3.12 (t, J = 8.6 Hz, 2H), 3.89 (q, J = 9.1 Hz, 1H), 3.98 (m, 1H), 6.30 (s, 1H), 6.94 (d, J = 7.6 Hz, 1H), 7.19 (d, J = 7.6 Hz, 1H), 7.63 (t, J = 8.1 Hz, 1H), 7.71 to 7.82 (m, 2H), 8.01 (s, 1H). MS (ESI) m/z = 499 [M+1].

Compound 3: 3-(5,6-dimethoxyisoindoline-2-carbonyl)-4-((4-ethylphenyl)thio)-6-(trifluoromethyl)pyridin-2(1H)-one: Into a 40 ml vial, 4-ethylbenzenethiol (0.3 mmol, 42 mg) was added to 4-chloro-3-(5,6-dimethoxy-2,3-dihydro-1H-isoindole-2-carbonyl)-6-(trifluoromethyl)-1,2-dihydropyridin-2-one (0.10 mmol, 51 mg), NMP (1 ml), K2CO3 (0.3 mmol, 42 mg). The mixture was stirred at 150 °C for 3 h. The crude product was purified by prep-HPLC with the following conditions: Xbridge prep C18 5vm 30∗150 mm and Welch Ultimate XB-C18:50∗250 mm,10vm. 5% - 90% MeCN in formic acid aq. (0.05%) or 5% - 90% MeCN in NH4HCO3 (10 mmol/L) to afford the title compound (7.2 mg, 14%). Off white solid. 1H NMR (600 MHz, DMSO-d6) δ 1.18 (t, J = 7.6 Hz, 3H), 2.65 (q, J = 7.6 Hz, 2H) 3.72 (s, 3H), 3.77 (s, 3H), 4.52 (d, J = 13.4 Hz, 1H), 4.57 (d, J = 13.7 Hz, 1H), 4.74 (s, 2H), 6.53 (s, 1H), 6.93 (s, 1H), 7.02 (s, 1H), 7.38 (d, J = 8.0 Hz, 2H), 7.54 (d, J = 7.9 Hz, 2H), 12.62 (s, 1H). MS (ESI) m/z = 505 [M+1].

Compound 4: 4-((3-chlorophenyl)thio)-3-(5,6-dimethoxyisoindoline-2-carbonyl)-6-(trifluoromethyl)pyridin-2(1H)-one: Into a 40 ml vial, 3-chlorophenylthiol (0.3 mmol, 43 mg) was added to 4-chloro-3-(5,6-dimethoxy-2,3-dihydro-1H-isoindole-2-carbonyl)-6-(trifluoromethyl)-1,2-dihydropyridin-2-one (0.10 mmol, 51 mg), NMP (1 ml), K2CO3 (0.3 mmol, 42 mg). The mixture was stirred at 150 °C for 3h. The crude product was purified by prep-HPLC with the following conditions: Xbridge prep C18 5 vm 30∗150 mm and Welch Ultimate XB-C18:50∗250 mm,10 vm. 5%–90% MeCN in formic acid aq. (0.05%) or 5%–90% MeCN in NH4HCO3 (10 mmol/L) to afford the title compound (5.4 mg, 10%). Off white solid. 1H NMR (600 MHz, DMSO-d6) δ 3.72 (s, 3H), 3.77 (s, 3H), 4.55 (d, J = 14.8 Hz, 1H), 4.59 (d, J = 13.1 Hz, 1H), 4.74 (s, 2H), 6.65 (s, 1H), 6.91 (s, 1H), 7.02 (s, 1H), 7.51 to 7.56 (m, 1H), 7.57 to 7.62 (m, 2H), 7.76 (s, 1H), 12.73 (s, 1H). MS (ESI) m/z = 511 [M+1].

Compound 5: 4-((2,6-dichlorobenzyl)thio)-3-(5,6-dimethoxyisoindoline-2-carbonyl)-6-(trifluoromethyl)pyridin-2(1H)-one: Into a 40 ml vial, 2,6-dichlorobenzyl thiol (0.3 mmol, 58 mg) was added to 4-chloro-3-(5,6-dimethoxy-2,3-dihydro-1H-isoindole-2-carbonyl)-6-(trifluoromethyl)-1,2-dihydropyridin-2-one (0.10 mmol, 51 mg), NMP (1 ml), K2CO3 (0.3 mmol, 42 mg). The mixture was stirred at 150 °C for 3 h. The crude product was purified by prep-HPLC with the following conditions: Xbridge prep C18 5 vm 30∗150 mm and Welch Ultimate XB-C18:50∗250 mm,10 vm. 5% - 90% MeCN in formic acid aq. (0.05%) or 5% - 90% MeCN in NH4HCO3 (10 mmol/L) to afford the title compound (5.5 mg, 9%). Off white solid. 1H NMR (600 MHz, DMSO-d6) δ 3.70 (s, 3H), 3.75 (s, 3H), 4.22 (d, J = 13.7 Hz, 1H), 4.45 (d, J = 13.6 Hz, 1H), 4.56 to 4.72 (m, 4H), 6.87 (s, 1H), 6.97 (s, 1H), 7.34 (dd, J = 8.6, 7.7 Hz, 1H), 7.47 (d, J = 8.1 Hz, 2H), 7.64 (s, 1H), 12.53 (s, 1H). MS (ESI) m/z = 559 [M+1].

Compound 6: 3-(5,6-dimethoxyisoindoline-2-carbonyl)-4-((2,4-dimethylphenyl)thio)-6-(trifluoromethyl)pyridin-2(1H)-one: Into a 40 ml vial, 2,4-dimethyl-thiophenol (0.3 mmol, 42 mg) was added to 4-chloro-3-(5,6-dimethoxy-2,3-dihydro-1H-isoindole-2-carbonyl)-6-(trifluoromethyl)-1,2-dihydropyridin-2-one (0.10 mmol, 51 mg), NMP (1 ml), K2CO3 (0.3 mmol, 42 mg). The mixture was stirred at 150 °C for 3 h. The crude product was purified by prep-HPLC with the following conditions: Xbridge prep C18 5 vm 30∗150 mm and Welch Ultimate XB-C18:50∗250 mm,10 vm. 5% - 90% MeCN in formic acid aq. (0.05%) or 5% - 90% MeCN in NH4HCO3 (10 mmol/L) to afford the title compound (8.9 mg, 16%). Off white solid. 1H NMR (600 MHz, DMSO-d6) δ 2.28 (s, 3H), 2.32 (s, 3H), 3.71 (s, 3H), 3.76 (s, 3H), 4.49 (d, J = 14.6 Hz, 1H), 4.58 (d, J = 13.7 Hz, 1H), 4.75 (s, 2H), 6.34 (s, 1H), 6.94 (s, 1H), 7.02 (s, 1H), 7.16 (d, J = 7.9 Hz, 1H), 7.30 (s, 1H), 7.48 (d, J = 7.8 Hz, 1H), 12.58 (s, 1H). MS (ESI) m/z = 505 [M+1].

Compound 7: N-(4-(1H-pyrazol-4-yl)phenyl)-4-((2,6-dichlorophenyl)thio)-2-oxo-6-(trifluoromethyl)-1,2-dihydropyridine-3-carboxamide: Into a 40 ml vial, 4-(1H-pyrazol-4-yl)aniline (0.15 mmol, 24 mg) was added to 4-((2,6-dichlorophenyl)thio)-2-oxo-6-(trifluoromethyl)-1,2-dihydropyridine-3-carboxylic acid (0.10 mmol, 38 mg), HOBt (0.20 mmol, 27 mg), 1-ethyl-3-(3-dimethylaminopropyl)carbodiimide (0.20 mmol, 31 mg), N,N-diisopropylethylamine (0.30 mmol, 39 mg), and DMF (2 ml). The mixture was stirred at room temperature for 16 h. The crude product was purified by Prep-HPLC with the following conditions: Xbridge prep C18 5 vm 30∗150 mm and Welch Ultimate XB-C18, 50∗250 mm,10 vm. 5% to 90% MeCN in formic acid aq. (0.05%) or 5% - 90% MeCN in NH4HCO3 (10 mmol/L) to afford the title compound (4.2 mg, 8%). Off white solid. 1H NMR (600 MHz, DMSO-d6) δ 5.89 (s, 1H), 7.57 to 7.62 (m, 3H), 7.67 to 7.7 (m, 2H), 7.73 (d, J = 8.1 Hz, 2H), 8.02 (s, 2H). MS (ESI) m/z = 525 [M+1].
Data availability
Please contact the corresponding authors at “ryan.guilbert1@astrazeneca.com” and/or “argyrides.argyrou@astrazeneca.com” for any of the raw data not provided in this manuscript.
Supporting information
This article contains supporting information.
Conflict of interest
The authors declare the following financial interests/personal relationships which may be considered as potential competing interests: All authors are employees of AstraZeneca and have stock ownership and/or stock options or interests in the company.
Acknowledgments
We acknowledge the efforts of our colleagues in the Protein Science and Compound Management teams of Discovery Sciences, and Oncology Chemistry in supporting this work.
Author contributions
M. C. and R. G. conceptualization; A. A., M. C., R. G., and Y. S. methodology; M. C., D. D., D. L., R. G., and Y. S. formal analysis; M. C., R. G., and Y. S. validation; M. C. and R. G. writing–original draft; A. A., D. D., D. L., H. M., M. C., R. G., and Y. S. investigation; A. A., M. C., P. C., R. G., and Y. S. writing–review & editing; A. A. and P. C. project administration; P. C. resources.
Funding and additional information
This work was solely funded by AstraZeneca.
Biographies

Ryan Guilbert completed a doctorate focused on cell biology at the University of Manchester- Cancer Research UK institute. He now works in AstraZeneca’s Biochemical Assay Development group in Cambridge (UK), where he supports oncology projects across AstraZeneca’s pipeline. He has a strong interest in novel modalities and the application of biochemical insights to other disciplines.

Maxime Couturier completed a doctorate focused on enzymology at the University of Cambridge. In 2021 he joined the Biochemical Assay Development group in AstraZeneca to work on their oncology portfolio. He has a strong interest in protein-protein interaction and targeted protein degradation. Maxime also champions the application of innovative technologies, especially automation and AI, to drug discovery and assay development.
Reviewed by members of the JBC Editorial Board. Edited by Philip A. Cole
Contributor Information
Ryan Guilbert, Email: ryan.guilbert1@astrazeneca.com.
Argyrides Argyrou, Email: argyrides.argyrou@astrazeneca.com.
Supporting information
References
- 1.Sasso J.M., Tenchov R., Wang D., Johnson L.S., Wang X., Zhou Q.A. Molecular glues: the adhesive connecting targeted protein degradation to the clinic. Biochemistry. 2023;62:601–623. doi: 10.1021/acs.biochem.2c00245. [DOI] [PMC free article] [PubMed] [Google Scholar]
- 2.Pua K.H., Stiles D.T., Sowa M.E., Verdine G.L. IMPDH2 is an intracellular target of the cyclophilin A and Sanglifehrin A complex. Cell Rep. 2017;18:432–442. doi: 10.1016/j.celrep.2016.12.030. [DOI] [PubMed] [Google Scholar]
- 3.Li F., Aljahdali I.A.M., Ling X. Molecular glues: capable protein-binding small molecules that can change protein-protein interactions and interactomes for the potential treatment of human cancer and neurodegenerative diseases. Int. J. Mol. Sci. 2022;23:6206. doi: 10.3390/ijms23116206. [DOI] [PMC free article] [PubMed] [Google Scholar]
- 4.Rej R.K., Allu S.R., Roy J., Acharyya R.K., Kiran I.N.C., Addepalli Y., et al. Orally bioavailable proteolysis-targeting chimeras: an innovative approach in the golden Era of discovering small-molecule cancer drugs. Pharmaceuticals (Basel) 2024;17:494. doi: 10.3390/ph17040494. [DOI] [PMC free article] [PubMed] [Google Scholar]
- 5.Dong G., Ding Y., He S., Sheng C. Molecular glues for targeted protein degradation: from serendipity to rational discovery. J. Med. Chem. 2021;64:10606–10620. doi: 10.1021/acs.jmedchem.1c00895. [DOI] [PubMed] [Google Scholar]
- 6.Douglass E.F., Jr., Miller C.J., Sparer G., Shapiro H., Spiegel D.A. A comprehensive mathematical model for three-body binding equilibria. J. Am. Chem. Soc. 2013;135:6092–6099. doi: 10.1021/ja311795d. [DOI] [PMC free article] [PubMed] [Google Scholar]
- 7.Konstantinidou M., Arkin M.R. Molecular glues for protein-protein interactions: progressing toward a new dream. Cell Chem. Biol. 2024;31:1064–1088. doi: 10.1016/j.chembiol.2024.04.002. [DOI] [PMC free article] [PubMed] [Google Scholar]
- 8.Simonetta K.R., Taygerly J., Boyle K., Basham S.E., Padovani C., Lou Y., et al. Prospective discovery of small molecule enhancers of an E3 ligase-substrate interaction. Nat. Commun. 2019;10:1402. doi: 10.1038/s41467-019-09358-9. [DOI] [PMC free article] [PubMed] [Google Scholar]
- 9.PYMOL: Molecular Graphics System, Version 1.5.0.1 Schrödinger, LLC.
- 10.Johnson K.A. Fitting enzyme kinetic data with KinTek global kinetic explorer. Methods Enzymol. 2009;467:601–626. doi: 10.1016/S0076-6879(09)67023-3. [DOI] [PubMed] [Google Scholar]
Associated Data
This section collects any data citations, data availability statements, or supplementary materials included in this article.
Supplementary Materials
Data Availability Statement
Please contact the corresponding authors at “ryan.guilbert1@astrazeneca.com” and/or “argyrides.argyrou@astrazeneca.com” for any of the raw data not provided in this manuscript.