

Abstract
Hepatocellular carcinoma (HCC) originates from differentiated hepatocytes undergoing compensatory proliferation in livers damaged by viruses or metabolic-dysfunction-associated steatohepatitis (MASH)1. While increasing HCC risk2, MASH triggers p53-dependent hepatocyte senescence3, which we found to parallel hypernutrition-induced DNA breaks. How this tumour-suppressive response is bypassed to license oncogenic mutagenesis and enable HCC evolution was previously unclear. Here we identified the gluconeogenic enzyme fructose-1,6-bisphosphatase 1 (FBP1) as a p53 target that is elevated in senescent-like MASH hepatocytes but suppressed through promoter hypermethylation and proteasomal degradation in most human HCCs. FBP1 first declines in metabolically stressed premalignant disease-associated hepatocytes and HCC progenitor cells4,5, paralleling the protumorigenic activation of AKT and NRF2. By accelerating FBP1 and p53 degradation, AKT and NRF2 enhance the proliferation and metabolic activity of previously senescent HCC progenitors. The senescence-reversing and proliferation-supportive NRF2–FBP1–AKT–p53 metabolic switch, operative in mice and humans, also enhances the accumulation of DNA-damage-induced somatic mutations needed for MASH-to-HCC progression.
Genotoxic stress and RAS oncoproteins trigger tumour-suppressive replicative senescence6, enforcing cell-cycle withdrawal to curtail further DNA damage, telomere erosion and oncogenesis. However, senescence also accelerates ageing-related pathologies and promotes tumorigenesis through the senescence-associated secretory phenotype (SASP)7. Senescent cells highly express cell-cycle inhibitors8 such as p16INK4a and p21CIP1 and their removal delays ageing-associated degeneration9. Although differentiated hepatocytes rarely divide, they enter a senescence-like state through poorly defined mechanisms triggered by hypernutrition-associated metabolic stress10, linked to insulin resistance and metabolic-dysfunction-associated steatotic liver disease (MASLD)11. Advanced MASLD/MASH is defined by liver damage, inflammation, fibrosis and elevated risk of HCC12. While promoting MASH10, senescence can suppress tumorigenesis13. Although senescent-like premalignant hepatocytes may be subject to immunosurveillance13, MASH is linked to immunosuppression14 and accumulation of disease associated hepatocytes (daHeps)4 that resemble mouse HCC progenitor cells (HcPCs)5. These opposing outcomes raise the important question of how MASH can increase HCC risk while triggering replicative senescence. Addressing this question, we identified a unique, FBP1-centred, signalling and metabolic switch that reverses senescence and enables MASH–HCC progression.
FBP1 controls gluconeogenesis15 and suppresses HCC16,17. Germline FBP1 deficiency combined with glucose deprivation triggers hypoglycaemia, lactic acidosis, hepatomegaly, hepatosteatosis, liver damage and hyperlipidaemia18. Despite dietary management, young adults with FBP1 deficiency exhibit MASLD signs18,19. Whether this culminates in HCC is unclear. Using FBP1-deficient mice, we found that starvation-induced hypoglycaemia is caused by impaired gluconeogenesis and glycogen deficiency, whereas MASLD signs are due to AKT hyperactivation19. Independently of its enzymatic activity, FBP1 stably associates with AKT and aldolase B (ALDOB) and recruits protein phosphatase 2A catalytic subunit (PP2AC) to blunt AKT activation19. FBP1-mediated tumour suppression was explained by diminished glycolysis16, HIF-1 inhibition20 and inhibition of hepatic stellate cell SASP17. Based on our finding of AKT-dependent hepatomegaly in mice with hepatocyte specific activation of NRF221—a metabolism-controlling transcription factor that inhibits senescence22 and promotes hepatocarcinogenesis23—we examined FBP1–NRF2 interactions and their role in FBP1 downregulation in human HCC. We identified a switch-like autoregulated network in which diet-elicited DNA damage cell-autonomously induces p53 and FBP1 to enforce hepatocyte senescence, and this network is reversed after NRF2 and AKT activation in metabolically stressed HCC progenitors.
Diminished p53 and FBP1 in human HCC
Immunohistochemistry (IHC) analysis showed FBP1 downregulation in 71% of 83 human HCCs, strongly correlating with ALDOB loss, AKT activation, elevated MDM2 Ser166 (AKT site) phosphorylation, and p53, p21CIP1 and p16INK4a downregulation, regardless of HCC differentiation grade (Fig. 1a, Extended Data Fig. 1a and Supplementary Table 1a,b). The Clinical Proteomic Tumour Analysis Consortium (CPTAC) and the PXD006512 early HCC proteome24 databases also showed widespread FBP1 and ALDOB downregulation in HCC and strong correlation between low FBP1 and low p21CIP1 and p16INK4a (Fig. 1b, Extended Data Fig. 1b,c and Supplementary Table 1c). Low FBP1 and ALDOB correlated with poor survival and FBP1 mRNA was lower in TP53-mutant HCCs compared with in TP53-wild-type (WT) HCCs (Fig. 1c and Extended Data Fig. 1d,e). The extent of p53 and p21CIP1 downregulation was twofold higher than the reported TP53 mutation frequency25.
Fig. 1 |. p53 dependence, FBP1 downregulation and promoter hypermethylation in human HCC.
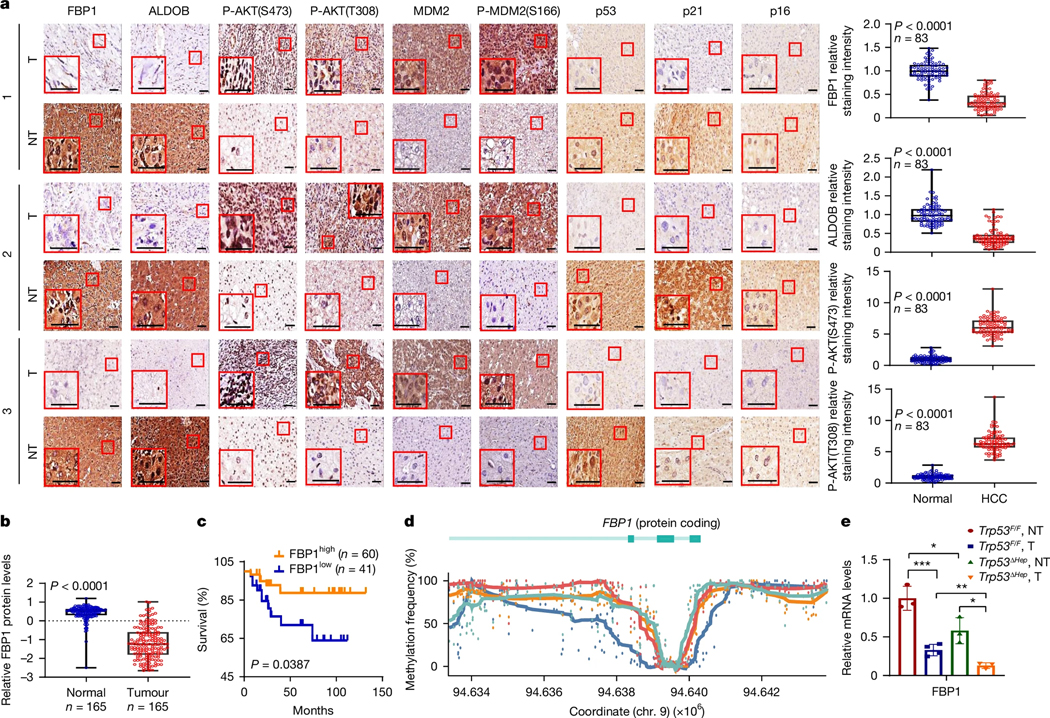
a, Representative IHC analysis of 83 human HCC tumour (T) and adjacent NT tissues. Scale bars, 50 μm. The relative staining intensities (Methods) are shown on the right. b, The relative FBP1 amounts in NT and tumour tissues in the CPTAC-LIHC database. c, PXD006512-LIHC patient survival stratified according to FBP1 expression by best expression cut-off. Significance was determined using a log-rank test. d, FBP1 promoter and 5′ region (chromosome (chr.) 9:94633352–94643777) methylation frequency at individual CpG sites (coloured dots; blue, NT hepatocytes; red, HCC). e, Relative Fbp1 mRNA in WT and Trp53ΔHep tumour and NT tissues 9 months after DEN injection. n = 3 biological replicates. For a,b,e, data are mean ± s.e.m. Statistical significance was determined using two-sided unpaired t-tests or Mann–Whitney U-tests (a,b) and Kruskal–Wallis tests with Dunn post hoc test (e) based on data normality distribution; *P < 0.05, **P < 0.01, ***P < 0.001. The box plots show the median (centre line), first and third quartiles (box limits) and outlier datapoints (whiskers).
We investigated the basis for FBP1 downregulation. Although somatic FBP1 mutations are rare (<1% of human HCCs), FBP1, but not other gluconeogenic genes (PCK1 and G6PC) nor TP53, underwent promoter methylation in 62.8% of HCCs (Extended Data Fig. 1f–j). Moreover, G6PC was not reduced in HCC, whereas low FBP1 protein and mRNA correlated with high DNMT1 expression (Supplementary Fig. 1a,b). Methylome analysis demonstrated FBP1 promoter-region hypermethylation in HCC nuclei compared with in hepatocyte nuclei, whereas TP53 promoter methylation was unaltered (Fig. 1d and Supplementary Fig. 1c,d). FBP1 promoter methylation was confirmed by chromatin immunoprecipitation (ChIP) and reversed by 5-azacytidine treatment, which increased FBP1 mRNA (Supplementary Fig. 1e,f).
In silico analysis identified putative p53-binding sites in the FBP1 gene promoter region (Extended Data Fig. 2a). Congruently, TP53 ablation lowered FBP1 (and CDKN1A, encoding p21CIP1) mRNA and protein in mouse liver, carcinogen-induced HCC, human hepatocytes, and the TP53-WT HCC cell lines HepG2 and SK-Hep-1 (Fig. 1e and Extended Data Fig. 2b–f). Using ChIP, we confirmed p53 recruitment to sites P2 and P3 in mouse liver and in TP53-WT HCC cells but not in TP53Y220C Huh7 cells (Extended Data Fig. 2g–j). High-fat (HFD) or high-fructose (HFrD) diets induced FBP1, p53 and p21CIP1 in Trp53F/F mice but not in Trp53ΔHep mice (Extended Data Fig. 2k).
MASH-elevated FBP1 and p53 blunt HCC
Feeding MASH-susceptible MUP-uPA mice26 a HFrD, but not isocaloric cornstarch diet (CSD)27, induced p53, p21CIP1, p16INK4a and FBP1, and blunted AKT activation (Fig. 2a). FBP1, ALDOB, p53, p21CIP1 and p16INK4a peaked 32 weeks after HFrD initiation and declined thereafter, whereas NRF2 followed the opposite pattern (Extended Data Fig. 3a). By week 22, hepatocyte DNA damage and DNA damage response (DDR) mediators, phosphorylated γH2AX (P-γH2AX), 53BP1, P-ATR and P-CHK1, were elevated along with P-RPA2 (indicating replication fork stalling28) and senescence-associated β-galactosidase (SA-β-gal) (Fig. 2b and Extended Data Fig. 3b,c). HFrD feeding induced early neoplastic lesions, probably containing HcPCs, in which accumulation of polyubiquitylated protein aggregates and the autophagy chaperone p62 suggested autophagy disruption, NRF2 (NQO1), CD44 and MYC were activated, and p53 and FBP1 were downregulated (Fig. 2c and Extended Data Fig. 3d). Hepatocyte FBP1 ablation activated NRF2 and AKT, downregulated p53, p21CIP1 and p16INK4a, and altered the liver morphology (Extended Data Fig. 3e–g). Another MASH model—Western-diet-fed FOZ mice, which show MASH at 8–12 weeks and small HCC nodules at 24 weeks29—yielded similar results (Supplementary Fig. 2a,b).
Fig. 2 |. DNA-damage-induced FBP1 and p53 upregulation in MASH.

a, Immunoblot (IB) analysis of liver lysates from MUP-uPA mice fed CSD or HFrD for 22 weeks. Molecular masses are shown on the on the right. b, Representative comet assays of isolated hepatocytes. n = 3 biological replicates. Original magnification, ×10. Scale bars, 100 μm. Tail DNA and comet tail length quantifications are shown on the right. HMF, high magnification field. c, Representative IHC analysis of MUP-uPA livers at 22 weeks of HFrD. Scale bars, 50 μm. The relative staining intensities of normal versus early neoplastic hepatocytes are shown on the right. d, Relative FBP1 (left) and ALDOB (right) amounts in low- and advanced-fibrosis human MASLD proteomes. e, Representative and quantified comet assays of hepatocytes (hepa) and HcPCs. n = 3 biological replicates. Original magnification, ×10. Scale bars, 100 μm. f, Mouse hepatocyte subtype distribution, as determined using snRNA-seq. n = 3. g, Immunoblot analysis of liver lysates collected at 22 weeks of HFrD. For b–f, data are mean ± s.e.m. Statistical significance was determined using one-way analysis of variance (ANOVA) with Tukey post hoc tests or Kruskal–Wallis test with Dunn post hoc tests (b,e) and two-sided unpaired t-test or Mann–Whitney U-test (c,d,f) based on data normality distribution; NS, not significant; ****P < 0.0001. The box plots show the median (centre line), first and third quartiles (box limits) and outlier datapoints (whiskers).
Analysis of advanced human MASH proteomes30 and tissues confirmed FBP1, ALDOB, p53, p21CIP1, p16INK4a and DDR upregulation, and reduced AKT and NRF2 (measured by NQO1 induction) activity (Fig. 2d and Extended Data Fig. 4a–c). Single-nucleus RNA-sequencing (snRNA-seq) analysis of human MASH livers demonstrated TP53 and FBP1 downregulation in daHeps, thought to represent HCC progenitors4, and HCC clusters, in which the NRF2 transcriptional signature was elevated (Extended Data Fig. 4d). daHeps in mice challenged with liver damaging diets and toxins4 also showed Fbp1 mRNA downregulation and Dnmt1 mRNA upregulation (Extended Data Fig. 4e). As daHeps resemble HcPCs5, we isolated HcPC aggregates from MUP-uPA mice after 22 weeks of HFrD. Notably, FBP1 ablation increased HcPC yield, and HcPCs had more DNA damage than non-aggregated hepatocytes along with DDR and DNMT1 upregulation, AKT and NRF2 activation and FBP1, p53, p21CIP1 and p16INK4a downregulation (Fig. 2e and Extended Data Fig. 5a–c). Thus, in contrast to normal hepatocytes, HcPCs exhibit uncoupling between DNA damage and the p53- and FBP1-mediated senescence response.
Consistent with FBP1’s tumour-suppressive function, MUP-uPA Fbp1ΔHep mice showed accelerated HFrD-induced HCC, with surface lesions appearing at 5 months (Extended Data Fig. 3e), instead of at 9 months as in FBP1-sufficient MUP-uPA mice27. After 40 weeks of HFrD, MUP-uPA Fbp1ΔHep mice exhibited higher HCC burden and markers compared with MUP-uPA Fbp1F/F mice (Extended Data Fig. 5d,e). snRNA-seq confirmed these results, and showed that, consistent with the effect on HcPCs, FBP1 ablation increased daHep abundance while reducing zone 3 hepatocytes (Fig. 2f), the cells from which HCC may originate31. FBP1 ablation relieved HFrD-induced AKT inhibition and enhanced GSK3β Ser9 and MDM2 Ser166 phosphorylation, DDR markers and p53 and p21CIP1 downregulation (Fig. 2g and Extended Data Fig. 5f). The MDM2 inhibitor nutlin-3a or transduction of WT or catalytically inactive FBP1(E98A) blocked HCC in MUP-uPA Fbp1ΔHep mice (Extended Data Fig. 5g,h), underscoring the importance of MDM2-promoted p53 degradation and FBP1-suppressed AKT activation.
Although hepatocyte senescence was proposed to drive MASH and fibrosis32, senescence-abrogating FBP1 ablation increased liver fibrosis, hepatosteatosis, liver and serum lipids, and inhibited glycogen accumulation and insulin resistance (Supplementary Fig. 3a–d). Thus, although hepatocyte senescence precedes MASLD/MASH, it suppresses fibrosis and HCC progression, also suggested by elevated steatohepatitis in Trp53ΔHep mice33.
FBP1 loss licenses tumorigenesis through AKT
To understand how FBP1 loss licenses hepatic tumorigenesis, we used hydrodynamic tail-vein injection (HTVI) of oncogenic NRASG12V with the Sleeping Beauty transposon34. Consistent with NRAS amplification35, NRAS mRNA was elevated in HCC, correlating with poor survival (Supplementary Fig. 4a–d). As expected13, NRASG12V was barely tumorigenic in Fbp1F/F mice but, in Fbp1ΔHep mice, it rapidly induced mildly fibrotic HCC positive for α-fetoprotein (AFP), CD44 and MYC (Fig. 3a,b). NRASG12V-injected Fbp1ΔHep mice died within 20 weeks (Extended Data Fig. 6a). NRAS(G12V) activated AKT only in Fbp1ΔHep livers, along with inhibitory GSK3β Ser9 phosphorylation36, accumulation of the GSK3β substrate NRF2 and MDM2 Ser166 phosphorylation (Fig. 3c). Consistent with NRF2 activation37, p53 and p21 were downregulated (Fig. 3c). AKT activation was apparent 1 week after HTVI, along with NQO1 induction, MDM2 phosphorylation, and reduced nuclear p53, p21CIP1 and p16INK4a, whereas Ki-67 was elevated by 4 weeks (Extended Data Fig. 6b–f). Phosphorylated AKT and GSK3β and NRF2 were higher in HCC compared with in non-tumour (NT) tissue (Extended Data Fig. 6g). Hepatocyte Trp53 ablation also supported rapid NRASG12V-induced HCC, while downregulating FBP1 and enhancing AKT and NRF2 activation (Fig. 3d and Extended Data Fig. 6h).
Fig. 3 |. FBP1 or p53 loss and AKT activation license NRASG12V tumorigenesis.

a, Tumour numbers (left) and volumes (right) in Fbp1F/F and Fbp1ΔHep livers 12 and 16 weeks after NRASG12V HTVI. n = 4–5 biological replicates. b, Sirius Red staining and AFP, CD44 and MYC IHC at 16 weeks after NRASG12V HTVI. Scale bars, 50 μm. Quantified Sirius-Red-positive areas and relative staining intensities are shown on the right. c, Immunoblot analysis of the indicated liver lysates at 16 weeks after NRASG12V HTVI. d, Tumour numbers (top) and volumes (bottom) of Trp53F/F and Trp53ΔHep livers 12 weeks after NRASG12V HTVI. n = 4–5 biological replicates. e, The tumour numbers (top) and volumes (bottom) of Fbp1F/F and Fbp1ΔHep livers transduced with AAV8-Ctrl, AAV8-FBP1 and AAV8-FBP1(E98A) were examined 16 weeks after NRASG12V HTVI, respectively. n = 4–5 biological replicates. f, The tumour numbers (left) and volumes (right) of the indicated livers 16 weeks after NRASG12V HTVI with or without MK2206 (100 mg per kg) treatment for the last 6 weeks. n = 4 biological replicates. g, Immunoblot analysis of liver lysates from f. h, The tumour numbers (top) and volumes (bottom) of the indicated livers at 16 weeks after NRASG12V HTVI with or without nutlin-3a (25 mg per kg) treatment for the last 6 weeks. n = 4 biological replicates. For a,b,d–f,h, data are mean ± s.e.m. Statistical significance was determined using one-way ANOVA with Tukey post hoc tests or Kruskal–Wallis test with Dunn post-hoc tests (a,e,f,h) and two-sided unpaired t-tests or Mann–Whitney U-tests (b,d) based on data normality distribution.
Probing AKT’s role in NRASG12V-induced HCC, we reconstituted Fbp1ΔHep livers with Fbp1-WT or Fbp1E98A, both of which suppressed HCC and fibrosis (Fig. 3e and Extended Data Fig. 7a,b). Although barely affecting early NRAS(G12V) expression, FBP1 reconstitution inhibited NQO1 induction, AKT activation, MDM2 phosphorylation and Ki-67 staining, and restored p53, p21CIP1 and p16INK4a and insulin resistance (Extended Data Fig. 7c–f). AKT inhibitor (AKTi) and nutlin-3a also blocked NRASG12V-induced HCC but—in contrast to AKTi, which blocked NRF2 activation, AKT, GSK3β and MDM2 phosphorylation, and restored p53 and p21CIP1 expression—nutlin-3a did not affect AKT or NRF2 (Fig. 3f–h and Supplementary Fig. 5a–c).
Reversible DNA-damage-induced senescence
Fbp1ΔHep hepatocytes were refractory to SA-β-gal induction by NRASG12V transduction or etoposide treatment (Extended Data Fig. 8a,b). Consistent with previous findings38, ATM and ATR inhibition blocked NRASG12V-induced senescence, but only ATR inhibition blocked HFrD-induced senescence in MUP-uPA mice (Extended Data Fig. 8c–f). This implies that HFrD intake mainly causes ATR-activating DNA single-stranded breaks, whereas NRASG12V induces both single-stranded and double-stranded DNA breaks39. NRASG12V-induced hepatocyte senescence was reversed by FBP1 ablation, PTEN inhibition (BpV) or NRF2 activation (NK252) (Extended Data Fig. 8g,h). Moreover, AAV8-TBG-cre-mediated17 FBP1 ablation in MUP-uPA Fbp1F/F mice reversed HFrD-induced hepatocyte senescence in vivo (Extended Data Fig. 8i–k). Thus, in contrast to ageing-related deep senescence, stress/DNA-damage-induced senescence is reversible.
Reciprocal NRF2–FBP1 interactions
Correlating with inhibitory GSK3β phosphorylation, which blunts NRF2 degradation40, FBP1 ablation in HCC cells activated NRF2 (Fig. 4a). Conversely, FBP1 overexpression inhibited GSK3β Ser9 phosphorylation and decreased expression of NRF2 WT and NRF2(E79Q), a KEAP1-refractory variant, which was prevented by alanine substitution of their GSK3 phosphoacceptors or GSK3 inhibition (Supplementary Fig. 6a–c). In turn, hepatocyte-specific NRF2(E79Q) expression in Nrf2Act-Hep mice, which display AKT-dependent hepatomegaly and EGFR activation21, downregulated FBP1 and p53 (Fig. 4b). ATG7 ablation, which activates NRF2 and enhances HCC development through p62 accumulation41, caused more extensive FBP1 downregulation (Fig. 4c). NRF2(E79Q) expression in HCC cells accelerated FBP1 turnover (Fig. 4d and Supplementary Fig. 6d), probably by inducing ERK-activating growth factors21,42. FBP1 has two potential ERK phosphoacceptors, including Ser271, of which alanine replacement blocked ERK-induced phosphorylation and recruitment of the FBP1-interacting19 ubiquitin ligase43 TRIM28 (Fig. 4e and Supplementary Fig. 6e,f). Fittingly, TRIM28-induced FBP1 ubiquitylation was blocked by ERK2 silencing and enhanced by a phosphomimic S271D substitution (Fig. 4f and Supplementary Fig. 6g). A summary of the metastable cross-regulatory interactions between FBP1 and NRF2 is shown in Supplementary Fig. 6h.
Fig. 4 |. NRF2-induced FBP1 degradation relieves senescence to license tumorigenesis.

a, NRF2 distribution in HCC cells transfected with control (Ctrl) or FBP1 short hairpin RNA (shFBP1). n = 3 biological replicates. Scale bars, 10 μm. b, Immunoblot analysis of liver lysates from 8-week-old Nrf2Tg/Tg and Nrf2Act-Hep mice. c, Immunoblot analysis of liver lysates from 9-month-old Atg7F/F and Atg7ΔHep mice. d, Immunoblot analysis of MYC–NRF2(E79Q)-expressing HCC cells treated with ERKi (SCH772984), MEKi (PD98059) or AKTi (MK2206) at 5 μM for 6 h. e, Co-immunoprecipitation (co-IP) analysis of V5–FBP1 with Flag–TRIM28 from lysates of HEK293T cells that were transfected with or without HA–ERK2(GOF) and proteasome inhibitor (MG132; 10 μM, 6 h) treatment. Gel-separated co-IPs were immunoblotted using anti-Flag antibodies. f, TRIM28-induced ubiquitylation of transfected V5–FBP1 variants in MG132-treated (10 μM, 6 h) HEK293T cells. Gel-separated V5 immunoprecipitates were immunoblotted with anti-MYC antibodies. Blots represent at least three biological replicates. WCL, whole-cell lysates. g, Representative NQO1 and P-ERK1/2 IHC in tumour and NT tissues of 83 human HCCs. Scale bars, 50 μm.
NRF2 activation and FBP1 ablation enhanced hepatocyte DNA damage, probably caused by replication stress28 (Supplementary Fig. 7a–d). Moreover, NRF2 activation, which licensed NRASG12V-induced HCC development and increased mouse mortality, stimulated ERK1/2 and AKT phosphorylation and Ki-67 expression, and repressed FBP1, p53, p21CIP1 and p16INK4a (Extended Data Fig. 9a–e and Supplementary Fig. 7e). Despite increased DNA damage, NRAS(G12V) induced FBP1, p53, p21CIP1 and p16INK4a in WT but not Nrf2Act-Hep livers, in which FBP1 and p53 were degraded (Supplementary Fig. 7f). NRF2 activation and FBP1 degradation were further elevated in tumour tissue (Supplementary Fig. 7g). FBP1-WT or FBP1E98A transduction into Nrf2Act-Hep livers suppressed HCC induction, as did hepatocyte NRF2 ablation in Fbp1ΔHep mice (Supplementary Fig. 7h,i), further demonstrating reciprocal FBP1–NRF2 interactions. FBP1low human HCCs also showed upregulation of NRF2, its target NQO1 and ERK phosphorylation (Fig. 4g, Supplementary Fig. 7j and Supplementary Table 2).
Inverse transcriptome control by NRF2–FBP1
RNA-seq analysis showed that more than one third of the differentially expressed genes upregulated in Fbp1ΔHep versus Fbp1F/F livers were NRF2 inducible, including fatty acid, sulfur compound, small-molecule, nucleoside, nucleotide, ribonucleotide and amino acid metabolism genes that support elevated cell proliferation (Fig. 5a, Extended Data Fig. 10a and Supplementary Table 3). Notably, classical, oxidant-detoxifying NRF2 targets were barely represented in this set. One quarter of the differentially expressed genes that were downregulated after FBP1 ablation, associated with ribonucleoprotein biogenesis, noncoding RNA and mRNA metabolism, actin filament organization, cellular senescence, p53 signalling and regulation of apoptosis, were also suppressed in Nrf2Act-Hep livers (Fig. 5b, Extended Data Fig. 10b and Supplementary Table 3). NRASG12V transduction had little effect on the above metabolic genes, while upregulating oxidative stress, autophagy and cell-cycle genes in Nrf2Act-Hep and Fbp1ΔHep livers (Extended Data Fig. 10c,d). By contrast, in control livers NRASG12V induced senescence-related, p53-regulated, genes and suppressed cell-cycle genes (Fig. 5c,d and Supplementary Tables 4 and 5). Many genes affected by NRF2 activation or FBP1 ablation overlapped with genes affected by hepatocyte p53 ablation in normal chow (NCD)- and HFD-fed animals44 (Extended Data Fig. 10e–h and Supplementary Tables 6 and 7). AAV8-FBP1-induced senescence genes, many of which were interferon-response-related and suppressed cell-cycle genes in NRASG12V-transfected Nrf2Act-Hep livers (Extended Data Fig. 10i,j and Supplementary Tables 4 and 5). The human CPTAC database exhibited similar FBP1 effects on cell senescence and cell-cycle proteins (Fig. 5e), confirming that NRF2 and FBP1 inversely control a counter-senescence program linked to metabolic reprogramming. Mouse liver proteomics confirmed the overlap between NRF2 activation and FBP1 ablation, affecting the same pathways and responses as above (Supplementary Fig. 8a,b).
Fig. 5 |. NRF2 and FBP1 inversely affect the hepatocyte transcriptome.

a, Gene Ontology Biological Process (GO BP) enrichment analysis of overlapping upregulated genes in Nrf2Act-Hep versus Nrf2Tg/Tg and Fbp1ΔHep versus Fbp1F/F livers. n = 3 biological replicates. The dot size and colour represent gene number and statistical significance, respectively. b, Gene Ontology Biological Process enrichment analysis of overlapping downregulated genes in Nrf2Act-Hep versus Nrf2Tg/Tg and Fbp1ΔHep versus Fbp1F/F liver. n = 3 biological replicates. c, Heat maps of cell senescence mRNAs in Nrf2Tg/Tg and Nrf2Act-Hep livers 1 week after control or NRASG12V HTVI. d, Heat maps of cell-cycle mRNAs in the above livers. e, Cell senescence (CS) (top) and cell cycle (bottom) scores of FBP1 protein amounts in CPTAC-LIHC data. n = 330. For e, data are mean ± s.e.m.
NRF2–FBP1 inversely affects mutagenesis
HFD-induced MUP-uPA HCCs contain somatic mutations14. Duplex sequencing, which increases variant-calling accuracy45, of HFrD- and HFD-induced MUP-uPA Fbp1ΔHep HCCs revealed an average of 500 single-base substitutions and 100 small insertions and deletions (indels) per tumour with mutation patterns enriched for C>T transitions, especially in HFrD-induced HCCs (Fig. 6a and Extended Data Fig. 11a,b). This can be explained by the previously identified COSMIC mutational signatures46 SBS1, SBS5, SBS17a/b, SBS12, SBS18 and SBS30 (Extended Data Fig. 11c,d) with C>T mutations explained by SBS1 and SBS30, which overlapped with those found in parental MUP-uPA mice14. The overabundance of C>T mutations could be due to single-stranded DNA damage, suggested by its ATR dependency, which favours C>T transitions47. NT tissues contained many fewer somatic mutations.
Fig. 6 |. Mutational signatures and HCC emergence from DNA-damaged and senescent progenitors.

a, Mutational signatures based on the trinucleotide frequency of HFrD-induced MUP-uPA Fbp1ΔHep HCCs (1 tumour per run). b, Mutational signatures displayed as described above of NRASG12V-induced Nrf2Act-Hep HCCs. c, DAPI-stained frozen mT/mG liver sections (n = 3) with the indicated treatment were scanned using the Olympus SLIDEVIEW VS200 slide scanner. Scale bars, 20 μm. Subs, substitutions.
We postulated that NRF2 activation or FBP1 loss augments NRASG12V-induced mutations because they increase hepatocyte DNA damage and cell proliferation. Indeed, whole-genome sequencing of NRASG12V-transduced Nrf2Act-Hep and Nrf2Tg/Tg livers and tumours showed that, whereas control livers hardly contained any mutations, tumours with NRF2 activation had 1,000–2,000 substitutions and 10–20 indels (Fig. 6b and Extended Data Fig. 11e). In contrast to MUP-uPA tumours, NRASG12V-induced HCCs were also enriched for T>C transitions due to SBS12, resulting in a human HCC-like pattern46. The COSMIC mutational signatures that can explain these patterns were again SBS1, SBS5, SBS17a and SBS12 (Extended Data Fig. 11f,g).
HCC emerges from reversibly senescent progenitors
The above experiments suggest that oncogenic mutations first arise in stressed and DNA-damaged hepatocytes but are not propagated unless these senescent cells re-enter the cell cycle. We tested this hypothesis through lineage tracking in mT/mG mice with the red–green reporter allele that initially produces membrane-localized tdTomato RFP and, after Cre-mediated recombination, is replaced by membrane-localized eGFP48. On day −14, mT/mG mice were transduced with control or AAV8 vectors expressing Cre from either a constitutive (TBG) or a DNA-damage- and senescence-responsive truncated Cdkn1a promoter (p21-cre), with lower basal activity than the Cdkn2a (encoding p16INK4a) promoter and full etoposide inducibility (Extended Data Fig. 12a–c). On day 0, NRASG12V was introduced by HTVI, triggering hepatocyte senescence marked by p53 and p21CIP1 induction and NRF2 and P-AKT downregulation. On day 14, the mice were treated with BpV (PTENi) to reactivate AKT and NRF2 and suppress p53 and p21CIP1, with no effect on NRAS(G12V) expression (Extended Data Fig. 12a–f). BpV treatment also induced hepatocyte proliferation and CD44 expression. After 14 more weeks, the livers were collected and analysed. As expected, BpV treatment strongly enhanced HCC development, regardless of the AAV8 vector used (Extended Data Fig. 12g). Importantly, TBG-cre transduction induced green-fluorescent hepatocytes throughout the liver, outside and inside HCC nodules; however, in p21-cre transduced mice, the green fluorescence signal was restricted to and present in most tumour areas, including small tumours that arose without BpV treatment (Fig. 6c).
Discussion
MASH increases liver cancer risk32, but also triggers tumour-suppressive hepatocyte senescence10,13. How senescence is established and eventually bypassed to license MASH to HCC progression was unclear. Here we show that metastable cross-regulatory interactions between tumour suppressive FBP1 and p53, which are upregulated in MASH and lost in HCC, and tumour promoting NRF2, which is activated in most HCCs but downregulated in MASH (Supplementary Fig. 9), resolve this conundrum. Extensive histological, proteomic and transcriptomic analyses of human and mouse livers show that MASH hepatocytes express high amounts of FBP1, p53 and key senescence markers, whereas daHeps, HcPCs and established HCC show FBP1 and p53 downregulation, probably triggered by NRF2 activation after autophagy disruption in metabolically stressed HCC progenitors. This response, which is conserved between mice and humans, is induced by energy-dense diets that elicit hepatocyte DNA damage and DDR activation, the key outputs of which are p53 and FBP1, which support each other’s expression. By recruiting PP2AC, FBP1 restricts activation of AKT19, which phosphorylates MDM2 and enhances p53 degradation49. Phosphorylation by AKT also inhibits GSK3α/β substrate binding36, therefore slowing the degradation of NRF2, an activator of MDM2 transcription37 (Supplementary Fig. 9). Similar HCC suppressive regulatory interactions are triggered by NRAS(G12V), and both HFrD- and NRAS(G12V)-induced senescence are reversed on AKT and NRF2 activation or FBP1 ablation. In addition to induction of metabolic and cell-cycle genes through autocrine production of ERK-activating growth factors21,42, NRF2 triggers phosphorylation-dependent FBP1 degradation and removes the brakes on AKT activation by insulin or growth factors, resulting in accelerated p53 degradation and senescence reversal. These regulatory interactions tilt the balance from FBP1-associated tumour suppression to HcPC expansion, which enables the propagation of DNA-damage-induced mutations and tumorigenesis. Consistent with these nonlinear biochemical relationships, FBP1 and p53 are the most frequently downregulated HCC suppressors, the loss of which in 75% of HCCs cannot be fully attributed to mutations. Although FBP1 mutations are rare, FBP1 promoter methylation is present in 63% of HCCs, correlating with elevated DNMT1 in daHeps and HcPCs, the inhibition of which in TP53-WT HCC cells increases FBP1 expression. Notably, FBP1-induced senescence is fully reversed on NRF2 or AKT activation and lineage-tracing experiments show that DNA-damaged hepatocytes in which Cdkn1a transcription was activated progress to HCC after senescence reversal.
Reciprocal FBP1–NRF2 interactions are further reflected in transcriptomic and proteomic signatures, showing that NRF2-activated metabolic and cell-cycle genes are indirectly repressed by FBP1. Although MASH and HCC are linked to cell stress, MASH is not a simple prelude to HCC, as the two are associated with opposing metabolic states. Consistent with FBP1 upregulation and AKT inhibition, MASH is characterized by increased gluconeogenesis, glycogenesis and insulin resistance50. Elevated gluconeogenesis lowers glycolytic flux and blunts lactate production19. By contrast, NRF2 activation upregulates many biosynthetic pathways, downregulates gluconeogenesis and glycogenesis, and increases glycolytic flux. Although enhanced Warburg’s aerobic glycolysis is a common feature of rapidly growing cancers, a more critical FBP1 function is its non-enzymatic ability to restrain activation of AKT, one of the most important oncogenic protein kinases. By dismantling hepatocyte senescence, FBP1 ablation and AKT activation aggravate inflammation and fibrosis, which favour accumulation of immunosuppressive, HCC-promoting IgA+ plasmocytes14. Notably, both MASH and HCC are triggered by DNA damage-inducing energy-dense diets but have different outcomes. FBP1 and p53 elevation in MASH suppress propagation of damage-elicited mutations and HCC initiation. Yet, once NRF2 is activated and FBP1 and p53 are degraded, senescent HCC progenitors re-enter the cell cycle and accumulate oncogenic mutations. We suggest that the development of effective DNA damage inhibitors is warranted both for MASH and HCC prevention.
Online content
Any methods, additional references, Nature Portfolio reporting summaries, source data, extended data, supplementary information, acknowledgements, peer review information; details of author contributions and competing interests; and statements of data and code availability are available at https://doi.org/10.1038/s41586-024-08317-9.
Methods
Mice
Fbp1F/F mice were generated at the M.C.S. laboratory and crossed to Alb-cre mice at UCSD to generate Fbp1ΔHep mice. Fbp1ΔHep and MUP-uPA mice were crossed to obtain MUP-uPA Fbp1ΔHep mice. Trp53ΔHep mice were from D.D. Nfe2l2IE79Q/+ mice were generated at Genentech, and Nfe2l2F/F mice were from JAX (025433). Nfe2l2IE79Q/+, Nfe2l2F/F and Atg7F/F mice were intercrossed with Alb-cre (C57BL/6, JAX) mice to generate Nfe2l2Act-Hep, Nfe2l2ΔHep and Atg7ΔHep mice. Fbp1ΔHep and Nfe2l2ΔHep mice were used to generate Fbp1ΔHep;Nfe2l2ΔHep mice. All of the mice were backcrossed into the C57BL/6 background for at least nine generations, and only male mice were used, unless specified otherwise. Mice were housed at 18–23 °C with 40–60% humidity and maintained in filter-topped cages on autoclaved food and water with a 12 h–12 h light–dark cycle. Experiments were performed according to UCSD Institutional Animal Care and Use Committee (S00218) and NIH guidelines and regulations. Animal protocol S00218 (M.K.) was approved by the UCSD Institutional Animal Care and Use Committee. Mice were fed a HFrD (Research Diets, D02022704i) or CSD (Research Diets, D12450Ki) starting at 6–8 weeks of age for the indicated durations. Body weight and food consumption were monitored bi-weekly. For DEN-induced HCC, 15-day-old male mice were intraperitoneally (i.p.) injected with 25 mg per kg DEN (Sigma-Aldrich, N0258) and livers were collected 9 months later. mT/mG mice were purchased from Gene&Peace Biotech ( Jiangsu), and originated from The Jackson Laboratory (007676). mT/mG mice were bred and maintained at the Experimental Animal Center of West China Hospital of Sichuan University and the animal protocol was approved by the Animal Care and Use Committee of Sichuan University. All experimental mice were randomly allocated into the different control and treatment groups. All histological results were confirmed by a certified pathologist blinded to the experimental design. All other mouse relevant information is provided. All cell line sources are mentioned and verified routinely to be mycoplasma free as indicated.
For HCC induction by hydrodynamic injection, Fbp1ΔHep, Nfe2l2Act-Hep or Trp53ΔHep mice were intravenously (i.v.) injected with NRASG12V (12.5 μg ml−1) and Sleeping Beauty transposase (SB13) (2.5 μg ml−1) plasmids diluted in Ringer’s solution at 0.1 ml g−1 body weight in 5–7 s. Mice were euthanized if the IACUC-approved humane end points were reached.
Human hepatocytes and NASH samples
Transplantation-rejected donor livers were obtained from the Life-sharing Organ Procurement Organization as a part of T.K.’s research programme. Normal and NASH livers were characterized by histological and pathological features listed in Supplementary Table 8. This study was approved under IRB171883XX (November 2017 by the UCSD human Research Protection Program, under the title ‘Unused liver from deceased donors: role of myofibroblasts in liver fibrosis’). Hepatocyte isolation and purification were previously described19.
Cell lines and reagents
Human HCC HepG2, SK-HEP-1, Hep3B and Huh7 cells were purchased from ATCC (HB-8065, HTB-52, HB-8064) and Cell Bank, respectively. These and HEK293T (ATCC, CRL-3216) cells were tested regularly using the EZ-PCRTM Mycoplasma Detection Kit (Biological Industries, 20–700-20), were confirmed to be mycoplasma negative, and were cultured in low-glucose MEM, DMEM or MEM (Thermo Fisher Scientific, 11095080, 11885084 and 1266044, respectively), plus 10% fetal bovine serum (FBS; Gibco), penicillin (100 mg ml−1) and streptomycin (100 mg ml−1). Cells were incubated at 37 °C in a humidified chamber with 5% CO2. Etoposide (HY-13629), 5-azacytidine (HY-10586), BpV(HOpic) (HY-128693) and NK252 (HY-19734) were purchased from MCE.
Human HCC specimens and scoring
Human HCC specimens (n = 83) were acquired from patients diagnosed with HCC at the First Affiliated Hospital of Chongqing Medical University and Wuhan University, Zhongnan Hospital. All of the patients received standard surgical resection and no chemotherapy before surgery. The studies were conducted in accordance with the Declaration of Helsinki and approved by the review board of Chongqing University. HCC diagnoses and grades were confirmed by histological review by at least two certified liver pathologists at UCSD and the PRC. FBP1, ALDOB, p53, P-AKT(S473), P-AKT(T308), MDM2, P-MDM2(S166), NQO1, P-ERK1/2, p21CIP1 and p16INK4a staining intensities were determined as described below.
A modified labelling score (H score) was calculated based on the percentage of positively stained cancer cells and staining intensity per tissue core37. Staining intensity was classified as: 0, negative; 1, weak; 2, moderate; 3, strong. By multiplying the staining intensity by the percentage of positively stained cancer cells, from 0% to 100%, the H score ranges from 0 to 300. Cores with overall scores of 0–5, 5–100, 101–200, 201–300 were given negative, weak, intermediate and strong expression designations. Sections with cancer cell staining positivity of <5% were considered to be negative (H score, 0–5). Negative and weak were viewed as low expression and intermediate and strong were viewed as high expression. For sections with two satisfactory cores, the results were averaged; for cases with one poor-quality spot, the results were based on the interpretable core. Based on this evaluation system, Spearman correlation analysis or χ2 tests were used to estimate the association between FBP1, p53, p21CIP1 and p16INK4a staining intensities and their correlation with the HCC differentiation state, independently evaluated by two pathologists.
Constructs, plasmids and vectors
V5-FBP1, V5-FBP1E98A were generated in the M.C.S. laboratory. TP53-WT and TP53 shRNAs were a gift from M. Oren at the Weizmann Institute. NRASG12V (pT/Caggs-NRASV12, 20205), Sleeping Beauty 13 (SB13) (PT2/C-Luc//PGK-SB13, 20207), pLenti-PGK-NRAS(G12V) (35632) and HA-ERK2-GOF (53203) were purchased from Addgene. Flag-GSK3β and Flag-TRIM28 were gifts from G. Qing and K. Itahana, respectively. shERK2 was cloned into the PLKO.1 between the AgeI and EcoRI sites. FBP1 (TRCN0000050034, TRCN0000050035) shRNAs were purchased from Sigma-Aldrich. FBP1S271A, FBP1S271D, NRF2E79Q, NRF26S/6A and NRF2E79Q/6S/6A were constructed using the Q5 Site-Directed Mutagenesis Kit (NEB, E0554S) in the PCDH-V5-FBP1 and PCDH-NRF2 vectors. A list of the primers is provided in Supplementary Tables 9 and 10. AAV-Ctrl (VB231106–1620snr), p21-cre (VB230928–1027pun) and p16-cre (VB230924–1256xmy) were constructed by Vectorbuilder, and AAV8-TBG-cre (107787) was purchased from Addgene.
Plasmid transfections and virus infection
Expression vectors were transfected into HEK293T cells or HCC cell lines using Lipofectamine 3000 (Invitrogen, L300008) according to the manufacturer’s protocol. Lentiviruses were produced by co-transfecting PSPAX2 (4 μg), PMD2.G (4 μg) and PCDH-V5-FBP1 (8 μg), NRF2(E79Q) (8 μg) or different p53 mutants (8 μg) or empty PLKO.1 (8 μg) vectors into HEK293T cells. After 6–8 h, media were replaced with fresh DMEM plus 10% FBS. Virus-containing medium was collected 48–64 h later and filtered through a 0.45 μm Steriflip filter (Millipore). HepG2, Huh7, SK-HEP-1 or Hep3B cells were infected with 1 ml virus containing medium with 8 μg ml−1 polybrene for 16–24 h. Cells were allowed to recover in complete medium for 48 h and then selected with 1.25 mg ml−1 puromycin. After 2–3 days, surviving cells were used in the different experiments.
In vivo treatments
To evaluate the roles of AKT and p53 in oncogene- and diet-induced tumorigenesis, MK-2206 (100 mg per kg) or nutlin-3a (25 mg per kg) were i.p. injected into NRASG12V-transduced Fbp1ΔHep mice and HFrD-fed MUP-uPA Fbp1ΔHep mice twice a week for 6 or 8 weeks until they were euthanized by 16 weeks after HTVI or 40 weeks of HFrD. Mice were monitored daily for food and water consumption and their body weight was measured weekly. For lineage tracing, mT/mG mice (aged 6 to 8 weeks) were i.v. injected with AAV8-Ctrl, AAV8-TBG-cre and AAV8-p21-cre (5 × 10¹¹ copies per mouse), followed by NRASG12V HTVI. Then, 2 weeks later, the mice were treated with BpV(HOpic) (0.5 mg per kg) or Ctrl twice a week for 8 weeks and euthanized 16 weeks after HTVI.
Primary hepatocyte and HcPC isolation
Eight-week-old male Fbp1F/F and Fbp1∆Hep or Trp53F/F and Trp53∆Hep hepatocytes were isolated by a two-step collagenase perfusion18. In brief, livers were perfused with HBSS (Thermo Fisher Scientific, 14175095) containing 0.5 mM EDTA and 25 mM HEPES and digested in digestion buffer (HBSS with Ca2+ and Mg2+ (Thermo Fisher Scientific, 24020117), 25 mM HEPES and 1 mg ml−1 liberase). Hepatocytes were centrifuged at 50g for 3 min at 4 °C then purified using a Percoll gradient. Hepatocytes were counted and plated at 4 × 10⁵ cells per well in collagen-coated six-well plates for 6 h in plating medium (DMEM low glucose, 5% FBS and 1% penicillin–streptomycin). After cell attachment, the plating medium was replaced with maintenance medium (Willams E medium, 2 mM glutamine and 1% penicillin–streptomycin).
HcPCs were isolated as described previously5. In brief, after collagenase perfusion, liver single-cell suspensions and aggregates were separated by passage through 70 and 40 μm sieves. HcPC aggregates were then dispersed by gentle pipetting in Ca/Mg-free PBS on ice. After washing and centrifugation, HcPC aggregates were counted and plated onto collagen-coated plates for further analysis.
IP and immunoblot analysis
Cells were collected and lysed in RIPA buffer (50 mM Tris-HCl, pH 7.4, 150 mM NaCl, 1% Triton X-100, 1% sodium deoxycholate, 0.1% SDS, 1 mM EDTA) supplemented with complete protease and phosphatase inhibitor cocktails (Thermo Fisher Scientific, 78439 and 78427). Livers were homogenized in a Dounce homogenizer (Thomas Scientific) with 30 strokes in RIPA buffer with a complete protease and phosphatase inhibitor cocktails. For IP experiments, cells were collected in lysis buffer (20 mM Tris-HCl, pH 7.5, 1% NP-40, 137 mM NaCl, 1 mM MgCl2, 1 mM CaCl2, 10% glycerol) supplemented with complete protease and phosphatase inhibitor cocktails. Pre-cleared cell lysates were incubated with 30 μl protein G beads (Life Technologies), followed by 2 μg isotype-matched IgG control or indicated antibodies on a rocking platform overnight at 4 °C. The next day, 50 μl protein G was added and incubated for another 2–3 h. The immunocomplexes were washed five times in lysis buffer, separated by SDS–PAGE and transferred to polyvinylidene difluoride membranes, blocked in 5% non-fat milk and incubated with the indicated primary antibodies overnight. Secondary antibodies were added for another hour, then detected using Clarity Western ECL Substrate (Bio-Rad) and thee Western blot detection kit (Kindle Bioscience) and analysed using an automatic X-ray film processor. A list of the antibodies used is provided in Supplementary Table 11.
ChIP and MeDIP
ChIP–qPCR was performed as described previously51. In brief, cells or tissues were cross-linked with 1% formaldehyde, the reactions were stopped with 0.125 M glycine and the samples were sonicated on ice to generate DNA fragments of 200–800 bp. Next, 1% of each sample was saved as input. IPs were performed using p53 and NRF2 antibodies. Immunoprecipitated DNA was eluted and analysed using quantitative PCR (qPCR) with the primers listed in Supplementary Table 12. Methylated DNA IP (MeDIP) was performed using the EpiQuik Methylated DNA Immunoprecipitation Kit (Epigentek, P-2019–48). In brief, DNA was extracted from SK-HEP-1 and HepG2 cells, sheared and added into microwells coated with IgG and 5-methylcytosine antibodies. DNA was released from the antibody–DNA complex and purified through Fast-Spin Columns. qPCR assays were then performed with eluted DNA. A list of the qPCR primers is provided in Supplementary Table 12.
Histology and immunostaining
Dissected livers were fixed in 4% paraformaldehyde and paraffin-embedded. The sections were cut at a thickness of 5 μm and stained with H&E (Leica, 3801615, 3801571), Sirius Red (ab246832) and processed for IHC. For frozen-block preparations, liver fragments were embedded in Tissue-Tek OCT compound (Sakura Finetek), sectioned at a thickness of 5 μm and stained with Oil Red O (ORO). For Sirius Red analysis, areas of at least 1 mm3 were quantified using ImageJ and normalized for vascularization and lipid accumulation using corresponding H&E-stained areas. For ORO analysis, multiple images (4–5) from each section were quantified and averaged using ImageJ.
IHC was performed as follows. After xylene deparaffinization and rehydration with ethanol, antigens were retrieved for 15 min at 95 °C with 0.1% sodium citrate buffer. After quenching peroxidases with 3% H2O2 and blocking with 5% BSA, the sections were incubated with the indicated antibodies (Supplementary Table 11) overnight at 4 °C followed by incubation with biotinylated secondary antibodies (1:200) for 30 min and Streptavidin–HRP (1:500) for 30 min. After three PBS washes, bound peroxidase was visualized by 1–10 min incubation in 3,3′-diaminobenzidine (DAB) solution (Vector Laboratories, SK-4100). Images were captured on an upright light/fluorescent Image A2 microscope with the AxioVision Release v.4.5 software (Zeiss) and the Olympus SLIDEVIEW VS200 research slide scanner. For immunostaining, tissues were embedded in Tissue Tek OCT (Sakura Finetek) and snap-frozen. Tissue sections were fixed in cold acetone/methanol for 10 min, blocked with PBS/1% normal donkey serum for 30 min and incubated with primary antibodies overnight at 4 °C. The slides were washed with PBS and incubated with secondary antibodies and DAPI for another 1 h. Images were captured on the TCS SPE Leica confocal microscope or scanned with Olympus SLIDEVIEW VS200 research slide scanner and quantified by counting stained nuclei/positive area in each field of view (4–5 areas for each slide) with ImageJ.
Comet assay
The comet assay was performed using the Oxiselect STA-351 kit (Cell Biolabs, STA-351). In brief, after placing the base agarose layer onto the OxiSelect slide, single-liver-cell suspensions were mixed with comet agarose and plated on top of the basal layer. Embedded cells were treated with lysis buffer for 1 h at 4 °C, which was replaced with pre-chilled alkaline solution for 30 min. The slides were then horizontally electrophoresed for 30 min in the alkaline solution at 300 mA and 20 V. The slides were stained with a DNA dye, visualized using a TCS SPE confocal microscope and images were taken with 10× magnification. Quantification was performed using the OpenComet open-source software tool with ImageJ.
DNA-seq analysis
WGS analysis.
DNA was extracted with DNeasy Blood & Tissue Kit by according to the manufacturer’s protocol. DNA samples were sent to BGI Americas for whole-genome sequencing (WGS). DNA WGS library preparation was performed using the BGI library preparation protocol. Qualified libraries were sequenced on the BGI sequencing platform according to effective concentration and data volume. For tumour tissue samples, the effective coverage of sequencing was 60× and for matched normal samples the effective coverage was 40×. Post-sequencing analysis was performed within Triton Shared Compute Cluster (TSCC) at the UCSD. In brief, quality assurance of the raw FASTQ files was evaluated using FastQC52 and Mosdepth. Raw sequence reads were aligned to the mouse reference genome mm39. The aligned reads were marked for duplicates using MarkDuplicates (Picard)-GATK53. EnsembleVariant-CallingPipeline (EVC) was used to call single-nucleotide variants and short indels. EVC implements the single-nucleotide variant and indel variant calling from four variant callers (Mutect2, Strelka2, Varscan2, MuSE) and only passed mutations called with any two variant callers were considered true mutations52,54. After annotation of each variant using Ensembl Variant Effect Predictor (VEP, v.106), somatic mutations were taken forward for amino acid change detection. Mutational profile and signature analysis were performed using SigProfiler bioinformatic tools developed by the L.B.A. laboratory55 at UCSD.
Duplex sequencing.
A modified single-molecule sequencing45 protocol was used to perform library preparation and sequencing for genome-wide detection of mutations. The following modifications were made to the original NanoSeq protocol: (1) to avoid error introduced during end repair of sonicated DNA, an enzymatic (NEBNext dsDNA Fragmentase) fragmentation approach was used to fragment the dsDNA for 20 min with 100 ng DNA as input; (2) after fragmentation and AMPure bead purification, 10 ng DNA was used as an input for library preparation using the IDT xGen cfDNA & FFPE DNA Library Prep Kit; (3) after quantification of adapter ligated DNA molecules with qPCR, 0.1 fmol diluted DNA libraries was taken forward for unique dual indexing and Illumina 150PE sequencing (NovoGene). The NanoSeq45 data analysis pipeline was used for somatic mutation calling. After annotation of each variant using Ensembl Variant Effect Predictor (VEP, v.106), somatic mutations were taken forward for amino acid change detection. Mutational profile and signature analysis were performed as described above.
snRNA-seq data acquisition and analysis
Human and mouse daHep snRNA-seq data (Extended Data Fig. 6d,e) are accessible online (https://doi.org/10.17632/w7yh4yjvbw.2)4. The dataset contains n = 19 single-nucleus transcriptomes spanning the spectrum of liver disease from healthy to NAFLD, cirrhosis and HCC (healthy, n = 8; NAFLD, n = 7; cirrhosis, n = 2; and HCC, n = 2), and was originally created by integrating data from Gene Expression Omnibus (GEO) accessions GSE185477, GSE174748, GSE192742 and GSE212046 (refs. 56,57). Detailed data processing and analysis was described4, leading to identification of 78,250 hepatocyte nuclei that were clustered and annotated as normal hepatocytes, daHeps and three HCC clusters, referred to as HCC_1, HCC_2 and HCC_3. Here we created a NRF2 pathway signature score using the AddModuleScore function in Seurat by including all n = 141 genes from the Wikipathays NRF2 pathway annotation (WP2884). The mouse dataset represents nine single-nucleus transcriptomes from healthy mice fed normal chow (n = 3); choline-deficient, ethionine-supplemented (CDE) diet (n = 3); and mice given thioacetamide (TAA) in drinking water (n = 3). All of the treatments lasted for 3 weeks. Original data are deposited at the GEO (GSE200366). A total of 12,540 hepatocyte nuclei were identified, clustered and annotated as zone 1 (Sds, Hal, Gls2), zone 2 (Cyp2e1, Cyp2c67, Cyp2c29), zone 3 (Glul, Slac1a2, Lgr5) and daHep, characterized by high expression of stress-response, cell death and HCC-related genes (Gsta1, Hsp90aa1, Apaf1), and low expression of hepatocyte identify and function genes (Fbp1, Acsl1, G6pc). Visualizations were generated using the Seurat v.4 and scCustomize R packages58.
DNA methylation analysis
Three HCC and one non-lesional liver tissue specimen were obtained from the Perkins Translational Cancer Biobank under human ethics approval from the Government of Western Australia Department of Health Research Governance Service (RGS0000000919). Specimens originated from surgical resection procedures in patients diagnosed with HCC and enrolled in the Liver Cancer Collaborative (LCC) cohort. HCC and normal hepatocyte nuclei were isolated by fluorescence-activated nucleus sorting (FANS) from tumour and non-lesional surrounding tissue, respectively. Nucleus purification was followed by DNA isolation and sequencing on the Oxford Nanopore Technologies (ONT) PromethION R10.4.1 flow cell (FLO-PRO114M) using a P2 Solo sequencing device to obtain whole-genome 5-methylcytosine (5mC) methylation data. In brief, tissue chunks of approximately 100 mg were cut into small pieces and immediately homogenized in 5 ml of lysis buffer (10 mM Tris-HCl, 10 mM NaCl, 3 mM MgCl2 and 0.1% IGEPAL CA-630, pH 7.4) using a 10 ml Dounce homogenizer. Lysis proceeded on ice for 10 min followed by straining the lysates through 40 μm cell strainers. Lysates were centrifuged at 700g for 5 min at 4 °C and resuspended in 500 μl wash buffer (PBS supplemented with 1% BSA). Nuclei were fixed by slowly adding 4.5 ml of ice-cold methanol/acetone (1:1) followed by 10 min incubation on ice. Nuclei were washed once with 4 ml of wash buffer, resuspended in wash buffer, stained with propidium iodide, then counted using a fluorescence microscope and haemocytometer. Anti-HNF-4α antibody Alexa Fluor 647 (sc-374229, AF647) was added to the nucleus suspension at 0.5 μl per million nuclei, followed by incubation at room temperature in the dark for 1 h. HCC and normal hepatocyte nuclei, identified by HNF-4α expression, were sorted in a CytoFLEX LX Flow Cytometer (Beckman Coulter). Nuclei DNA was isolated using an in-house method, sheared to about 7.5 kb using g-TUBEs (Covaris, 520079) and, finally, libraries were prepared and sequenced according to the ONT instructions using the Ligation Sequencing Kit V14 (SQK-LSK114). Pod5 files were basecalled and aligned to the GRCh38 reference using Dorado v.0.5.3 with the high-accuracy model (hac) and 5mC modification calls (dorado basecaller hac,5mCG_5hmCG pod5s/ > calls.bam). Sorted and indexed BAM files were used as input to modbamtools59 plot function to visualize the methylation frequencies of genomic coordinates chromosome 9:94633352–94643777 and chromosome 17:7667720–7692808, corresponding to the FBP1 and TP53 loci, respectively, including their promoter regions.
MS
Mouse liver tissue was subjected to chloroform–methanol extraction for liquid chromatography–mass spectrometry (LC–MS) analysis. In brief, 60 mg of tissue was minced and transferred to a fresh 2.0 ml microcentrifuge tube containing 1.0 mM zirconia/silica beads (11079110z) and to each 500 μl of lysis buffer (3% SDS, 75 mM NaCl, 1 mM NaF, 1 mM beta-glycerophosphate, 1 mM sodium orthovanadate, 10 mM sodium pyrophosphate, 1 mM PMSF and 1× Roche complete EDTA free protease inhibitors (Roche, 06538282001) and 1× PhoSTOP EAZYpack phosphatase inhibitor (Roche, 04906837001) tablet in 50 mM HEPES, pH 8.5). The samples were vigorously vortexed for 3 min followed by centrifugation at 16,000 rcf for 5 min at 4 °C. The samples were homogenized at 4 °C using a MiniBeadBeater-16 Model 607 with three rounds of bead beating for 30 s each with 1 min rest intervals. The homogenates were centrifuged at 16,000 rcf for 5 min at 4 °C and transferred to a fresh 2.0 ml tube with an equal volume of 8 M urea in 50 mM HEPES pH 8.5 and mixed well. Sonicated samples were reduced with 20 μl of 500 mM dithiothreitol (DTT) for a final concentration of 5 mM for 45 min at 37 °C. After reduction, the samples were methylated using 30 μl of 500 mM iodoacetamide (IAA) for a final concentration of 15 mM and were incubated at room temperature for 45 min away from all light. Methylation was quenched using 20 μl of 500 mM DTT for a final concentration of 5 mM and resulting proteins were acidified with 12% phosphoric acid.
For protein extraction, 4× the volume of methanol was added to each sample and the mixture was vortexed and centrifuged at maximum speed for 2 min. After centrifugation, 1× the original volume of chloroform was added and the protein mixture was vortexed followed by centrifugation at maximum speed for 2 min. After the addition of chloroform, 3× the original volume of HPLC-grade water was added to each sample and resulting mixture was vortexed and centrifuged at maximum speed for 2 min. The resulting mixture contained a protein precipitated pellet at the interphase of the aqueous and organic later, and all solvents were removed so that only the protein pellets were retained. Lastly, 4× the original volume of methanol was added to the protein pellets and vortexed followed by centrifugation. Methanol was removed and the samples were cooled on ice before proceeding to the next step. Protein pellets were washed twice with 300 μl of ice-cold acetone and centrifuged at maximum speed for 5 min at 4 °C between each wash. The pellets were dried on a heat block for 15 min at 56 °C and stored for digestion.
Protein pellet digestion was performed by thawing and resuspending protein pellets in 300 μl of 1 M urea in 50 mM HEPES pH 8.5. Each sample was digested with 100 μg of sequencing-grade trypsin (Promega, PRV5117) in 1 M urea in 50 mM HEPES pH 8.5 by adding 200 μl of trypsin suspension to each sample. All of the samples were digested for 6 h at 37 °C and the reaction was quenched by adding 50 μl of 1% TFA. Samples containing peptides were frozen at −80 °C and lyophilized. Peptides were desalted using 500 mg Waters Sep-Pak columns. Desalted peptides were frozen and lyophilized before being quantified as above.
The resulting lyophilized fractionated labelled peptides were resuspended in 20 μl of 5% acetonitrile/5% formic acid for LC–MS. MS-based proteomics analysis was conducted using the Themo Fisher Scientific Orbitrap Fusion Tribrid mass spectrometer containing an in-line Easy-nLC 1000 System. The samples were loaded onto a 75 μm × 150 mm long EASY-Spray PepMap Neo column (Thermo Fisher Scientific, ES75150PN) containing 2 μm C18 resin. The samples were loaded onto column through a T-junction connecting the nLC and electrospray ionization was conducted through the application of 2,200 V of electricity.
MS1 spectral data were acquired in data-dependent mode using a scan range of 500–1,200 m/z and a resolution of 60,000. A maximum injection time was set to 50 ms with an automatic gain control. The MS2 spectral data were collected with a decision tree option containing two possibilities: ions containing a charge state of 2 were analysed within the 600–1,200 m/z range, and those ions with a charge state of 3–4 were analysed within the 500–1,200 m/z mass range. The MS2 lower threshold for fragmentation of ions was set to 5 × 10³. Ions that were selected for fragmentation in the quadruple at 0.7 m/z were fragmented using CID.
High-resolution spectra were obtained by fragmenting ions using a higher-energy collision-induced dissociation (HCD) with a normalized CID collision energy set to 30% and were detected in the linear ion trap containing a rapid scan rate. MS3-based quantification was conducted in the Orbitrap using the synchronous precursor selection (SPS) node option. Up to 10 total MS2 ions were isolated in parallel and fragmented with HCD containing a normalized energy of 50%. Fragmentation ions at the MS3 level were analysed in the Orbitrap with a resolution of 60,000. A predictive AGC was used.
Proteomic data processing
Raw files obtained from spectral runs were searched using Proteome Discoverer against the reference Mus musculus strain C57BL/6J proteome downloaded from UniProt. Use of the Sequest algorithm was implemented for facilitated spectral matching to an in silico theoretical database for our reference proteome. The mass tolerance for MS1 spectra was set to 10 ppm and a fragment ion mass tolerance for MS2 spectra was set to 0.6 Da. Processing of data included filtering of peptide spectral matches (PSMs) to include only matches with high or medium confidence and filtered to retain only PSMs containing an average quantification abundance of >10 and an isolation interference value of <25.
Generation and transduction of AAV8 vectors
pAAV[Exp]-CAG>Fbp1WT-T2A-eGFP-WPRE and pAAV[Exp]CAG>HA/Fbp1E98A-T2A-eGFP-WPRE were constructed with Vectorbuilder. AAV8-Fbp1, AAV8-Fbp1E98A and AAV8-Ctrl viruses were generated by Vectorbuilder as described previously19. In brief, HEK293T cells were co-transfected with the indicated vectors and Rep-cap and helper plasmids. After 50–60 h, cell lysates were concentrated by PEG precipitation and CsCl gradient ultracentrifugation. Fbp1ΔHep and MUP-uPA Fbp1ΔHep mice were infected with AAV8-Fbp1, Fbp1E98A and AAV8-Ctrl (1012 virus copies per mouse) through tail-vein injection 1 week after NRASG12V HTVI at 8 weeks old. AAV8-TBG-GFP (105535-AAV8) and AAV8-TBG-cre (107787-AAV8) were purchased from Addgene and injected into Mup-uPA Fbp1F/F mice (2 × 10¹¹ copies per mouse) fed with CSD or HFrD at 22 weeks and mice were analysed 4 weeks later. Primary hepatocytes from Fbp1F/F mice were infected with AAV-TBG-GFP and AAV-TBG-cre (107 copies per well) and analysed 48 h later.
Metabolic assays
Liver TG, serum TG and serum cholesterol were measured using the Triglyceride Quantification Colorimetric Assay Kit (Sigma-Aldrich, MAK266) and Cholesterol Fluorometric Assay Kit (Cayman Chemical, 10007640), respectively, according to manufacturer’s protocols. The insulin tolerance test was performed as described previously19. In brief, 22-week-old Mup-uPA Fbp1F/F and Mup-uPA Fbp1∆Hep mice or Fbp1F/F and Fbp1∆Hep mice were fasted for 2–4 h and injected with 0.5 U kg−1 insulin. Blood glucose was measured with a glucometer (OneTouch Ultra 2, One Touch) before and after injection in every 30 min for a total of 2 h.
SA-β-gal staining
SA-β-gal staining was performed as described previously17. Cryosections or adherent cells were fixed in 0.5% glutaraldehyde in PBS for 15 min, washed with 1× PBS supplemented with 1 mM MgCl2 and stained for 8–16 h in 1× PBS containing 1 mM MgCl2, 1 mg ml−1 X-gal and 5 mM each of K-ferricyanide and K-ferrocyanide at pH 6 for human cells and pH 5.5 for mouse cells at 37 °C. The slides were rinsed with PBS and mounted. For quantification, 3–5 representative images for each sample were quantified with ImageJ.
RNA isolation and RT–qPCR
Total liver RNA was extracted using the RNeasy Plus Mini kit (Qiagen, 74134) and cDNAs were synthesized using the SuperScript VILO cDNA Synthesis Kit (Thermo Fisher Scientific, 11754050). Relative mRNA amounts were determined using the CFX96 thermal cycler (Bio-Rad). Data are presented as arbitrary units calculated by the comparative Ct method (2Ct(18s rRNA − gene of interest)). A list of the primers is provided in Supplementary Table 13.
RNA-seq library preparation, processing and analysis
Total RNA was isolated as above together using the RNase-Free DNase kit (Qiagen, 79254) to obtain pure RNA. RNA degradation and contamination were monitored on 1% agarose gels and the RNA purity was checked using the NanoPhotometer spectrophotometer (IMPLEN). RNA integrity and quantification were assessed with the RNA Nano 6000 Assay Kit of the Bioanalyzer 2100 system (Agilent Technologies). For library preparation, a total of 1 μg RNA per sample was used as input for RNA sample preparations. Sequencing libraries were generated with NEBNext Ultra RNA Library Prep Kit for Illumina (NEB) according to the manufacturer’s protocols and index codes were added to attribute sequences to each sample. In brief, mRNA was purified from total RNA using poly-T oligo-attached magnetic beads and fragmented using divalent cations under elevated temperature in NEBNext First Strand Synthesis Reaction Buffer (5×). First-strand cDNA was synthesized using random hexamer primers and M-MuLV reverse transcriptase (RNase H−). Second-strand cDNA synthesis was performed using DNA polymerase I and RNase H. Remaining overhangs were converted into blunt ends by exonuclease/polymerase activities. After 3′-end adenylation of DNA fragments, NEBNext adaptors with hairpin loop structures were ligated to prepare for hybridization. Library fragments were then purified with AMPpure XP system (Beckman Coulter) and 3 μl USER Enzyme (NEB) was used with size-selected, adaptor-ligated cDNAs at 37 °C for 15 min followed by 5 min at 95 °C. PCR was then performed using Phusion High-Fidelity DNA polymerase, Universal PCR primers and Index (X) Primer. Library quality was assessed on the Agilent Bioanalyzer 2100 system.
The clustering of index-coded samples was performed on the Illumina NovaSeq 6000 sequencer according to the manufacturer’s instructions. After cluster generation, the libraries were sequenced on the same machine and paired-end reads were generated. RNA-seq reads were aligned to the mouse genome (GRCm38/mm10) using STAR. Biological and technical replicates were used in all experiments. Transcript quantification was performed using HOMER (v.4.11). Principal component analysis was performed using transcripts per kilobase million on all genes from all of the samples. The expression value for each transcript was calculated using the analyzeRepeat Pl tool of HOMER. Pathway analysis was performed using the Molecular Signature Databases of GSEA.
snRNA library preparation and sequencing
Nuclei were isolated from flash-frozen liver biopsies using the Chromium Nuclei Isolation with RNase Inhibitor Kit (1000494, 10x Genomics), according to the manufacturer’s protocols. After nuclei were prepared, the samples were partitioned, barcoded and the library was prepared using the Chromium Connect. In total, 500,000 freshly sorted nuclei were loaded onto the 10x Genomics Chromium Single Cell 30v3.1 chip G and processed immediately in a 10x Chromium controller. Sequencing of libraries was performed at the UCSD IGM Genomics Center. Libraries were pooled at an equimolar concentration and sequenced using the Illumina NovaSeq 6000 and S4 flow cells with a read one length of 28 cycles and a read two length of 94 cycles. The samples were demultiplexed using bcl2fastq v.2.20 Conversion Software (Illumina).
snRNA-seq data processing and downstream analysis
Fastq files were preprocessed and mapped to the reference mouse transcriptome, mm10 (GENCODE vM23/Ensembl 98), using the cell Ranger v.7.1.0 pipeline (10x Genomics). Cell Ranger output files were analysed using the R package Seurat (v.5)60. For quality control, nuclei with less than 3 unique molecular identifiers, less than 500 features or more than 2% of mitochondrial genes were removed as low-quality nuclei not worth analysing. Doublets were then detected and removed using the R package DoubletFinder. Moreover, clusters with high expression of markers for two or more different cell types were considered to be doublets and were removed. Cell annotation was performed manually using the expression of marker gene sets4,5. Marker genes for hepatocytes were Egfr, Pck1, Slc7a2, Cps1 and Cyp7b1; we then subclustered for annotation of zone 1, zone 2, zone 3, daHep and HCC. Marker genes for zone1 were Sds, Hal and Gls2; for zone 2, Cyp2e1, Cyp2c67 and Cyp2c29; for zone 3, Glul, Slc1a2 and Lgr5; for daHep, Gsta1, Cdkn1a and Anxa2; and for HCC, Gpc3, Afp and Ly6d.
Human cancer database analysis
Patient gene expression and survival data were analysed using The Cancer Genome Atlas (TCGA) database. We collected RNA-seq and clinical liver cancer data from TCGA (https://portal.gdc.cancer.gov/) using the biolinks package in R v.4.1.2. TCGA mRNA expression was normalized using transcripts per million. The average expression levels were calculated for duplicated gene names. The samples were divided into normal and HCC tissues based on TCGA sample names. Gene expression and clinical data were merged using TCGA sample names and used for analysis.
Patient gene expression and survival data were also analysed using the CPTAC database. We collected protein expression and clinical data of liver cancer from CPTAC (https://proteomics.cancer.gov/programs/cptac), keeping columns that contained the word ‘unshared’ in their sample names. We used the impute package in R v.4.1.2 to fill in the missing values in the protein expression matrix and merged expression and clinical data using sample names and differentiated normal from HCC samples. The merged matrix was used for analysis. PXD00612-LIHC proteomic data were provided by F. He.
Definition of DNA methylation, cell senescence and cell cycle scores
DNA methylation data from TCGAwere obtained on the Illumina Infinium Human Methylation 450K BeadChip, which contains probes designed for specific regions such as gene promoters containing CpG sites. The resize function in the GenomicRanges package was used to obtain the transcription start sites of all genes, and the promoters function in the GenomicFeatures package was used to obtain the promoter regions of the genes. β values were used to represent the methylation level of CpG sites61. A gene promoter was defined as the region 2,500 bp upstream and 2,500 bp downstream from the transcription start site62. When one gene promoter had multiple CpG sites, the average of each CpG site β value was calculated as the methylation level61. The mRNA expression and methylation data ofgenes were merged through the TCGAbarcode63. The merged matrix obtained is used for subsequent analysis.
For cell senescence scores, 1,260 genes associated with cellular senescence64 were divided into two gene sets: 526 positively correlated genes and 734 negatively correlated genes. The ssGSEA algorithm in GSVA65 was used to calculate the scores of these two gene sets in the individual samples. The difference between the driver score and the suppressor score was defined as the CS score, representing the cellular senescence status of each individual sample66.
For cell-cycle scores, 102 genes associated with cell-cycle67 were divided into two gene sets: 74 positively correlated genes and 28 negatively correlated genes. The ssGSEA algorithm in GSVA65 was used to calculate the scores of these two gene sets in individual samples. The difference between the driver score and the suppressor score was defined as the cell-cycle score, representing the cell-cycle status of each individual sample.
Quantification and statistical analysis
Data are presented as mean ± s.d. or mean ± s.e.m. First, we checked whether the normality assumption of data distribution was met using the Shapiro–Wilk test before performing the suitable statistical tests. For comparisons between two groups, means were compared using t-tests when the normality assumption was met and Mann–Whitney U-tests were used when it was not met. For comparisons of more than two groups, one-way ANOVA was used to determine whether the means of the groups were significantly different when the normality assumption was met and Kruskal–Wallis tests were used when it was not met. When one-way ANOVA yielded a significant result, Tukey post hoc tests were used for pairwise comparisons between the tested groups. When the Kruskal–Wallis test yielded a significant result, Dunn post hoc tests were used for pairwise comparisons between the tested groups. Kaplan–Meier survival curves were analysed by a log-rank test. Statistical correlation between FBP1–NRF2–TP53 expression levels was determined using two-tailed χ2 tests. Where appropriate, false-discovery rate (FDR) corrections for multiple hypothesis testing were performed using the Benjamini–Hochberg method. P < 0.05 was considered to be significant; NS, P ≥ 0.05. All of the experiments except the IHC analysis of 83 human specimens were repeated at least three times.
Reporting summary
Further information on research design is available in the Nature Portfolio Reporting Summary linked to this article.
Extended Data
Extended Data Fig. 1 |. FBP1, ALDOB and TP53 are downregulated in human HCC.

a, Relative staining intensities of the indicated proteins from Fig. 1a. b, Relative ALDOB amounts in NT and T tissues from the CPTAC-LIHC database. c, Relative FBP1 and ALDOB amounts in NT and T tissues from the PXD006512-LIHC database. d, Percent survival of PXD006512-LIHC patients stratified according to ALDOB expression by “best expression cut-off”. Significance determined by log-rank test. e, FBP1 expression in TCGA-LIHC with WT (n = 308) and mutant (n = 107) TP53. f, Relative FBP1 promoter methylation levels in the TCGA-LIHC database. g, Relative FBP1 promoter methylation levels in HCC patients from the TCGA database. Low and high were defined as in Methods. h-j, Relative promoter methylation levels of G6PC (h), PCK1 (i) and TP53 ( j) in the TCGA-LIHC database. Data in a, b, c, e, f, h, i and j are mean ± SEM. Statistical significance determined by two-sided unpaired t-test or Mann–Whitney U test (a, b, c, e, f, h, i and j) based on data normality distribution. **P < 0.01, ***P < 0.001, ns, not significant. Box plots show center line (median), box limits (first and third quartiles) and whiskers (outer data points).
Extended Data Fig. 2 |. FBP1 is transcriptionally activated by TP53.

a, Schematic of the FBP1 gene 5′ and 3′ regions, showing putative TP53 binding sites and amplicons used for ChIP-qPCR. b, Relative amounts of Fbp1, p21 and Tp53 mRNAs in primary hepatocytes from Tp53F/F and Tp53ΔHep mice. c, IB demonstrating shRNA mediated TP53 knockdown and FBP1 downregulation in human hepatocytes. d, Relative FBP1, p21CIP1 and TP53 mRNA amounts in human primary hepatocytes stably transfected with shCtrl, shTP53#1 and shTP53#2. e, f, Relative FBP1, p21CIP1 and TP53 mRNAs in HepG2 (e) and SK-HEP-1 (f) cells stably transfected with shCtrl, shTP53#1 and shTP53#2. IB showing TP53 knockdown in SK-HEP-1 cells is on the right. g-j, ChIP-qPCR probing TP53 recruitment to the Fbp1 gene in Tp53F/F and Tp53ΔHep livers (g), SK-HEP-1 (h), HepG2 (i) and Huh7 ( j) cells (n = 3 BR each). k, Relative FBP1, p21CIP1and TP53 mRNAs (left, middle) and proteins (right) in NCD and HFD and CSD and HFrD fed Tp53F/F and Tp53ΔHep mice (16 weeks; n = 5 biological replicates/BR). Quantification of relative normalized protein amounts is shown below each strip. Data in b, d, e, f, g, h, i, j and k are mean ± SEM. Statistical significance determined by two-sided unpaired t-test or Mann–Whitney U test (b, g, h, i and j) and one-way ANOVA with Tukey post-hoc tests or Kruskal–Wallis test with Dunn post-hoc tests (d, e, f and k) based on data normality distribution. *P < 0.05, **P < 0.01, ***P < 0.001, ****P < 0.0001, ns, not significant.
Extended Data Fig. 3 |. FBP1 and TP53 are induced in MASH and blunt diet-induced DNA damage.

a, IB analysis of the indicated proteins in livers of HFrD-fed MUP-uPA mice collected at the indicated time points. Quantification of relative normalized protein amounts is shown below each strip. b, Frozen liver sections from the indicated mice stained for 53BP1 and P-γH2AX (n = 4–5 BR). Scale bars, 10 μm. Quantification of 53BP1- and P-γH2AX-positive cells per HMF is shown underneath. c, IB analysis of the indicated liver proteins after 22 weeks of CSD or HFrD feeding. MW markers, densitometric quantification of protein ratios (HFrD/CSD) and P values are on the right. d, Representative IHC of MUP-uPA livers after 32 weeks of HFrD feeding (n = 4–5 BR). Scale bars, 50 μm. Quantification of staining intensity/HMF of indicated proteins is shown underneath. e, MUP-uPA/Fbp1F/F and MUP-uPA/Fbp1ΔHep livers at 22 weeks of CSD or HFrD. f, g Representative IHC (f) and Image J (g) quantification of MUP-uPA/Fbp1F/F and MUP-uPA/Fbp1ΔHep livers in 22 weeks after HFrD (n = 7–9 BR). Scale bars, 50 μm. Data in b, c, d and g are mean ± SEM. Statistical significance determined by one-way ANOVA with Tukey post-hoc tests or Kruskal–Wallis test with Dunn post-hoc tests (b, g) and two-sided unpaired t-test or Mann–Whitney U test (d) based on data normality distribution. *P < 0.05, **P < 0.01, ***P < 0.001, ****P < 0.0001.
Extended Data Fig. 4 |. FBP1 and TP53 are induced in human MASH and downregulated in daHep.

a, Relative FBP1 and ALDOB expression from the GSE162694 human normal and MASH liver dataset (normal, n = 31; MASH, 0, n = 35; 1, n = 30; 2, n = 27; 3, n = 8; 4, n = 12). b, Representative IHC of human normal and MASH livers (n = 7–9 BR). Image J quantifications are to the right. c, SR staining and 53BP1 and P-γ-H2AX IHC of human normal and MASH liver tissues (n = 7–9 BR). Image J quantification is shown underneath. d, UMAP visualizations and unsupervised clustering of 78250 hepatocyte nuclei from integrated GSE185477, GSE174748, GSE192742 and GSE212046 datasets. Five hepatocyte subsets were annotated based on gene expression and liver pathology metadata (top left). FBP1 and TP53 expression shown by UMAP visualization (top right and bottom left). NRF2 pathway signatures containing n = 141 target genes in daHep and HCC are shown in the bottom right. The location of daHep nuclei is highlighted by blue ellipses. e, UMAP visualizations and unsupervised clustering of 12,540 mouse hepatocyte nuclei from the GSE200366 dataset. Four subsets previously identified, three representing normal hepatocyte zonation (Zone_1_Hep, Zone_2_Hep, Zone_3_Hep) and one daHep cluster. Density maps of Fbp1 and Dnmt1 mRNA expression in the UMAP space are shown with the daHep cluster highlighted by blue ellipses. Data in a, b and c are mean ± SEM. Statistical significance determined by one-way ANOVA with Tukey post-hoc tests or Kruskal–Wallis test with Dunn post-hoc tests (a) and two-sided unpaired t-test or Mann–Whitney U test (b, c) based on data normality distribution. *P < 0.05, **P < 0.01, ****P < 0.0001. Box plots show center line (median), box limits (first and third quartiles) and whiskers (outer data points).
Extended Data Fig. 5 |. Fbp1 ablation promotes MASH to HCC progression.

a, Normal hepatocytes and HCC progenitor cells (HcPC) were isolated from 22 weeks HFrD fed MUP-uPA/Fbp1F/F and MUP-uPA/Fbp1ΔHep livers (n = 5). Numbers/liver and diameters of aggregates are shown underneath. Scale bars, 100 μm. b, c, IB analysis of the indicated proteins in normal hepatocytes and HcPC from a. MW markers, densitometric quantification of protein ratios (HcPC/Normal hepatocytes) and P values are depicted on the right. d, Tumour numbers (left) and volumes (right) of MUP-uPA/Fbp1F/F and MUP-uPA/Fbp1ΔHep livers after 40 weeks of HFrD (n = 5–7 BR each). e, Representative CD44, MYC, and AFP staining of liver sections from above mice. Scale bars, 50 μm. Relative staining intensities per HMF are below. f, IB analysis of liver lysates from above mice prepared after 40 weeks of HFrD. MW markers, densitometric quantification of protein ratios (MUP-uPA/Fbp1ΔHep/MUP-uPA/Fbp1F/F) and P values are shown on the right. g, Tumour numbers (left) and volumes (right) of MUP-uPA/Fbp1F/F and MUP-uPA/Fbp1ΔHep livers after 40 weeks of HFrD +/− Nutlin-3a treatment (25 mg/kg) 2x/week for 8 weeks (n = 4–5 BR). h, MUP-uPA/Fbp1F/F and MUP-uPA/Fbp1ΔHep livers were transduced with AAV8-Ctrl, AAV8-FBP1 and AAV8-FBP1E98A 6–8 weeks after HFrD initiation (n = 4–5 BR). Mice were examined at 40 weeks. Tumour numbers (left) and volumes (right) are shown. Data in a, d, e, g and h are mean ± SEM. Statistical significance determined by two-sided unpaired t-test or Mann–Whitney U test (a, d and e) and one-way ANOVA with Tukey post-hoc tests or Kruskal–Wallis test with Dunn post-hoc tests (g, h) based on data normality distribution. *P < 0.05, **P < 0.01, ***P < 0.001, ****P < 0.0001.
Extended Data Fig. 6 |. FBP1 loss and AKT activation license NRASG12V-induced tumorigenesis.

a, Overall survival of Fbp1F/F and Fbp1ΔHep mice receiving NRASG12V HTVI (n = 6–8 each). Significance was determined by log-rank test. b, IHC analysis of Fbp1F/F and Fbp1ΔHep livers at the indicated times post-NRASG12V HTVI (n = 4–5 BR per time point). Scale bars, 50 μm. c, Relative staining intensities per HMF from b. d, IB of liver lysates 1, 4, and 12 weeks after NRASG12V HTVI of Fbp1F/F and Fbp1ΔHep mice. e, f, IHC of FFPE liver sections from indicated mice livers(e). Scale bars, 50 μm. Relative staining intensities (f). g, IB of NT and T lysates of Fbp1ΔHep mice 16 weeks after NRASG12V HTVI. h, IB of Tp53F/F and Tp53ΔHep liver lysates 1 and 4 weeks post NRASG12V HTVI. Data in c and f are mean ± SEM. Statistical significance determined by two-sided unpaired t-test or Mann–Whitney U test (c, f) based on data normality distribution. *P < 0.05, **P < 0.01, ***P < 0.001, ****P < 0.0001.
Extended Data Fig. 7 |. FBP1 inhibits NRASG12V-induced tumorigenesis regardless of its catalytic activity.
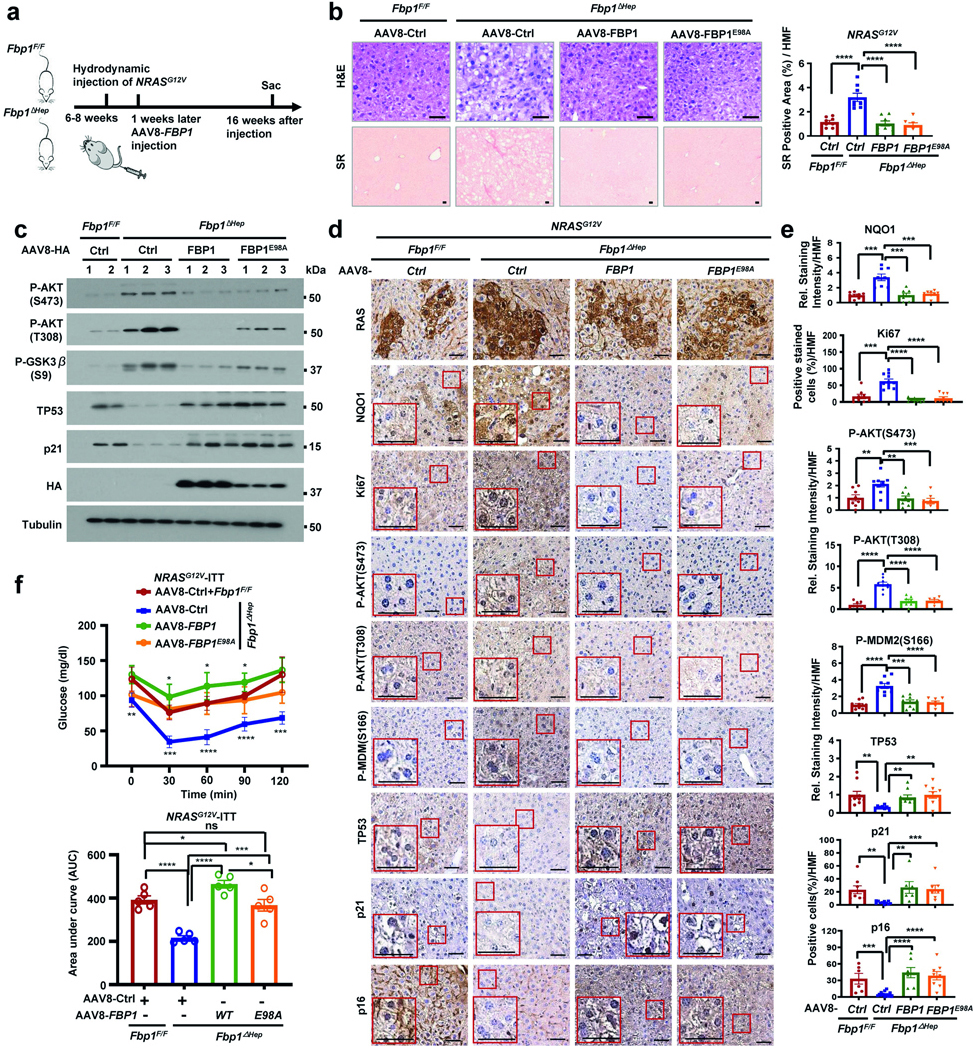
a, Schematic of NRASG12V HTVI followed by AAV8 viral transduction. b, H&E and SR staining of liver sections from Fig. 3e (n = 4–5 BR). Scale bars, 50 μm. SR staining intensities per HMF determined by Image J are shown to the right. c, IB analysis of Fbp1F/F and Fbp1ΔHep liver lysates from Fig. 3e. d, IHC of FFPE liver sections from 3e. Scale bars, 50 μm. e, Relative staining intensities per HMF determined by Image J of d. f, ITT of mice from Fig. 3e. AUC quantifications are shown below. Data in b, e and f are mean ± SEM. Statistical significance determined by one-way ANOVA with Tukey post-hoc tests or Kruskal–Wallis test with Dunn post-hoc tests (b, e and f) based on data normality distribution. *P < 0.05, **P < 0.01, ***P < 0.001, ****P < 0.0001, ns, not significant.
Extended Data Fig. 8 |. SA-β-Gal expression in primary hepatocytes and its ATM/ATR dependence.
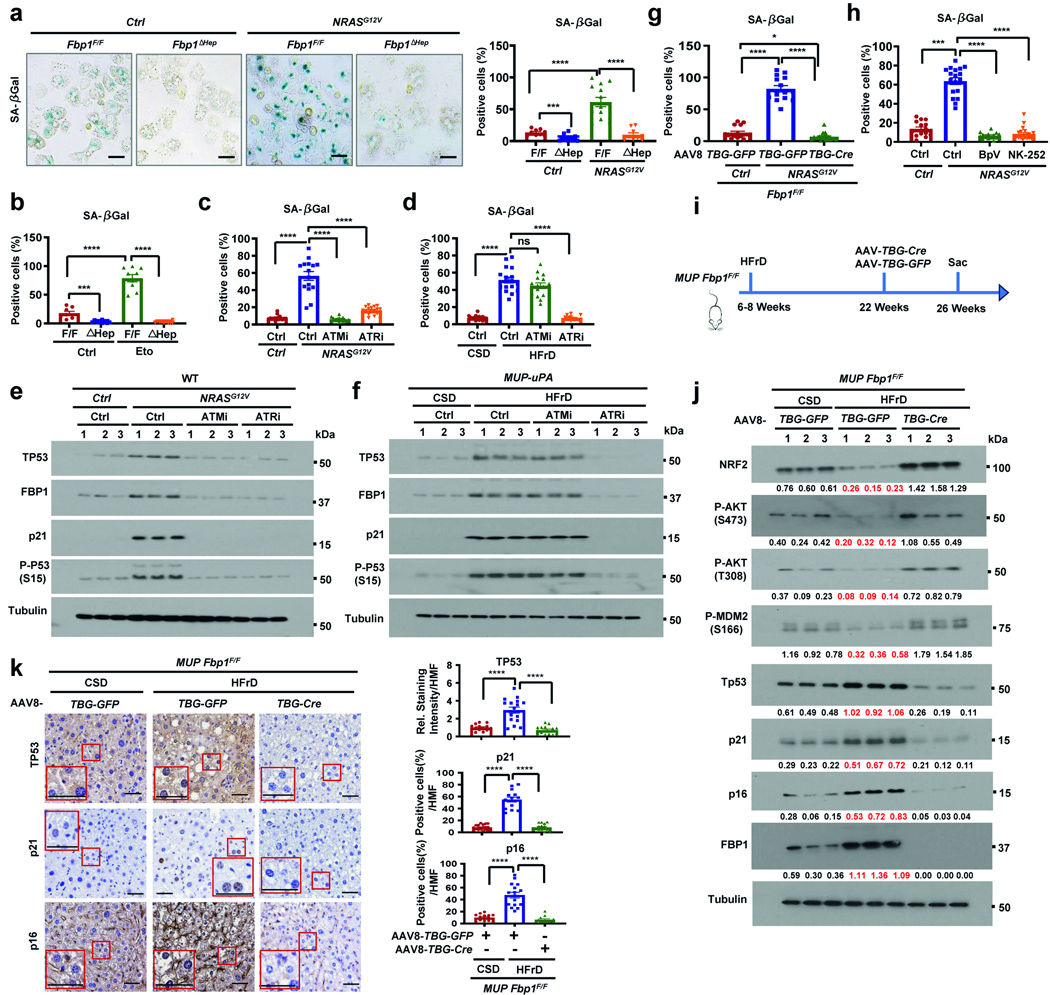
a, b, Primary Fbp1F/F and Fbp1ΔHep hepatocytes were transduced with NRASG12V (a) or treated with etoposide (20 μM, 12 h) (b) and stained for SA-β-Gal (n = 4 BR). Scale bars, 100 μm. Image J quantification is shown on the right of a and in b. c, Image J quantification of primary hepatocytes prepared from WT mice 8 weeks post-HTVI with Ctrl or NRASG12V that were treated with ATMi (KU60019, 5 μM) or ATRi (AZD6738, 2 μM) for 6 h before SA-β-Gal staining (n = 4 BR). d, Image J quantification of primary hepatocytes prepared from MUP-uPA mice fed for 22 weeks with CSD or HFrD and treated with ATMi (KU60019, 5 μM) or ATRi (AZD6738, 2 μM) for 6 h before staining for SA-β-Gal (n = 3 BR). e, f, IB analysis of WT livers after 12 weeks HTVI of Ctrl or NRASG12V (e) and MUP-uPA mice fed with CSD and HFrD for 22 weeks (f). All mice were injected with ATMi (KU60019, 10 mg/kg) or ATRi (AZD6738, 10 mg/kg) 2x/week for 4 weeks (n = 4 BR). g, Primary hepatocytes prepared from 8 weeks old Fbp1F/F mice, were transfected with NRASG12V and after 2 days were infected with AAV-TBG-GFP and AAV-TBG-Cre (107 virus copies per well) for 2 days before staining for SA-β-Gal (n = 3 BR). Image J quantification is shown. h, Primary hepatocytes from WT mice were transfected with NRASG12V and after 2 days were treated with BpV (1 μM) and NK252 (2 μM) for 20 h before staining for SA-β-Gal (n = 3 BR). Image J quantification is shown. i, Experimental scheme. MUP-uPA/Fbp1F/F mice were fed HFrD for 22 weeks, infected with AAV-TBG-Cre and AAV-TBG-GFP and analysed 4 weeks later (n = 5 BR). j, IB analysis of liver lysates from above mice. Quantification of relative normalized protein amounts is shown below each strip. k, IHC of FFPE liver sections from above mice. Scale bars, 50 μm. Relative staining intensities per HMF determined by Image J are shown to the right. Data in a, b, c, d, g, h and k are mean ± SEM. Statistical significance determined by one-way ANOVA with Tukey post-hoc tests or Kruskal–Wallis test with Dunn post-hoc tests (a, b, c, d, g, h and k) based on data normality distribution. *P < 0.05, ***P < 0.001, ****P < 0.0001, ns, not significant.
Extended Data Fig. 9 |. NRF2 activation licences NRASG12V-induced HCC development.

a-d, IHC of FFPE liver sections from Nrf2Tg/Tg and Nrf2Act-Hep livers 1, 4, 12 and 16 weeks after NRASG12 HTVI (n = 4–5 BR) (a, c). Scale bars, 50 μm. Relative staining intensities per HMF determined by Image J (b, d). e, Tumour numbers and volumes in Nrf2Tg/Tg and Nrf2Act-Hep mice 12 and 16 weeks after HTVI of NRASG12V (n = 4–5 BR). Data in b, d and e are mean ± SEM. Statistical significance determined by two-sided unpaired t-test or Mann–Whitney U test (b, d) and Kruskal–Wallis test with Dunn post-hoc tests (e) based on data normality distribution. **P < 0.01, ***P < 0.001, ****P < 0.0001.
Extended Data Fig. 10 |. NRF2 and FBP1 inversely control cell senescence and proliferation genes.

a, Venn diagram showing overlap in upregulated genes in Nrf2Act-Hep vs Nrf2Tg/Tg and Fbp1ΔHep vs Fbp1F/F livers (n = 3 BR). b, Venn diagram showing overlap in downregulated genes in Nrf2Act-Hep vs Nrf2Tg/Tg and Fbp1ΔHep vs Fbp1F/F livers (n = 3 BR). c, GO BP enrichment analysis of the overlapping upregulated genes in Nrf2Act-Hep vs. Nrf2Tg/Tg and Fbp1ΔHep vs. Fbp1F/F livers 1 week after NRASG12V HTVI (n = 3 BR). Dot size corresponds to the number of genes associated with each GO BP term, and dot colour corresponds to statistical significance. d, GO BP enrichment analysis of overlapping downregulated genes in Nrf2Act-Hep vs. Nrf2Tg/Tg and Fbp1ΔHep vs. Fbp1F/F livers 1 week after NRASG12V HTVI (n = 3 BR). e, f, Venn diagrams depicting the overlap in genes that are upregulated (e) or downregulated (f) in Fbp1ΔHep vs. Fbp1F/F, Nrf2Act-Hep vs. Nrf2Tg/Tg and Tp53ΔHep vs. Tp53F/F NCD livers. g, h, Venn diagrams depicting the overlap in genes that are upregulated (g) or downregulated (h) in Fbp1ΔHep vs. Fbp1F/F, Nrf2Act-Hep vs. Nrf2Tg/Tg 1 week after NRASG12V HTVI and Tp53ΔHep vs. Tp53F/F HFD-fed livers. i, j, Heatmaps representing cell-senescence- (i) and cell-cycle- (j) associated genes in Nrf2Act-Hep livers 3 weeks after NRASG12V HTVI followed by AAV8-Ctrl and AAV8-FBP1 transduction (n = 3 BR).
Extended Data Fig. 11 |. NRF2 activation and FBP1 loss enable propagation of NRAS induced mutations.

a, INDEL types in HCCs from MUP-uPA/Fbp1ΔHep mice fed HFrD or HFD for 40 weeks. b, Mutational signatures displayed based on trinucleotide frequency of HFD-induced MUP-uPA/Fbp1ΔHep HCCs (1 tumour per run). c, d Duplex sequencing showing the number of mutations (c) and INDELs (d) in each signature in the indicated mice. NT- non-tumour, T-tumour. e, Number of mutations in each INDEL signature expressed as somatic mutations per megabase in HCCs from NRASG12V transduced Nrf2Act-Hep livers. f, g, Number of mutations and INDEL types in HCCs of NRASG12V transduced Nrf2Act-Hep livers for 16 weeks.
Extended Data Fig. 12 |. HCC emerges from senescent progenitors.

a, Schematic representation of the p21-Cre construct. The diagram was created using BioRender. b, Relative Cre and p21CIP1 mRNA amounts in primary hepatocytes transfected with the indicated vectors and treated +/− etoposide (20 μM, 48 h) (n = 3 BR). c, Schematic of experimental protocol. Mice were transduced with the indicated AAV8 vectors 2 weeks (day −14) before NRASG12V HTVI. Two weeks later, the mice were i.p. injected with PTENi (BpV) (0.5 mg/kg) or Ctrl for 8 weeks and were sacked at 16 weeks post HTVI (n = 3 BR) for HCC analysis. d, IB analysis of the indicated proteins in liver lysates from above mice. Quantification of relative normalized protein amounts is shown underneath each strip. e, f H&E and IHC of FFPE liver sections from above mice. Scale bars, 20 μm. Relative staining intensities per HMF were determined by Image J are shown to the right. g, Tumour numbers (top) and volumes (bottom) in mT/mG livers transduced with AAV8-Ctrl, AAV8-TBG-Cre or AAV8-p21-Cre 2 wks prior to NRASG12 HTVI, followed by BpV (HOpic, 0.5 mg/kg) or Ctrl i.p. injections 2x/wk for 8 wks and analysis at 16 wks post-HTVI (n = 3 each). Data in b, e, f and g are mean ± SEM. Statistical significance determined by two-sided unpaired t-test or Mann–Whitney U test (e, f and g) and Kruskal–Wallis test with Dunn post-hoc tests (b) based on data normality distribution. **P < 0.01, ***P < 0.001, ****P < 0.0001.
Supplementary Material
The online version contains supplementary material available at https://doi.org/10.1038/s41586-024-08317-9.
Acknowledgements
We thank the members of the Karin laboratory for discussions; the staff at Cell Signaling Technologies, Santa Cruz Technologies, Thermo Fisher Scientific and Med Chem Express for gifts of antibodies and reagents; and the members of the UCSD Tissue Technology Shared Resource (TTSR) at the UCSD School of Medicine for assistance and the Collaborative Center for Multiplexed Proteomics at UCSD. Research was supported by NIH grants to M.K. (R01DK120714, R01DK133448, R01CA234128, R01CA281784, P01CA281819, R01DK133448), M.C.S. (R35CA220483), T.K. (DK099205) and L.B.A. (R01ES030993, R01ES032547, R01CA269919). L.B.A. was also supported by a Packard Fellowship for Science and Engineering. R.C. and J.E.E.T.-P. were supported by NHMRC Project Grant APP1087125. R.C. is the recipient of a Cancer Council WA Postdoctoral Research Fellowship. D.D. was supported by NIH/ACTRI grants R01DK137061, R01DK133930, KL2TR001444 and the San Diego Digestive Diseases Research Center (SDDRC) (NIH grant DK120515). Y.Z. and L.G. were supported by the National Nature Science Foundation of China (82172990, 82372838) and (32470830, 92478135), respectively. This publication includes data generated at the UC San Diego Moores Cancer Center using a 10x Chromium Connect system that was purchased with funding from an NIH SIG grant (S10OD032398-01) and with support from the Moores Cancer Center support grant P30 CA023100.
M.K. is a founder and stockholder in Elgia Pharmaceuticals and received research support from Merck and Janssen Pharmaceuticals and holds a patent for the use of MUP-uPA mice as a NASH-HCC model. L.B.A. is a compensated consultant and has equity interest in io9 and Genome Insight; his spouse is an employee of Biotheranostics. L.B.A. is also listed as an inventor on US Patent 10,776,718 for source identification by non-negative matrix factorization. L.B.A. declares US provisional applications with the following serial numbers: 63/289,601, 63/269,033, 63/483,237, 63/366,392 and 63/367,846. L.B.A. and S.P.N. also declare US provisional applications with serial numbers 63/412,835 and 63/492,348.
Footnotes
Competing interests The other authors declare no competing interests.
Data availability
RNA-seq and snRNA-seq data are available at the GEO under accession numbers GSE240047 and GSE266447. DNA-seq data are available at the Sequence Read Archive (SRA) database under the accession number PRJNA1002629. Proteomic data are available at MassIVE (MSV000092592). Uncropped source blots and images are available in Supplementary Fig. 10. Source data are provided with this paper.
References
- 1.Maeda S, Kamata H, Luo JL, Leffert H & Karin M IKKbeta couples hepatocyte death to cytokine-driven compensatory proliferation that promotes chemical hepatocarcinogenesis. Cell 121, 977–990 (2005). [DOI] [PubMed] [Google Scholar]
- 2.Younossi ZM & Henry L Epidemiology of non-alcoholic fatty liver disease and hepatocellular carcinoma. JHEP Rep 3, 100305 (2021). [DOI] [PMC free article] [PubMed] [Google Scholar]
- 3.Ferreira-Gonzalez S, Rodrigo-Torres D, Gadd VL & Forbes SJ Cellular senescence in liver disease and regeneration. Semin. Liver Dis 41, 50–66 (2021). [DOI] [PubMed] [Google Scholar]
- 4.Carlessi R et al. Single-nucleus RNA sequencing of pre-malignant liver reveals disease-associated hepatocyte state with HCC prognostic potential. Cell Genom 3, 100301 (2023). [DOI] [PMC free article] [PubMed] [Google Scholar]
- 5.He G et al. Identification of liver cancer progenitors whose malignant progression depends on autocrine IL-6 signaling. Cell 155, 384–396 (2013). [DOI] [PMC free article] [PubMed] [Google Scholar]
- 6.Schmitt CA, Wang B & Demaria M Senescence and cancer—role and therapeutic opportunities. Nat. Rev. Clin. Oncol 19, 619–636 (2022). [DOI] [PMC free article] [PubMed] [Google Scholar]
- 7.Faget DV, Ren Q & Stewart SA Unmasking senescence: context-dependent effects of SASP in cancer. Nat. Rev. Cancer 19, 439–453 (2019). [DOI] [PubMed] [Google Scholar]
- 8.Collado M & Serrano M The power and the promise of oncogene-induced senescence markers. Nat. Rev. Cancer 6, 472–476 (2006). [DOI] [PubMed] [Google Scholar]
- 9.Baker DJ et al. Clearance of p16Ink4a-positive senescent cells delays ageing-associated disorders. Nature 479, 232–236 (2011). [DOI] [PMC free article] [PubMed] [Google Scholar]
- 10.Huda N et al. Hepatic senescence, the good and the bad. World J. Gastroenterol 25, 5069–5081 (2019). [DOI] [PMC free article] [PubMed] [Google Scholar]
- 11.Ogrodnik M et al. Cellular senescence drives age-dependent hepatic steatosis. Nat. Commun 8, 15691 (2017). [DOI] [PMC free article] [PubMed] [Google Scholar]
- 12.Llovet JM et al. Nonalcoholic steatohepatitis-related hepatocellular carcinoma: pathogenesis and treatment. Nat. Rev. Gastroenterol. Hepatol 20, 487–503 (2023). [DOI] [PMC free article] [PubMed] [Google Scholar]
- 13.Kang TW et al. Senescence surveillance of pre-malignant hepatocytes limits liver cancer development. Nature 479, 547–551 (2011). [DOI] [PubMed] [Google Scholar]
- 14.Shalapour S et al. Inflammation-induced IgA+ cells dismantle anti-liver cancer immunity. Nature 551, 340–345 (2017). [DOI] [PMC free article] [PubMed] [Google Scholar]
- 15.Hunter RW et al. Metformin reduces liver glucose production by inhibition of fructose-1–6-bisphosphatase. Nat. Med 24, 1395–1406 (2018). [DOI] [PMC free article] [PubMed] [Google Scholar]
- 16.Hirata H et al. Decreased expression of fructose-1,6-bisphosphatase associates with glucose metabolism and tumor progression in hepatocellular carcinoma. Cancer Res 76, 3265–3276 (2016). [DOI] [PubMed] [Google Scholar]
- 17.Li F et al. FBP1 loss disrupts liver metabolism and promotes tumorigenesis through a hepatic stellate cell senescence secretome. Nat. Cell Biol 22, 728–739 (2020). [DOI] [PMC free article] [PubMed] [Google Scholar]
- 18.Gorce M et al. Fructose-1,6-bisphosphatase deficiency causes fatty liver disease and requires long-term hepatic follow-up. J. Inherit. Metab. Dis 45, 215–222 (2022). [DOI] [PubMed] [Google Scholar]
- 19.Gu L et al. Fructose-1,6-bisphosphatase is a nonenzymatic safety valve that curtails AKT activation to prevent insulin hyperresponsiveness. Cell Metab 35, 1009–1021 (2023). [DOI] [PMC free article] [PubMed] [Google Scholar]
- 20.Li B et al. Fructose-1,6-bisphosphatase opposes renal carcinoma progression. Nature 513, 251–255 (2014). [DOI] [PMC free article] [PubMed] [Google Scholar]
- 21.He F et al. NRF2 activates growth factor genes and downstream AKT signaling to induce mouse and human hepatomegaly. J. Hepatol 72, 1182–1195 (2020). [DOI] [PMC free article] [PubMed] [Google Scholar]
- 22.Yuan H, Xu Y, Luo Y, Wang NX & Xiao JH Role of Nrf2 in cell senescence regulation. Mol. Cell. Biochem 476, 247–259 (2021). [DOI] [PubMed] [Google Scholar]
- 23.Raghunath A, Sundarraj K, Arfuso F, Sethi G & Perumal E Dysregulation of Nrf2 in hepatocellular carcinoma: role in cancer progression and chemoresistance. Cancers 10, 481 (2018). [DOI] [PMC free article] [PubMed] [Google Scholar]
- 24.Jiang Y et al. Proteomics identifies new therapeutic targets of early-stage hepatocellular carcinoma. Nature 567, 257–261 (2019). [DOI] [PubMed] [Google Scholar]
- 25.Olivier M, Hollstein M & Hainaut P TP53 mutations in human cancers: origins, consequences, and clinical use. Cold Spring Harb. Perspect. Biol 2, a001008 (2010). [DOI] [PMC free article] [PubMed] [Google Scholar]
- 26.Nakagawa H et al. ER stress cooperates with hypernutrition to trigger TNF-dependent spontaneous HCC development. Cancer Cell 26, 331–343 (2014). [DOI] [PMC free article] [PubMed] [Google Scholar]
- 27.Todoric J et al. Fructose stimulated de novo lipogenesis is promoted by inflammation. Nat. Metab 2, 1034–1045 (2020). [DOI] [PMC free article] [PubMed] [Google Scholar]
- 28.Olson E, Nievera CJ, Klimovich V, Fanning E & Wu X RPA2 is a direct downstream target for ATR to regulate the S-phase checkpoint. J. Biol. Chem 281, 39517–39533 (2006). [DOI] [PubMed] [Google Scholar]
- 29.Ganguly S et al. Nonalcoholic steatohepatitis and HCC in a hyperphagic mouse accelerated by Western diet. Cell. Mol. Gastroenterol. Hepatol 12, 891–920 (2021). [DOI] [PMC free article] [PubMed] [Google Scholar]
- 30.Govaere O et al. A proteo-transcriptomic map of non-alcoholic fatty liver disease signatures. Nat. Metab 5, 572–578 (2023). [DOI] [PMC free article] [PubMed] [Google Scholar]
- 31.Font-Burgada J et al. Hybrid periportal hepatocytes regenerate the injured liver without giving rise to cancer. Cell 162, 766–779 (2015). [DOI] [PMC free article] [PubMed] [Google Scholar]
- 32.Anstee QM, Reeves HL, Kotsiliti E, Govaere O & Heikenwalder M From NASH to HCC: current concepts and future challenges. Nat. Rev. Gastroenterol. Hepatol 16, 411–428 (2019). [DOI] [PubMed] [Google Scholar]
- 33.Porteiro B et al. Hepatic p63 regulates steatosis via IKKβ/ER stress. Nat. Commun 8, 15111 (2017). [DOI] [PMC free article] [PubMed] [Google Scholar]
- 34.Hou X, Du Y, Deng Y, Wu J & Cao G Sleeping Beauty transposon system for genetic etiological research and gene therapy of cancers. Cancer Biol. Ther 16, 8–16 (2015). [DOI] [PMC free article] [PubMed] [Google Scholar]
- 35.Dietrich P et al. Neuroblastoma RAS viral oncogene homolog (NRAS) is a novel prognostic marker and contributes to sorafenib resistance in hepatocellular carcinoma. Neoplasia 21, 257–268 (2019). [DOI] [PMC free article] [PubMed] [Google Scholar]
- 36.Beurel E, Grieco SF & Jope RS Glycogen synthase kinase-3 (GSK3): regulation, actions, and diseases. Pharmacol. Ther 148, 114–131 (2015). [DOI] [PMC free article] [PubMed] [Google Scholar]
- 37.Todoric J et al. Stress-activated NRF2-MDM2 cascade controls neoplastic progression in pancreas. Cancer Cell 32, 824–839 (2017). [DOI] [PMC free article] [PubMed] [Google Scholar]
- 38.Di Micco R et al. Oncogene-induced senescence is a DNA damage response triggered by DNA hyper-replication. Nature 444, 638–642 (2006). [DOI] [PubMed] [Google Scholar]
- 39.Bartkova J et al. Oncogene-induced senescence is part of the tumorigenesis barrier imposed by DNA damage checkpoints. Nature 444, 633–637 (2006). [DOI] [PubMed] [Google Scholar]
- 40.Rada P et al. Structural and functional characterization of Nrf2 degradation by the glycogen synthase kinase 3/β-TrCP axis. Mol. Cell. Biol 32, 3486–3499 (2012). [DOI] [PMC free article] [PubMed] [Google Scholar]
- 41.Umemura A et al. p62, upregulated during preneoplasia, induces hepatocellular carcinogenesis by maintaining survival of stressed HCC-initiating cells. Cancer Cell 29, 935–948 (2016). [DOI] [PMC free article] [PubMed] [Google Scholar]
- 42.Su H et al. Cancer cells escape autophagy inhibition via NRF2-induced macropinocytosis. Cancer Cell 39, 678–693 (2021). [DOI] [PMC free article] [PubMed] [Google Scholar]
- 43.Jin X et al. MAGE-TRIM28 complex promotes the Warburg effect and hepatocellular carcinoma progression by targeting FBP1 for degradation. Oncogenesis 6, e312 (2017). [DOI] [PMC free article] [PubMed] [Google Scholar]
- 44.Sun H et al. p53 transcriptionally regulates SQLE to repress cholesterol synthesis and tumor growth. EMBO Rep 22, e52537 (2021). [DOI] [PMC free article] [PubMed] [Google Scholar]
- 45.Abascal F et al. Somatic mutation landscapes at single-molecule resolution. Nature 593, 405–410 (2021). [DOI] [PubMed] [Google Scholar]
- 46.Alexandrov LB et al. The repertoire of mutational signatures in human cancer. Nature 578, 94–101 (2020). [DOI] [PMC free article] [PubMed] [Google Scholar]
- 47.Saini N & Gordenin DA Hypermutation in single-stranded DNA. DNA Repair 91–92, 102868 (2020). [DOI] [PMC free article] [PubMed] [Google Scholar]
- 48.Muzumdar MD, Tasic B, Miyamichi K, Li L & Luo L A global double-fluorescent Cre reporter mouse. Genesis 45, 593–605 (2007). [DOI] [PubMed] [Google Scholar]
- 49.Ogawara Y et al. Akt enhances Mdm2-mediated ubiquitination and degradation of p53. J. Biol. Chem 277, 21843–21850 (2002). [DOI] [PubMed] [Google Scholar]
- 50.Samuel VT & Shulman GI Nonalcoholic fatty liver disease as a nexus of metabolic and hepatic diseases. Cell Metab 27, 22–41 (2018). [DOI] [PMC free article] [PubMed] [Google Scholar]
- 51.Gu L. et al. Amplification of glyceronephosphate O-acyltransferase and recruitment of USP30 stabilize DRP1 to promote hepatocarcinogenesis. Cancer Res 78, 5808–5819 (2018). [DOI] [PubMed] [Google Scholar]
- 52.Koboldt DC et al. VarScan 2: somatic mutation and copy number alteration discovery in cancer by exome sequencing. Genome Res 22, 568–576 (2012). [DOI] [PMC free article] [PubMed] [Google Scholar]
- 53.McKenna A et al. The Genome Analysis Toolkit: a MapReduce framework for analyzing next-generation DNA sequencing data. Genome Res 20, 1297–1303 (2010). [DOI] [PMC free article] [PubMed] [Google Scholar]
- 54.Fan Y et al. MuSE: accounting for tumor heterogeneity using a sample-specific error model improves sensitivity and specificity in mutation calling from sequencing data. Genome Biol 17, 178 (2016). [DOI] [PMC free article] [PubMed] [Google Scholar]
- 55.Bergstrom EN et al. SigProfilerMatrixGenerator: a tool for visualizing and exploring patterns of small mutational events. BMC Genom 20, 685 (2019). [DOI] [PMC free article] [PubMed] [Google Scholar]
- 56.Filliol A et al. Opposing roles of hepatic stellate cell subpopulations in hepatocarcinogenesis. Nature 610, 356–365 (2022). [DOI] [PMC free article] [PubMed] [Google Scholar]
- 57.Guilliams M et al. Spatial proteogenomics reveals distinct and evolutionarily conserved hepatic macrophage niches. Cell 185, 379–396 (2022). [DOI] [PMC free article] [PubMed] [Google Scholar]
- 58.Hao Y et al. Integrated analysis of multimodal single-cell data. Cell 184, 3573–3587 (2021). [DOI] [PMC free article] [PubMed] [Google Scholar]
- 59.Razaghi R et al. Modbamtools: analysis of single-molecule epigenetic data for long-range profiling, heterogeneity, and clustering. Preprint at bioRxiv 10.1101/2022.07.07.499188 (2022). [DOI] [Google Scholar]
- 60.Hao Y et al. Dictionary learning for integrative, multimodal and scalable single-cell analysis. Nat. Biotechnol 42, 293–304 (2024). [DOI] [PMC free article] [PubMed] [Google Scholar]
- 61.Rui T et al. The chromosome 19 microRNA cluster, regulated by promoter hypomethylation, is associated with tumour burden and poor prognosis in patients with hepatocellular carcinoma. J. Cell. Physiol 235, 6103–6112 (2020). [DOI] [PubMed] [Google Scholar]
- 62.Ando M et al. Chromatin dysregulation and DNA methylation at transcription start sites associated with transcriptional repression in cancers. Nat. Commun 10, 2188 (2019). [DOI] [PMC free article] [PubMed] [Google Scholar]
- 63.Zhang J et al. Pan-cancer analyses reveal genomics and clinical characteristics of the melatonergic regulators in cancer. J Pineal Res 71, e12758 (2021). [DOI] [PubMed] [Google Scholar]
- 64.Tubbs A & Nussenzweig A Endogenous DNA damage as a source of genomic instability in cancer. Cell 168, 644–656 (2017). [DOI] [PMC free article] [PubMed] [Google Scholar]
- 65.Hänzelmann S, Castelo R & Guinney J GSVA: gene set variation analysis for microarray and RNA-seq data. BMC Bioinform 14, 7 (2013). [DOI] [PMC free article] [PubMed] [Google Scholar]
- 66.Wang X et al. Comprehensive assessment of cellular senescence in the tumor microenvironment. Brief Bioinform 23, bbac118 (2022). [DOI] [PMC free article] [PubMed] [Google Scholar]
- 67.Ikeda H et al. Expression profile of cell cycle-related genes in human fibroblasts exposed simultaneously to radiation and simulated microgravity. Int. J. Mol. Sci 20, 4791 (2019). [DOI] [PMC free article] [PubMed] [Google Scholar]
Associated Data
This section collects any data citations, data availability statements, or supplementary materials included in this article.
Supplementary Materials
Data Availability Statement
RNA-seq and snRNA-seq data are available at the GEO under accession numbers GSE240047 and GSE266447. DNA-seq data are available at the Sequence Read Archive (SRA) database under the accession number PRJNA1002629. Proteomic data are available at MassIVE (MSV000092592). Uncropped source blots and images are available in Supplementary Fig. 10. Source data are provided with this paper.