

ABSTRACT
Exercise induces a systemic response that involves complex gene regulation influenced by circulating miRNAs, which are post‐transcriptional regulators and communication molecules between tissues. Although previous studies have shown that exercise alters plasma miRNA profiles in amateur or highly trained athletes, the impact on Olympic athletes remains unexplored. Therefore, this study aimed to evaluate changes in the whole circulating miRNA profile and their functional implications based on acute exercise and training responses in Olympic medallists. We conducted a study involving four Olympic medallists who completed two maximal aerobic tests during two moments of the Olympic season. Plasma samples were extracted before and after both tests. A total of 752 miRNAs were profiled using high‐throughput qRT‐PCR, followed by functional characterization via integrated bioinformatics analyses (target prediction, pathway enrichment, and protein interaction network modeling). Our findings revealed two distinct circulating miRNA profiles in response to the maximal aerobic capacity test, depending on training status. Functional in silico analysis across multiple biological scales of the different acute exercise profiles revealed a regulatory shift from broad, canonical coordination to a more fragmented regulatory function. Notably, miR‐223‐3p was significantly upregulated with acute exercise and downregulated due to training. A correlation between miR‐223‐3p and maximal heart rate was observed, alongside our in silico analysis describing the association with heart contraction, membrane depolarization, cardiac conduction and atrial cardiac muscle action potential. In conclusion, the specific miRNA profiles identified in Olympic medallists provide new insights into biomarkers of exercise during an Olympic season, introducing the miR‐223‐3p as a novel indicator of acute exercise and training cardiac exercise adaptations.
Keywords: circulating microRNA, elite performance, exercise adaptations, exercise biomarker, Olympic athlete
1. Introduction
Athletes classified as ‘World Class’, including Olympic and World Championship medallists and finalists, as well as top performers in major professional leagues, represent approximately 0.00006% of the global population (about 4500 individuals worldwide) [1]. It is widely believed that their elite performance is a result of a combination of training and genetic factors, with genetics contributing up to 66% [2]. Although some genetic variations have been associated with a predisposition to excellence in specific sports, the precise genetic profile that underlies elite athleticism remains unclear [3, 4]. In this context, epigenetics has provided valuable insight into the regulation of genes involved in adaptations to physical exercise [5]. Among these epigenetic mechanisms, microRNAs (miRNAs) have emerged as critical mediators of exercise‐induced adaptations [6, 7], influencing processes, such as muscle hypertrophy, angiogenesis, and metabolic adaptations [8].
MiRNAs are small single‐stranded RNA molecules with a non‐coding sequence. MiRNA genes are initially transcribed in the nucleus as primary transcripts (pri‐miRNAs), which are subsequently processed by the Drosha enzyme into precursor miRNAs (pre‐miRNAs). These pre‐miRNAs are transported to the cytoplasm via Exportin 5 (XPO5), where they are further cleaved by the enzyme Dicer into short miRNA duplexes. These duplexes are subsequently loaded into the RNA‐induced silencing complex (RISC), where one strand is degraded. The remaining mature, single‐stranded miRNA within the RISC then guides the complex to target messenger RNAs (mRNAs) through complementary base pairing with the 3′ UTR, 5′ UTR, and coding sequence (CDS), leading to gene silencing via mRNA degradation or translational repression [9, 10].
Different miRNAs have been found to be involved in the regulation of signaling pathways relevant to exercise adaptation, including those involving AKT, FOXO, or mTOR, highlighting their influence on cellular processes [8]. Although most miRNAs are found in the cytoplasm, where their biogenesis occurs, evidence suggests that they can also be transferred directly from cell to cell [11]. Further, they can be secreted into body fluids [10, 12] through microvesicles or RNA‐binding protein‐dependent pathways, facilitating their transport and protecting them from degradation by RNases [13], and are considered cross‐tissue communication molecules [14, 15].
Previous studies have demonstrated that exercise can alter the expression and kinetics of appearance and disappearance of certain circulating miRNAs (c‐miRNA) in plasma of amateur or trained athletes (Reviewed in Fernández‐Sanjurjo et al.) [16]. These fluctuations in miRNA profiles depend on the intensity, duration, frequency, and mode of exercise or training intervention performed [17, 18]. Furthermore, these changes may be related to patterns of molecular crosstalk triggered during or after exercise, acting as mechanisms of response, recovery, and adaptation to the training load through specific gene expression regulation in target tissues [8]. The individual miRNA response is also influenced by athletes' training history, their competitive level [16] and their possible differential genetics. However, there is little research on Olympic level athletes, whose exercise history is extensive and whose training programming and periodization is conditioned by a 4‐year cycle.
Studying the c‐miRNA profile in Olympic athletes could provide valuable insights into the regulation of pathways involved in exercise‐induced adaptations. The analysis of Olympic athletes is particularly interesting due to their exceptional performance capacity and the evidence suggesting that they tend to have a longer lifespan compared to their counterparts, primarily due to a lower risk of various pathologies [19, 20, 21]. Therefore, c‐miRNAs may serve not only as biomarkers of exercise load and training adaptations, but also as potential contributors to protection against different diseases.
Thus, in this work we hypothesize that training status in Olympic medallists modify the acute response of circulating miRNAs to a maximal aerobic exercise test. To address this hypothesis, the objective of this study was to investigate the variation in c‐miRNA profiles in a case study of Olympic medallists and explore their potential relation with metabolic functions using an in silico approach. For this purpose, a comprehensive analysis of plasma c‐miRNAs was conducted before and after a training macrocycle along with two maximal aerobic tests in the year leading up to the Olympics, followed by a multiscale bioinformatic analysis of target gene pathways.
2. Materials and Methods
2.1. Ethics Statement
All experimental procedures were approved by the Research Ethics Committee of the Principality of Asturias, Spain (reference 124/17 and 238/19) and all participants gave written informed consent.
2.2. Participants
The study involved 4 elite male athletes (aged 29 ± 5) from the Spanish national canoeing team, representing 30% of the medallists in their modality and accumulating 13 Olympic medals in total. The group was homogeneous in terms of accommodation, daily routines, and training. At the end of the season under analysis, they won the silver medal. Physical characteristics of the participants are listed in Table 1.
TABLE 1.
Physical characteristics of the subjects (N = 4).
| Characteristics of the subjects | Mean ± Standard deviation |
|---|---|
| Age (years) | 29 ± 5 |
| Weight (kg) | 88.3 ± 3.3 |
| Height (cm) | 187.3 ± 4.4 |
| BMI (kg m−2) | 25.2 ± 0.6 |
Abbreviation: BMI, body mass index.
2.3. Experimental Design
An observational experimental design was used. Participants completed two maximal aerobic capacity tests at two different points in the season. The first assessment took place immediately after the preseason and before the start of the second macrocycle of the Olympic season. The second assessment was conducted after this macrocycle and prior to the Spanish Olympic qualification trials. The design of this macrocycle was a high‐volume combination between aerobic development and high‐intensity interval training. Their training programme was designed by a Level III international coach accredited by the International Canoeing Federation.
2.4. Maximal Aerobic Capacity Test
Maximal aerobic capacity (VO2max) was measured under controlled conditions on a kayak ergometer (Dansprint PRO Kayak Ergometer, Dansprint ApS, Strandmarksvej, Denmark). A ramp protocol was used, in which the athletes started at a rate of 60 strokes per minute and increased by 5 strokes every minute until exhaustion. The end of the test was defined as the point at which a stable VO2 measurement was maintained for 1 min, regardless of the increase in intensity. During the test, a continuous monitoring of heart rate (HR) and oxygen uptake was carried out using a Quark CPET (Cosmed, Rome, Italy).
2.5. Blood Sampling
In all cases, samples were collected by experienced technical staff using standardized protocols and materials before and after each maximal test.
At both sampling points during the season, participants had their first blood samples taken in an overnight fasted state prior to early morning breakfast. To minimize the impact of food intake on results, volunteers were asked to apply the same food selection prior to both maximal exercise tests. Following breakfast, they warmed up for 10 min and performed the test, with another blood sample taken immediately after. All blood samples (< 10 mL) were collected via venepuncture of an antecubital vein, with whole blood collected in EDTA‐coated vacutainer tubes (Becton Dickinson, Franklin Lakes, USA). Plasma was immediately obtained by a double centrifugation performed at 1600g and at room temperature for 10 and 15 min, respectively. Finally, plasma samples were aliquoted and stored at −80°C until further analysis.
2.6. MicroRNA Isolation, Reverse Transcription and Quantitative Polymerase Chain Reaction (qRT‐PCR)
To assess miRNA concentrations, total RNA was isolated from 200 μL of plasma using the miRNeasy Serum/Plasma Advanced kit (Qiagen, Hilden, Germany). The LNA Spike‐in kit with synthetic RNA spike‐in templates (UniSp2, UniSp4, UniSp5) (Qiagen, Hilden, Germany) was used to monitor RNA isolation efficiency.
For miRNA quantification, cDNA was synthesized using the miRCURY LNA RT kit (Qiagen, Hilden, Germany). For this purpose, 16 μL of RNA samples were reverse transcribed in a final volume of 80 μL according to the manufacturer's protocol. In this step, UniSp6 (Qiagen, Hilden, Germany) was also added to check for RT efficiency. For qPCR, cDNA was diluted 1:50 in RNAse‐free water and 5 μL used in 10 μL qPCR reactions with miRCURY LNA SYBR Green (Qiagen, Hilden, Germany) on a 7900HT fast Real‐Time PCR System (Applied Biosystems, Waltham, USA). For whole screening, circulating miRNAs were quantified using the human miRNome panels (I + II) Version 5 (Qiagen, Hilden, Germany). The synthetic spike‐in UniSp3 was also considered as the inter‐plate calibrator. In addition, panels also had SNORD38B, SNORD49A, and U6 snRNA present in the original samples. Considering all the controls and the processes performed, the samples were found to be of adequate quality. Raw data of the Cq values are provided in Data S1.
The SDS v2.3 software was used for both the determination of the quantification cycle (Cq) and for the melting curve analysis. The Cq was defined as the fractional cycle number at which the fluorescence exceeded a given threshold. miRNAs were considered detectable when Cq < 39 and were selected if they had at least 50% of the true values at one point of the season. Values higher than 39 Cq were changed to 40 for further analysis. Normalization was performed using the global mean of miRNAs using the ΔCq method [22], where ΔCq = Cq [miRNA] – Cq [global arithmetic mean]. For the statistical analysis 2−ΔCq was used. For figure representation fold change was calculated using 2−ΔCq values.
2.7. Pathway Analysis and Prediction
The pathways of modulated c‐miRNA target genes were analyzed to assess their potential involvement in the biological response to exercise. To account for the systemic regulation of miRNAs, c‐miRNAs were categorized based on whether their plasma levels increased or decreased. The validated metabolic pathways associated with each miRNA cluster were identified through KEGG (Kyoto Encyclopaedia of Genes and Genomes) pathway analysis using miRPath v4 [23] and the experimentally validated miRNA‐gene interaction database miRTarBase v8 [24]. Statistical significance for pathway analysis was defined as a merged false discovery rate (FDR) of < 0.05, generated by the Benjamini–Hochberg p‐value correction for multiple hypothesis testing provided by miRPath v4.
Subsequently, validated and predicted genes targeted by the c‐miRNA were obtained using miRWalk v3 [25]. A filter was applied to include only genes with a score higher than 0.95, ensuring a high probability of interaction. Then, using Cytoscape 3.10.2 [26], genes regulated by at least two miRNAs per group were selected, in order to ensure the holistic regulation of the clustered c‐miRNA.
To further understand the functional interactions of the regulated genes, a protein–protein interaction (PPI) network analysis was conducted using data from the STRING database v12.0 [27], which provides physical (direct) and functional (indirect) associations between proteins. Node degree and confidence cut‐offs were established, and the number of additional interactions was limited to zero.
Finally, the functions of the genes from enriched PPI networks were studied using the Cytoscape plug‐in ClueGO v2.5.10 [28] by a GO (Gene Ontology) analysis of the Biological process and Molecular function annotations. The p‐value filter was adjusted by dividing by the total number of proteins in each PPI network to obtain the most significantly regulated pathways. Gene functions were considered statistically significant when the false discovery rate (FDR) was < 0.05, calculated using the Bonferroni correction generated by ClueGO v2.5.10. For the functional subprofiles, the common gene selection in Cytoscape was omitted and all genes obtained in miRWalk v3 were used to create the PPI.
2.8. Statistical Analysis
A paired‐samples Student's t‐test was conducted to compare c‐miRNA expression and maximal aerobic capacity test parameters across different time points, using R version 4.4.2 (R Foundation for Statistical Computing). To assess the significance of the observed differences for the maximal aerobic capacity test parameters, Cohen's d effect size was calculated for each comparison. The interpretation of Cohen's d was based on standard thresholds [29]. Consistency of basal samples was evaluated by Bland–Altman plot. Correlations between miRNA fold changes values and HRmax were assessed using Pearson's correlation in GraphPad 10.2.3 (Dotmatics, Bishop's Stortford, UK). A correlation coefficient (r) greater than 0.80 was considered biologically relevant. Statistical significance was set at p‐value 0.05 for all analyses. The data are presented as means ± standard deviation.
3. Results
3.1. Olympic Athletes Showed Similar Maximal Aerobic Capacity at Both Points in the Season
Olympians consistently maintained high physical performance levels over time, as evidenced by their ability to exert maximal effort independent of the time of the season (Table 2). VO2max test time to exhaustion increased after the macrocycle, showing a large effect size (Table 2). However, maximal aerobic capacity was not modified (Table 2).
TABLE 2.
VO2max test parameters for the two maximal tests before and after the macrocycle (N = 4).
| Test parameter | Test before macrocycle | Test after macrocycle | Cohen's d | p |
|---|---|---|---|---|
| VO2max (mL min−1 kg−1) | 61.78 ± 2.95 | 61.95 ± 1.95 | 0.16 | 0.764 |
| HRmax (bpm) | 191 ± 7 | 189 ± 8 | −0.45 | 0.432 |
| Time to exhaustion (minutes) | 15.0 ± 1.0 | 15.5 ± 1.0 | 0.87 | 0.182 |
| Maximal number of strokes | 115 ± 4 | 118 ± 5 | 0.87 | 0.182 |
Abbreviations: HRmax, maximal heart rate; VO2max, maximal oxygen uptake.
3.2. Circulating microRNA Responses to Maximal Endurance Exercise Exhibit Specific Patterns as a Function of Training Status
Out of the 752 miRNAs scrutinized using RT‐qPCR, 104 were detected based on the established selection criteria. The observed melting temperatures (Tm) of these matched the expected values, indicating that the PCR products were specific and not contaminated by non‐specific amplification or primer‐dimers.
The pre‐training maximal exercise test induced a decrease in c‐miRNAs (miR‐185‐5p, miR‐486‐5p, miR‐25‐3p, miR‐132‐3p, miR‐192‐5p, and miR‐15b‐5p) and an increase in miR‐150‐5p and miR‐223‐3p (Figure 1A). The change observed in all miRNAs was moderate, indicated by the fold change below 1. This contrasts with the results from the second maximal test after the macrocycle (Figure 1B), where it was observed that of the miRNAs that change, miR‐223‐3p and miR‐19a‐3p increase rather than decrease as in the previous maximal test. Furthermore, on the whole, training reduced the impact of an acute bout of exercise on the miRNA response, as only 2 miRNAs showed significant changes after the training period compared to 8 miRNAs in the pre‐training test. Additionally, post‐training miRNA profiles during acute exercise (Figure 1B) revealed two distinct groups of athletes based on their fold change, implying a more individualized miRNA response induced by training, potentially reflecting different adaptation mechanisms between athletes.
FIGURE 1.

Plasma circulating miRNAs altered immediately after acute exercise and after training with significant variation in their levels of expression. (A) Circulating miRNAs that showed a significant change in the first aerobic capacity test before the macrocycle. (B) Circulating miRNAs that showed a significant change in the second aerobic capacity test after the macrocycle. (C) Circulating miRNAs that showed significant changes in basal state due to training. p‐values < 0.05 were considered significant. Horizontal bars indicate the mean, whereas the error bars indicate the standard deviation of the data. Light blue indicates downregulation in the levels of expression while light red indicates upregulation in the levels of expression (N = 4).
Among the miRNAs analyzed, miR‐223‐3p was the only one to show a significant increase in both tests (Figure 1A,B). Notably, in well‐trained Olympic athletes, miR‐223‐3p displayed a more pronounced variation across the training period, with the fold change increasing from 0.77 ± 0.17 in the first test to 3.01 ± 0.90 in the second test.
On the other hand, an 8‐week training period resulted in the downregulation of miR‐425‐5p and miR‐223‐3p, with a moderate fold change (−0.56 ± 0.28 and −0.43 ± 0.16 respectively) (Figure 1C), showing a consistent expression of miRNA at baseline in highly trained athletes.
3.3. Genes Co‐Regulated by the miRNA Profile Defined in the Initial Maximal Test Have a High Functional Integration
To evaluate the potential function relevance of significantly altered miRNAs, we selected target genes regulated by at least two miRNAs per group (up‐ and downregulated). Protein–protein interaction (PPI) networks for these candidate genes were constructed using the STRING analysis tool, which assigns a confidence score to each interaction ranging from 0 (low confidence) to 1 (high confidence).
In the pre‐training VO2max test, 3125 genes were identified as co‐regulated by the six miRNAs that decreased in plasma, whereas 213 genes were co‐regulated by the two miRNAs that increased in plasma. The PPI networks for this acute pre‐training exercise (Figure 2A,B) revealed a high protein‐level interaction among regulated genes, resulting in a network of 1961 interconnected proteins for downregulated miRNA‐regulated genes and 66 proteins for upregulated miRNA‐regulated genes.
FIGURE 2.

Larger protein–protein interaction (PPI) networks constructed using the STRING database and the genes regulated by at least two miRNAs within the groups generated according to whether their expression increased or decreased. (A) PPI network for the six downregulated miRNAs in the first maximal aerobic capacity test (confidence score 0.9). (B) PPI network for the two upregulated miRNAs in the first maximal aerobic capacity test (confidence score 0.5). (C) PPI network for the two upregulated miRNAs in the second maximal aerobic capacity test (confidence score 0.1). (D) PPI network for the two downregulated miRNAs due to exercise (confidence score 0.1). The color of the nodes indicates the protein family. Nodes are connected to each other by edges. The color of the edges represents the confidence score between the nodes it links; the darker the edge, the higher it is. No additional interactions were added. GPCR, G‐protein coupled receptor; oGPCR, Orphan G protein coupled receptors; TF, transcription factor.
Following training, only 25 genes were co‐regulated in the maximal aerobic test, and the PPI network displayed minimal interaction among them in response to acute exercise (Figure 2C). A similar result was observed at rest, with only 55 co‐regulated genes and a PPI network with low confidence score (Figure 2D).
3.4. Shift in miRNA Profiles From Broad to Targeted Regulatory Activity Following Maximal Aerobic Capacity Test in Olympic Athletes
The in silico analysis of metabolic pathways using miRPath (Table S1) showed that miRNAs with significant changes before training—identified during the first maximal test—are involved in pathways previously linked to exercise and performance. These include the FoxO, Hippo, p53, and TGF‐β pathways, as well as pathways related to protein processing and cellular functions, such as cell cycle regulation, autophagy, and stem cell pluripotency.
The regulation of metabolism by miRNA clusters was consistent with the more detailed results of ClueGO enriched PPI pathways (Figure 2A) in the context of the maximal aerobic capacity test before the macrocycle (Figure 3A). These findings show that downregulated miRNAs are closely related with phosphorylation processes, including the MAPK cascade, kinase activity, phosphate metabolic processes, and regulation of the proteins involved in these processes (Figure S1). Another key function is their implication on RNA biosynthetic processes which includes transcription regulation (Figure S1). Both pathways represent a common functional axis for many metabolic pathways. Additionally, another pathway impacted by downregulated miRNAs involves the nervous system, specifically the generation of neurones and chemical synaptic transmission (Figure 3A), being a more targeted process.
FIGURE 3.

ClueGO analysis for validated and predicted genes forming larger PPI networks. (A) Representative GO analysis for the miRNA downregulated in the first maximal aerobic capacity test. (B) Representative GO analysis for the miRNA upregulated in the first maximal aerobic capacity test. (C) Representative GO analysis for the miRNA downregulated due to exercise. Nodes represent the GO Biological Process and GO Molecular Function terms, and the size represents the term enrichment significance. The node pie charts represent the percentage of terms per group. Only the most significant term in the group was labeled.
On the other hand, upregulated miRNAs were mainly associated with heart contraction and membrane depolarization (Figure 3B). This analysis may suggest that miR‐223‐3p and miR‐150‐5p are related to cardiac responses in exercise.
After the period of training, when athletes performed a maximal test, only two miRNAs increased their expression, miR‐223‐3p and miR‐19a‐3p. However, from an in silico perspective they did not show a specific combined functional relationship. This was evident as there were no associations found in ClueGO analysis. Instead, broader regulatory effects were noted, such as an involvement in the FoxO signaling pathway and stem cells regulation (Table S1).
Finally, miR‐425‐5p and miR‐223‐3p that changed significantly during training, showed poor coordinated regulation, participating in constitutive pathways (Figure 3C and Table S1).
3.5. Functional miRNA Subprofiles in Acute Exercise Are Related to Cardiac Function and Correlate With Maximal Heart Rate
During the initial maximal pre‐training test, though not reaching significance, miR‐150‐5p exhibited an increasing trend associated with maximal heart rate (Figure 4A). Moreover, in silico analysis indicated that miR‐150‐5p is associated with cardiac tissue development, contraction and new blood vessel development (Figure 5A). In the second maximal test, following a period of training, miR‐223‐3p and miR‐19a‐3p displayed a negative correlation with maximal heart rate (Figure 4B,C). Furthermore, it was observed that miR‐223‐3p, even though present in the initial maximal test, only showed a correlation with heart rate after the training period, suggesting a more specific response when the athletes had achieved a higher level of physical conditioning. Additionally, GO analysis of all the predicted and validated genes regulated by miR‐223‐3p and miR‐19a‐3p, showed a joint participation in SA node depolarisation reinforcing the relationship with maximum heart rate (Figure 5B).
FIGURE 4.

Correlation between the fold change of miRNAs and maximal heart rate during the maximal aerobic tests. (A) Positive correlation of miR‐150‐5p and maximal heart rate in the first maximal aerobic test. (B) Negative correlation of miR‐223‐3p with the maximal heart rate in the second maximal aerobic test. (C) Negative correlation of miR‐19a‐3p with the maximal heart rate in the second maximal aerobic test. In the graphs, p‐value and Pearson r value are indicated for each correlation (N = 4). HRmax, maximal heart rate.
FIGURE 5.
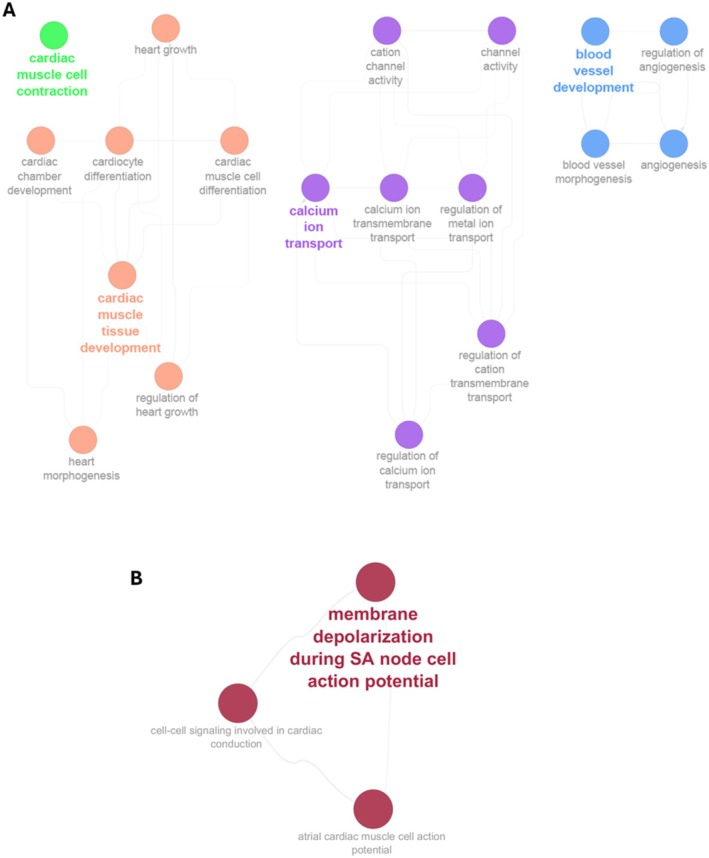
Pathways related to cardiovascular function for miRNAs that show correlation with heart rate. (A) GO analysis for all validated and predicted genes that formed the larger PPI network regulated by miR‐150‐5p (cutoff 0.9). (B) GO analysis for all validated and predicted genes that formed the larger PPI network regulated by miR‐223‐3p and miR‐19a‐3p (cutoff 0.9).
4. Discussion
For the first time, this study analyzed a global profile of 752 c‐miRNAs in medal‐winning Olympians in response to acute and training exercise stimuli during an Olympic season. Our findings revealed two distinct c‐miRNA expression profiles in response to a maximal aerobic capacity test, depending on training status. Functional in silico analysis across multiple biological scales indicated a regulatory shift from broad to more targeted activity as a function of training. Notably, miR‐223‐3p was significantly upregulated in response to acute exercise and downregulated following the training period. A correlation between miR‐223‐3p and maximal heart rate was observed, consistent with in silico predictions linking this miRNA to cardiac function.
Previous studies have examined the miRNA profile in amateur athletes immediately after an incremental VO2max test. Baggish et al. reported the upregulation of 4 c‐miRNA [30], whereas Fernández‐Sanjurjo et al. observed an increase in 13 c‐miRNA after a whole analysis of 752 miRNAs [31]. Among the miRNAs defined in these previous studies, we have only found a similar upregulation for miR‐150‐5p. However, the acute responses observed in our data differ from those reported in amateur athletes, where increased plasma levels of c‐miRNAs have been documented [30, 31]. In contrast, our findings in Olympic athletes show a greater number of downregulated miRNAs (miR‐486‐5p, miR‐185‐5p, miR‐25‐3p, miR‐132‐3p, miR‐192‐5p, and miR‐15b‐5p) compared to upregulated ones (miR‐150‐5p, miR‐19a‐3p, and miR‐223‐3p). This reduction in plasma c‐miRNA in Olympic athletes may indicate a repressed expression or a reduced secretion, but it could also be related to the uptake of these specific miRNAs by target tissues [16]. This active response was previously described in amateur athletes associated with high exercise volumes [17], however, in this case of Olympic athletes, we observed this response in a short maximal exercise bout.
From a metabolic perspective, the potential impacts and interactions of miRNAs in Olympic athletes suggest that, at the starting point of the season, a maximal effort induces a broad, canonical response through key exercise signaling pathways, such as Hippo [32], FoxO [33], and the cell cycle, along with RNA biosynthesis and phosphorylation processes [34]. However, after the training period, the functional implications were less coordinated, involving fewer circulating miRNAs.
Furthermore, VO2max test parameters indicated an adaptation to training, as evidenced by an increased time to exhaustion, even though VO2max and HRmax themselves did not change. Interestingly, miR‐223‐3p emerged as a consistent responder to acute exercise, with its response varying according to training status. The increased fold change in the second test of miR‐223‐3p is explained by the lower baseline levels observed after the training period. Moreover, in the second test, the fold change was correlated with HRmax. The relationship between miR‐223‐3p and cardiac function was also evident in our in silico analysis, where it was associated with heart contraction and membrane depolarization during SA action potential. Previous studies have identified miR‐223‐3p as a potential functional biomarker of heart disease [35, 36]. Wang et al. described that lower levels of miR‐223 protect against cardiac hypertrophy, whereas a dose‐dependent increase was associated with a pharmacological raise in cardiac output [35]. Both findings in prolonged and acute responses could be related to our results, suggesting a possible exercise‐induced heart adaptation mediated by miR‐223‐3p in Olympic athletes.
In conclusion, the training status of Olympic medallist influenced the c‐miRNA profile, being sensitive to indicate possible biological adaptations to training. Considering their post‐transcriptional regulation and their presence in fluid, c‐miRNAs emerge as possible functional biomarkers during an Olympic season.
5. Perspectives
Our results show for the first time that the profile of c‐miRNAs in Olympic medallists responds to a maximal aerobic test in a way, that is influenced by the level of training and differs from that of amateur athletes [30, 31]. This highlights the importance of further research in Olympic and high‐performance athletes to better understand their specific adaptations and improve their training management. In this sense, we identified miR‐223‐3p as a potential biomarker of acute exercise and cardiac adaptations during exercise. Thus, these results give new insights into functional biomarkers of training status and physical adaptation during an Olympic season. This opens new perspectives towards better planning and management of training load based on the specificity and sensitivity of circulating miRNAs to intensity‐ and duration‐dependent physical exercise stimuli. Therefore, this work provides the basis for future studies in highly trained athletes using blood biopsies to study c‐miRNA profiles and their functional assessment.
6. Limitations
Although the current literature suggests the role of miRNAs as signaling molecules, it is necessary to mention that more research is needed since the precise mechanism underlying the packaging of miRNAs into vesicles or RNA‐protein complexes, their selective secretion into extracellular fluids, and their uptake and functional role in the receptor cell remain poorly understood. The low number of participants and the absence of women in the study are limitations, which could broaden the perspective to the total number of Olympic athletes. In addition, a psychosocial analysis of the athletes could offer deeper insights into the results obtained. Regarding the methodology, the use of qPCR offers relative results limiting the discovery of miRNAs with implications on exercise adaptations. Finally, future research should deepen the functional analysis by validating the gene and tissue targets in which the miRNAs described carry out their regulatory function, since the in silico analysis does not take into account the possible uptake of c‐miRNAs by the target tissues or the level of expression of these target genes in the context studied.
Conflicts of Interest
The authors declare no conflicts of interest.
Supporting information
Appendix S1.
Data S1.
Acknowledgments
This work was supported by the Fundación Tatiana Pérez de Guzmán el Bueno (SV‐21‐TATIANA‐1, Convocatoria de ayudas a proyectos de investigación en neurociencia, edición 2020) to E.I.‐G and by the Spanish Ministerio de Economía y Competitividad (DEP2015‐69980‐P) to B.F.‐G. P.P.‐H. was supported by a contract associated with grant AYUD/2021/5134 from FICYT (Plan de Ciencia, Tecnología e Innovación 2018‐2022 del Principado de Asturias), cofunded by the Fondo Europeo de Desarrollo Regional (FEDER), Spain. Authors would like to acknowledge the technical support provided by Servicios Cientifico‐Técnicos de la Universidad de Oviedo.
Fernandez‐Vivero D., Terrados N., Pinto‐Hernandez P., et al., “A Multiscale In Silico Analysis Identifies Plasma Levels of miR‐223‐3p as an Emerging Biomarker of Cardiac Response to Acute Exercise and Training in Olympic Medallists,” Scandinavian Journal of Medicine & Science in Sports 35, no. 6 (2025): e70092, 10.1111/sms..40521953
Funding: This work was supported by Fundación para el Fomento en Asturias de la Investigación Científica Aplicada y la Tecnología; Fundación Tatiana Pérez de Guzmán el Bueno; Ministerio de Economía y Competitividad.
E. Iglesias‐Gutierrez and M. Fernandez‐Sanjurjo authors contributed equally as last authors.
Data Availability Statement
The data that supports the findings of this study are available in the Supporting Information of this article.
References
- 1. McKay A. K. A., Stellingwerff T., Smith E. S., et al., “Defining Training and Performance Caliber: A Participant Classification Framework,” International Journal of Sports Physiology and Performance 17, no. 2 (2021): 317–331, 10.1123/ijspp.2021-0451. [DOI] [PubMed] [Google Scholar]
- 2. Moor M. H. M. D., Spector T. D., Cherkas L. F., et al., “Genome‐Wide Linkage Scan for Athlete Status in 700 British Female DZ Twin Pairs,” Twin Research and Human Genetics 10, no. 6 (2007): 812–820, 10.1375/twin.10.6.812. [DOI] [PubMed] [Google Scholar]
- 3. Rankinen T., Fuku N., Wolfarth B., et al., “No Evidence of a Common DNA Variant Profile Specific to World Class Endurance Athletes,” PLoS One 11, no. 1 (2016): e0147330, 10.1371/journal.pone.0147330. [DOI] [PMC free article] [PubMed] [Google Scholar]
- 4. Semenova E. A., Hall E. C. R., and Ahmetov I. I., “Genes and Athletic Performance: The 2023 Update,” Genes 14, no. 6 (2023): 1235, 10.3390/genes14061235. [DOI] [PMC free article] [PubMed] [Google Scholar]
- 5. Widmann M., Nieß A. M., and Munz B., “Physical Exercise and Epigenetic Modifications in Skeletal Muscle,” Sports Medicine 49, no. 4 (2019): 509–523, 10.1007/s40279-019-01070-4. [DOI] [PubMed] [Google Scholar]
- 6. Diniz G. P. and Wang D. Z., “Regulation of Skeletal Muscle by microRNAs,” Comprehensive Physiology 6, no. 3 (2016): 1279–1294, 10.1002/cphy.c150041. [DOI] [PubMed] [Google Scholar]
- 7. dos Santos J. A. C., Veras A. S. C., Batista V. R. G., et al., “Physical Exercise and the Functions of microRNAs,” Life Sciences 304 (2022): 120723, 10.1016/j.lfs.2022.120723. [DOI] [PubMed] [Google Scholar]
- 8. Domańska‐Senderowska D., Laguette M. J. N., Jegier A., Cięszczyk P., September A. V., and Brzeziańska‐Lasota E., “MicroRNA Profile and Adaptive Response to Exercise Training: A Review,” International Journal of Sports Medicine 40 (2019): 227–235, 10.1055/a-0824-4813. [DOI] [PubMed] [Google Scholar]
- 9. Matsuyama H. and Suzuki H. I., “Systems and Synthetic microRNA Biology: From Biogenesis to Disease Pathogenesis,” International Journal of Molecular Sciences 21, no. 1 (2019): 132, 10.3390/ijms21010132. [DOI] [PMC free article] [PubMed] [Google Scholar]
- 10. Saliminejad K., Khorram Khorshid H. R., Soleymani Fard S., and Ghaffari S. H., “An Overview of microRNAs: Biology, Functions, Therapeutics, and Analysis Methods,” Journal of Cellular Physiology 234, no. 5 (2019): 5451–5465, 10.1002/jcp.27486. [DOI] [PubMed] [Google Scholar]
- 11. Lemcke H., Steinhoff G., and David R., “Gap Junctional Shuttling of miRNA—A Novel Pathway of Intercellular Gene Regulation and Its Prospects in Clinical Application,” Cellular Signalling 27, no. 12 (2015): 2506–2514, 10.1016/j.cellsig.2015.09.012. [DOI] [PubMed] [Google Scholar]
- 12. Sanchis‐Gomar F., Arnau‐Moyano M., Daimiel L., et al., “Circulating microRNAs Fluctuations in Exercise‐Induced Cardiac Remodeling: A Systematic Review,” American Journal of Translational Research 13, no. 12 (2021): 13298–13309. [PMC free article] [PubMed] [Google Scholar]
- 13. Zhao C., Sun X., and Li L., “Biogenesis and Function of Extracellular miRNAs,” ExRNA 1, no. 1 (2019): 38, 10.1186/s41544-019-0039-4. [DOI] [Google Scholar]
- 14. Whitham M., Parker B. L., Friedrichsen M., et al., “Extracellular Vesicles Provide a Means for Tissue Crosstalk During Exercise,” Cell Metabolism 27, no. 1 (2018): 237–251.e4, 10.1016/j.cmet.2017.12.001. [DOI] [PubMed] [Google Scholar]
- 15. Guo L., Quan M., Pang W., Yin Y., and Li F., “Cytokines and Exosomal miRNAs in Skeletal Muscle–Adipose Crosstalk,” Trends in Endocrinology and Metabolism 34, no. 10 (2023): 666–681, 10.1016/j.tem.2023.07.006. [DOI] [PubMed] [Google Scholar]
- 16. Fernández‐Sanjurjo M., de Gonzalo‐Calvo D., Fernández‐García B., et al., “Circulating microRNA as Emerging Biomarkers of Exercise,” Exercise and Sport Sciences Reviews 46, no. 3 (2018): 160–171, 10.1249/JES.0000000000000148. [DOI] [PubMed] [Google Scholar]
- 17. Fernández‐Sanjurjo M., Úbeda N., Fernández‐García B., et al., “Exercise Dose Affects the Circulating microRNA Profile in Response to Acute Endurance Exercise in Male Amateur Runners,” Scandinavian Journal of Medicine & Science in Sports 30, no. 10 (2020): 1896–1907, 10.1111/sms.13759. [DOI] [PubMed] [Google Scholar]
- 18. Sieland J., Niederer D., Engeroff T., et al., “Effects of Single Bouts of Different Endurance Exercises With Different Intensities on microRNA Biomarkers With and Without Blood Flow Restriction: A Three‐Arm, Randomized Crossover Trial,” European Journal of Applied Physiology 121, no. 11 (2021): 3243–3255, 10.1007/s00421-021-04786-2. [DOI] [PMC free article] [PubMed] [Google Scholar]
- 19. Antero J., Tanaka H., Larochelambert Q. D., Pohar‐Perme M., and Toussaint J. F., “Female and Male US Olympic Athletes Live 5 Years Longer Than Their General Population Counterparts: A Study of 8124 Former US Olympians,” British Journal of Sports Medicine 55, no. 4 (2021): 206–212, 10.1136/bjsports-2019-101696. [DOI] [PubMed] [Google Scholar]
- 20. Antero‐Jacquemin J., Desgorces F. D., Dor F., et al., “Row for Your Life: A Century of Mortality Follow‐Up of French Olympic Rowers,” PLoS One 9, no. 11 (2014): e113362, 10.1371/journal.pone.0113362. [DOI] [PMC free article] [PubMed] [Google Scholar]
- 21. Clarke P. M., Walter S. J., Hayen A., Mallon W. J., Heijmans J., and Studdert D. M., “Survival of the Fittest: Retrospective Cohort Study of the Longevity of Olympic Medallists in the Modern Era,” BMJ 345 (2012): e8308, 10.1136/bmj.e8308. [DOI] [PubMed] [Google Scholar]
- 22. Livak K. J. and Schmittgen T. D., “Analysis of Relative Gene Expression Data Using Real‐Time Quantitative PCR and the 2−ΔΔCT Method,” Methods 25, no. 4 (2001): 402–408, 10.1006/meth.2001.1262. [DOI] [PubMed] [Google Scholar]
- 23. Tastsoglou S., Skoufos G., Miliotis M., et al., “DIANA‐miRPath v4.0: Expanding Target‐Based miRNA Functional Analysis in Cell‐Type and Tissue Contexts,” Nucleic Acids Research 51, no. W1 (2023): W154–W159, 10.1093/nar/gkad431. [DOI] [PMC free article] [PubMed] [Google Scholar]
- 24. Karagkouni D., Paraskevopoulou M. D., Chatzopoulos S., et al., “DIANA‐TarBase v8: A Decade‐Long Collection of Experimentally Supported miRNA–Gene Interactions,” Nucleic Acids Research 46, no. D1 (2018): D239–D245, 10.1093/nar/gkx1141. [DOI] [PMC free article] [PubMed] [Google Scholar]
- 25. Sticht C., Torre C. D. L., Parveen A., and Gretz N., “miRWalk: An Online Resource for Prediction of microRNA Binding Sites,” PLoS One 13, no. 10 (2018): e0206239, 10.1371/journal.pone.0206239. [DOI] [PMC free article] [PubMed] [Google Scholar]
- 26. Shannon P., Markiel A., Ozier O., et al., “Cytoscape: A Software Environment for Integrated Models of Biomolecular Interaction Networks,” Genome Research 13, no. 11 (2003): 2498–2504, 10.1101/gr.1239303. [DOI] [PMC free article] [PubMed] [Google Scholar]
- 27. Szklarczyk D., Kirsch R., Koutrouli M., et al., “The STRING Database in 2023: Protein–Protein Association Networks and Functional Enrichment Analyses for Any Sequenced Genome of Interest,” Nucleic Acids Research 51, no. D1 (2023): D638–D646, 10.1093/nar/gkac1000. [DOI] [PMC free article] [PubMed] [Google Scholar]
- 28. Bindea G., Mlecnik B., Hackl H., et al., “ClueGO: A Cytoscape Plug‐In to Decipher Functionally Grouped Gene Ontology and Pathway Annotation Networks,” Bioinformatics 25, no. 8 (2009): 1091–1093, 10.1093/bioinformatics/btp101. [DOI] [PMC free article] [PubMed] [Google Scholar]
- 29. Kacprzak B., Rosińska K., and Stańczak M., “Effective Treatment of Cartilage Abnormalities in Middle‐Aged Individuals (Aged 45‐60): Bounding Molecular Biology With Microfracture and Hyalofast Membrane Approach Show Positive Outcomes,” Cellular Physiology and Biochemistry 59, no. 1 (2025): 100–115, 10.33594/000000760. [DOI] [PubMed] [Google Scholar]
- 30. Baggish A. L., Hale A., Weiner R. B., et al., “Dynamic Regulation of Circulating microRNA During Acute Exhaustive Exercise and Sustained Aerobic Exercise Training,” Journal of Physiology 589, no. 16 (2011): 3983–3994, 10.1113/jphysiol.2011.213363. [DOI] [PMC free article] [PubMed] [Google Scholar]
- 31. Fernández‐Sanjurjo M., Díaz‐Martínez Á. E., Díez‐Robles S., et al., “Circulating MicroRNA Profiling Reveals Specific Subsignatures in Response to a Maximal Incremental Exercise Test,” Journal of Strength and Conditioning Research 35, no. 2 (2021): 287, 10.1519/JSC.0000000000003930. [DOI] [PubMed] [Google Scholar]
- 32. Gabriel B. M., Hamilton D. L., Tremblay A. M., and Wackerhage H., “The Hippo Signal Transduction Network for Exercise Physiologists,” Journal of Applied Physiology 120, no. 10 (2016): 1105–1117, 10.1152/japplphysiol.01076.2015. [DOI] [PMC free article] [PubMed] [Google Scholar]
- 33. Sanchez A. M. J., Candau R. B., and Bernardi H., “FoxO Transcription Factors: Their Roles in the Maintenance of Skeletal Muscle Homeostasis,” Cellular and Molecular Life Sciences 71, no. 9 (2014): 1657–1671, 10.1007/s00018-013-1513-z. [DOI] [PMC free article] [PubMed] [Google Scholar]
- 34. Hoffman N. J., Parker B. L., Chaudhuri R., et al., “Global Phosphoproteomic Analysis of Human Skeletal Muscle Reveals a Network of Exercise‐Regulated Kinases and AMPK Substrates,” Cell Metabolism 22, no. 5 (2015): 922–935, 10.1016/j.cmet.2015.09.001. [DOI] [PMC free article] [PubMed] [Google Scholar]
- 35. Wang K., Long B., Liu F., et al., “A Circular RNA Protects the Heart From Pathological Hypertrophy and Heart Failure by Targeting miR‐223,” European Heart Journal 37, no. 33 (2016): 2602–2611, 10.1093/eurheartj/ehv713. [DOI] [PubMed] [Google Scholar]
- 36. Zhang M. W., Shen Y. J., Shi J., and Yu J. G., “MiR‐223‐3p in Cardiovascular Diseases: A Biomarker and Potential Therapeutic Target,” Frontiers in Cardiovascular Medicine 7 (2021): 610561, 10.3389/fcvm.2020.610561. [DOI] [PMC free article] [PubMed] [Google Scholar]
Associated Data
This section collects any data citations, data availability statements, or supplementary materials included in this article.
Supplementary Materials
Appendix S1.
Data S1.
Data Availability Statement
The data that supports the findings of this study are available in the Supporting Information of this article.