

Abstract
The development of emulsified products, such as pharmaceuticals and cosmetics, often requires expensive and time-consuming experimental screening to optimize their physical properties owing to their complex mixtures of surfactants and additives. Given that industries are eager for a general-purpose in silico method for predicting aggregation properties, we investigated the applicability of all-atom molecular dynamics (AAMD) simulations for predicting the physical properties of aqueous solutions containing nonionic surfactants. This study focused on the self-assembly process of polyoxyethylene alkyl ethers (C m EO n ), as they are popular components of emulsified products. We executed AAMD simulations starting from initial configurations with randomly mixed C m EO n in water to investigate the micelle formation dynamics. Surfactants of various lengths (m = 6–14 and n = 3–9) were investigated in a temperature range of 300 K–340 K. Within approximately 100 ns, C m EO n monomers self-aggregated with their hydrophilic chains facing outward toward the water phase and their hydrophobic chains directed inward, forming numerous less spherical, incomplete, small micelles. After 100 ns, the small micelles merged, forming larger and more spherical micelles. The aggregation number increased with increasing temperature and alkyl chain length and decreased with increasing polyoxyethylene chain length. The AAMD results were consistent with experimental observations, demonstrating the applicability of AAMD simulations in aggregation property prediction.


Introduction
Surfactants, which comprise hydrophobic and hydrophilic regions, self-organize to form complex molecular assemblies such as micelles, emulsions, and vesicles. This self-organization is responsible for various functionalities, such as reduced surface tension, emulsification, and solubilization, leading to their wide application from the chemical industry to the healthcare sector. −
Conventional methods employed to guide surfactant selection rely on single-molecule three-dimensional chemical structures. The critical packing parameter, which approximates the ratio of the hydrophilic headgroup to the hydrophobic tail area, is utilized to predict the shape and size of membrane structures. Conventional methods also consider the hydrophilic–lipophilic balance , and predicted emulsion type (oil-in-water or water-in-oil), following the Bancroft rule. , However, such methods based mostly on single-molecule properties cannot directly predict the functionality after emulsification. In particular, functions such as emulsion stability, reagent solubility, and drug delivery are derived from complex emulsion structures. For example, cream formulations sometimes undergo thermodynamically favorable (but consumer unfavorable) phase separation caused by the coalescence of dispersed emulsion particles, which may be avoided by optimizing the particle size distribution. , The relevant phenomena are determined by complex emulsion structures. In addition to the structural parameters of surfactant molecules, various factors must be considered when predicting and interpreting complex emulsion structures, such as temperature, pH, the salt content, and additives in the solvent. Comprehensively considering these factors without contradiction is challenging.
Molecular dynamics (MD) simulation is a powerful tool for overcoming this issue. In MD simulations, the equation of motion is solved for all component particles according to the forces acting upon them, and the complex interactions among numerous molecules and their collective behaviors are included in the resultant structure and dynamics.
Model selection is essential in MD simulations. In the all-atom (AA) model, atoms are the fundamental particles in the simulation, and solvent molecules are treated explicitly. Thus, the atomistic details are fully represented in the simulation. In the coarse-grained (CG) model, several atoms, segments, or molecules are effectively represented by a single particle. In some CG models, the solvent is treated as a continuum, further reducing the number of particles considered in the simulation. The advantage of the CG model is that a large-scale simulation for a longer time scale can be performed with lower computational resources, as it involves fewer particles than the AA model, and the time increment in the numerical solution of the equation of motion can be much longer than the AA model. Nonetheless, by sacrificing atomistic details, the CG model often fails to reproduce temperature dependence. Additionally, the time evolution may not be realistic given that the CG model tends to excessively smooth the energy landscape. Therefore, the AA model may be used to investigate realistic but rather small micellar systems at atomistic resolution including their real-time dynamics, whereas the CG model is useful for studying the general behavior of complex structures in very large systems at equilibrium at a given temperature.
Several AAMD simulation studies have been conducted on various micelles and membranes − at atomistic resolution, including polyoxyethylene alkyl ether (C m EO n ) micelles. − For example, AAMD simulations have been employed to evaluate micelle shape − , and free energy change , as a function of aggregation number, the fusion process of small incomplete micelles, and the solubilization process of solutes by micelles. − Further, a few studies explored the aggregation process of micelles or small aggregates. − Among them, we investigated C12E8 micelle formation and Wu et al. reported a special case of aggregation process for C6E3 in pores. Although these studies successfully described the characteristics of a single micelle, AAMD simulations are rarely applied to investigations of systems comprising numerous micelles. Consequently, the formation process of multiple micelles remains poorly understood.
Owing to the utility of the CG model for studying systems at equilibrium, many studies have predicted aggregation characteristics such as the critical micelle concentration (CMC) and aggregation number. − For example, Jusufi et al. reproduced the CMC of C m EO n by optimizing the force field parameters for the experimentally measured CMC. Although Johnston et al. reproduced the CMC and aggregation number of C m EO n by optimizing the CG model for the experimentally measured aggregation number, these authors reported that the reproduction of the aggregation number failed when the experimentally measured aggregation number was not included in the objective function for optimization.
The purpose of the present study is to investigate the micelle formation process focusing on the dynamics toward the equilibrium state rather than the static properties of the system after it reaches equilibrium. We must emphasize the real-time dynamics that does not contradict the experimental observations at equilibrium. AAMD is the only method by which we can discuss the real-time dynamics. As shown later, 400 ns-long MD calculations were sufficient to obtain the micelle formation dynamics at initial stages that is consistent with the experimental observations at equilibrium, though they were still approaching equilibrium.
Given that large-scale AAMD simulations are needed to investigate realistic multimicelle formation, wherein a large number of surfactant molecules at atomistic resolution are encapsulated in the MD simulation cell, the extensive computational resources of the Fugaku supercomputer were employed.
Among various surfactant molecules, C m EO n is known for its controllable aggregation characteristics, which result from the balance between its hydrophobic alkyl and hydrophilic polyoxyethylene (EO) chain lengths, low irritancy, and high stability in biological systems, leading to its wide adoption in various emulsified formulations and cosmetics. − One of the principal characteristics of C m EO n is the aggregation number, which increases with increasing temperature and alkyl chain length and decreases with increasing length of the EO chain (Figure S1). − Therefore, this study systematically conducted AAMD simulations with C m EO n molecules possessing a wide range of alkyl and EO chain lengths to investigate their key contributions to the self-assembly process.
Methods
Table presents the C m EO n molecules, force fields, numbers of C m EO n molecules, and temperatures investigated in the study. The OPLS-AA force field and TIP4P/2005 model were adopted for C m EO n and water molecules, respectively, after comparison with the CHARMM36 force field. The OPLS-AA and CHARMM36 force fields presented very similar aggregation dynamics. The TIP4P/2005 model was selected because it provided an excellent description of the surface tension.
1. Systems Investigated via AAMD Simulations.
| Test | C m EO n molecules employed | Number of C m EO n molecules in the MD simulation cell | Force field and water model | Temperatures (K) |
|---|---|---|---|---|
| Comparative test of the effects of alkyl and EO chain lengths and temperature | C6EO3, C6EO4, C6EO5, C6EO6, C6EO8, C6EO9, C8EO4, C8EO5, C8EO6, C8EO8, C8EO9, C10EO4, C10EO5, C10EO6, C10EO8, C10EO9, C12EO4, C12EO5, C12EO6, C12EO8, C12EO9, C14EO4, C14EO5, C14EO6, C14EO8, C14EO9 | 300 | OPLS-AA | 300 |
| TIP4P/2005 | ||||
| C8EO4, C8EO5, C8EO6, C10EO6, C10EO8 | 300 | OPLS-AA | 320, 340 | |
| TIP4P/2005 | ||||
| Preliminary test of force field | C8EO4, C8EO6 | 300 | CHARMM | 300, 320, 340 |
| TIP4P/2005 | ||||
| Preliminary test of system size | C8EO4, C8EO6, C10EO8 | 400, 500, 600 | OPLS-AA | 300 |
| TIP4P/2005 |
The AAMD simulations were executed following standard procedures. For each condition, three distinct initial configurations were prepared to acquire completely independent trajectories. Figure clearly shows the micelle formation process. The properties of each micelle were averaged over micelles within each independent MD simulation, and the averaged results were further averaged over three independent MD simulation runs. The weighted moving average with a sampling window of 2 ns was employed to smooth noisy data as a function of time.
1.

Snapshots of AAMD simulations for the formation of C8EO4 micelles at 300 K and t = 0, 20, 100, 200, 300, and 400 ns. The gray and red spheres represent carbon and oxygen atoms, respectively; water molecules and hydrogen atoms are omitted for clarity. The gray lines indicate the basic MD simulation cell.
System Setup
For the initial configuration, 300 C n EO m and water molecules were randomly placed in a cubic MD simulation cell. The cell length was approximately 17 nm and water molecules were added to obtain a concentration of 0.1 mol/L C m EO n molecules, which was above the CMC of C m EO n . The programs utilized in this step are listed in the Supporting Information.
The appropriate number of molecules in the simulations was determined after testing the system size dependence of the aggregation behavior of C8EO4, C8EO6, and C10EO8 (Table ). The results with 300 C n EO m molecules were compared with those obtained in larger systems containing 400, 500, and 600 C m EO n molecules. As shown in Figure S2, a system size of 300 C n EO m molecules was sufficiently large to describe the structure and dynamics of C m EO n aggregation.
Equilibration Calculations
The initial configuration was equilibrated using the following steps:
-
1.
Energy minimization using the steepest descent algorithm.
-
2.
Simulation using a canonical (NVT) ensemble for 100 ps, employing the leapfrog integrator with a Langevin thermostat for temperature control.
-
3.
Simulation using an isothermal–isobaric (NPT) ensemble for 100 ps, using a Berendsen barostat for pressure control at 1.01325 bar and a Langevin thermostat for temperature control. The Berendsen barostat was selected for its robust ability to equilibrate the system to the desired pressure.
Production Runs
Next, 400 ns production runs were performed in the NPT ensemble using an Andersen barostat for pressure control at 1.01325 bar and a Langevin thermostat for temperature control to observe the micelle formation process of C8EO4 and C8EO6 (Table ). The atom coordinates were sampled every 10.0 ps. Each production run was independently performed, starting from different initial configurations.
In all simulations, the calculations were performed using GROMACS (v. 2021.5) software. The hydrogen atoms were constrained by the LINCS algorithm and a time step of 2 fs was employed. Nonbonded interactions were calculated using a cutoff distance of 1.2 nm. The smooth particle-mesh Ewald method was employed to calculate long-range electrostatic interactions using a cutoff distance of 1.2 nm. Periodic boundary conditions were applied.
Definition of Aggregation
The center of mass for all C m EO n molecules in the MD simulation cell was calculated based on the heavy atom coordinates. The C m EO n molecules were considered to be aggregated when the distance between the centers of mass of two C m EO n molecules was ≤ 1 nm. C m EO n molecules linked by the 1 nm aggregation criterion are referred to as a micelle or small aggregate, with molecules in a small aggregate more randomly packed than in a micelle. The following metrics were calculated to analyze the shape, size, and surface structure of the micelles: average relative shape anisotropy, micelle radius, aggregation number, number density, and solvent-accessible surface area (SASA) per micelle.
Relative Shape Anisotropy
The average relative shape anisotropy ( ) was calculated as follows: ,
| 1 |
| 2 |
where L is the number of micelles; κ i is the relative shape anisotropy of the i-th micelle; and λ 1 i , λ 2 i , and λ 3 i are the eigenvalues of the gyration tensor of the i-th micelle ( S i ), which is expressed as follows:
| 3 |
where m and n represent x, y, and z, such that r j,m is the corresponding component of the position vector of the j-th heavy atom from the center of mass of the i-th micelle; and M i is the number of heavy atoms in the i-th micelle. The κ 2 value ranges from 0 (sphere) to 1 (rod).
Micelle Radius
The squared radius of gyration of the i-th micelle (R g i ) was calculated as follows:
| 4 |
The radius of gyration of the i-th micelle (R g i ) was utilized to calculate the radius of the i-th micelle (R i ) as follows: ,
| 5 |
This description was adopted because the calculated relative shape anisotropy was small enough to consider the micelles as spheres, as shown in Figures c and d. The micelle radius was averaged over all micelles in the system, which is expressed as follows:
| 6 |
2.

Time evolution of (a) aggregation number (N̂), (b) micelle radius (R̂), and (c) relative shape anisotropy ( ) of C8EO4 in water, averaged over three independent MD simulation runs, starting from different initial configurations. MD calculations based on the OPLS-AA and CHARMM36 force fields are compared. The light red, red, and dark red lines represent the results adopting the OPLS-AA force field at 300, 320, and 340 K, respectively. The light blue, blue, and dark blue lines represent the results of adopting the CHARMM36 force field at 300, 320, and 340 K, respectively.
3.

Time evolution of various structural properties that are relevant to micelle formation, as calculated by AAMD simulations. C8EO4, C8EO6, C12EO4, and C12EO6 are represented by blue, gray, orange, and green lines, respectively. (a) number of micelles, (b) number of monomers, (c) aggregation number (N̂), (d) relative shape anisotropy ( ), (e) micelle radius (R̂), and (f) number density of the heavy atoms (ρ̂), as calculated in AAMD simulations. Each value was calculated at the plotted time and averaged over three independent MD simulation runs.
Aggregation Number
The aggregation number (N i ) of the i-th micelle was defined by the number of constituent C m EO n molecules, with the average aggregation number (N̂(t)) defined as follows:
| 7 |
The aggregation number was averaged over three replicates, starting from different initial configurations.
Number Density
The number density (ρ) of the heavy atoms in a micelle, based on the observation that the micelles were almost spherical (Figures c and d), was calculated as follows:
| 8 |
The number density was averaged over all micelles in the system, which is expressed as follows:
| 9 |
Solvent-Accessible Surface Area
The SASA per micelle was calculated using the Shrake and Rupley algorithm and a probe sphere with a radius of 0.14 nm, which mimicked a water molecule, implemented in the mdtraj software package (v. 1.9.7) in Python. The hydrophobic and hydrophilic SASA values were calculated by summing the values of the carbon atoms present in the hydrophobic chains and those of the oxygen and carbon atoms present in the hydrophilic chains, respectively. The hydrophilic SASA to hydrophobic SASA ratio (phi/pho ratio) was also calculated. The SASA values were averaged over all micelles in three independent MD simulation runs.
Correlation Analysis
Correlations were analyzed between the calculated aggregation number and number density of the heavy atoms with the alkyl and EO chain lengths and temperature. The Pearson’s product-moment correlation coefficient (r X,Y t ) was evaluated as a function of time, according to the following equation:
| 10 |
where X refers to the alkyl chain length, for example, ; Y t refers to the aggregation number at time t; the function cov(X,Y t ) refers to the covariance between X and Y t ; and σ X and σ Y t represent the standard deviations of X and Y t , respectively. An increased X value with an increased Y value indicates a positive correlation, a decreased X value with an increased Y value indicates a negative correlation, and a value of zero indicates no correlation.
The analyses were performed in Python (v. 3.10.10). The trajectory data were analyzed using the mdtraj package (v. 1.9.7); mathematical processing was performed using the numpy (v. 1.24.3), scipy (v. 1.10.1), and pandas (v. 2.2.3) packages; and aggregation analysis was executed using the network package (v. 3.1).
Results and Discussion
Figure presents snapshots of the micelle formation process of C8EO4 as a function of time, as captured in the OPLS-AAMD simulations. The MD calculations for 400 ns for the other C m EO n molecules are presented in Figure S3. As shown in Figure , the C8EO4 molecules formed numerous small aggregates within approximately 20 ns, after which small aggregates merged to form small micelles, with their hydrophobic chains oriented inward to form a hydrophobic core and their hydrophilic chains directed outward to face the water phase. The small micelles, with aggregation numbers of approximately 10 to 20, were essentially spherical or ellipsoidal, with no rod-like or lamellar structures observed. Small micelles coalesced after 100 ns, forming larger, more stable, and more spherical micelles. This behavior was consistent across all C m EO n molecules at all examined temperatures.
Two-Stage Micelle Formation and Characteristics
Various geometrical indices, including the aggregation number, micelle radius, and relative shape anisotropy, were calculated to quantitatively investigate micellar growth, as shown in Figure a–c. Additionally, the MD calculation results adopting the OPLS-AA and CHARMM36 force fields were compared to examine the force field dependence of the simulations. Given that both force fields yielded similar results, guaranteeing their reliability for the present calculations, only the OPLS-AA calculation results are discussed herein.
Figure a presents the calculated aggregation number for C8EO4 as a function of time at three temperatures. The aggregation number increased monotonically with time within a short duration and stepwise over a longer duration. This finding indicated that small aggregates merged frequently in the short term without a free energy barrier, whereas micelles coalesced less frequently over the long-term owing to the presence of fewer micelles and, possibly, the formation of a free energy barrier when they approached one another at a certain contact distance. Notably, the aggregation rate increased almost linearly with temperature within the short term.
Figure b presents the calculated micelle radius as a function of time, which demonstrated a similar trend as the aggregation number, as shown in Figure a. The micelle radius increased approximately in proportion to t 1/3 while the aggregation number increased almost linearly with time (Figure a).
The calculated relative shape anisotropy of C8EO4 as a function of time is presented in Figure c. The initial relative shape anisotropy value of approximately 0.2 rapidly decreased to approximately 0.05 and then slowly approached zero. This finding was attributed to dispersed C8EO4 molecules first gathering quickly to form small aggregates, then rapidly merging into small incomplete micelles, and then coalescing to form more ellipsoidal or spherical micelles, as illustrated in Figure .
Figure presents the time evolution of various physical properties of the C8EO4, C8EO6, C12EO4, and C12EO6 micelles, illustrating common aggregation behaviors. The number of small aggregates or micelles decreased over time, as shown in Figure a, decreasing rapidly until t = 100 ns and slowly at t = 300–400 ns. Peaks in the number of small aggregates or micelles were observed at approximately 10 ns, which was attributed to the definition of aggregation employed in the present study, wherein isolated molecules were not counted as micelles and the number of micelles at t = 0 was almost zero. Accordingly, as shown in Figure b, the number of C8EO4, C8EO6, C12EO4, and C12EO6 monomers sharply decreased in the short term, followed by a slow decrease that approached a constant value at approximately t = 400 ns. Moreover, the average aggregation number of micelles increased almost linearly with time, as shown in Figure c, but did not reach equilibrium by t = 400 ns. These findings supported the occurrence of a two-stage aggregation process in which the randomly placed monomers rapidly aggregated within approximately 100 ns, forming numerous small aggregates with an aggregation number of approximately 12–15, followed by their coalescence to form relatively larger micelles, although at a slower rate. Hereafter, we refer to the time regions of t ≤ 100 ns and t > 100 ns as the first and second stages of aggregation, respectively.
The average relative shape anisotropy decreased sharply during the first stage (t ≤ 100 ns) and more slowly during the second stage (t > 100 ns), as shown in Figure d, reaching an almost constant value of approximately 0.05 by t = 400 ns. This finding indicated that the formed micelles were, on average, almost spherical.
The micelle radius as a function of time is presented in Figure e, revealing a steady increase in the micelle radius, reaching 1.75–1.85 nm by t = 400 ns, depending on the C m EO n molecule. The results suggested that the micelle radius would further increase over longer MD simulation runs. The results aligned with previously reported hydrodynamic radii of 2.78–2.97 and 2.24–2.32 nm for C8EO4 and C8EO6, respectively, measured by dynamic light scattering at 25 °C, and 1.31–2.25 nm for C8EO6, obtained by static light scattering at 25 °C. The comparable micellar sizes determined via the AAMD calculations and experimental values guaranteed the reliability of the MD simulations. Notably, MD simulation runs for longer than 400 ns would yield more accurate predictions given that the micelle radius and aggregation number approached but did not reach equilibrium at t = 400 ns.
The number density of the heavy atoms in the micelles increased sharply during the first stage and more slowly during the second stage, as shown in Figure f, approaching an almost constant value by t = 400 ns. Together with the relative shape anisotropy presented in Figure d, the results indicated that the micelle structure transitioned from sparsely packed and rod-like to densely packed and ellipsoidal or spherical during the aggregation process, with the latter considered to be a more stable structure than the former.
Micellar properties that are relevant to the aggregation process but experimentally inaccessible are particularly interesting and can be calculated via simulations, such as the SASA and phi/pho ratio. As shown in Figure a, the calculated hydrophobic SASA value increased sharply in the first stage and more slowly in the second stage, whereas the hydrophilic SASA value increased almost constantly over time. The phi/pho ratios and calculated hydrophilic SASA values exhibited similar trends.
4.

Time evolution of solvent-accessible surface area (SASA) of the heavy atoms in (a) alkyl chains and (b) polyoxyethylene (EO) chains, and (c) ratio of hydrophilic SASA to hydrophobic SASA (phi/pho ratio) between EO and alkyl chains, as calculated in AAMD simulations. Each value was calculated at the plotted time and averaged over three independent MD simulation runs.
These results implied that the hydrophobic chains gathered to form a hydrophobic core inside the micelle during the first stage of aggregation, which was subsequently covered by the hydrophilic chains. The coverage provided by the hydrophilic chains prevented the hydrophobic SASA value from increasing during the second stage despite increasing micellar size and hydrophilic SASA value. For C12EO4, the coverage was presumably insufficient owing to its short EO chains and large alkyl chains, leading to a minor increase in the hydrophobic SASA value that persisted in the second stage. The aggregation number was 12–15 at the end of the first stage (t = 100 ns), suggesting that this number of C m EO n molecules enabled the formation of almost spherical micelles, a popular micellar structure. The distinct behaviors of the hydrophilic and hydrophilic SASA supported the two-stage aggregation mechanism. Furthermore, the results deepen our microscopic understanding of the aggregation process, with monomer aggregation occurring during the first stage, forming small aggregates, followed by coalescence of the aggregates during the second stage, leading to the formation of larger micelles.
Characterization of Local Micellar Structure
Subsequently, the local structure of the C m EO n molecules and hydration of ether oxygen atoms by water molecules were explored.
Figure presents the time evolution of the average angle formed by the terminal carbon atom, first oxygen atom in the EO group, and terminal oxygen atom on the opposite side within the C8EO4 molecule (see Figure a). The average angle increased with increasing micellar size, indicating that the micelles spread out their whisker-like head groups over the micelle surface, forming a bulky corona. Additionally, the average angle converged quickly during the first stage of aggregation, as shown in Figure b, where the purple line begins at approximately 60 ns and seems to reach equilibrium by 100 ns. This finding indicated that the corona structure was stabilized during the first stage of aggregation.
5.

(a) Angle (θ) formed by the terminal carbon atom, first oxygen atom in the EO group, and terminal oxygen atom on the opposite side in C8EO4, and (b) time evolution of θ in micelles with 20 ≤ N̂ < 40, 40 ≤ N̂ < 60, and 40 ≤ N̂ < 60. The plots begin when micelles formed in the simulation.
Figure presents the time evolution of the calculated hydration number for four typical atoms in C8EO4. The hydration number was determined by the integral of the radial distribution function between the relevant C8EO4 atom and water molecules up to 0.35 nm. , The hydration number was higher at the beginning than later in the simulation. Presumably, the micelles were initially incomplete, facilitating the existence of more water molecules within their structures. Notably, the hydration number did not change after 100 ns and this behavior was consistent among micelles of various sizes, suggesting that the local and hydration structures of the micelles almost fully converged in the early stage of aggregation.
6.

(a) Structure of C8EO4 and time evolution of the calculated hydration number around the (b) C1, (c) O9, (d) O15, and (e) O21 atoms in micelles with 20 ≤ N̂ < 40, 40 ≤ N̂ < 60, and 40 ≤ N̂ < 60. The plots begin when micelles formed in the simulation.
Correlation Analysis
To evaluate the effects of the alkyl and EO chain lengths on the physical properties of the aggregates, correlation analyses were performed between the alkyl and EO chain lengths and the aggregation number. The correlations between alkyl chain length (m) and aggregation number (N̂) for C m EO4, C m EO5, C m EO6, C m EO8, and C m EO9 are presented in Figure a. Although N̂ and m were positively correlated at t = 10–200 ns, the correlation decreased at t > 200 ns, and C m EO4 and C m EO6 demonstrated negative correlations. This finding indicated that N̂ was marginally correlated with m. By contrast, EO chain length (n) and N̂ were negatively correlated at 100 ns, as shown in Figure b, indicating that N̂ and n were strongly and negatively correlated at t > 100 ns. Notably, these trends aligned with the experimental observations that the aggregation number increased with increasing alkyl chain length and decreased with increasing EO chain length in C m EO n (Figure S1a, b), even within the rather short simulation time during which equilibrium was not reached.
7.
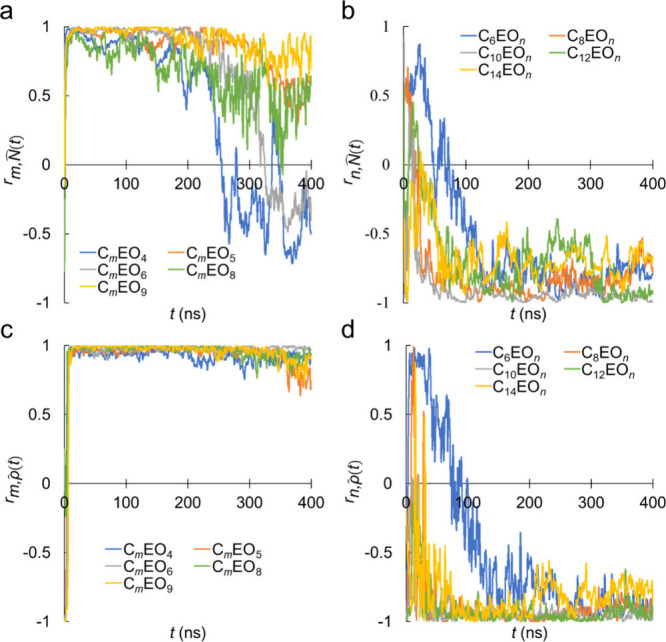
Time evolution of Pearson’s correlation coefficient (r) between the aggregation number (N̂) and (a) alkyl chain length (m = 6, 8, 10, 12, and 14) with various EO chain lengths (n = 4–9); and (b) EO chain length (n = 4, 5, 6, 8, and 9) with m = 8–14, or n = 3, 4, 5, 6, 8, and 9 with m = 6. Time evolution of Pearson’s correlation coefficient (r) between the number density of the heavy atoms (ρ̂) and (c) alkyl (m) and (d) EO (n) chain lengths. The aggregation number and number density of the heavy atoms were calculated at each time from three independent MD simulation runs.
It is interesting to remember the two-stage micelle formation process discussed earlier, wherein the first stage was based on monomer aggregation and the latter resulted from the fusion of small aggregates or micelles. The results indicated that the effect of alkyl chain length was more pronounced during the initial stage of monomer aggregation, while EO chain length played an important role during coalescence in the second stage of aggregation. This finding suggested that the self-assembly of monomers in the short term was driven by hydrophobic interactions, while the subsequent coalescence of aggregates in the longer term was ruled by interactions between the hydrophilic chains located at the aggregate surface.
The calculated Pearson’s product-moment correlation coefficients of the number density (ρ̂) with the alkyl (m) and EO (n) chain lengths are presented in Figure c, d. Although similar correlations were observed as in Figure a, b, the correlations with ρ̂ differed greatly from those with N̂. The value of the correlation coefficient between ρ̂ and m was almost 1, while that between ρ̂ and n was almost – 1.
The correlation coefficients of temperature (T) with the aggregation number (N̂) and number density of the heavy atoms (ρ̂) are presented in Figure . T and N̂ were strongly correlated, as shown in Figure a, with a correlation coefficient value of almost 1. This finding indicated that N̂ increased with increasing T, which aligned with the experimental observations presented in Figure S1a. The increase in aggregation number with increasing temperature may be attributed to enhanced hydrophobic interactions at high temperatures, as is traditionally understood. ,
8.

Time evolution of Pearson’s correlation coefficient (r) between temperature (calculated at 300, 320, and 340 K) and (a) aggregation number (N̂) and (b) number density of the heavy atoms (ρ̂). The aggregation number and number density of the heavy atoms were calculated at each time from three independent MD simulation runs.
By contrast, Figure b demonstrates that increasing T did not influence ρ̂. These results indicated that an increase in T led to an increase in N̂ without affecting ρ̂, suggesting that the underlying molecular mechanism responsible for the observed increase in aggregation number in response to temperature elevation differed from the effects of alkyl or EO chain length, which altered the aggregation number concurrently with the number density, as illustrated in Figure .
Conclusions
AAMD simulations were applied to systems containing large numbers of C m EO n molecules to investigate how temperature (300 K–340 K), alkyl chain length (m = 6–14), and EO chain length (n = 3–9) affected their aggregation characteristics. The analysis of micelle structure as a function of time, starting from randomly mixed configurations, indicated the occurrence of a two-stage process. The first stage from 0 to 100 ns involved the rapid aggregation of monomers, wherein the hydrophobic chains gathered to form a hydrophobic core inside small, incomplete micelles, with their hydrophilic chains facing the water phase, while the second stage from 100 to 400 ns involved the coalescence of aggregates, wherein their hydrophobic cores were packed more densely within larger micelles. This two-stage process determined via AAMD calculations in the present study may be difficult to assess using other methods, such as CG simulations and experiments.
Within the examined temperature range, the MD calculations aligned with experimental results at equilibrium: the aggregation number increased with increasing temperature and alkyl chain length but decreased with increasing EO chain length. The AAMD simulations captured the micelle formation process of C n EO m molecules from structural and dynamic perspectives, confirming the validity of the approach. The present study demonstrates the potential feasibility of in silico assessments of the aggregation behavior of surfactants at an atomic level, facilitating the development of micelles for pharmaceutical and cosmetic formulations.
Supplementary Material
Acknowledgments
The authors acknowledge the use of the Fugaku supercomputer provided by RIKEN through the HPCI System Research Project (Project ID: hp210203, hp220246). We acknowledge computational resources from the Research Center for Computational Science at Okazaki (Project: 24-IMS-C007, 24-IMS-C065) and generous support from MEXT (Grant Number: JPMXP1020230318).
Glossary
ABBREVIATIONS
- AA
all-atom
- AAMD
all-atom molecular dynamics
- CG
coarse-grained
- CMC
critical micelle concentration
- C m EO n
polyoxyethylene alkyl ether
- EO
polyoxyethylene
- MD
molecular dynamics
- SASA
solvent-accessible surface area
The Supporting Information is available free of charge at https://pubs.acs.org/doi/10.1021/acs.jpcb.5c00690.
Figure S1. Summary of previously reported experimental aggregation numbers. Figure S2. Time evolution of various structural properties relevant to micelle formation, as calculated in AAMD calculations. Figure S3. Snapshots of AAMD simulations at t = 400 ns for small micelles of C n EO m in water (PDF)
The manuscript was written through contributions of all authors. All authors have given approval to the final version of the manuscript.
This research was conducted with funding from Maruho Co., Ltd. under joint research agreements.
Kotaro Iwasaki and Hiromi Baba are employees of Maruho Co., Ltd.
The authors declare the following competing financial interest(s): This research was conducted with funding from Maruho Co., Ltd. under joint research agreements.
References
- Date A. A., Nagarsenker M. S.. Parenteral Microemulsions: An Overview. Int. J. Pharm. 2008;355(1–2):19–30. doi: 10.1016/j.ijpharm.2008.01.004. [DOI] [PubMed] [Google Scholar]
- Kolesnichenko I. V., Anslyn E. V.. Practical Applications of Supramolecular Chemistry. Chem. Soc. Rev. 2017;46(9):2385–2390. doi: 10.1039/C7CS00078B. [DOI] [PubMed] [Google Scholar]
- Lin D., Kelly A. L., Miao S.. Preparation, Structure-Property Relationships and Applications of Different Emulsion Gels: Bulk Emulsion Gels, Emulsion Gel Particles, and Fluid Emulsion Gels. Trends Food Sci. Technol. 2020;102:123–137. doi: 10.1016/j.tifs.2020.05.024. [DOI] [Google Scholar]
- Perumal S., Atchudan R., Lee W.. A Review of Polymeric Micelles and Their Applications. Polymers. 2022;14(12):2510. doi: 10.3390/polym14122510. [DOI] [PMC free article] [PubMed] [Google Scholar]
- Filipczak N., Pan J., Yalamarty S. S. K., Torchilin V. P.. Recent Advancements in Liposome Technology. Adv. Drug Delivery Rev. 2020;156:4–22. doi: 10.1016/j.addr.2020.06.022. [DOI] [PubMed] [Google Scholar]
- Israelachvili J. N., Mitchell D. J., Ninham B. W.. Theory of Self-Assembly of Hydrocarbon Amphiphiles into Micelles and Bilayers. J. Chem. Soc. Faraday Trans. 2. 1976;72:1525–1568. doi: 10.1039/f29767201525. [DOI] [Google Scholar]
- Griffin W. C.. Classification of Surface-Active Agents by “HLB”. J. Soc. Cosmet. Chem. 1949;1:311–326. [Google Scholar]
- Griffin W. C.. Calculation of HLB Values of Nonionic Surfactants. J. Soc. Cosmet. Chem. 1954;5:249–256. [Google Scholar]
- Bancroft W. D.. The Theory of Emulsification, V. J. Phys. Chem. 1913;17(6):501–519. doi: 10.1021/j150141a002. [DOI] [Google Scholar]
- Bancroft W. D.. The Theory of Emulsification, VI. J. Phys. Chem. 1915;19(4):275–309. doi: 10.1021/j150157a002. [DOI] [Google Scholar]
- Rosen, M. J. ; Kunjappu, J. T. . Surfactants and Interfacial Phenomena, 4th ed.; John Wiley & Sons, 2012, 10.1002/9781118228920. [DOI] [Google Scholar]
- Chondrou A. P., Evgenidis S. P., Karapantsios T. D., Kostoglou M.. Emulsions Stability in Weightlessness: Droplets Size, Droplets Coalescence and Phases Spatial Distribution. Colloids Surf. A Physicochem. Eng. Aspects. 2024;702:134943. doi: 10.1016/j.colsurfa.2024.134943. [DOI] [Google Scholar]
- Khan B. A., Akhtar N., Khan H. M. S., Waseem K., Mahmood T., Rasul A., Iqbal M., Khan H.. Basics of Pharmaceutical Emulsions: A Review. Afr. J. Pharm. Pharmacol. 2011;5(25):2715–2725. doi: 10.5897/AJPP11.698. [DOI] [Google Scholar]
- Patel V., Dharaiya N., Ray D., Aswal V. K., Bahadur P.. pH Controlled Size/Shape in CTAB Micelles with Solubilized Polar Additives: A Viscometry, Scattering and Spectral Evaluation. Colloids Surf. A Physicochem. Eng. Aspects. 2014;455:67–75. doi: 10.1016/j.colsurfa.2014.04.025. [DOI] [Google Scholar]
- Fathi H., Kelly J. P., Vasquez V. R., Graeve O. A.. Ionic Concentration Effects on Reverse Micelle Size and Stability: Implications for the Synthesis of Nanoparticles. Langmuir. 2012;28(25):9267–9274. doi: 10.1021/la300586f. [DOI] [PubMed] [Google Scholar]
- Mahajan R. K., Chawla J., Bakshi M. S., Kaur G., Aswal V. K., Goyal P. S.. Effect of Adding Glycols to the Micellar Properties of Tween: Small-Angle Neutron Scattering and Turbidity Measurements. Colloid Polym. Sci. 2004;283(2):164–168. doi: 10.1007/s00396-004-1112-5. [DOI] [Google Scholar]
- Sanders S. A., Panagiotopoulos A. Z.. Micellization Behavior of Coarse Grained Surfactant Models. J. Chem. Phys. 2010;132(11):114902. doi: 10.1063/1.3358354. [DOI] [PubMed] [Google Scholar]
- Yoshii N., Okazaki S.. A Molecular Dynamics Study of Structural Stability of Spherical SDS Micelle as a Function of Its Size. Chem. Phys. Lett. 2006;425(1–3):58–61. doi: 10.1016/j.cplett.2006.05.004. [DOI] [Google Scholar]
- Yoshii N., Okazaki S.. A Molecular Dynamics Study of Surface Structure of Spherical SDS Micelles. Chem. Phys. Lett. 2006;426(1–3):66–70. doi: 10.1016/j.cplett.2006.05.038. [DOI] [Google Scholar]
- Lebecque S., Crowet J. M., Nasir M. N., Deleu M., Lins L.. Molecular Dynamics Study of Micelles Properties According to Their Size. J. Mol. Graph. Model. 2017;72:6–15. doi: 10.1016/j.jmgm.2016.12.007. [DOI] [PubMed] [Google Scholar]
- Song X., Zhang X., Peng J., Li Y., Leng X., Liu G., Xia Q., Wei Y.. Molecular Dynamics Study on the Aggregation Behaviours of Platonic Micelle in Different NaCl Solutions. J. Mol. Liq. 2022;353:118828. doi: 10.1016/j.molliq.2022.118828. [DOI] [Google Scholar]
- Zhao H., Yang Y., Shu X., Dong L., Qiao M., Ran Q.. Micelle Conformation of Sodium Alkyl Sulfate Surfactants with Different Hydrophobic Chain Length: A Molecular Dynamics Study. Comput. Mater. Sci. 2023;229:112452. doi: 10.1016/j.commatsci.2023.112452. [DOI] [Google Scholar]
- Yoshii N., Iwahashi K., Okazaki S.. A Molecular Dynamics Study of Free Energy of Micelle Formation for Sodium Dodecyl Sulfate in Water and Its Size Distribution. J. Chem. Phys. 2006;124(18):184901. doi: 10.1063/1.2179074. [DOI] [PubMed] [Google Scholar]
- Urano R., Pantelopulos G. A., Straub J. E.. Aerosol-OT Surfactant Forms Stable Reverse Micelles in Apolar Solvent in the Absence of Water. J. Phys. Chem. B. 2019;123(11):2546–2557. doi: 10.1021/acs.jpcb.8b07847. [DOI] [PubMed] [Google Scholar]
- Kawada S., Fujimoto K., Yoshii N., Okazaki S.. Molecular Dynamics Study of the Potential of Mean Force of SDS Aggregates. J. Chem. Phys. 2017;147(8):084903. doi: 10.1063/1.4998549. [DOI] [PubMed] [Google Scholar]
- Fujimoto K., Yoshii N., Okazaki S.. Molecular Dynamics Study of Free Energy of Transfer of Alcohol and Amine from Water Phase to the Micelle by Thermodynamic Integration Method. J. Chem. Phys. 2012;137(9):094902. doi: 10.1063/1.4747491. [DOI] [PubMed] [Google Scholar]
- Kabedev A., Bergström C. A. S., Larsson P.. Molecular Dynamics Study on Micelle-Small Molecule Interactions: Developing a Strategy for an Extensive Comparison. J. Comput. Aided Mol. Des. 2024;38(1):5. doi: 10.1007/s10822-023-00541-1. [DOI] [PMC free article] [PubMed] [Google Scholar]
- Yan H., Cui P., Liu C. B., Yuan S. L.. Molecular Dynamics Simulation of Pyrene Solubilized in a Sodium Dodecyl Sulfate Micelle. Langmuir. 2012;28(11):4931–4938. doi: 10.1021/la300146s. [DOI] [PubMed] [Google Scholar]
- Takeda K., Fujimoto K., Yoshii N., Okazaki S.. Molecular dynamics study of solubilization of cyclohexane, benzene, and phenol into mixed micelles composed of sodium dodecyl sulfate and octaethylene glycol monododecyl ether. J. Comput. Chem. 2019;40(31):2722–2729. doi: 10.1002/jcc.26047. [DOI] [PubMed] [Google Scholar]
- Garde S., Yang L. U., Dordick J. S., Paulaitis M. E.. Molecular dynamics simulation of C8E5 micelle in explicit water: structure and hydrophobic solvation thermodynamics. Mol. Phys. 2002;100(14):2299–2306. doi: 10.1080/00268970110118312. [DOI] [Google Scholar]
- Kawada S., Komori M., Fujimoto K., Yoshii N., Okazaki S.. Molecular dynamics study of the formation mechanisms of ionic SDS and nonionic C12E8 micelles and n-dodecane droplets. Chem. Phys. Lett. 2016;646:36–40. doi: 10.1016/j.cplett.2015.12.062. [DOI] [Google Scholar]
- Wu Y., Ma Y., He L., Rother G., Shelton W. A., Bharti B.. Directed pore uptake and phase separation of surfactant solutions under confinement. J. Phys. Chem. C. 2019;123(15):9957–9966. doi: 10.1021/acs.jpcc.9b01522. [DOI] [Google Scholar]
- Guo W., Liu C., Li N., Xi M., Che Y., Zhang S., Wang Z.. Micelle Dynamic Reconstruction to Effectively Modulate the Transmission of Smart Windows. J. Phys. Chem. B. 2022;126(26):4872–4880. doi: 10.1021/acs.jpcb.2c01383. [DOI] [PubMed] [Google Scholar]
- Volkov N. A., Tuzov N. V., Shchekin A. K.. All-atom molecular dynamics analysis of kinetic and structural properties of ionic micellar solutions. Colloid J. 2017;79:181–189. doi: 10.1134/S1061933X17020156. [DOI] [Google Scholar]
- Khurana E., Nielsen S. O., Klein M. L.. Gemini Surfactants at the Air/Water Interface: A Fully Atomistic Molecular Dynamics Study. J. Phys. Chem. B. 2006;110(44):22136–22142. doi: 10.1021/jp063343d. [DOI] [PubMed] [Google Scholar]
- Jusufi A., Sanders S., Klein M. L., Panagiotopoulos A. Z.. Implicit-Solvent Models for Micellization: Nonionic Surfactants and Temperature-Dependent Properties. J. Phys. Chem. B. 2011;115(5):990–1001. doi: 10.1021/jp108107f. [DOI] [PubMed] [Google Scholar]
- Johnston M. A., Duff A. I., Anderson R. L., Swope W. C.. Model for the Simulation of the CnEm Nonionic Surfactant Family Derived from Recent Experimental Results. J. Phys. Chem. B. 2020;124(43):9701–9721. doi: 10.1021/acs.jpcb.0c06132. [DOI] [PubMed] [Google Scholar]
- Shinoda W., DeVane R., Klein M. L.. Coarse-Grained Molecular Modeling of Non-ionic Surfactant Self-Assembly. Soft Matter. 2008;4(12):2454–2462. doi: 10.1039/b808701f. [DOI] [Google Scholar]
- Lee M. T., Vishnyakov A. V., Neimark A. V.. Calculations of Critical Micelle Concentration by Dissipative Particle Dynamics Simulations: The Role of Chain Rigidity. J. Phys. Chem. B. 2013;117(35):10304–10310. doi: 10.1021/jp4042028. [DOI] [PubMed] [Google Scholar]
- Dhakal S., Sureshkumar R.. Topology, Length Scales, and Energetics of Surfactant Micelles. J. Chem. Phys. 2015;143(2):024905. doi: 10.1063/1.4926422. [DOI] [PubMed] [Google Scholar]
- Lavagnini E., Cook J. L., Warren P. B., Williamson M. J., Hunter C. A.. A Surface Site Interaction Point Method for Dissipative Particle Dynamics Parametrization: Application to Alkyl Ethoxylate Surfactant Self-Assembly. J. Phys. Chem. B. 2020;124(24):5047–5055. doi: 10.1021/acs.jpcb.0c01895. [DOI] [PMC free article] [PubMed] [Google Scholar]
- Marrink S. J., Risselada H. J., Yefimov S., Tieleman D. P., de Vries A. H.. The MARTINI Force Field: Coarse Grained Model for Biomolecular Simulations. J. Phys. Chem. B. 2007;111(27):7812–7824. doi: 10.1021/jp071097f. [DOI] [PubMed] [Google Scholar]
- Lee M. T., Mao R., Vishnyakov A., Neimark A. V.. Parametrization of Chain Molecules in Dissipative Particle Dynamics. J. Phys. Chem. B. 2016;120(22):4980–4991. doi: 10.1021/acs.jpcb.6b00031. [DOI] [PubMed] [Google Scholar]
- Jiao J.. Polyoxyethylated Nonionic Surfactants and Their Applications in Topical Ocular Drug Delivery. Adv. Drug Delivery Rev. 2008;60(15):1663–1673. doi: 10.1016/j.addr.2008.09.002. [DOI] [PubMed] [Google Scholar]
- Castañeda Ruiz A. J., Shetab Boushehri M. A., Phan T., Carle S., Garidel P., Buske J., Lamprecht A.. Alternative Excipients for Protein Stabilization in Protein Therapeutics: Overcoming the Limitations of Polysorbates. Pharmaceutics. 2022;14(12):2575. doi: 10.3390/pharmaceutics14122575. [DOI] [PMC free article] [PubMed] [Google Scholar]
- Masjedi M., Montahaei T.. An Illustrated Review on Nonionic Surfactant Vesicles (Niosomes) as an Approach in Modern Drug Delivery: Fabrication, Characterization, Pharmaceutical, and Cosmetic Applications. J. Drug Delivery Sci. Technol. 2021;61:102234. doi: 10.1016/j.jddst.2020.102234. [DOI] [Google Scholar]
- Swope W. C., Johnston M. A., Duff A. I., McDonagh J. L., Anderson R. L., Alva G., Tek A. T., Maschino A. P.. Challenge to Reconcile Experimental Micellar Properties of the CnEm Nonionic Surfactant Family. J. Phys. Chem. B. 2019;123(7):1696–1707. doi: 10.1021/acs.jpcb.8b11568. [DOI] [PubMed] [Google Scholar]
- Kroll P., Benke J., Enders S., Brandenbusch C., Sadowski G.. Influence of Temperature and Concentration on the Self-Assembly of Nonionic CiEj Surfactants: A Light Scattering Study. ACS Omega. 2022;7(8):7057–7065. doi: 10.1021/acsomega.1c06766. [DOI] [PMC free article] [PubMed] [Google Scholar]
- Alami E., Kamenka N., Raharimihamina A., Zana R.. Investigation on the Microstructures in Mixtures of Water with the Nonionic Surfactants C8E5, C10E6, and C10E8 in the Whole Range of Composition. J. Colloid Interface Sci. 1993;158(2):342–350. doi: 10.1006/jcis.1993.1265. [DOI] [Google Scholar]
- Zana R., Weill C.. Effect of Temperature on the Aggregation Behaviour of Nonionic Surfactants in Aqueous Solutions. J. Phyique. Lett. 1985;46(20):953–960. doi: 10.1051/jphyslet:019850046020095300. [DOI] [Google Scholar]
- Ambrosone L., Costantino L., D’errico G., Vitagliano V.. Thermodynamic and Dynamic Properties of Micellar Aggregates of Nonionic Surfactants with Short Hydrophobic Tails. J. Colloid Interface Sci. 1997;190(2):286–293. doi: 10.1006/jcis.1997.4860. [DOI] [PubMed] [Google Scholar]
- Jorgensen W. L., Maxwell D. S., Tirado-Rives J.. Development and Testing of the OPLS All-Atom Force Field on Conformational Energetics and Properties of Organic Liquids. J. Am. Chem. Soc. 1996;118(45):11225–11236. doi: 10.1021/ja9621760. [DOI] [Google Scholar]
- Abascal J. L., Vega C.. A General Purpose Model for the Condensed Phases of Water: TIP4P/2005. J. Chem. Phys. 2005;123(23):234505. doi: 10.1063/1.2121687. [DOI] [PubMed] [Google Scholar]
- Best R. B., Zhu X., Shim J., Lopes P. E. M., Mittal J., Feig M., Mackerell A. D.. Optimization of the Additive CHARMM All-Atom Protein Force Field Targeting Improved Sampling of the Backbone ϕ, ψ and Side-Chain χ1 and χ2 Dihedral Angles. J. Chem. Theory Comput. 2012;8(9):3257–3273. doi: 10.1021/ct300400x. [DOI] [PMC free article] [PubMed] [Google Scholar]
- Vega C., de Miguel E.. Surface Tension of the Most Popular Models of Water by Using the Test-Area Simulation Method. J. Chem. Phys. 2007;126(15):154707. doi: 10.1063/1.2715577. [DOI] [PubMed] [Google Scholar]
- Van Gunsteren W. F., Berendsen H. J. C.. A Leap-Frog Algorithm for Stochastic Dynamics. Mol. Simul. 1988;1(3):173–185. doi: 10.1080/08927028808080941. [DOI] [Google Scholar]
- Berendsen H. J. C., Postma J. P. M., van Gunsteren W. F., DiNola A., Haak J. R.. Molecular Dynamics with Coupling to an External Bath. J. Chem. Phys. 1984;81(8):3684–3690. doi: 10.1063/1.448118. [DOI] [Google Scholar]
- Andersen H. C.. Molecular Dynamics Simulations at Constant Pressure and/or Temperature. J. Chem. Phys. 1980;72(4):2384–2393. doi: 10.1063/1.439486. [DOI] [Google Scholar]
- Abraham M. J., Murtola T., Schulz R., Páll S., Smith J. C., Hess B., Lindahl E.. GROMACS: High Performance Molecular Simulations Through Multi-level Parallelism from Laptops to Supercomputers. SoftwareX. 2015;1–2:19–25. doi: 10.1016/j.softx.2015.06.001. [DOI] [Google Scholar]
- Hess B., Bekker H., Berendsen H. J., Fraaije J. G.. LINCS: A Linear Constraint Solver for Molecular Simulations. J. Comput. Chem. 1997;18(12):1463–1472. doi: 10.1002/(SICI)1096-987X(199709)18:12<1463::AID-JCC4>3.0.CO;2-H. [DOI] [Google Scholar]
- Essmann U., Perera L., Berkowitz M. L., Darden T., Lee H., Pedersen L. G.. A Smooth Particle Mesh Ewald Method. J. Chem. Phys. 1995;103(19):8577–8593. doi: 10.1063/1.470117. [DOI] [Google Scholar]
- Campos-Villalobos G., Siperstein F. R., Charles A., Patti A.. Solvent-Induced Morphological Transitions in Methacrylate-Based Block-Copolymer Aggregates. J. Colloid Interface Sci. 2020;572:133–140. doi: 10.1016/j.jcis.2020.03.067. [DOI] [PubMed] [Google Scholar]
- Theodorou D. N., Suter U. W.. Shape of Unperturbed Linear Polymers: Polypropylene. Macromolecules. 1985;18(6):1206–1214. doi: 10.1021/ma00148a028. [DOI] [Google Scholar]
- Bruce C. D., Berkowitz M. L., Perera L., Forbes M. D. E.. Molecular Dynamics Simulation of Sodium Dodecyl Sulfate Micelle in Water: Micellar Structural Characteristics and Counterion Distribution. J. Phys. Chem. B. 2002;106(15):3788–3793. doi: 10.1021/jp013616z. [DOI] [Google Scholar]
- Shrake A., Rupley J. A.. Environment and Exposure to Solvent of Protein Atoms. Lysozyme and Insulin. J. Mol. Biol. 1973;79(2):351–371. doi: 10.1016/0022-2836(73)90011-9. [DOI] [PubMed] [Google Scholar]
- McGibbon R. T., Beauchamp K. A., Harrigan M. P., Klein C., Swails J. M., Hernández C. X., Schwantes C. R., Wang L. P., Lane T. J., Pande V. S.. MDTraj: A Modern Open Library for the Analysis of Molecular Dynamics Trajectories. Biophys. J. 2015;109(8):1528–1532. doi: 10.1016/j.bpj.2015.08.015. [DOI] [PMC free article] [PubMed] [Google Scholar]
- Van Rossum, G. ; Drake, F. L. . Python Reference Manual; Centrum voor Wiskunde en Informatica: Amsterdam, 1995. [Google Scholar]
- Harris C. R., Millman K. J., van der Walt S. J., Gommers R., Virtanen P., Cournapeau D., Wieser E., Taylor J., Berg S., Smith N. J.. et al. Array Programming with NumPy. Nature. 2020;585(7825):357–362. doi: 10.1038/s41586-020-2649-2. [DOI] [PMC free article] [PubMed] [Google Scholar]
- Virtanen P., Gommers R., Oliphant T. E., Haberland M., Reddy T., Cournapeau D., Burovski E., Peterson P., Weckesser W., Bright J.. et al. SciPy 1.0 Contributors. SciPy 1.0: Fundamental Algorithms for Scientific Computing in Python. Nat. Methods. 2020;17(3):261–272. doi: 10.1038/s41592-019-0686-2. [DOI] [PMC free article] [PubMed] [Google Scholar]
- The pandas development team. pandas-dev/pandas: Pandas 2.2.3, 2024. DOI: 10.5281/zenodo.3509134. [DOI]
- Hagberg A. A., Schult D. A., Swart P. J.. Exploring Network, Dynamics, and Function Using NetworkX. Proc. 7th Python in Sci. Conf. (SciPy 2008) 2008:11–15. [Google Scholar]
- Gao J., Ge W., Hu G., Li J.. From Homogeneous Dispersion to Micelles-a Molecular Dynamics Simulation on the Compromise of the Hydrophilic and Hydrophobic Effects of Sodium Dodecyl Sulfate in Aqueous Solution. Langmuir. 2005;21(11):5223–5229. doi: 10.1021/la047121n. [DOI] [PubMed] [Google Scholar]
- Chun B. J., Choi J. I., Jang S. S.. Molecular Dynamics Simulation Study of Sodium Dodecyl Sulfate Micelle: Water Penetration and Sodium Dodecyl Sulfate Dissociation. Colloids Surf. A Physicochem. Eng. Asp. 2015;474:36–43. doi: 10.1016/j.colsurfa.2015.03.002. [DOI] [Google Scholar]
- Mukherjee P., Padhan S. K., Dash S., Patel S., Mishra B. K.. Clouding Behaviour in Surfactant Systems. Adv. Colloid Interface Sci. 2011;162(1–2):59–79. doi: 10.1016/j.cis.2010.12.005. [DOI] [PubMed] [Google Scholar]
- Naqvi A. Z., Kabir-Ud-Din. Clouding Phenomenon in Amphiphilic Systems: A Review of Five Decades. Colloids Surf. B Biointerfaces. 2018;165:325–344. doi: 10.1016/j.colsurfb.2018.01.060. [DOI] [PubMed] [Google Scholar]
Associated Data
This section collects any data citations, data availability statements, or supplementary materials included in this article.