

Abstract
Introduction:
Heavy metal exposure has been associated with poor sleep, but little is known about the cumulative associations of multiple metals with sleep duration, particularly among adolescents. This study examined the association of blood lead (Pb), cadmium (Cd), and mercury (Hg) concentrations with sleep duration and possible effect modification by vitamin D.
Methods:
The study sample consisted of 16–25-year-olds (n = 2637) from the 2011–2018 National Health and Nutrition Examination Survey. The association of each blood metal and serum vitamin D level with self-reported sleep duration was examined through linear regression models. Interaction terms and stratified models tested the effect modification of metal association with sleep by vitamin D level or status. Cumulative and interactive associations among the metals and serum vitamin D were also estimated using Bayesian Kernel Machine Regression (BKMR).
Results:
In linear regressions, there was little evidence of an association between individual metals, vitamin D level, and sleep duration. Both linear regressions and BMKR models showed little indication of interactions among metals and vitamin D levels. BKMR results suggested an overall joint association, with longer sleep duration at higher percentile of the metal-vitamin D mixture (75th percentile vs 50th: β=0.07 hours; 95 % CrI: 0.01, 0.13).
Conclusion:
In the context of low-level metal exposure, individual metals were unrelated to sleep duration. We found some evidence that higher levels of the mixture of blood Pb, Cd, Hg, and serum vitamin D level may be associated with slightly longer sleep duration, underscoring the importance of considering multiple environmental exposures. Additional analyses, especially in higher risk groups (e.g., higher exposures; higher prevalence or severity of vitamin D deficiency) are warranted.
Keywords: Heavy metals, Vitamin D, Sleep, Adolescents, Young adults
1. Introduction
Heavy metals, such as lead (Pb), mercury (Hg), and cadmium (Cd), occur naturally on Earth, but human activities, like mining, agriculture, and coal combustion, have disrupted their natural cycles, leading to the release of harmful amounts into the environment [1]. Exposure to heavy metals has been linked to chronic diseases [2,3], and their neurotoxic effects can contribute to cognitive dysfunction throughout the lifecourse [4]. In the United States (U.S.), roughly 50 % of the population has detectable levels of at least three heavy metals in their urine [5], presenting a major public health concern.
Due to the neurotoxic and systemic health effects these metals represent, recent studies have investigated their impact on sleep [6]. Exposure to heavy metals could also contribute to links between air pollution and shorter sleep duration [7]. Poor sleep, including reduced sleep duration and quality, is becoming increasingly prevalent among adolescents and young adults. In 2020, the overall age-adjusted prevalence of short sleep duration was 34 % in adults (defined as <7 hours) and 79 % in adolescents (defined as <8 hours) [8]. Poor sleep is linked to chronic diseases [9–11] and, neurodevelopmental disorders [12,13], highlighting the importance of understanding the drivers of poor sleep in adolescents and young adults.
Several studies investigated the relationship between exposure to heavy metals and poor sleep, mostly in occupational cohorts and populations outside of the U.S. that experience higher levels of exposure to heavy metals [14–18]. Occupational studies found associations of blood Pb levels with severe obstructive sleep apnea and poor sleep quality in Turkish adults (Pb: μ=0.09 μg/dL) [14] and Iranian factory workers (Pb: μ=10.5 μg/dL) [18], Similar results have been observed among younger age groups. Studies of children in Mexico (aged 7–8 years and 13–14 years) [15,19,20] and in China (aged 3–5 years) [16] found associations of higher blood Pb and Hg levels with worse sleep outcomes, including sleep duration, sleep latency, nighttime walking, daytime sleepiness, and use of sleeping pills [16,17,19,20]. In the general U.S. population, where children remain exposed to metals despite reductions in exposure levels over time [1,21], several studies reported associations between antimony (Sb), arsenic (As), Cd, Hg, and Pb and reduced sleep duration among adults [22–24], as well as children and adolescents [25–28]. A recent study of U.S. adults employing Mendelian Randomization suggested a causal relationship between Pb and sleep disorders [29]. Nevertheless, to date, most studies investigating the relationship between metal exposure and sleep quality have primarily focused on populations with higher levels of exposure. Given that most U.S. adolescents have relatively low-level exposure to metals, it is important to further characterize the relationship with sleep.
While the overall evidence supports a link between heavy metal exposure and sleep outcomes, most studies have only considered exposure to single heavy metals and have focused on occupational cohorts or young children [6]. Therefore, research is warranted on the effects of heavy metal exposure on adolescents and young adults, who are among the most sleep-deprived populations [8]. Further, there is a paucity of studies examining exposure to metal mixtures, which may have interactive or joint effects [30,31]. Given that various metals operate on similar mechanistic pathways, including dysregulation of neurotransmitters and increased inflammation, and can alter neurocognitive and systemic functions [6], exposure to multiple metals may have potential interactive effects [30,32,33]. Young populations are exposed to multiple metals from multiple environmental sources [34–36], thus understanding the effect of metal mixtures is an important research objective.
Finally, little is known about the role of nutritional status in the relationship between metals and sleep quality. Recent research suggests, for example, that vitamin D intake affects the absorption of toxic metals [37,38]. As an essential nutrient, vitamin D also plays a role in various areas of the brain involved in facilitating sleep regulation [39]. Vitamin D insufficiency is linked to adverse sleep outcomes [39], whereas vitamin D supplementation may improve sleep duration [40]. Given the prevalence of vitamin D deficiency (40.9 %) in the U.S. [41], studies investigating its potential role in modifying the effects of metal exposures on sleep are warranted.
The objectives of this cross-sectional study were to (1) evaluate the associations of individual metals (Pb, Cd, and Hg) and their mixture with sleep duration; (2) assess potential modification by vitamin D status; and (3) examine joint associations of the metal mixtures with vitamin D. We focus on Pb, Hg, and Cd because of their high rank on the National Priorities List of the U.S. Agency for Toxic Substances and Disease Registry (ATSDR) [42]. We hypothesized that (1) higher exposure to heavy metals among adolescents and young adults will be associated with shorter sleep duration; (2) vitamin D will modify the metal-sleep associations, such that effects of heavy metals on sleep duration will be stronger among individuals with vitamin D deficiency; and (3) the overall joint association of the metal mixture at or above 75th percentile will be significantly different from those exposed at the 50th percentile.
2. Methods
2.1. Study design
This cross-sectional study used data from the 2011–2018 cycles of the National Health and Nutrition Examination Survey (NHANES), a program of studies designed to assess the health and nutritional status of adults and children in the U.S. The procedures for collecting data and the study protocols were reviewed and approved by the National Center for Health Statistics Research Ethics Review Board [43].
2.2. Study sample selection
The study population included adolescents and young adults aged 16–25 years from 2011 to 2018 NHANES cycles, of which there were 4791 participants. We used a complete case sample and selected participants with non-missing information on the outcome, exposures, moderators, and covariates. All participants in the analytic sample had non-missing values for the following variables: sleep duration (hours); blood concentrations of Cd (μg/L), Pb (μg/dL), and Hg (μg/L); serum vitamin D (25OHD2 +25OHD3, nmol/L); race-ethnicity, sex, body mass index (BMI, kg/m2), age (years), and income-to-poverty ratio. The final analytic sample size was 2637 (Fig. 1). We conducted a sensitivity analysis, in which we restricted the sample to participants with blood metal and serum vitamin D concentrations above the limit of detection (LOD; Pb=0.25 μg/dL, Cd=0.16 μg/L; Hg=0.16 μg/L; no vitamin D concentrations were below LOD). The sensitivity analysis sample size was 1623.
Fig. 1.
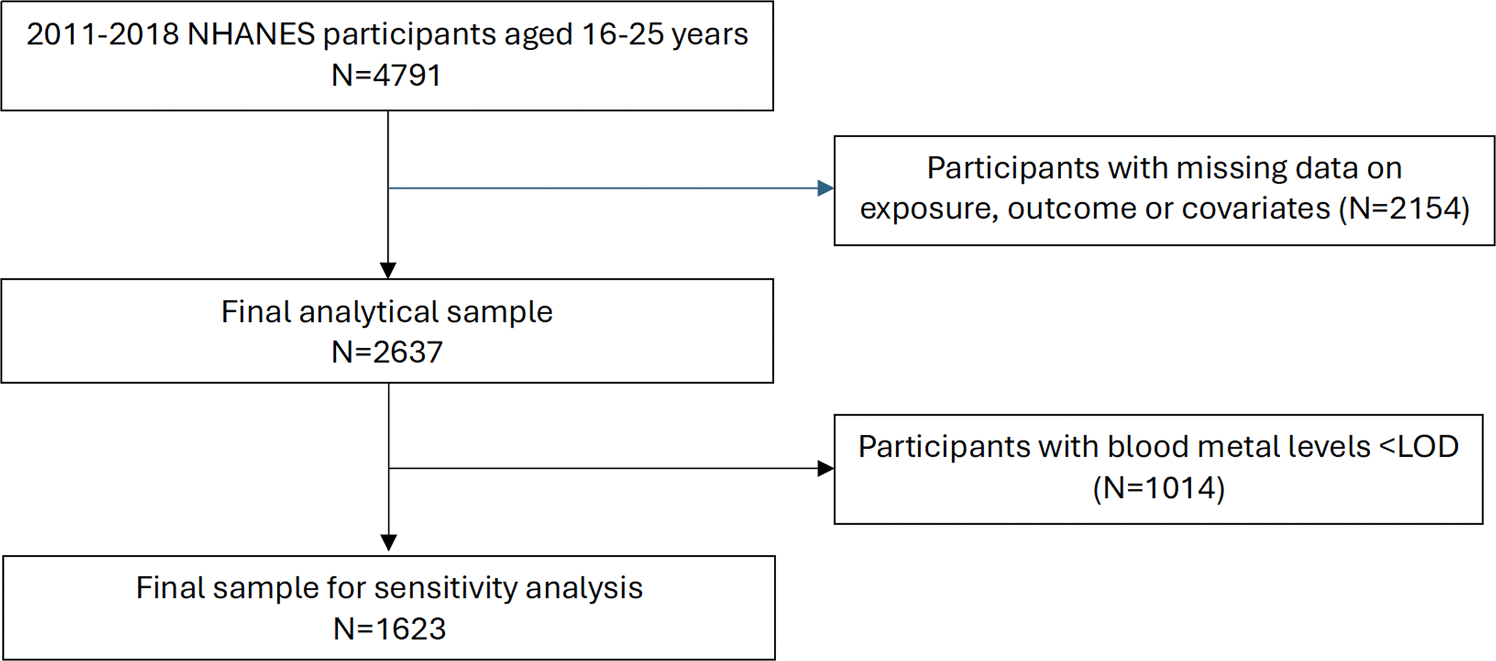
Flow chart of inclusion criteria for the final analytic study sample of NHANES participants aged 16–25 years old.
2.3. Blood sample collection
During mobile examination clinic (MEC) appointments, non-fasting blood samples were collected, processed, stored, and shipped to the National Center for Environmental Health, Centers for Disease Control and Prevention, Atlanta, GA, for analysis [43]. The blood samples were first diluted, then the liquid samples were introduced into a mass spectrometer through the inductively coupled plasma (ICP) ionization source. Further details on metal measures have been reported by NHANES and can be found online [43].
2.4. Sleep duration
The outcome was weekday sleep duration (hours). Participants self-reported their sleep duration to the following question: “How much sleep do you typically get at night on weekdays or workdays (hours)?” [44]
2.5. Serum vitamin D
Serum specimens were processed, stored, and shipped for analysis to the Division of Laboratory Sciences, National Center for Environmental Health, Centers for Disease Control and Prevention, Atlanta, GA [43,45]. Liquid chromatography-tandem mass spectrometry (HPLC-MS/MS) was used for the quantitative detection of 25-hydroxyvitamin D3 (25OHD3), 3-epi-25-hydroxyvitamin D3 (epi-25OHD3), and 25-hydroxyvitamin D2 (25OHD2) in human serum. The analytes are chromatographically separated on one of three pentafluorophenyl (PFP) columns. The combined vitamin D2 and D3 levels (25OHD2 +25OHD3) were used to indicate serum vitamin D levels, which were categorized as deficient or sufficient using clinical guidelines [46,47]. Specifically, we categorized vitamin D deficiency as a serum 25OHD2 + 25OHD3 concentration < 50 nmol/L and sufficient vitamin D status as a serum 25OHD2 + 25OHD3 concentration ≥ 50 nmol/L.
2.6. Selection of confounders
We selected potential confounders a priori based on previous literature and availability in the NHANES dataset. In regression models, we adjusted for the NHANES survey cycle (2011–2012, 2013–2014, 2015–2016, 2017–2018); sex (male, female); age (years)); race-ethnicity (Mexican American, Other Hispanic, non-Hispanic White, non-Hispanic Black, and ‘Other’ race including multi-racial); family income to poverty ratio (continuous); and BMI (kg/m2; continuous). Racial and ethnic groups may experience disparities in health outcomes due to systemic factors, historical injustices, and discrimination [48,49]. Our attempt to control for race helps us investigate whether observed associations are independent of these disparities or if they are influenced by factors related to race/ethnicity.
2.7. Statistical analysis
Blood heavy metal distributions were right-skewed; therefore, to reduce the influence of outliers, we log-transformed metal concentrations for all statistical analyses. We compared participant characteristics between the analytical sample (those with complete data) and participants excluded due to missing data. We utilized chi-square, independent t-test, and Wilcoxon rank sum tests to assess for differences.
Crude (Model 1) and covariate-adjusted associations between log-transformed blood metal levels, serum vitamin D, and sleep duration were conducted. Multivariable linear regressions (Models 2–5) adjusted for all confounders listed above and selected a priori. Model 2 tested the association between each metal separately and sleep duration. Model 3 was again run separately for each metal, and included an interaction term between the given metal concentration and continuous serum vitamin D. Model 4, was again run separately for each metal, stratifying the regressions according to vitamin D deficiency status (sufficient vs deficient). Finally, in Model 5, all metals were modeled together, along with serum vitamin D concentration. Given that Model 5 includes all metals concomitantly and thus may introduce multicollinearity, we assessed Pearson correlations between metals as well as variance inflation factor.
In sensitivity analyses, we included caffeine intake as a covariate. This variable was omitted from the primary analysis, as it was not associated with metal levels and thus did not meet criteria for being a confounder. Finally, we conducted a sensitivity analysis of the above models among participants with blood metal concentrations above LOD. We estimated beta (β) coefficients, reflecting mean differences in sleep duration (hours), with 95 % confidence intervals (CI).
Although NHANES is a nationally representative sample when survey weights are included in statistical models, Bayesian Kernel Machine Regression (BKMR, described below) does not currently support weighting. We, therefore, did not include sampling weights in multivariable linear regression models to ensure comparability across our statistical models (linear regression vs. BKMR), an approach used previously in the literature [50–52]. All the above analyses were conducted using SAS 9.4 (Cary, NC, US).
2.8. BKMR: interaction among mixture components
We employed BKMR — a statistical method designed for the analysis of multi-pollutant mixtures — to explore the relationships between the combination of the metals (Hg, Cd, and Pb) and serum vitamin D (nmol/L, modeled as a continuous variable) with sleep duration [53]. BKMR is a versatile approach that accommodates non-linear associations between chemical [51,52] or non-chemical [54–57] (i.e., nutrients and stress) exposures and outcomes by using a kernel function, which posits that individuals with similar exposures exhibit similar response patterns for the outcome, in this case sleep duration. BKMR is especially valuable for examining various types of interactions, such as pairwise interactions between metals or metals and serum vitamin D levels; higher-order interactions (i.e., the interaction between a metal and multiple components of the mixture); and cumulative effects of the exposure mixture on the outcome. In the BKMR, we also adjusted for confounding factors, following a similar approach as other regression models, where confounders are assumed to exhibit a linear relationship with the outcome. Serum vitamin D (continuous) was included in the kernel to allow for interactions of the metal mixture components with serum vitamin D. The BKMR model was formulated as follows:
where is sleep duration; the kernel function; and is a random error term.
We standardized all log-transformed blood metals and serum vitamin D using Z-scores (centered to the mean and scaled by the standard deviation) before conducting BKMR models to ensure we accounted for differences in scales across the exposure variables. Our BKMR models were fitted with 50,000 iterations, utilizing default non-informative prior specifications and the component-wise variable selection option. We estimated posterior inclusion probabilities (PIPs) to assess the relative importance of each mixture component (i.e., metal and serum vitamin D) with respect to the outcome. The initial trace plot indicated good convergence; therefore, a burn-in period was not applied.
We derived summary measures (β and 95 % credible intervals; CrI) from the BKMR models to describe the relationships between the metal-vitamin D mixture and sleep duration. Specifically, we created visualizations that included: (1) exposure-response curves for each mixture component (i.e., blood metals and serum vitamin D) in relation to sleep duration while keeping all other mixture components at their 50th percentiles; (2) exposure-response curves for mixture component (i.e., Cd) at different percentiles (25th, 50th, and 75th) of another mixture component (i.e., Pb), allowing us to visualize potential pairwise interactions; (3) associations of a mixture component (for an increase from its 25th to the 75th percentile) with sleep duration, while keeping all other mixture components at their respective 25th, 50th, and 75th percentiles; and (4) the joint association of the mixture with sleep duration, assessed by increasing percentiles of all mixture components simultaneously, compared to the 50th percentile. BKMR analyses were conducted using R version 4.2.1.
It is important to note that multivariable linear regression and BKMR can be used as complementary statistical approaches to shed light on the relationship between exposure and endpoint variables. Multivariable linear models provide interpretable effect estimates for individual exposures that align with traditional epidemiological frameworks. On the other hand, BKMR reduces the potential for bias amplification when correlated exposure variables are modeled together. In this study, evidence from linear regressions and BKMR models can be interpreted together to understand how heavy metals and vitamin D concentrations, individually and jointly, are associated with sleep duration.
3. Results
3.1. Study population
The total sample included N = 2637 participants. Table 1 presents the demographic characteristics of the analytical sample (N = 2637) and participants excluded due to missing data (N = 2154). Most participants (31.9 %) were non-Hispanic White, with an average age of 19.9 years (SD=2.95 years). Forty-four percent of participants were vitamin D deficient. A substantial portion of the sample was drawn from the 2011–2012 (36.29 %) and 2017–2018 (28.67 %) survey cycles. Participants had a mean BMI of 24.6 kg/m2 (SD=7.12 kg/m2) and a median sleep duration of 8.0 hours (IQR= 7.0, 8.5). Median concentrations (25th, 75th percentiles) for Cd, Pb, and Hg were 0.18 (0.11, 0.29), 0.52 (0.37, 0.78), and 0.46 (0.20, 0.87) μg/L, respectively. The analytical sample and excluded participants differed according to survey cycle and vitamin D deficiency. Specifically, the analytic sample was more likely to come from the 2011–2012 and 2017–2018 cycles and less likely to be vitamin D deficient than the excluded sample.
Table 1.
Comparison of demographic characteristics between the study sample and individuals excluded due to missing values, among NHANES participants aged 16–25 years old.
| Parameter | Included (N = 2637) | Excluded N (2154) | P |
|---|---|---|---|
|
| |||
| Race/Ethnicity, N (%) | <0.01 | ||
| Mexican American | 456 (17.29%) | 393 (18.25 %) | |
| Other Hispanic | 244 (9.25%) | 235 (10.91 %) | |
| Non-Hispanic White | 842 (31.93 %) | 579 (26.88 %) | |
| Non-Hispanic Black | 633 (24.00 %) | 534 (24.79 %) | |
| Other Race (includes multi-racial) | 462 (17.52 %) | 413 (19.17 %) | |
| Female, N (%) | 1330 (50.44 %) | 1085 (50.37 %) | 0.970 |
| BMI (kg/m2), median (IQR) | 24.60 (21.40, 29.80) | 24.40 (21.30, 29.80) | 0.690 |
| Age (years), mean (SD) | 19.00 (17.00, 22.00) | 19.00 (17.00, 22.00) | 0.784 |
| Income-to-Poverty ratio | 1.49 (0.77, 3.07) | 1.44 (0.74, 2.67) | 0.005 |
| Blood Cd, μg/L, median (IQR) | 0.18 (0.11, 0.29) | 0.20 (0.12, 0.31) | 0.301 |
| Blood Pb, μg/L, median (IQR) | 0.52 (0.37, 0.78) | 0.54 (0.37, 0.82) | 0.189 |
| Blood Hg, μg/L, median (IQR) | 0.46 (0.20, 0.87) | 0.55 (0.32, 1.09) | 0.001 |
| Sleep duration, h, median (IQR) | 8.00 (7.00, 8.50) | 8.00 (7.00, 8.50) | 0.640 |
| Deficient vitamin D status*, N (%) | 1165 (44.18 %) | 1271 (59.01 %) | <0.001 |
| Survey Cycle, N (%) | <0.001 | ||
| 2011–2012 | 957 (36.29 %) | 299 (13.88 %) | |
| 2013–2014 | 516 (19.57 %) | 790 (36.68 %) | |
| 2015–2016 | 408 (15.47 %) | 747 (34.68 %) | |
| 2017–2018 | 756 (28.67 %) | 318 (14.76 %) | |
Chi-square tests, t-tests, and Wilcoxon Rank tests were run to assess for significant differences between the included and excluded sample
Deficient vitamin D status defined as serum vitamin D < 50 nmol/L.
3.2. Multivariable linear regression models
Table 2 displays the results from both crude and covariate-adjusted linear regression models for log-transformed blood metals and vitamin D in relation to sleep duration. Among crude models (Model 1), we found a negative association between blood Pb and sleep duration, which became attenuated after adjustment for confounders (Model 2). We also assessed the relationship between vitamin D concentration and sleep duration but found no evidence for an association in either the crude model (Model 1) or covariate-adjusted model (Model 2). While we noted a statistical interaction between vitamin D concentration and log-transformed blood Cd (Model 3), upon stratification by vitamin D status (Model 4), 95 % CIs overlapped in both strata, thus indicating lack of effect modification by vitamin D status in the association between Cd and sleep. We found similar pattern of results for Pb in models testing interaction with vitamin D concentration and stratification by vitamin D status. Finally, entering all metals and vitamin D concentration into a single model (Model 5) did not reveal any statistical association with sleep.
Table 2.
Linear regression models testing the association between each log-transformed blood metal concentrations (μg/L) and serum vitamin D with sleep duration in NHANES participants aged 16–25 years old (N = 2637).
| Cd | Pb | Hg | Vitamin D | |
|---|---|---|---|---|
|
|
|
|
|
|
| Model | β (95 % CI) | β (95 % CI) | β (95 % CI) | β (95 % CI) |
|
| ||||
| Model 1 | − 0.06 (− 0.13, 0.02) | 0.17 (− 0.27, − 0.08)* | − 0.06 (− 0.13, 0.00) | 0.00 (0.00, 0.00) |
| Model 2 | 0.05 (− 0.03, 0.12) | 0.00 (− 0.11, 0.10) | 0.04 (− 0.02, 0.11) | 0.00 (0.00, 0.00) |
| Model 3 | ||||
| Metal coefficient | 0.29 (0.09, 0.50)* | 0.36 (0.11, 0.61)* | − 0.05 (− 0.23, 0.13) | - |
| Interaction term coefficient | − 0.00 (−0.01, − 0.00)* | − 0.01 (−0.01, − 0.00)* | 0.00 (−0.00, 0.00) | - |
| Model 4 | ||||
| Sufficient vitamin D | 0.03 (− 0.07, 0.13) | − 0.04 (− 0.17, 0.10) | 0.06 (− 0.02, 0.15) | - |
| Deficient vitamin D | 0.08 (− 0.04, 0.22) | 0.04 (− 0.12, 0.20) | 0.02 (− 0.09, 0.13) | - |
| Model 5 | 0.05 (− 0.03, 0.13) | − 0.03 (− 0.13, 0.08) | 0.04 (− 0.03, 0.12) | 0.00 (0.00, 0.00) |
Model 1. Crude model: separate regression performed for each metal and Vitamin D concentration; no covariate adjustment.
Model 2. Adjusted model: separate regression for each metal and Vitamin D concentration, adjusted for age, sex, race-ethnicity, BMI, income to poverty ratio, and survey cycle.
Model 3. Metal x vitamin D interaction model: separate metal x serum vitamin D concentration model for each metal, adjusted for age, sex, race-ethnicity, BMI, income to poverty ratio, and survey cycle.
Model 4. Stratified Model: separate regression for each metal, stratified by vitamin D status (sufficient vs deficient), adjusted for age, sex, race-ethnicity, BMI, income to poverty ratio, and survey cycle.
Model 5. Co-exposure model: Cd, Hg, Pb, and serum vitamin D concentration modeled together, adjusted for age, sex, race-ethnicity, BMI, income to poverty ratio, and survey cycle.
T-test P-value < 0.05.
In assessing potential multi-collinearity from models that co-adjusted for metals, we found weak Pearson correlations between metals (Table S1) and did not detect any significant variance inflation factors (Table S2). Results from our sensitivity analysis restricted to participants with metal concentrations above LOD were consistent with our main results (Table S3). A difference was the association between Hg and sleep duration, in which we found that log-transformed blood Hg was positively associated with sleep duration in covariate-adjusted single-metal (Model 2) and co-exposure (Model 5) models. We also found a positive association between log-transformed Hg and sleep duration among participants with vitamin D deficiency, although the overlapping 95 % CIs suggest lack of effect modification. Finally, adjustment for caffeine intake did not alter results (Table S4).
3.3. Bayesian kernel machine regression
Consistent with linear regression models, the BKMR exposure-response function for log-transformed Pb indicated a negative association with sleep (Fig. 2A). On the other hand, exposure-response functions for Cd, Hg and vitamin D concentration suggested positive relationships with sleep. There was no evidence of either higher-order (Fig. 2B) or pairwise (Fig. 2C) interactions between any of the mixture components; likewise, there was no evidence of interaction between vitamin D concentration and the metals. On the other hand, higher percentiles of the mixture (Pb, Cd, Hg, vitamin D concentration) were associated with longer sleep duration. For example, the 75th percentile of the mixture, compared to the 50th percentile, was associated with longer sleep duration (0.07 hours, 95 % CrI: 0.01, 0.13 hours; Fig. 2D). Log-transformed Hg and Cd had the highest PIPs (Hg = 0.12, Cd= 0.02, Table S5), thus potentially driving the association between higher levels of the mixture and longer sleep duration.
Fig. 2.

Associations of metal and vitamin D mixtures with sleep duration. (A) Exposure-response functions for each metal and vitamin D when all other exposures are held at their 50th percentiles. (B) Associations (beta, 95 % credible interval) of the mixture at its 25th, 50th, and 75th percentiles. All metals are Z-standardized, and models are adjusted for age, sex, race, ratio of family income to poverty, BMI, and cycle year. (C) Pairwise exposure-response relationships for each exposure variable (shown in columns) with sleep duration holding the second exposure (shown in rows) at its 25th, 50th, or 75th percentiles, while all other exposures are set to their medians. (D) Joint associations of the overall mixture with sleep duration at increasing percentiles of all metals and vitamin D, compared to the medians.
4. Discussion
In this cross-sectional analysis, we investigated the association between blood levels of heavy metals, vitamin D, and sleep duration. In the context of low-level exposure and vitamin D deficiency among 40 % of our sample, our findings from linear regression models generally show limited evidence for the association between individual metals or vitamin D level with sleep. BMKR models yielded consistent results in terms of the overall direction of the association for the individual metals and no evidence of interactions among mixture components. Results from the BMKR model, which may be more representative of a total exposure profile, showed a cumulative association of the three metals and serum vitamin D level with somewhat longer sleep. Nevertheless, the effect size was quite small (~4 minutes) when comparing the 75th to 50th percentile of the mixture. Overall, these results contrast with our initial hypotheses, and instead suggest that metal mixture exposure in adolescents and adults may be related to slightly longer sleep.
To our knowledge, this is the first study to estimate the joint effects of exposure to a mixture of metals and vitamin D on sleep duration in adolescents and young adults, whereas most previous studies have focused on individual metals [14–18]. Such cumulative associations may be informative for public health actions in reducing exposure in the general adolescent and young adult population. Given the observed relationships between some metals and serum vitamin D with longer sleep duration, these findings clarify the need for further research to confirm and explain the drivers behind these relationships. The BMKR analysis indicated that there was an overall joint association of heavy metals and vitamin D concentration on sleep duration, such that higher percentiles of the mixture were associated with somewhat longer sleep. Among the group of metals examined, total blood Hg was most strongly associated with greater sleep duration, which was contrary to our hypothesis. This could encompass factors such as fatigue and sleepiness, leading to longer nighttime sleep. While it is important to note that our study sample had relatively low levels of Hg exposure, a case report from Poland involving both adults and children exposed to Hg vapors found that the most frequent complaints were fatigue and excessive sleep duration [58]. However, more research is needed to explain these associations.
Prior literature suggests that heavy metals may influence sleep, including sleep duration. A recent narrative review on environmental factors and sleep reported that a variety of metals have been associated with poor sleep outcomes across age groups [6]. Specifically, Cd, Pb, and Hg were associated with reduced sleep duration, tiredness, sleep disturbance, obstructive sleep apnea, and poor sleep quality. These results were found in cross-sectional [9,15,16,18,20,28,59,60], case-control [14,61], and cohort [17,19] studies across multiple geographic contexts. However, a recent study in NHANES found no association between heavy metals and sleep duration or sleep disorders among adults [62].
While the literature indicates a relationship between exposure to heavy metals and sleep, less is known specifically about that relationship in adolescents, a group that is sensitive to the health effects of environmental exposures [63,64]. Recently, a study of adolescents in China found cross-sectional associations between blood Pb levels and shorter sleep duration [65], which is contrary to the null results in our multivariable models, possibly, due to a lower Pb concentration in U.S. adolescents. Even with limited studies, the existing evidence suggests an association between metal exposure and reduced sleep duration in children [9,16,17,19,28]. Notably, a cohort study by Jansen et al. in Mexico found that exposure to Pb during ages 1–4 years was associated with reduced sleep duration at age 9–17 years and sleep fragmentation for participants under 14 years old [19]. In the same cohort, childhood exposure to Hg was associated with later sleep timing during adolescence [20]. Similar findings were observed in cross-sectional studies from other study populations [9,16,17,28].
The findings from our study are inconsistent with most prior studies, and our contradictory findings may relate to several key differences. First, our study was conducted among individuals aged 16–25 years, whereas populations from previous studies were comprised of participants under 18 years, with most studies focusing on children under 11. Childhood and early adolescence are sensitive windows of development for metal exposure, and individuals aged 16–25 years may be less susceptible to metal neurotoxicity, possibly explaining why we did not observe adverse associations in this study population. Second, prior literature on metals and sleep among children focused on one metal, while we evaluated multiple heavy metals, as well as joint associations. Studying multiple metals may provide important insights for public health policies to reduce exposure. Further, the assessment of sleep duration differed, with our study using self-reported sleep duration, whereas prior studies have used parental questionnaires or wrist actigraphy.
A unique aspect of this study was the evaluation of serum vitamin D as a potential effect modifier of metal toxicity. Low vitamin D status continues to be a public health concern in the U.S. and may play a role in sleep regulation [39,66]. Further, there is evidence for nutrient insufficiency and adverse sleep outcomes [67]. In contrast to our hypothesis, we did not find evidence that vitamin D level or status (deficiency) modified the association of heavy metals with sleep duration. On the contrary, although the interaction terms of blood Cd and blood Pb with vitamin D concentration were statistically significant, stratified models showed no evidence of effect modification. Furthermore, our BKMR models revealed no evidence of pairwise interactions between the metals and vitamin D, suggesting that vitamin D status might play a limited role in moderating the relationship between metals and sleep, at least in the low-level exposure scenario represented by the general U.S. population. It is important to note that we evaluated vitamin D status using < 50 nmol/L as a clinically meaningful cut-point [47], but this may not be a biologically relevant threshold. For example, severe vitamin D deficiency, which is considered < 30 nmol/L, may have a distinct effect that would not be captured in this analysis [46,47].
Despite the growing evidence indicating an association between exposure to heavy metals and sleep-related outcomes, mechanisms by which metals could affect sleep have not been thoroughly investigated. Current hypothesized biological mechanisms include (1) neurocognitive dysfunction and (2) inflammation [6]. Following the neurocognitive dysfunction pathway, exposure to heavy metals induces oxidative stress and dysregulation of neurochemicals [68–70], which result in altered neuronal signaling and neurotransmitters (i.e., dopamine and serotonin) [70], and ultimately poor sleep [71]. Another potential mechanism is systemic inflammation. Exposure to metals has been associated with increased inflammatory markers [72], and inflammatory markers (i.e., TNF-α, C-reactive protein) in turn have been associated with short sleep duration and obstructive sleep apnea [14,28,73]. However, two of these studies were cross-sectional, thus temporality could not be established [28,39,73,74]. There are also other pathways by which heavy metals could be associated with sleep. For example, there is interest in the relationship between heavy metals and depressive symptoms [75,76], through which longer sleep represents a coping mechanism for depressive symptoms and could show positive associations with heavy metals [77].
4.1. Strengths and limitations
We conducted a study using NHANES data, which has many strengths. First, NHANES contains data on a geographically, socioeconomically, and demographically diverse sample. Given the known social and structural determinants of exposure to heavy metals, as well as the racial and socioeconomic disparities in heavy metal exposure [78], using a diverse sample such as the NHANES is important for informing public health decision-making. Another strength of this NHANES-based analysis is the sample size. The current study included over 2600 participants; this large sample size provides higher power and would likely not be feasible to recruit in a de-novo study.
Limitations of this study should be weighed when interpreting the results. First, NHANES is a cross-sectional survey, thus preventing any discernment of temporality. Further, using cross-sectional data imposes assumptions on our hypothesis. First, that the blood levels of heavy metals, which were measured at one point in time, are representative of average or typical exposure. A single measure, however, could present a potential source of exposure misclassification, given that dietary intake can affect the concentration of heavy metals [79]. A second assumption is that the reported weekday hours of sleep are representative of the person’s typical sleep duration. Particularly given that sleep duration is self-reported, there may be issues of poor recall. While a validation study conducted over 7 consecutive days found sleep duration measured by self-report was significantly correlated with the gold-standard (measured by accelerometers), correlation values were small (ρ = 0.07–0.12) [44]. Specifically, the authors found that self-report over-estimated sleep duration, which could have also occurred in our study. This misclassification would likely result in associations biased toward the null. There is also potential for misclassification with respect to long-term sleep patterns, particularly among adolescents and young adults, where school schedules, work schedules, or social life may result in day-to-day variability in nighttime sleep.
In assessing the appropriateness of a complete-case analysis, we found that excluded individuals differed from the analytical sample in terms of the prevalence of vitamin D deficiency. However, mean sleep duration and median blood metal levels did not differ by inclusion status; thus, selection bias may not have distorted our findings. Another limitation is an incomplete covariate adjustment. Additional factors known to affect sleep among adolescents include school start time, use of technology, and curricular and extracurricular activities [80]. While we could not adjust for these factors due to the lack of data in NHANES, we do not expect these factors to be associated with heavy metal exposure. Physical activity may also play an important role in influencing sleep patterns [81]. The omission of these variables from our models could contribute to residual confounding, potentially affecting the observed associations. Future studies should consider these factors to better address their impact. Our study in the NHANES can be considered as a starting point for the inquiries on chemical mixtures, nutritional status, and sleep among adolescents. The variables we were unable to include here should be considered in any future studies.
4.2. Conclusion
We found some evidence that a mixture of heavy metals Cd, Pb, and Hg, together with higher vitamin D levels, was associated with a slightly higher sleep duration among individuals aged 16–25 years. BKMR models indicated that this joint association was primarily driven by Hg and Cd, indicating a potential cumulative effect of these metals on sleep. We could not clearly establish the role of vitamin D in these relationships, but it appears that deficient levels do not moderate the relationship between metals and sleep. Our findings are preliminary and motivate further research to consider multiple environmental exposures on the sleep health of young people.
Supplementary Material
Appendix A. Supporting information
Supplementary data associated with this article can be found in the online version at doi:10.1016/j.jtemb.2025.127606.
Acknowledgements
We extend our sincere thanks to all those who have contributed to the NHANES, including the anonymous participants who have made this study possible
Funding
D. Rodríguez was supported by the NIGMS Grant T32-Initiative for Maximizing Student Development (T32 GM 144920) and the NIEHS Grant F31-Ruth L. Kirschstein Predoctoral Individual National Research Award (F31 ES 035630).
Footnotes
Declaration of Competing Interest
The authors declare that they have no known competing financial interests or personal relationships that could have appeared to influence the work reported in this paper.
CRediT authorship contribution statement
Rodríguez Danelly: Writing – review & editing, Writing – original draft, Methodology, Formal analysis. Lima Sarah M: Writing – review & editing, Writing – original draft, Formal analysis. Li Chan: Writing – review & editing, Writing – original draft, Formal analysis. Schildroth Samantha: Writing – review & editing, Methodology. Xu Muwu: Writing – original draft. Kordas Katarzyna: Writing – review & editing, Supervision, Conceptualization.
References
- [1].Tchounwou PB, Yedjou CG, Patlolla AK, Sutton DJ, Heavy metal toxicity and the environment, Exp. Suppl. 101 (2012) 133–164, 10.1007/978-3-7643-8340-4_6. [DOI] [PMC free article] [PubMed] [Google Scholar]
- [2].Yang A-M, Lo K, Zheng T-Z, et al. , Environmental heavy metals and cardiovascular diseases: status and future direction, Chronic Dis. Transl. Med. 6 (04) (2020) 251–259. [DOI] [PMC free article] [PubMed] [Google Scholar]
- [3].Satarug S, Editorial to Special Issue Toxic Metals, Chronic Diseases and Related Cancers, MDPI, 2022, p. 125. [DOI] [PMC free article] [PubMed] [Google Scholar]
- [4].Karri V, Schuhmacher M, Kumar V, Heavy metals (Pb, Cd, As and MeHg) as risk factors for cognitive dysfunction: a general review of metal mixture mechanism in brain, Environ. Toxicol. Pharmacol. 48 (2016) 203–213. [DOI] [PubMed] [Google Scholar]
- [5].Shim YK, Lewin MD, Ruiz P, Eichner JE, Mumtaz MM, Prevalence and associated demographic characteristics of exposure to multiple metals and their species in human populations: the United States NHANES, 2007–2012, J. Toxicol. Environ. Health A 80 (9) (2017) 502–512, 10.1080/15287394.2017.1330581. [DOI] [PMC free article] [PubMed] [Google Scholar]
- [6].Liu JH, Ghastine L, Um P, Rovit E, Wu TN, Environmental exposures and sleep outcomes: a review of evidence, potential mechanisms, and implications, Environ. Res. 196110406 (2021), 10.1016/j.envres.2020.110406. [DOI] [PMC free article] [PubMed] [Google Scholar]
- [7].Zhong C, Longcore T, Benbow J, et al. , Environmental influences on sleep in the California Teachers Study Cohort, Am. J. Epidemiol. 191 (9) (2022) 1532–1539, 10.1093/aje/kwab246. [DOI] [PMC free article] [PubMed] [Google Scholar]
- [8].Centers for Disease Control and Prevention: Sleep and Sleep Disorders. 〈https://www.cdc.gov/sleep/data-and-statistics/Adults.html〉.
- [9].Jansen EC, Burgess HJ, Chervin RD, et al. , Sleep duration and timing are prospectively linked with insulin resistance during late adolescence, Obesity 31 (4) (2023) 912–922, 10.1002/oby.23680. [DOI] [PMC free article] [PubMed] [Google Scholar]
- [10].Ravichandran R, Gupta L, Singh M, Nag A, Thomas J, Panjiyar BK, The interplay between sleep disorders and cardiovascular diseases: a systematic review, Cureus 15 (9) (2023) e45898, 10.7759/cureus.45898. [DOI] [PMC free article] [PubMed] [Google Scholar]
- [11].Tan LH, Chen PS, Chiang HY, et al. , Insomnia and poor sleep in CKD: a systematic review and meta-analysis, Kidney Med. 4 (5) (2022) 100458, 10.1016/j.xkme.2022.100458. [DOI] [PMC free article] [PubMed] [Google Scholar]
- [12].Arias-Mera C, Paillama-Raimán D, Lucero-González N, Leiva-Bianchi M, Avello-Sáez D, Relation between sleep disorders and attention deficit disorder with hyperactivity in children and adolescents: a systematic review, Res Dev. Disabil. 137 (2023) 104500, 10.1016/j.ridd.2023.104500. [DOI] [PubMed] [Google Scholar]
- [13].Liang X, Haegele JA, Healy S, et al. , Age-related differences in accelerometer-assessed physical activity and sleep parameters among children and adolescents with and without autism spectrum disorder: a meta-analysis, JAMA Netw. Open 6 (10) (2023) e2336129, 10.1001/jamanetworkopen.2023.36129. [DOI] [PMC free article] [PubMed] [Google Scholar]
- [14].Asker S, Asker M, Yeltekin AC, Aslan M, Demir H, Serum levels of trace minerals and heavy metals in severe obstructive sleep apnea patients: correlates and clinical implications, Sleep. Breath. 19 (2) (2015) 547–552, 10.1007/s11325-014-1045-2. [DOI] [PubMed] [Google Scholar]
- [15].Doering S, Bose-O’Reilly S, Berger U, Essential indicators identifying chronic inorganic mercury intoxication: pooled analysis across multiple cross-sectional studies, PLoS One 11 (8) (2016) e0160323, 10.1371/journal.pone.0160323. [DOI] [PMC free article] [PubMed] [Google Scholar]
- [16].Kordas K, Casavantes KM, Mendoza C, et al. , The association between lead and micronutrient status, and children’s sleep, classroom behavior, and activity, Arch. Environ. Occup. Health 62 (2) (2007) 105–112, 10.3200/aeoh.62.2.105-112. [DOI] [PubMed] [Google Scholar]
- [17].Liu J, Liu X, Pak V, et al. , Early blood lead levels and sleep disturbance in preadolescence, Sleep 38 (12) (2015) 1869–1874, 10.5665/sleep.5230. [DOI] [PMC free article] [PubMed] [Google Scholar]
- [18].Mohammadyan M, Moosazadeh M, Borji A, Khanjani N, Rahimi Moghadam S, Exposure to lead and its effect on sleep quality and digestive problems in soldering workers, Environ. Monit. Assess. 191 (3) (2019) 184, 10.1007/s10661-019-7298-2. [DOI] [PubMed] [Google Scholar]
- [19].Jansen EC, Dunietz GL, Dababneh A, et al. , Cumulative childhood lead levels in relation to sleep during adolescence, J. Clin. Sleep. Med 15 (10) (2019) 1443–1449, 10.5664/jcsm.7972. [DOI] [PMC free article] [PubMed] [Google Scholar]
- [20].Jansen EC, Hector EC, Goodrich JM, et al. , Mercury exposure in relation to sleep duration, timing, and fragmentation among adolescents in Mexico City, Environ. Res. 191 (2020) 110216, 10.1016/j.envres.2020.110216. [DOI] [PMC free article] [PubMed] [Google Scholar]
- [21].Zheng K, Zeng Z, Tian Q, Huang J, Zhong Q, Huo X, Epidemiological evidence for the effect of environmental heavy metal exposure on the immune system in children, Sci. Total Environ. (2023) 161691. [DOI] [PubMed] [Google Scholar]
- [22].Scinicariello F, Buser MC, Feroe AG, Attanasio R, Antimony and sleep-related disorders: NHANES 2005–2008, Environ. Res. 156 (2017) 247–252, 10.1016/j.envres.2017.03.036. [DOI] [PMC free article] [PubMed] [Google Scholar]
- [23].Shiue I, Urinary arsenic, pesticides, heavy metals, phthalates, polyaromatic hydrocarbons, and polyfluoroalkyl compounds are associated with sleep troubles in adults: USA NHANES, 2005–2006, Environ. Sci. Pollut. Res. 24 (3) (2017) 3108–3116, 10.1007/s11356-016-8054-6. [DOI] [PMC free article] [PubMed] [Google Scholar]
- [24].Mao Q, Zhu X, Kong Y, Sleep duration mediates the association between heavy metals and the prevalence of depression: an integrated approach from the NHANES (2005–2020), Front Psychiatry 15 (2024) 1455896, 10.3389/fpsyt.2024.1455896. [DOI] [PMC free article] [PubMed] [Google Scholar]
- [25].Kruger DJ, Kodjebacheva GD, Cupal S, Poor tap water quality experiences and poor sleep quality during the Flint, Michigan Municipal Water Crisis, Sleep. Health 3 (4) (2017) 241–243. [DOI] [PubMed] [Google Scholar]
- [26].Sears CG, Zierold KM, Health of children living near coal ash, Glob. Pediatr. Health 4 (2017) 2333794X17720330. [DOI] [PMC free article] [PubMed] [Google Scholar]
- [27].Joo H, Choi JH, Burm E, et al. , Gender difference in the effects of lead exposure at different time windows on neurobehavioral development in 5-year-old children, Sci. Total Environ. 615 (2018) 1086–1092. [DOI] [PubMed] [Google Scholar]
- [28].Gump BB, Gabrikova E, Bendinskas K, et al. , Low-level mercury in children: associations with sleep duration and cytokines TNF-α and IL-6, Environ. Res. 134 (2014) 228–232, 10.1016/j.envres.2014.07.026. [DOI] [PMC free article] [PubMed] [Google Scholar]
- [29].Chen S, Zhang M, Zhang W, et al. , The causal association between blood lead and sleep disorders: evidence from national health and nutrition examination survey and mendelian randomization analysis, J. Epidemiol. Glob. Health (2024), 10.1007/s44197-024-00199-4. [DOI] [PMC free article] [PubMed] [Google Scholar]
- [30].Su H, Li Z, Fiati Kenston SS, et al. , Joint toxicity of different heavy metal mixtures after a short-term oral repeated-administration in rats, Int. J. Environ. Res. Public Health 14 (10) (2017), 10.3390/ijerph14101164. [DOI] [PMC free article] [PubMed] [Google Scholar]
- [31].Nguyen HD, Interactions between heavy metals and sleep duration among pre- and postmenopausal women: a current approach to molecular mechanisms involved, Environ. Pollut. 316 (2023) 120607, 10.1016/j.envpol.2022.120607. [DOI] [PubMed] [Google Scholar]
- [32].Pandya CD, Pillai PP, Gupta SS, Lead and cadmium co-exposure mediated toxic insults on hepatic steroid metabolism and antioxidant system of adult male rats, Biol. Trace Elem. Res. 134 (3) (2010) 307–317, 10.1007/s12011-009-8479-6. [DOI] [PubMed] [Google Scholar]
- [33].Goyer RA, Toxic and essential metal interactions, Annu Rev. Nutr. 17 (1997) 37–50, 10.1146/annurev.nutr.17.1.37. [DOI] [PubMed] [Google Scholar]
- [34].Abadin H, Ashizawa A, Stevens YW, et al. , Agency for Toxic Substances and Disease Registry (ATSDR) toxicological profiles. Toxicological Profile for Lead, Agency for Toxic Substances and Disease Registry (US), 2007. [PubMed] [Google Scholar]
- [35].Benedict RT, Alman B, Klotzbach JM, et al. Toxicological Profile for Mercury: Draft for Public Comment: April 2022. 2022; [Google Scholar]
- [36].Faroon O, Ashizawa A, Wright S, et al. , Agency for Toxic Substances and Disease Registry (ATSDR) toxicological profiles. Toxicological Profile for Cadmium, Agency for Toxic Substances and Disease Registry (US), 2012. [PubMed] [Google Scholar]
- [37].Schwalfenberg GK, Genuis SJ, Vitamin D, Essential minerals, and toxic elements: exploring interactions between nutrients and toxicants in clinical medicine, ScientificWorldJournal 2015 (2015) 318595, 10.1155/2015/318595. [DOI] [PMC free article] [PubMed] [Google Scholar]
- [38].Moon J, The role of vitamin D in toxic metal absorption: a review, J. Am. Coll. Nutr. 13 (6) (1994) 559–564, 10.1080/07315724.1994.10718447. [DOI] [PubMed] [Google Scholar]
- [39].Romano F, Muscogiuri G, Di Benedetto E, et al. , Vitamin D and sleep regulation: is there a role for vitamin D? Curr. Pharm. Des. 26 (21) (2020) 2492–2496, 10.2174/1381612826666200310145935. [DOI] [PubMed] [Google Scholar]
- [40].Aboud M, Vitamin D supplementation and sleep: a systematic review and meta-analysis of intervention studies, Nutrients 14 (2022) 1076, 10.3390/nu14051076. [DOI] [PMC free article] [PubMed] [Google Scholar]
- [41].Cui A, Xiao P, Ma Y, et al. , Prevalence, trend, and predictor analyses of vitamin D deficiency in the US population, 2001–2018, Front Nutr. 9 (2022) 965376, 10.3389/fnut.2022.965376. [DOI] [PMC free article] [PubMed] [Google Scholar]
- [42].Agency for Toxic Substances and Disease Registry Substance Priority List. Available at: 〈https://www.atsdr.cdc.gov/spl/index.html〉.
- [43].NHANES Questionnaires, Datasets, and Related Documentation. CDC/National Center for Health Statistics. Available at: 〈https://wwwn.cdc.gov/nchs/nhanes/Default.aspx〉. [Google Scholar]
- [44].Lee PH, Validation of the National Health And Nutritional Survey (NHANES) single-item self-reported sleep duration against wrist-worn accelerometer, Sleep. Breath. 26 (4) (2022) 2069–2075, 10.1007/s11325-021-02542-6. [DOI] [PMC free article] [PubMed] [Google Scholar]
- [45].Survey NHaNE. 2017–2018 Data Documentation, Codebook, and Frequencies. 〈https://wwwn.cdc.gov/Nchs/Nhanes/2017-2018/VID_J.htm〉.
- [46].Holick MF, Binkley NC, Bischoff-Ferrari HA, et al. , Evaluation, treatment, and prevention of vitamin D deficiency: an Endocrine Society clinical practice guideline, J. Clin. Endocrinol. Metab. 96 (7) (2011) 1911–1930, 10.1210/jc.2011-0385. [DOI] [PubMed] [Google Scholar]
- [47].Amrein K, Scherkl M, Hoffmann M, et al. , Vitamin D deficiency 2.0: an update on the current status worldwide, Eur. J. Clin. Nutr. 74 (11) (2020) 1498–1513, 10.1038/s41430-020-0558-y. [DOI] [PMC free article] [PubMed] [Google Scholar]
- [48].Sanders-Phillips K, Settles-Reaves B, Walker D, Brownlow J, Social inequality and racial discrimination: risk factors for health disparities in children of color, Pediatrics 124 (ement_3) (2009) S176–S186, 10.1542/peds.2009-1100E. [DOI] [PubMed] [Google Scholar]
- [49].Williams DR, Mohammed SA, Discrimination and racial disparities in health: evidence and needed research, J. Behav. Med. 32 (1) (2009) 20–47, 10.1007/s10865-008-9185-0. [DOI] [PMC free article] [PubMed] [Google Scholar]
- [50].Solon G, National Bureau of Economic Research, in: Haider SJ, Wooldridge J (Eds.), What Are We Weighting For?, National Bureau of Economic Research, 2013, 1 online resource. [Google Scholar]
- [51].Gibson EA, Nunez Y, Abuawad A, et al. , An overview of methods to address distinct research questions on environmental mixtures: an application to persistent organic pollutants and leukocyte telomere length, Environ. Health 18 (1) (Aug 28 2019) 76, 10.1186/s12940-019-0515-1. [DOI] [PMC free article] [PubMed] [Google Scholar]
- [52].Schildroth S, Friedman A, Bauer JA, Claus Henn B, Associations of a metal mixture with iron status in U.S. adolescents: evidence from the National Health and Nutrition Examination Survey, N. Dir. Child Adolesc. Dev. 2022 (181–182) (Mar 2022) 67–89, 10.1002/cad.20457. [DOI] [PMC free article] [PubMed] [Google Scholar]
- [53].Bobb JF, Claus Henn B, Valeri L, Coull BA, Statistical software for analyzing the health effects of multiple concurrent exposures via Bayesian kernel machine regression, Environ. Health 17 (1) (2018) 67, 10.1186/s12940-018-0413-y. [DOI] [PMC free article] [PubMed] [Google Scholar]
- [54].Eick SM, Enright EA, Padula AM, et al. , Prenatal PFAS and psychosocial stress exposures in relation to fetal growth in two pregnancy cohorts: applying environmental mixture methods to chemical and non-chemical stressors, Environ. Int 163 (May 2022) 107238, 10.1016/j.envint.2022.107238. [DOI] [PMC free article] [PubMed] [Google Scholar]
- [55].Schildroth S, Friedman A, White RF, et al. , Associations of an industry-relevant metal mixture with verbal learning and memory in Italian adolescents: the modifying role of iron status, Environ. Res 224 (2023) 115457, 10.1016/j.envres.2023.115457. [DOI] [PMC free article] [PubMed] [Google Scholar]
- [56].Schildroth S, Kordas K, White RF, et al. , An industry-relevant metal mixture, iron status, and reported attention-related behaviors in italian adolescents, Environ. Health Perspect. 132 (2) (2024) 027008, 10.1289/EHP12988. [DOI] [PMC free article] [PubMed] [Google Scholar]
- [57].Thilakaratne R, Lin P-ID, Rifas-Shiman SL, et al. , Mixtures of metals and micronutrients in early pregnancy and cognition in early and mid-childhood: findings from the project viva cohort, Environ. Health Perspect. 131 (8) (2023) 087008, 10.1289/EHP12016. [DOI] [PMC free article] [PubMed] [Google Scholar]
- [58].Kasznia-Kocot J, Dąbkowska B, Muszyńska-Graca M, Zlotkowska R, Brewczyński PZ, Diagnostic and environmental procedures in accidental mercury vapor intoxication–experiences from an outpatient clinic, Pol. J. Environ. Stud. 19 (3) (2010). [Google Scholar]
- [59].Deng MG, Liu F, Liang YH, et al. , Associations of serum zinc, copper, and selenium with sleep disorders in the American adults: data from NHANES 2011–2016, J. Affect. Disord. 323 (2023), 10.1016/j.jad.2022.11.088. [DOI] [PubMed] [Google Scholar]
- [60].Nguyen HD, Interactions between heavy metals and sleep duration among pre- and postmenopausal women: a current approach to molecular mechanisms involved, Environ. Pollut. 316120607 (2023), 10.1016/j.envpol.2022.120607. [DOI] [PubMed] [Google Scholar]
- [61].Chuang H-C, Su T-Y, Chuang K-J, et al. , Pulmonary exposure to metal fume particulate matter cause sleep disturbances in shipyard welders, Environ. Pollut. 232 (2018) 523–532, 10.1016/j.envpol.2017.09.082. [DOI] [PubMed] [Google Scholar]
- [62].Zhu Z, Wang Y, Wang Y, et al. , The association of mixed multi-metal exposure with sleep duration and self-reported sleep disorder: A subgroup analysis from the National Health and Nutrition Examination Survey (NHANES), Environ. Pollut. 361 (2024) 124798, 10.1016/j.envpol.2024.124798. [DOI] [PubMed] [Google Scholar]
- [63].Suk WA, Ahanchian H, Asante KA, et al. , Environmental pollution: an under-recognized threat to children’s health, especially in low- and middle-income countries, Environ. Health Perspect. 124 (3) (2016) A41–5, 10.1289/ehp.1510517. [DOI] [PMC free article] [PubMed] [Google Scholar]
- [64].Dutil C, Walsh JJ, Featherstone RB, et al. , Influence of sleep on developing brain functions and structures in children and adolescents: a systematic review, Sleep. Med. Rev. 42 (2018) 184–201, 10.1016/j.smrv.2018.08.003. [DOI] [PubMed] [Google Scholar]
- [65].Dai Y, Halabicky OM, Ji X, Liu J, Childhood lead exposure and sleep problems in adolescents: a longitudinal cohort study, Int. Arch. Occup. Environ. Health 97 (9) (2024) 959–970, 10.1007/s00420-024-02099-3. [DOI] [PMC free article] [PubMed] [Google Scholar]
- [66].Abboud M, Vitamin D supplementation and sleep: a systematic review and meta-analysis of intervention studies, Nutrients 14 (5) (2022), 10.3390/nu14051076. [DOI] [PMC free article] [PubMed] [Google Scholar]
- [67].Tanno S, Ikeda A, Maruyama K, Saito I, Tomooka K, Tanigawa T, Association between iron intake and excessive daytime sleepiness in the community-dwelling Japanese: the Toon Health Study, Sleep. Breath. 29 (1) (2024) 50, 10.1007/s11325-024-03214-x. [DOI] [PubMed] [Google Scholar]
- [68].Lidsky TI, Schneider JS, Lead neurotoxicity in children: basic mechanisms and clinical correlates, Brain 126 (1) (2003) 5–19, 10.1093/brain/awg014. [DOI] [PubMed] [Google Scholar]
- [69].Liu J, Lewis G, Environmental toxicity and poor cognitive outcomes in children and adults, J. Environ. Health 76 (6) (Jan-Feb 2014) 130–138. [PMC free article] [PubMed] [Google Scholar]
- [70].Balali-Mood M, Naseri K, Tahergorabi Z, Khazdair MR, Sadeghi M, Toxic mechanisms of five heavy metals: mercury, lead, chromium, cadmium, and arsenic. Review, Front. Pharmacol. 12 (2021), 10.3389/fphar.2021.643972, 2021-April-13. [DOI] [PMC free article] [PubMed] [Google Scholar]
- [71].Lechin F, Pardey-Maldonado B, van der Dijs B, et al. , Circulating neurotransmitters during the different wake-sleep stages in normal subjects, Psychoneuroendocrinology 29 (5) (2004) 669–685, 10.1016/s0306-4530(03)00095-7. [DOI] [PubMed] [Google Scholar]
- [72].Anka AU, Usman AB, Kaoje AN, et al. , Potential mechanisms of some selected heavy metals in the induction of inflammation and autoimmunity, Eur. J. Inflamm. 20 (2022) 1721727X221122719, . [DOI] [Google Scholar]
- [73].Firat Guven S, Turkkani MH, Ciftci B, Ulukavak Ciftci T, Erdogan Y, The relationship between high-sensitivity C-reactive protein levels and the severity of obstructive sleep apnea, Sleep. Breath. 16 (1) (2012) 217–221, 10.1007/s11325-011-0492-2. [DOI] [PubMed] [Google Scholar]
- [74].Moon J, The role of vitamin D in toxic metal absorption: a review, J. Am. Coll. Nutr. 13 (6) (1994) 559–564, 10.1080/07315724.1994.10718447. [DOI] [PubMed] [Google Scholar]
- [75].Jacobson MH, Ghassabian A, Gore AC, Trasande L, Exposure to environmental chemicals and perinatal psychopathology, Biochem. Pharmacol. 195 (2022) 114835, 10.1016/j.bcp.2021.114835. [DOI] [PMC free article] [PubMed] [Google Scholar]
- [76].Nguyen HD, Oh H, Hoang NHM, Jo WH, Kim MS, Environmental science and pollution research role of heavy metal concentrations and vitamin intake from food in depression: a national cross-sectional study (2009–2017), Environ. Sci. Pollut. Res. Int. 29 (3) (2022) 4574–4586, 10.1007/s11356-021-15986-w. [DOI] [PMC free article] [PubMed] [Google Scholar]
- [77].Kozusznik MW, Puig-Perez S, Kozusznik B, Pulopulos MM, The relationship between coping strategies and sleep problems: the role of depressive symptoms, Ann. Behav. Med. 55 (3) (2021) 253–265, 10.1093/abm/kaaa048. [DOI] [PMC free article] [PubMed] [Google Scholar]
- [78].Geron M, Cowell W, Amarasiriwardena C, et al. , Racial/ethnic and neighborhood disparities in metals exposure during pregnancy in the Northeastern United States, Sci. Total Environ. 820 (2022) 153249, 10.1016/j.scitotenv.2022.153249. [DOI] [PMC free article] [PubMed] [Google Scholar]
- [79].Liu T, Liang X, Lei C, et al. , High-fat diet affects heavy metal accumulation and toxicity to mice liver and kidney probably via gut microbiota, Front. Microbiol. 11 (2020) 1604, 10.3389/fmicb.2020.01604. [DOI] [PMC free article] [PubMed] [Google Scholar]
- [80].Tarokh L, Saletin JM, Carskadon MA, Sleep in adolescence: physiology, cognition and mental health, Neurosci. Biobehav. Rev. 70 (2016) 182–188, 10.1016/j.neubiorev.2016.08.008. [DOI] [PMC free article] [PubMed] [Google Scholar]
- [81].You Y, Chen Y, Zhang Y, Zhang Q, Yu Y, Cao Q, Mitigation role of physical exercise participation in the relationship between blood cadmium and sleep disturbance: a cross-sectional study, BMC Public Health 23 (1) (2023) 1465, 10.1186/s12889-023-16358-4. [DOI] [PMC free article] [PubMed] [Google Scholar]
Associated Data
This section collects any data citations, data availability statements, or supplementary materials included in this article.