Abstract
This study investigated the prognostic impact of migrasome-related long noncoding RNAs (lncRNAs) in lung adenocarcinoma (LUAD). We analyzed transcriptomic data from The Cancer Genome Atlas (TCGA) database, comprising 541 tumor samples and 59 normal tissue samples, to pinpoint key migrasome genes and related lncRNAs, using correlation analysis to detect those pertinent to patient outcomes. A risk score model based on 17 migrasome-related lncRNAs, constructed via univariate, LASSO, and multivariate Cox regression, was then validated in an independent dataset to ensure reliability. Our findings revealed that high-risk patients exhibited worse overall and progression-free survival, alongside altered immune features, such as potential immune evasion and an increased propensity for immunotherapy responsiveness. Moreover, Tumor Immune Dysfunction and Exclusion (TIDE) analyses suggested that individuals with higher scores could experience greater benefit from immune checkpoint inhibitors. Functional enrichment analysis supported the engagement of migrasome-related pathways and immune-regulatory processes that may drive disease progression. Additionally, principal component analysis (PCA) confirmed the robustness of our lncRNA-driven classifier, enabling accurate differentiation of risk cohorts. Overall, our study underscores the contribution of migrasome-related lncRNAs in predicting LUAD prognosis and informing clinical choices, shedding light on tumor biology and immunotherapy response. These results emphasize the clinical importance of migrasome-related lncRNAs as promising therapeutic targets and prognostic biomarkers in LUAD management.
Supplementary Information
The online version contains supplementary material available at 10.1007/s12672-025-03000-5.
Keywords: LncRNAs, LUAD, Migrasomes, Prognosis, Immunotherapy
Introduction
Lung adenocarcinoma (LUAD) is the most common subtype of lung cancer worldwide; however, its five-year survival rate remains low. According to the latest global cancer statistics from GLOBOCAN 2022, lung cancer continues to be the leading cause of cancer-related deaths worldwide, with an estimated 2.48 million new cases and 1.82 million deaths in 2022 [1]. This represents approximately 12.4% of all new cancer cases and 18.7% of all cancer deaths globally [1]. The age-standardized incidence rate (ASIR) of lung cancer globally is 32.1 per 100,000 inhabitants, with an age-standardized mortality rate (ASMR) of 16.8 per 100,000 [1].
In China specifically, lung cancer represents the highest number of new cancer cases among all cancer types, with recent comparative analysis indicating significant cancer burden [2]. According to the latest estimates for 2024, China is projected to have approximately 3.25 million new cancer cases and 1.70 million cancer deaths, with lung cancer being the leading cancer type [2]. Recent systematic analysis of respiratory tract cancers in China from 1990 to 2021 revealed that new cases surged from 274,752 to 934,704, marking an increase of 240.20%, with deaths similarly increasing from 278,235 to 814,121 [3]. Projections indicate that if current incidence and mortality rates remain stable, the global burden of lung cancer is expected to increase to 4.62 million new cases and 3.55 million deaths by 2050 [1].
Approximately 85% of lung cancer patients are diagnosed with non-small cell lung cancer (NSCLC), among which LUAD is the most common subtype, accounting for about 40% of all lung cancer cases [4]. LUAD typically arises from precursor lesions, such as atypical adenomatous hyperplasia, and progresses through stages of adenocarcinoma in situ and minimally invasive adenocarcinoma, eventually developing into invasive adenocarcinoma [4–7].
Despite significant advancements in multimodal treatment strategies, including targeted therapy, immunotherapy, radiotherapy, and minimally invasive surgery, over the past few decades, the overall five-year survival rate for LUAD patients still stands at only 18% [6, 8, 9]. This underscores the urgent need for novel prognostic biomarkers and therapeutic targets to improve patient outcomes [10]. Migrasomes are newly identified organelles closely associated with cell migration. These organelles exhibit a pomegranate seed-like morphology, measuring about 3 μm in diameter and containing smaller vesicles ranging from 50 to 100 nm [11, 12]. The formation of migrasomes is governed by multiple factors, including cytoskeletal remodeling, membrane domain assembly, and protein-lipid interactions [11–14]. Migrasomes are abundant in lipids, proteins, and RNA—primarily phosphatidylcholine, sphingomyelin, and cholesterol—while their RNA content includes miRNA, circRNA, and lncRNA [11–15].
Migrasomes can transport multiple signaling molecules, such as chemokines, growth factors, and morphogens, which are essential for cell fate and developmental processes [16]. In addition, migrasomes transport diverse cellular contents, including damaged mitochondria and cytokines, thereby regulating cell metabolism and function [11, 17–19]. In cancer, migrasomes facilitate communication between tumor cells and the microenvironment, enabling tumor cells to evade immune surveillance and enhancing their invasive and metastatic potential [18, 20]. Migrasomes promote cancer progression by reshaping the tumor microenvironment (TME) through the delivery of specific signaling molecules [21].
Long noncoding RNAs (lncRNAs) are RNA molecules longer than 200 nucleotides that lack protein-coding capacity [22]. Although research on the interaction between migrasomes and lncRNAs remains limited, evidence suggests that migrasomes can transport diverse RNAs, including miRNA, circRNA, and lncRNA [15]. LncRNAs play pivotal roles in cellular regulation, development, and disease progression, including gene expression control, involvement in chromatin remodeling, and modulation of the cell cycle and apoptosis [18, 23]. The integration of migrasome biology with lncRNA research represents a novel approach that may provide unique insights into LUAD progression and treatment response. The potential of migrasome-related lncRNAs as biomarkers for cancer prognosis and immunotherapy response remains largely unexplored, presenting an opportunity for significant clinical advancement. Therefore, this study aims to explore the functions and mechanisms of migrasome-related lncRNAs in LUAD through comprehensive bioinformatics approaches using data from The Cancer Genome Atlas (TCGA) and other public databases, with the goal of identifying potential prognostic biomarkers and therapeutic targets for LUAD patients.
Materials and methods
Process summary and data collection
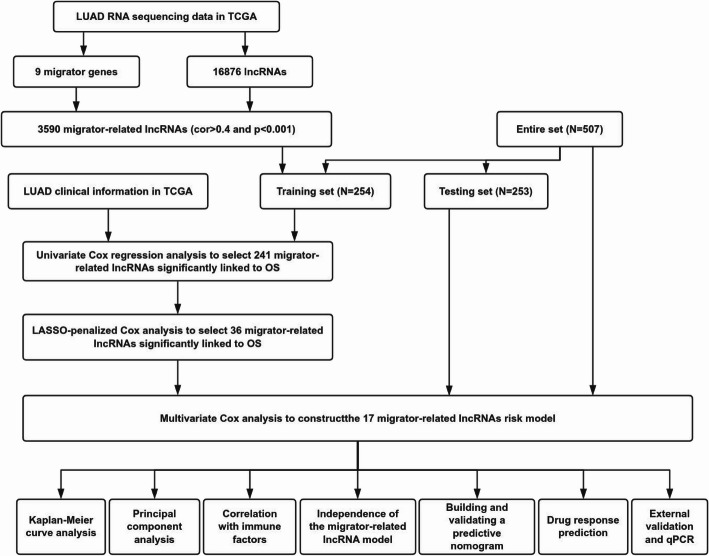
Figure 1 shows the workflow of this study. We identified nine migrasome-related genes based on previous research and the GeneCards database (https://www.genecards.org/): ITGB1, ITGA5, EOGT, CPQ, PIGK, NDST1, EPCIP, PKD2, and PKD1 [23–25]. On September 15, 2024, we extracted RNA-sequencing data, somatic mutation data, copy number variation data, and clinical features of LUAD patients from the publicly available TCGA database (https://portal.gdc.cancer.gov/) [26, 27], encompassing 541 tumor samples and 59 normal tissue samples. Data processing was performed using Strawberry-Perl-5.30.0, from which we obtained expression matrices and corresponding clinical information.This approach is consistent with established methodologies used in similar cancer genomics studies [28–30].
Fig. 1.
Flowchart of the present study
Identification of migrasome-related LncRNAs
We obtained LncRNA data from the TCGA database following the annotation guidelines described by Iyer et al. [31]. We then used Pearson correlation analysis to investigate the relationships between migrasome-related genes and lncRNAs. Considering the critical role of correlation coefficients in quantifying variable relationships and guided by previous research, we selected lncRNAs meeting |Pearson R| > 0.4 and p < 0.001 as migrasome-related. This threshold was chosen based on similar studies in cancer research that have demonstrated meaningful biological associations at this correlation level [32, 33]. Additionally, we used the ‘limma’, ‘dplyr’, ‘ggalluvial’, and ‘ggplot2’ R packages to build a Sankey diagram, visually depicting the interactions between migrasome-related genes and lncRNAs.
Development and validation of the risk score model
We retrieved LUAD-related datasets from the TCGA database. Using the ‘caret’ package in R, we randomly divided the dataset into training and internal test sets at a 1:1 ratio, ensuring group balance via chi-square tests. Table 1 shows the clinical characteristics of these two groups. The training set was used to establish migrasome-related lncRNA features, whereas the test set and the entire dataset were used to validate these features.We performed univariate Cox regression analysis on the training set to identify lncRNAs significantly linked to prognosis (p < 0.05). In addition, we carried out Least Absolute Shrinkage and Selection Operator (LASSO) regression with the ‘glmnet’ package in R to screen lncRNAs associated with LUAD prognosis, choosing lambda.min as the optimal threshold. Finally, the lncRNAs identified via LASSO regression were included in a multivariate Cox regression analysis, using a stepwise approach to construct the optimal prognostic risk model. The individual risk score for each LUAD patient was calculated using the following formula:
Table 1.
Clinicopathological characteristics of LUAD patients in training set and testing set
| Covariates | Type | Total | Test | Train | P-value |
|---|---|---|---|---|---|
| Age | <=65 | 239(47.14%) | 127(50.2%) | 112(44.09%) | 0.2596 |
| > 65 | 258(50.89%) | 123(48.62%) | 135(53.15%) | ||
| unknow | 10(1.97%) | 3(1.19%) | 7(2.76%) | ||
| Gender | FEMALE | 272(53.65%) | 129(50.99%) | 143(56.3%) | 0.267 |
| MALE | 235(46.35%) | 124(49.01%) | 111(43.7%) | ||
| Stage | Stage I | 272(53.65%) | 136(53.75%) | 136(53.54%) | 0.8159 |
| Stage II | 120(23.67%) | 59(23.32%) | 61(24.02%) | ||
| Stage III | 81(15.98%) | 38(15.02%) | 43(16.93%) | ||
| Stage IV | 26(5.13%) | 15(5.93%) | 11(4.33%) | ||
| unknow | 8(1.58%) | 5(1.98%) | 3(1.18%) | ||
| T | T1 | 169(33.33%) | 85(33.6%) | 84(33.07%) | 0.4412 |
| T2 | 271(53.45%) | 130(51.38%) | 141(55.51%) | ||
| T3 | 45(8.88%) | 27(10.67%) | 18(7.09%) | ||
| T4 | 19(3.75%) | 8(3.16%) | 11(4.33%) | ||
| unknow | 3(0.59%) | 3(1.19%) | 0(0%) | ||
| M | M0 | 338(66.67%) | 165(65.22%) | 173(68.11%) | 0.627 |
| M1 | 25(4.93%) | 14(5.53%) | 11(4.33%) | ||
| unknow | 144(28.4%) | 74(29.25%) | 70(27.56%) | ||
| N | N0 | 327(64.5%) | 161(63.64%) | 166(65.35%) | 0.4587 |
| N1 | 95(18.74%) | 50(19.76%) | 45(17.72%) | ||
| N2 | 71(14%) | 33(13.04%) | 38(14.96%) | ||
| N3 | 2(0.39%) | 0(0%) | 2(0.79%) | ||
| unknow | 12(2.37%) | 9(3.56%) | 3(1.18%) |
 |
Additionally, we performed risk plot analysis using the ‘pheatmap’ package in R to predict progression-free survival (PFS) and to validate the diagnostic value of the risk model. We performed univariate and multivariate Cox regression analyses to determine whether the constructed risk model acted as an independent prognostic factor for LUAD patients, accounting for clinical characteristics such as age, sex, grade, and stage. Using the ‘survival’, ‘survminer’, ‘rms’, ‘caret’, ‘glmnet’, and ‘timeROC’ packages in R, we generated receiver operating characteristic (ROC) curves, calculated the area under the curve (AUC), and applied the concordance index (C-index) to assess predictive accuracy. To predict 1-year, 3-year, and 5-year survival rates in LUAD patients, we constructed a predictive nomogram and used calibration curves to evaluate the agreement between predicted values and actual outcomes.
Principal component analysis (PCA) and functional enrichment analysis
PCA, a common dimensionality reduction and data analysis method, was used in this study to assess the grouping efficiency of all genes, migrasome-related genes, migrasome-related lncRNAs, and identified risk-associated lncRNAs. For genes differentially expressed between low- and high-risk groups, we performed Gene Ontology (GO) and Kyoto Encyclopedia of Genes and Genomes (KEGG) analyses using the ‘clusterProfiler’ package in R. Significantly enriched biological processes and pathways were defined as those with both the false discovery rate (FDR) and p-value < 0.05. Additionally, we carried out Gene Set Enrichment Analysis (GSEA) to reveal significantly different functional phenotypes between the two risk groups.
Immune cell infiltration and immune scoring analysis
We employed the CIBERSORT algorithm to assess the correlation between the established model and immune infiltration status by estimating the proportion of immune cell subpopulations in each TCGA-LUAD sample. In addition, we applied the ESTIMATE method to compute stromal and immune scores, thereby evaluating tumor purity and cell-type proportions within the TME.
Tumor mutational burden (TMB) and tumor immune dysfunction and exclusion (TIDE)
We extracted somatic mutation data from the TCGA database using Perl and analyzed them with the ‘maftools’ package in R. We compared TMB and survival outcomes across different risk groups. Furthermore, we accessed the online TIDE platform (http://tide.dfci.harvard.edu/login/) to predict potential responses to immune checkpoint blockade (ICB) therapy. The TIDE analysis was performed using default parameters with a significance threshold of p < 0.05, and the prediction was based on gene expression profiles from pre-treatment tumor samples as described by Jiang et al. [34]. We then used the ‘ggpubr’ package in R to compare TIDE scores among various subgroups.
Drug sensitivity estimation
We used the ‘oncoPredict’ package in R to estimate the IC50 values of potential LUAD treatment drugs for both risk groups. This analysis drew upon two databases—Genomics of Drug Sensitivity in Cancer (GDSC) and the Cancer Therapeutics Response Portal (CTRP)—which were integrated into the ‘oncoPredict’ package to support drug sensitivity assessment [35, 36].
Cell culture and qPCR
In this study, the human normal bronchial epithelial cell line BEAS-2B (CL-0496, Procell, Wuhan, China) was used. The human non-small cell lung cancer cell lines A549 (CL-0016, Procell, Wuhan, China) and H1299 (CL-0016, CL-0165, CL-0496, Wuhan Procell Life Science & Technology Co., Ltd., Wuhan, China) were also employed. H1299 cells were cultured in RPMI-1640 medium (Procell, Wuhan, China) supplemented with 10% fetal bovine serum (FBS) and 1% penicillin-streptomycin (Solarbio, China). A549 and BEAS-2B cells were cultured in high-glucose DMEM medium (Procell, Wuhan, China) containing 10% FBS and 1% penicillin-streptomycin. All cells were maintained at 37 °C in a humidified incubator with 5% CO₂. Total RNA was extracted from H1299, A549, and BEAS-2B cells using Trizol reagent (R401-01, Vazyme, Nanjing, China). The extracted RNA was reverse-transcribed into cDNA using a reverse transcription kit (R323-01, Vazyme, Nanjing, China). The reaction was performed at 37 °C for 15 min and terminated at 85 °C for 5 s. Quantitative PCR (qPCR) was conducted using a SYBR Green Real-Time PCR kit (Q711-02, Vazyme, Nanjing, China) on a Gentier96R Real-Time PCR System (NANBEI Co., Ltd., Zhengzhou, China). The amplification protocol consisted of an initial denaturation at 95 °C for 30 s. This was followed by 40 cycles of 95 °C for 5 s and 60 °C for 30 s. The primer sequences were as follows: hPAN3-AS1 forward primer (5′-CTGATGTTTGCGCTAATACCCT-3′) and reverse primer (5′-TCTGCCGTTTGTGAACCTCTT-3′);hGAPDH forward primer (5′-CATTCGAACGTCTGCCCTAT-3′) and hGAPDH reverse primer (5′-GATGTGGTAGCCGTTTCTCA-3′). Relative gene expression levels were calculated using the 2^−ΔΔCT method and normalized to the internal control gene hGAPDH. Each sample was analyzed in three independent experiments to ensure data accuracy.
Statistical analysis
All statistical analyses were performed using R software (version 4.2.1). The Wilcoxon test was used for paired sample comparisons, and Kaplan-Meier (KM) survival analysis with log-rank tests was conducted to assess overall survival (OS) across different samples. A two-tailed p-value < 0.05 was considered statistically significant.
Results
Identification of migrasome-related LncRNAs
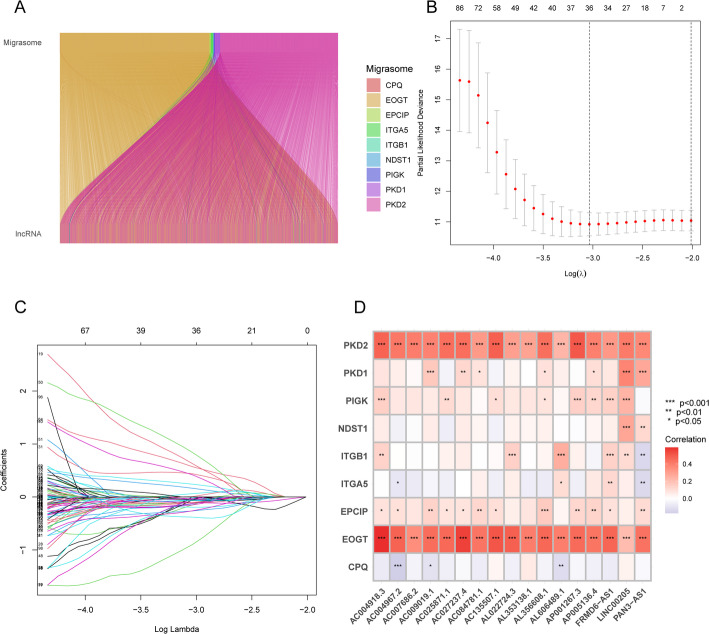
Overall, we identified 3,590 migrasome-related lncRNAs in LUAD by applying a Pearson correlation threshold of |R| > 0.4 and p < 0.001. Figure 2A and Supplementary Table S1 present the associations between the nine migrasome genes and their respective lncRNAs.
Fig. 2.
Identification of metastasis-related lncRNAs and development of prognostic models in LUAD. A Sankey diagram illustrating associations between metastasis genes and metastasis-related lncRNAs. B Ten-fold cross-validation for selecting the tuning parameter lambda in the LASSO Cox regression model. C LASSO coefficient profiles of 241 metastasis-related lncRNAs. D Heatmap showing correlations between metastasis genes and 9 metastasis-related lncRNAs
Establishment of prognosis-related migrasome-related LncRNA signatures
By conducting univariate Cox regression analysis, we identified 241 differentially expressed migrasome-related lncRNAs associated with prognosis (Supplementary Table S2). We then employed LASSO analysis in the training set to pinpoint lncRNAs with the highest prognostic value (Fig. 2B and C). Ultimately, 36 lncRNAs were selected, and 17 of these were integrated into a multivariate Cox proportional hazards model. The risk score was calculated as follows: Risk score = AC004967.2 × (− 0.482446620259242) + AL022724.3 × (− 1.61505561066709) + AC135507.1 × (− 0.842324502806729) + AC027237.4 × (1.61787943088991) + AL356608.1 × (− 2.48615135723603) + AC004918.3 × (− 0.477188637485125) + AC007686.2 × (− 1.8309796164912) + AL353138.1 × (− 0.31315074508011) + AC084781.1 × (1.98283967059868) + AL606489.1 × (0.511505878998398) + AC025871.1 × (− 1.59773646824115) + AP005136.4 × (2.3658659236992) + AC009019.1 × (− 1.41689033062941) + PAN3-AS1 × (− 0.775469575769909) + LINC00205 × (0.533934501231128) + AP001267.3 × (− 0.745828760501742) + FRMD6-AS1 × (1.11562109823617). To further examine the relationships between these 17 lncRNAs and the nine migrasome genes, a correlation heatmap was generated using TCGA data (Fig. 2D).
Validation of prognosis-related migrasome-related LncRNA signatures
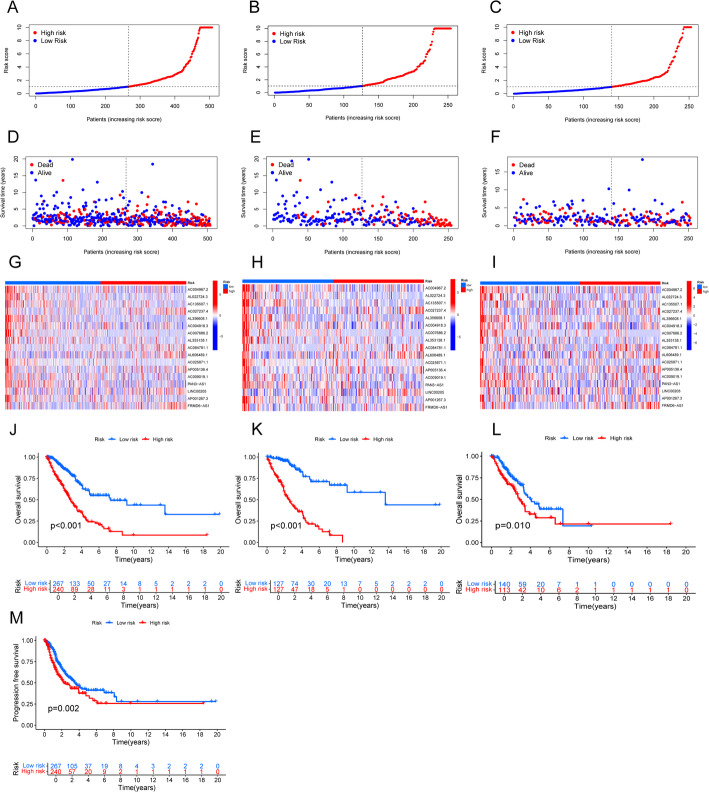
We evaluated the predictive efficacy of the established signatures through risk plots and KM survival analysis. In addition, we comprehensively examined survival outcomes, expression levels, and risk scores for the 17 migrasome-related lncRNAs in both low-risk and high-risk groups (Figs. 3A-I). The results showed that, in the complete dataset, training set, and test set, high-risk patients had significantly shorter OS than their low-risk counterparts (all p < 0.05) (Fig. 3J and L). Furthermore, in the complete dataset, the PFS of the high-risk group was significantly shorter than that of the low-risk group (p = 0.002) (Fig. 3M).
Fig. 3.
Prognostic evaluation of the risk model in the entire, training, and test sets. A–C Risk score distributions for patients in low-risk and high-risk groups. D–F Survival status and time in low-risk versus high-risk groups. G–I Hierarchical clustering analysis of 9 Metastasis-related lncRNAs between low-risk and high-risk groups. J–L Kaplan-Meier overall survival curves comparing low-risk and high-risk groups. M Kaplan-Meier progression-free survival curves comparing low-risk and high-risk groups in the entire set
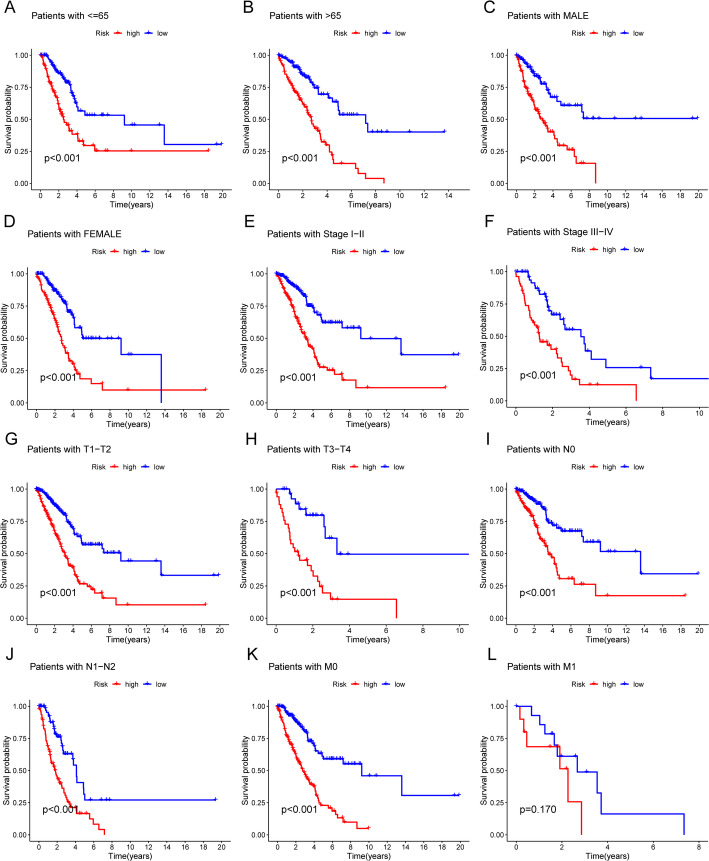
We also stratified the samples by gender, age, and tumor stage (including T, N, and M stages) to generate KM survival curves (Fig. 4A and L). Except for stage M1, the high-risk subgroup exhibited significantly lower OS than the low-risk subgroup. Although a similar trend was observed in stage M1, it did not reach statistical significance (p = 0.170), possibly due to the small sample size. These findings imply that migrasome-related lncRNA signatures can potentially predict LUAD patient prognosis under different clinicopathological conditions.
Fig. 4.
Kaplan–Meier survival curves comparing low-risk and high-risk populations stratified by clinical variables. A, B Survival curves for patients aged ≤ 65 years (A) and > 65 years (B). C, D Survival curves for male (C) and female (D) patients. E, F Survival curves for clinical stages I-II (E) and III-IV (F). G, H Survival curves for T stages T1-2 (G) and T3-4 (H). I, J Survival curves for N stages N0 (I) and N1 (J). K, L Survival curves for M stages M0 (K) and M1 (L)
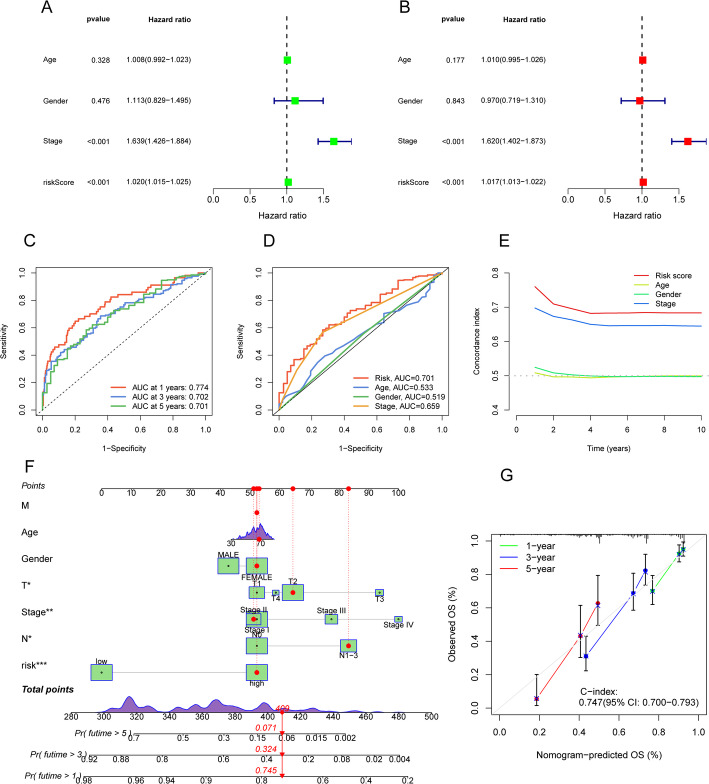
We then performed univariate and multivariate Cox regression analyses to determine if the established lncRNA signatures offer prognostic value independent of clinical stage, gender, age, and TNM stage (Fig. 5A and B). The findings confirmed that these signatures function as independent prognostic predictors. Furthermore, ROC analysis demonstrated the model’s predictive accuracy, with AUCs of 0.774, 0.702, and 0.701 for 1-year, 3-year, and 5-year survival, respectively (Fig. 5C). Risk scores exhibited superior predictive power for long-term survival relative to other clinical factors, as shown by ROC curve comparisons (Fig. 5D). In addition, the C-index for risk signatures and other clinical variables suggested that these signatures can serve as reliable indicators in clinical settings (Fig. 5E). To facilitate individualized prognostic prediction, we constructed a nomogram based on the risk scores (Fig. 5F). Calibration curves indicated a strong concordance between predicted survival outcomes and actual observations (Fig. 5G).
Fig. 5.
Independent prognostic analysis and further validation of the risk model. Forest plots of A univariate and B multivariate Cox regression analyses showing the effects of clinical characteristics (including the risk signature) on OS. C Time-dependent ROC curves for OS at 1, 3, and 5 years. D Predictive accuracy of the risk model compared to clinicopathological characteristics. E Concordance index of the risk model and other clinical information. F Nomogram combining the risk signature and clinical factors. G Calibration curves for the nomogram-predicted OS at 1, 3, and 5 years
PCA and biological pathway analysis
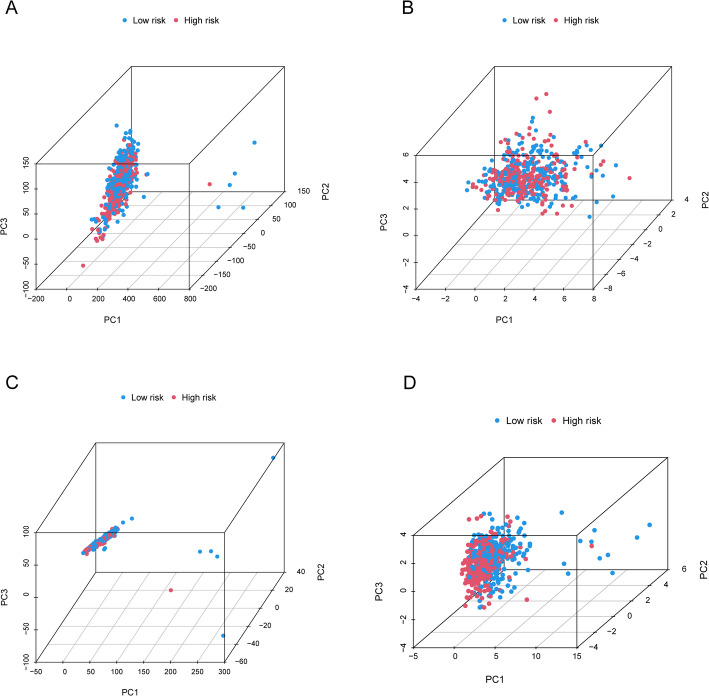
PCA confirmed that the established signatures could distinguish between low-risk and high-risk groups based on the 17 identified migrasome-related lncRNAs. Figure 6A and D show how low-risk and high-risk samples are distributed according to all genes, migrasome genes, migrasome-related lncRNAs, and identified risk lncRNAs. The results demonstrated that the risk model successfully separated high-risk from low-risk patients.
Fig. 6.
Principal Component Analysis(PCA) distinguishing low-risk and high-risk groups. (A) PCA based on all genes. (B) PCA based on metastasis genes. (C) PCA based on metastasis-related lncRNAs. (D) PCA based on the 9 risk-associated lncRNAs
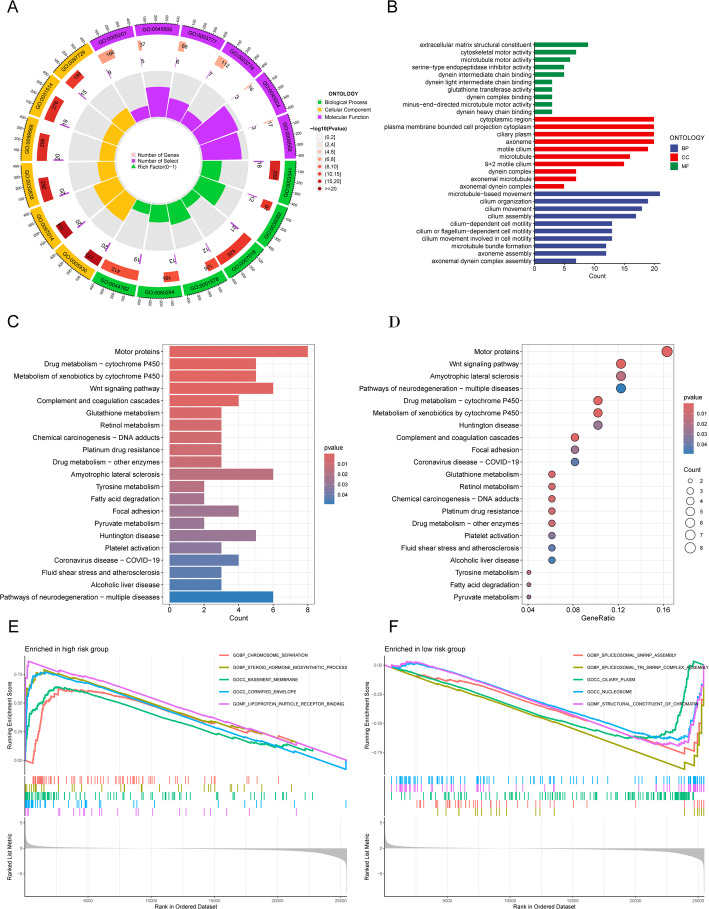
To further investigate the biological processes governed by these 17 migrasome-related lncRNA signatures, we performed a series of enrichment analyses. GO analysis indicated that the differentially expressed genes were primarily involved in cell movement, cilia and flagella structure and function, microtubule dynamics, and cytoskeletal reorganization—all essential for directed cell migration, material transport, and signal transduction. Observations of antioxidant and protease inhibitor activities suggest that these genes may play roles in cellular protection and adaptive responses to environmental changes (Fig. 7A and B). In addition, KEGG analysis showed that the differentially expressed genes were significantly enriched in pathways such as the Wnt signaling pathway and the complement and coagulation cascades (Fig. 7C and D). GSEA further highlighted the top five enriched functions that differ between the two risk groups (Fig. 7E and H).
Fig. 7.
Functional analysis of the risk model. (A, B) GO enrichment analysis showing significant biological processes (BP), cellular components (CC), and molecular functions (MF). (C, D) KEGG pathway analysis highlighting significantly enriched pathways. (E, F) GSEA comparing high-risk and low-risk groups based on the KEGG pathway database
Evaluation of immune characteristics based on the risk model
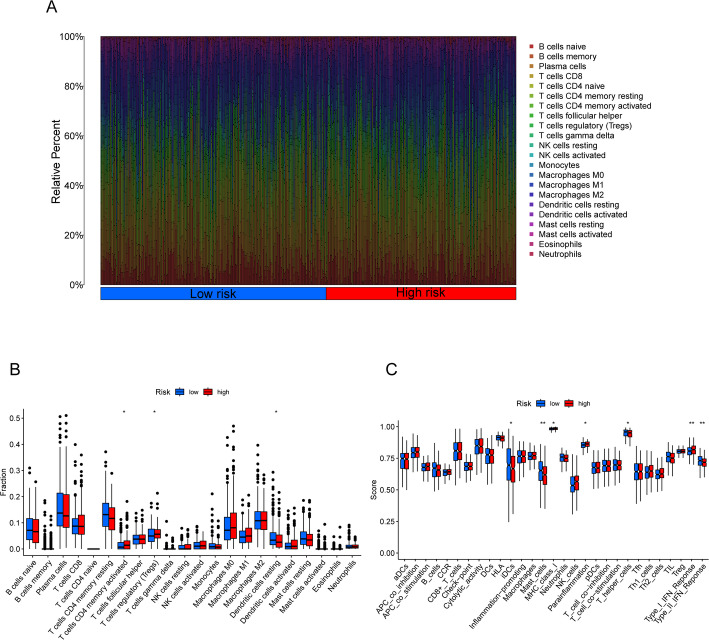
We evaluated immune cell infiltration levels in LUAD patients from the TCGA cohort using the “CIBERSORT” package in R. Figure 8A shows the relative abundance of 22 key immune cell types. The CIBERSORT analysis revealed significant differences in certain immune cells—such as activated CD4 memory T cells, regulatory T cells (Tregs), and resting dendritic cells—between the high-risk and low-risk groups (Fig. 8B). Further examination of immune functions revealed statistically significant differences between the two groups in several immune parameters, including immature dendritic cells (iDCs), mast cells, MHC class I, parainflammation, helper T cells, and type I and type II interferon responses (Fig. 8C; p < 0.05). Notably, the high-risk group exhibited marked suppression of iDCs, mast cells, helper T cells, and type II interferon response.
Fig. 8.
Differences in the tumor immune microenvironment between low-risk and high-risk groups. A Abundance ratios of immune cells in LUAD samples. B Differentially expressed immune cells between low-risk and high-risk score groups. C Immune function analysis in low-risk and high-risk score groups
TMB and TIDE
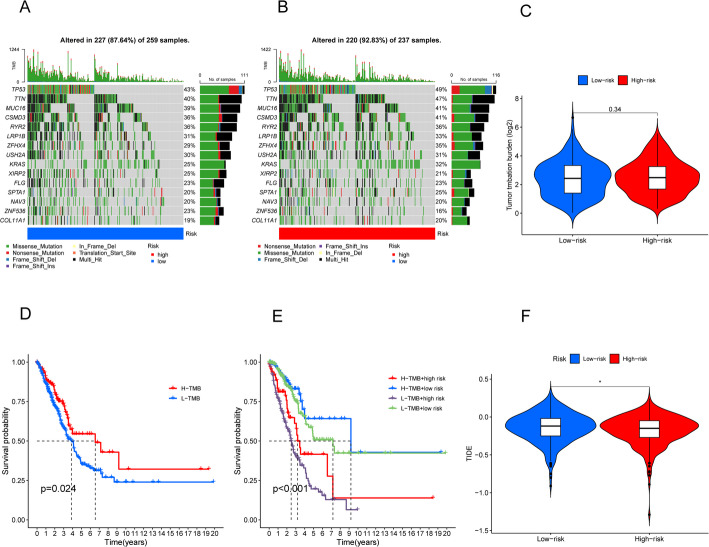
We employed the “maftools” package in R to analyze mutation frequency and TMB in both groups. To illustrate the data, we selected the top 15 genes exhibiting the highest mutation frequencies. Waterfall plots (Fig. 9A and B) showed that TP53, TTN, MUC16, CSMD3, and RYR2 were the five most frequently mutated genes in LUAD, with TP53 predominating. We then visualized LUAD sample mutation types via color-coded boxplots, revealing that the high-risk group had a higher mutation frequency for most genes than the low-risk group. Additionally, a comparison of TMB between high-risk and low-risk groups showed no significant difference (Fig. 9C). Furthermore, KM survival curves for the high-TMB and low-TMB groups indicated that the high-TMB group had a better prognosis (p = 0.34) (Fig. 9D), suggesting a possible association between higher TMB and improved immunotherapy response. When TMB and risk scores were combined, patients with high risk and low TMB showed worse outcomes (p < 0.001, Fig. 9E). Finally, we evaluated the TIDE scores for both high-risk and low-risk groups, finding that the high-risk group had lower TIDE scores (p < 0.05, Fig. 9F). This observation implies a reduced likelihood of immune escape and suggests that these patients may experience greater benefit from immunotherapy.
Fig. 9.
Relationship of model scores to TMB and TIDE. A, B Waterfall plots showing somatic mutation characteristics in the two groups. C Comparison of TMB between low-risk and high-risk groups. D Kaplan-Meier survival analysis based on TMB status. E Kaplan-Meier survival analysis for patients categorized by combined TMB status and risk score. F Comparison of TIDE scores between the two groups
Screening potential anti-cancer drugs for LUAD
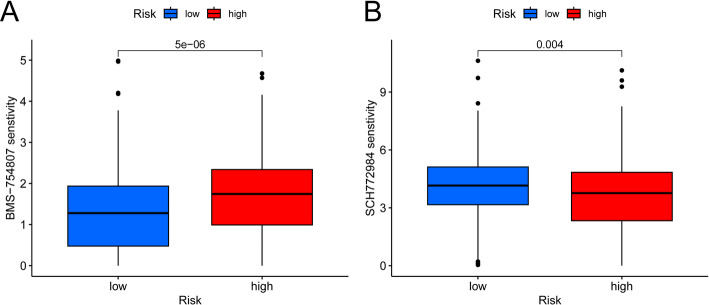
We used the “oncoPredict” package in R to screen 20 anticancer drugs whose sensitivity was significantly linked to our established risk model. The high-risk group exhibited heightened sensitivity to three of these drugs (Fig S1), whereas the low-risk group displayed increased sensitivity to the remaining 17 (Fig S2). Notably, BMS-754,807 demonstrated higher sensitivity in the low-risk group (Fig. 10A), whereas SCH772984 was more effective in the high-risk group (Fig. 10B).
Fig. 10.
Drug sensitivity analysis. A BMS-754,807 exhibits higher sensitivity in the low-risk group. B SCH772984 is more effective in the high-risk group
External validation of metastasis-related LncRNAs
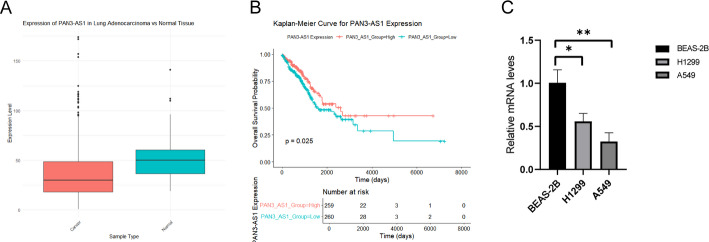
To validate the risk model, we analyzed PAN3-AS1 expression in tumor and paired normal tissues using The Cancer Genome Atlas (TCGA) data. PAN3-AS1 was consistently downregulated in tumor samples (Fig. 11A). We then performed survival analyses via the R “survival” package and generated Kaplan-Meier (KM) curves using “survminer” to assess PAN3-AS1’s prognostic value. The results indicated that PAN3-AS1 functions as a favorable prognostic marker, showing a significant correlation with overall survival (p = 0.025) (Fig. 11B). These external validation findings aligned with those of our study.
Fig. 11.
External validation of metastasis-related lncRNAs. A Expression of PAN3-AS1 in tumor tissues and paired normal tissues from the TCGA database. B Overall survival (OS) analysis of PAN3-AS1 in the Kaplan-Meier Plotter dataset. C PAN3-AS1 expression levels detected by qPCR in normal lung cells and LUAD cell lines. Significant differences compared to normal lung cells are indicated by asterisks (*p < 0.05; * *p < 0.01)
Validation of metastasis-related LncRNAs using qPCR
We verified the expression of metastasis-related lncRNAs in LUAD cell lines by qPCR, thereby confirming the predictive value of our lncRNA model. Consistent with previous reports, PAN3-AS1 levels were reduced in LUAD cells relative to the normal lung cell line BEAS-2B (Fig. 11C).
Discussion
As the most common subtype of lung cancer, LUAD has attracted considerable interest from medical researchers, particularly regarding its pathogenesis, progression, and treatment strategies [31, 37, 38]. Existing studies highlight differences in clinical presentation and prognosis among various lung cancer subtypes, spurring efforts to identify non-coding RNA features that predict survival and immunotherapy response in LUAD patients. Owing to their essential roles in tumorigenesis, lncRNAs have been widely recognized for their prognostic value across numerous cancers [32, 39, 40]. Nevertheless, the function of lncRNAs in LUAD migration has yet to be elucidated.
In this study, we constructed a prognostic model based on 17 migration-associated lncRNAs to predict survival in LUAD patients. Through univariate Cox regression, we identified 241 lncRNAs significantly linked to patient outcomes. LASSO and multivariate Cox regression analyses further refined this set to 17 lncRNAs associated with overall survival. We then built a prognostic model using these lncRNAs and validated its accuracy and efficacy via multiple methods. Our findings, consistent with prior research, reinforce the critical role of lncRNAs in manipulating the tumor immune microenvironment [33].
Moreover, certain lncRNAs—such as PAN3-AS—are closely tied to the immune microenvironment and tumor angiogenesis in pancreatic cancer [41, 42]. Meanwhile, lncRNA AC027237.4 has demonstrated vital roles in copper-induced cell death, and AC084781.1 has been implicated in neutrophil extracellular trap formation, pointing to their potential utility as biomarkers for LUAD. Their interaction with known tumor-related lncRNAs, particularly those upregulated in high-risk patients, underscores their pivotal roles in LUAD progression. Future work should clarify the functional mechanisms and clinical applications of AC027237.4 [34, 35].
Additionally, lncRNA AC004918.3 is strongly linked to prognosis in thyroid cancer and has been tied to autophagy processes [36]. Its importance in risk model construction and redox function analysis implies that AC004918.3 may play a key role in the onset, progression, and prognostic assessment of clear cell renal cell carcinoma (ccRCC). Further studies should examine the pathways and clinical relevance of AC004918.3 in renal cancer [43]. Meanwhile, lncRNAs AP005136.4 and AP001267.3 are similarly associated with ccRCC prognosis [44, 45].
Studies of LUAD have revealed correlations between AL606489.1 and FRMD6-AS1 expression levels and patient outcomes, with further links identified in hepatocellular carcinoma [46–50]. In addition, AC009019.1—an lncRNA associated with copper-induced necrosis—correlates significantly with overall survival in pancreatic cancer patients, suggesting its potential usefulness in prognostic assessment [51]. LINC00205 likewise contributes to the progression of multiple cancers, including LUAD, hepatocellular carcinoma, and gastric cancer [52–54].
However, the molecular mechanisms of seven additional lncRNAs—AC004967.2, AL022724.3, AC135507.1, AL356608.1, AC007686.2, AL353138.1, and AC025871.1—across various tumor types remain underexplored. Identifying these migration-associated lncRNAs represents a noteworthy step forward in elucidating LUAD biology and offers potential therapeutic avenues.
This study confirmed the efficacy and reliability of the risk model by dividing LUAD patients into low-risk and high-risk cohorts based on median risk scores. Validation from both the test set and the entire cohort demonstrated robust predictive accuracy. Moreover, multivariate Cox analysis showed that the risk model can independently predict individual survival outcomes, independent of other clinical variables. ROC curves and C-index analyses affirmed the model’s high predictive power. Additionally, nomograms for OS and corresponding calibration curves validated the alignment between observed results and predicted outcomes, underscoring the model’s promise for clinical translation.
Moreover, we investigated the biological functions linked to the risk model by examining differentially expressed genes between high-risk and low-risk cohorts. GO, KEGG, and GSEA analyses indicated that these genes predominantly contribute to cellular motility, the structure and function of cilia and flagella, microtubule dynamics, and cytoskeletal reorganization—key elements in directed cell migration, material transport, and signal transduction. Observed antioxidant and protease inhibition activities imply that these genes may engage in protective mechanisms and responses to environmental changes. Subsequently, we assessed the tumor immune microenvironment across risk categories, uncovering distinct immune-related activities and cell populations in high-risk versus low-risk cohorts.
Our drug sensitivity analysis identified 20 potential anticancer agents with significantly different efficacy between high-risk and low-risk groups. These results both confirm our model’s clinical relevance and lay a foundation for personalized treatment strategies based on patient risk stratification.
Among drugs highly sensitive in the high-risk group, 5-fluorouracil (5-FU)—a classic pyrimidine analog—has shown clinical efficacy in multiple NSCLC trials. Wang et al. reported enhanced 5-FU sensitivity in KRAS-mutated NSCLC cells [55]. In our current analysis, we observed increased 5-FU sensitivity in the high-risk group, suggesting molecular traits akin to KRAS-mutant tumor cells. This warrants further investigation. Moreover, the sensitivity of ERK inhibitors (ERK_6604 and SCH772984) in the high-risk group implies that the MAPK signaling pathway may be critical for these patients. This finding offers a possible mechanistic basis for their heightened sensitivity to ERK inhibitors. Additional studies could elucidate the regulatory interplay between the MAPK pathway and migrasome-related lncRNAs. Notably, Manchado et al. demonstrated that LKB1-deficient NSCLC cells show marked sensitivity to SCH772984 [56], thereby revealing a novel targeted approach for high-risk patients.
In contrast, patients in the low-risk group demonstrated sensitivity to a broader range of drugs. ABT737, a selective Bcl-2 inhibitor, has shown significant antitumor activity in NSCLC, particularly among patients in the low-risk group. According to the study by Tan et al., ABT737 can inhibit NSCLC growth by inducing apoptosis [57], suggesting that low-risk patients may be more dependent on the Bcl-2 pathway—a hypothesis warranting further investigation in future research. Likewise, the tyrosine kinase inhibitor axitinib exhibited increased sensitivity in the low-risk group. This finding supplements the results of a Phase II clinical trial conducted by Schiller et al., which reported the single-agent efficacy and favorable tolerability of axitinib in patients with advanced NSCLC [58].
Additionally, we noted increased sensitivity to PI3K/AKT/mTOR pathway inhibitors (e.g., AZD6482 and Uprosertib) in low-risk patients. Fumarola et al. examined the aberrant activation of PI3K in NSCLC, which strongly correlates with disease progression and therapy resistance [59]. These data offer a mechanistic basis for the heightened sensitivity observed in our study.
The responsiveness of low-risk patients to JAK1 inhibitors is also significant. Recent trials indicate that co-administering JAK inhibitors with immune checkpoint inhibitors markedly enhances treatment response in NSCLC. Patel et al. reported that post-anti-PD-1 use of the JAK1 inhibitor itacitinib bolstered immune responses in advanced NSCLC [60]. Together with our sensitivity findings, this suggests that low-risk patients may be more receptive to immunotherapeutic regimens. Further TIDE-based studies could substantiate this assumption.
Our analysis additionally showed that several targeted compounds—including the ROCK inhibitor GSK269962A, the GSK-3 inhibitor SB216763, the TGF-β receptor inhibitor SB505124, and the Aurora kinase inhibitor ZM447439—demonstrated higher sensitivity among low-risk patients. Dominguez-Brauer et al. underscored the pivotal function of mitosis-associated pathways (including Aurora kinases) in NSCLC progression, identifying them as promising therapeutic targets [61].
Notably, our migrasome-related lncRNA signature prognosticates clinical outcomes and guides individualized therapy. Drawing on our findings, we suggest several clinical applications: (1) developing PCR-based diagnostic assays to measure expression levels of these 17 lncRNAs at diagnosis for risk stratification; (2) merging these findings with common clinical variables (TNM stage, histological classification) to establish a comprehensive prognostic framework; (3) utilizing the model as a companion diagnostic tool to optimize immunotherapy selection, especially for patients with elevated TIDE scores who may benefit significantly from immune checkpoint inhibitors; and (4) incorporating this signature into trial designs, stratifying patients to pinpoint those most likely to respond to novel targeted or combination therapies.
Overall, our drug sensitivity analysis validates the clinical value of this migrasome-related lncRNA signature and provides novel avenues for personalized LUAD therapy. The observed variations in drug response—where high-risk patients are more sensitive to agents like 5-FU and ERK inhibitors, while low-risk patients display sensitivity to a broader range of targeted therapies—reinforce the necessity of molecular-marker-based patient stratification. These outcomes emphasize the potential of precision medicine in LUAD, noting the importance of informed, targeted treatment decisions built upon a solid molecular framework.
Lastly, PCA showed that our constructed risk model effectively discriminates between low-risk and high-risk patients, underscoring the significance of migration-associated lncRNA signatures in LUAD prognosis. Nevertheless, this study has certain constraints. First, most data were derived from the TCGA database, which, despite its sizable sample, lacks multi-center validation. Second, although several migration-associated lncRNAs strongly linked to LUAD prognosis were identified, their molecular mechanisms remain to be fully elucidated. Future research should integrate more diverse datasets and experimentally verify the exact functions of these lncRNAs in tumorigenesis and progression, particularly their potential immunotherapeutic applications.
In summary, the migration-associated lncRNA risk model developed herein exhibits strong potential in predicting LUAD prognosis and immune responses. Our findings not only provide novel perspectives for personalized LUAD treatments but also establish a foundation for future research on lncRNA biology and its applications in cancer therapy.
Conclusion
This research is the first to propose a migrasome-related lncRNA signature for LUAD. By introducing this prognostic model, we offer a practical tool for outcome prediction in LUAD patients, demonstrating strong performance in survival assessment and risk stratification. Moreover, significant differences in immune infiltration, TMB, TIDE, and drug sensitivity between the risk groups underscore this model’s potential to inform clinical decisions for LUAD treatment.
Supplementary Information
Acknowledgements
Not applicable.
Author contributions
ZH contributed to the formal analysis, prepared visualizations, and drafted the original manuscript. YKP was responsible for reviewing and editing the manuscript. LYJ contributed to the preparation of visualizations. WMD conducted the investigation. WL developed and implemented the software used in the study. CCL curated the data for analysis. LPY performed validation of the results. LXD managed the project and provided essential resources. WB was responsible for conceptualization, securing funding, and supervising the research.All authors contributed to the article and approved the submitted version.
Funding
This research was supported by the Jilin Science and Technology Development Program Project (No.YDZJ202501ZYTS267; 20210203186SF; 20240101007JJ; YDZJ202401676ZYTS; YDZJ202301ZYTS120; YDZJ202301ZYTS200); Jilin Health Science and Technology Capacity Enhancement Program (No. 2023JC058); Jilin Chinese Medicine Science and Technology Program (No.2023079).
Data availability
Data is provided within the manuscript or supplementary information files.
Declarations
Ethics approval and consent to participate
This study utilized publicly available data from the TCGA, GENE, and TIDE databases. As all data used in this research is de-identified and publicly accessible, no ethical approval or participant consent was required. The study was conducted in accordance with relevant guidelines and regulations for research involving secondary data.
Consent for publication
Not applicable.
Competing interests
The authors declare no competing interests.
Footnotes
Publisher’s note
Springer Nature remains neutral with regard to jurisdictional claims in published maps and institutional affiliations.
Hui Zhao and Kunpeng Yang contributed equally to this work.
Contributor Information
Xiaodan Lu, Email: luxiaodan@ccsfu.deu.cn.
Bao Wang, Email: jpch0000@163.com.
References
- 1.Zhou J, Xu Y, Liu J, Feng L, Yu J, Chen D. Global burden of lung cancer in 2022 and projections to 2050: incidence and mortality estimates from GLOBOCAN. Cancer Epidemiol[J]. 2024;93:102693. [DOI] [PubMed] [Google Scholar]
- 2.Wu Y, He S, Cao M, et al. Comparative analysis of cancer statistics in China and the united States in 2024. Chin Med J (Engl)[J]. 2024;137(24):3093–100. [DOI] [PMC free article] [PubMed] [Google Scholar]
- 3.Liu X, Yang Q, Pan L, et al. Burden of respiratory tract cancers in China and its provinces, 1990–2021: a systematic analysis of the global burden of disease study 2021. Lancet Reg Health West Pac[J]. 2025;55:101485. [DOI] [PMC free article] [PubMed] [Google Scholar]
- 4.Kim N, Kim HK, Lee K, et al. Single-cell RNA sequencing demonstrates the molecular and cellular reprogramming of metastatic lung adenocarcinoma. Nat Commun[J]. 2020;11(1):2285. [DOI] [PMC free article] [PubMed] [Google Scholar]
- 5.Gridelli C, Rossi A, Carbone DP, et al. Non-small-cell lung cancer. Nat Rev Dis Primers[J]. 2015;1:15009. [DOI] [PubMed] [Google Scholar]
- 6.Gettinger S, Horn L, Jackman D, et al. Five-Year Follow-Up of nivolumab in previously treated advanced Non-Small-Cell lung cancer: results from the CA209-003 study. J Clin Oncol[J]. 2018;36(17):1675–84. [DOI] [PubMed] [Google Scholar]
- 7.Herbst RS, Morgensztern D, Boshoff C. The biology and management of non-small cell lung cancer. Nature[J]. 2018;553(7689):446–54. [DOI] [PubMed] [Google Scholar]
- 8.Hirsch FR, Scagliotti GV, Mulshine JL, et al. Lung cancer: current therapies and new targeted treatments. Lancet[J]. 2017;389(10066):299–311. [DOI] [PubMed] [Google Scholar]
- 9.Siegel RL, Miller KD, Jemal A. Cancer statistics. CA Cancer J Clin[J]. 2018;68(1):7–30. [DOI] [PubMed] [Google Scholar]
- 10.Xu S, Lu Z. Exploring FNDC4 as a biomarker for prognosis and immunotherapy response in lung adenocarcinoma. Asian J Surg[J]. 2024. 10.1016/j.asjsur.2024.09.054. [DOI] [PubMed] [Google Scholar]
- 11.Yu S, Yu L. Migrasome biogenesis and functions. FEBS J[J]. 2022;289(22):7246–54. [DOI] [PMC free article] [PubMed] [Google Scholar]
- 12.Tan X, He S, Wang F, Li L, Wang W. Migrasome, a novel organelle, differs from exosomes. Biochem Biophys Rep[J]. 2023;35:101500. [DOI] [PMC free article] [PubMed] [Google Scholar]
- 13.Ding T, Ji J, Zhang W, et al. The phosphatidylinositol (4,5)-bisphosphate-Rab35 axis regulates migrasome formation. Cell Res[J]. 2023;33(8):617–27. [DOI] [PMC free article] [PubMed] [Google Scholar]
- 14.Huang Y, Zucker B, Zhang S, et al. Migrasome formation is mediated by assembly of micron-scale tetraspanin macrodomains. Nat Cell Biol[J]. 2019;21(8):991–1002. [DOI] [PubMed] [Google Scholar]
- 15.Ma Y, Li T, Zhao L, et al. Isolation and characterization of extracellular vesicle-like nanoparticles derived from migrasomes. FEBS J[J]. 2023;290(13):3359–68. [DOI] [PubMed] [Google Scholar]
- 16.Zhai Z, Liu B, Yu L. The roles of migrasome in development. Cell Insight[J]. 2024;3(1):100142. [DOI] [PMC free article] [PubMed] [Google Scholar]
- 17.Jiao H, Jiang D, Hu X, et al. Mitocytosis, a migrasome-mediated mitochondrial quality-control process. Cell[J]. 2021;184(11):2896–e29102813. [DOI] [PubMed] [Google Scholar]
- 18.Jiang Y, Liu X, Ye J, et al. Migrasomes, a new mode of intercellular communication. Cell Commun Signal[J]. 2023;21(1):105. [DOI] [PMC free article] [PubMed] [Google Scholar]
- 19.Ma L, Li Y, Peng J, et al. Discovery of the migrasome, an organelle mediating release of cytoplasmic contents during cell migration. Cell Res[J]. 2015;25(1):24–38. [DOI] [PMC free article] [PubMed] [Google Scholar]
- 20.Zhang K, Zhu Z, Jia R, et al. CD151-enriched migrasomes mediate hepatocellular carcinoma invasion by conditioning cancer cells and promoting angiogenesis. J Exp Clin Cancer Res[J]. 2024;43(1):160. [DOI] [PMC free article] [PubMed] [Google Scholar]
- 21.Deng S, Wu Y, Huang S, Yang X. Novel insights into the roles of migrasome in cancer. Discov Oncol[J]. 2024;15(1):166. [DOI] [PMC free article] [PubMed] [Google Scholar]
- 22.Li L, van Breugel PC, Loayza-Puch F, et al. LncRNA-OIS1 regulates DPP4 activation to modulate senescence induced by RAS. Nucleic Acids Res[J]. 2018;46(8):4213–27. [DOI] [PMC free article] [PubMed] [Google Scholar]
- 23.Qin Y, Yang J, Liang C, et al. Pan-cancer analysis identifies migrasome-related genes as a potential immunotherapeutic target: A bulk omics research and single cell sequencing validation. Front Immunol[J]. 2022;13:994828. [DOI] [PMC free article] [PubMed] [Google Scholar]
- 24.Zhao X, Lei Y, Zheng J, et al. Identification of markers for migrasome detection. Cell Discov[J]. 2019;5:27. [DOI] [PMC free article] [PubMed] [Google Scholar]
- 25.Zheng Y, Lang Y, Qi B, Li T. TSPAN4 and migrasomes in atherosclerosis regression correlated to myocardial infarction and pan-cancer progression. Cell Adh Migr[J]. 2023;17(1):14–9. [DOI] [PMC free article] [PubMed] [Google Scholar]
- 26.Giordano TJ. The cancer genome atlas research network: a sight to behold. Endocr Pathol[J]. 2014;25(4):362–5. [DOI] [PubMed] [Google Scholar]
- 27.Cancer Genome Atlas Research. Comprehensive molecular profiling of lung adenocarcinoma. Nature[J]. 2014;511(7511):543–50. [DOI] [PMC free article] [PubMed] [Google Scholar]
- 28.Qiu C, Wang W, Xu S, et al. Construction and validation of a hypoxia-related gene signature to predict the prognosis of breast cancer. BMC Cancer[J]. 2024;24(1):402. [DOI] [PMC free article] [PubMed] [Google Scholar]
- 29.Yang S, Liu H, Zheng Y, et al. The role of PLIN3 in prognosis and Tumor-Associated macrophage infiltration: A Pan-Cancer analysis. J Inflamm Res[J]. 2025;18:3757–77. [DOI] [PMC free article] [PubMed] [Google Scholar]
- 30.Xu S, Zheng Y, Ye M, et al. Comprehensive pan-cancer analysis reveals EPHB2 is a novel predictive biomarker for prognosis and immunotherapy response. BMC Cancer[J]. 2024;24(1):1064. [DOI] [PMC free article] [PubMed] [Google Scholar]
- 31.Zhang TY, Ren HY, Pan N, et al. Tumor cell-derived autophagosomes (DRibbles)-activated B cells induce specific Naive CD8(+) T cell response and exhibit antitumor effect. Cancer Immunol Immunother[J]. 2021;70(2):463–74. [DOI] [PMC free article] [PubMed] [Google Scholar]
- 32.Song Q, Shang J, Yang Z, et al. Identification of an immune signature predicting prognosis risk of patients in lung adenocarcinoma. J Transl Med[J]. 2019;17(1):70. [DOI] [PMC free article] [PubMed] [Google Scholar]
- 33.Park EG, Pyo SJ, Cui Y, Yoon SH, Nam JW. Tumor immune microenvironment lncRNAs. Brief Bioinform[J]. 2022;23(1):bbab504. [DOI] [PMC free article] [PubMed] [Google Scholar]
- 34.Yang L, Cui Y, Liang L, Lin J. Significance of cuproptosis-related LncRNA signature in LUAD prognosis and immunotherapy: A machine learning approach. Thorac Cancer[J]. 2023;14(16):1451–66. [DOI] [PMC free article] [PubMed] [Google Scholar]
- 35.Wang H, Shi Y, Xu X, et al. A novel neutrophil extracellular traps-related LncRNA signature predicts prognosis in patients with early-stage lung adenocarcinoma. Ann Med[J]. 2023;55(2):2279754. [DOI] [PMC free article] [PubMed] [Google Scholar]
- 36.Shan Y, He R, Yang X, et al. An autophagy-related LncRNA prognostic risk model for thyroid cancer. Eur Arch Otorhinolaryngol[J]. 2022;279(3):1621–31. [DOI] [PubMed] [Google Scholar]
- 37.Bade BC, Dela Cruz CS. Lung Cancer 2020: epidemiology, etiology, and prevention. Clin Chest Med[J]. 2020;41(1):1–24. [DOI] [PubMed] [Google Scholar]
- 38.Tu Z, Wu L, Wang P, et al. N6-Methylandenosine-Related LncRNAs are potential biomarkers for predicting the overall survival of Lower-Grade glioma patients. Front Cell Dev Biol[J]. 2020;8:642. [DOI] [PMC free article] [PubMed] [Google Scholar]
- 39.Tian Y, Yu M, Sun L, et al. Distinct patterns of mRNA and LncRNA expression differences between lung squamous cell carcinoma and adenocarcinoma. J Comput Biol[J]. 2020;27(7):1067–78. [DOI] [PubMed] [Google Scholar]
- 40.Zhang H, Guo L, Chen J. Rationale for lung adenocarcinoma prevention and drug development based on molecular biology during carcinogenesis. Onco Targets Ther[J]. 2020;13:3085–91. [DOI] [PMC free article] [PubMed] [Google Scholar]
- 41.Ping H, Jia X, Ke H. A novel Ferroptosis-Related LncRNAs signature predicts clinical prognosis and is associated with immune landscape in pancreatic Cancer. Front Genet[J]. 2022;13:786689. [DOI] [PMC free article] [PubMed] [Google Scholar]
- 42.Cao G, Chang Y, Yang G, Jiang Y, Han K. A novel risk score model based on four angiogenesis long non-coding RNAs for prognosis evaluation of pancreatic adenocarcinoma. Aging (Albany NY)[J]. 2022;14(22):9090–102. [DOI] [PMC free article] [PubMed] [Google Scholar]
- 43.Qi-Dong X, Yang X, Lu JL, et al. Development and validation of a nine-redox-related long noncoding RNA signature in renal clear cell carcinoma. Oxid Med Cell Longev[J]. 2020;2020:6634247. [DOI] [PMC free article] [PubMed] [Google Scholar]
- 44.He Y, Zhang H, Li J, et al. Identification of cuproptosis-related LncRNAs signature for predicting the prognosis in patients with kidney renal clear cell carcinoma. J Genet Eng Biotechnol[J]. 2024;22(1):100338. [DOI] [PMC free article] [PubMed] [Google Scholar]
- 45.Zhu GZ, Liao XW, Wang XK, et al. Comprehensive investigation of p53, p21, nm23, and VEGF expression in hepatitis B virus-related hepatocellular carcinoma overall survival after hepatectomy. J Cancer[J]. 2020;11(4):906–18. [DOI] [PMC free article] [PubMed] [Google Scholar]
- 46.Liang J, Jin W, Xu H. An efficient five-lncRNA signature for lung adenocarcinoma prognosis, with AL606489.1 showing sexual dimorphism. Front Genet[J]. 2022;13:1052092. [DOI] [PMC free article] [PubMed] [Google Scholar]
- 47.Wu L, Wen Z, Song Y, Wang L. A novel autophagy-related LncRNA survival model for lung adenocarcinoma. J Cell Mol Med[J]. 2021;25(12):5681–90. [DOI] [PMC free article] [PubMed] [Google Scholar]
- 48.Song J, Sun Y, Cao H, et al. A novel pyroptosis-related LncRNA signature for prognostic prediction in patients with lung adenocarcinoma. Bioengineered[J]. 2021;12(1):5932–49. [DOI] [PMC free article] [PubMed] [Google Scholar]
- 49.Wu J, Song D, Zhao G, Chen S, Ren H, Zhang B. Cross-talk between necroptosis-related LncRNAs to construct a novel signature and predict the immune landscape of lung adenocarcinoma patients. Front Genet[J]. 2022;13:966896. [DOI] [PMC free article] [PubMed] [Google Scholar]
- 50.Chen M, Wu GB, Hua S, Zhao ZF, Li HJ, Luo M. Identification and validation of a prognostic model of necroptosis-related LncRNAs in hepatocellular carcinoma. Front Genet[J]. 2022;13:907859. [DOI] [PMC free article] [PubMed] [Google Scholar]
- 51.Zhang N, Yu X, Sun H, Zhao Y, Wu J, Liu G. A prognostic and immunotherapy effectiveness model for pancreatic adenocarcinoma based on cuproptosis-related LncRNAs signature. Med (Baltimore)[J]. 2023;102(42):e35167. [DOI] [PMC free article] [PubMed] [Google Scholar]
- 52.Huangfu L, Fan B, Wang G, et al. Novel prognostic marker LINC00205 promotes tumorigenesis and metastasis by competitively suppressing miRNA-26a in gastric cancer. Cell Death Discov[J]. 2022;8(1):5. [DOI] [PMC free article] [PubMed] [Google Scholar]
- 53.Xie P, Guo Y. LINC00205 promotes malignancy in lung cancer by recruiting FUS and stabilizing CSDE1. Biosci Rep[J]. 2020;40(10):BSR20190701. [DOI] [PMC free article] [PubMed] [Google Scholar]
- 54.Cheng T, Yao Y, Zhang S, et al. LINC00205, a YY1-modulated lncrna, serves as a sponge for miR-26a-5p facilitating the proliferation of hepatocellular carcinoma cells by elevating CDK6. Eur Rev Med Pharmacol Sci[J]. 2021;25(20):6208–19. [DOI] [PubMed] [Google Scholar]
- 55.Wang H, Yang T, Wu X. 5-Fluorouracil preferentially sensitizes mutant KRAS non-small cell lung carcinoma cells to TRAIL-induced apoptosis. Mol Oncol[J]. 2015;9(9):1815–24. [DOI] [PMC free article] [PubMed] [Google Scholar]
- 56.Caiola E, Iezzi A, Tomanelli M, et al. LKB1 deficiency renders NSCLC cells sensitive to ERK inhibitors. J Thorac Oncol[J]. 2020;15(3):360–70. [DOI] [PubMed] [Google Scholar]
- 57.Hann CL, Daniel VC, Sugar EA, et al. Therapeutic efficacy of ABT-737, a selective inhibitor of BCL-2, in small cell lung cancer. Cancer Res[J]. 2008;68(7):2321–8. [DOI] [PMC free article] [PubMed] [Google Scholar]
- 58.Schiller JH, Larson T, Ou SH, et al. Efficacy and safety of axitinib in patients with advanced non-small-cell lung cancer: results from a phase II study. J Clin Oncol[J]. 2009;27(23):3836–41. [DOI] [PubMed] [Google Scholar]
- 59.Fumarola C, Bonelli MA, Petronini PG, Alfieri RR. Targeting PI3K/AKT/mTOR pathway in Non small cell lung cancer. Biochem Pharmacol[J]. 2014;90(3):197–207. [DOI] [PubMed] [Google Scholar]
- 60.Mathew D, Marmarelis ME, Foley C, et al. Combined JAK Inhibition and PD-1 immunotherapy for non-small cell lung cancer patients. Science[J]. 2024;384(6702):eadf1329. [DOI] [PMC free article] [PubMed] [Google Scholar]
- 61.Dominguez-Brauer C, Thu KL, Mason JM, Blaser H, Bray MR, Mak TW. Targeting mitosis in cancer: emerging strategies. Mol Cell[J]. 2015;60(4):524–36. [DOI] [PubMed] [Google Scholar]
Associated Data
This section collects any data citations, data availability statements, or supplementary materials included in this article.
Supplementary Materials
Data Availability Statement
Data is provided within the manuscript or supplementary information files.


