

Abstract
LC-MS is an indispensable tool for small molecule analysis in many fields; however, many small molecules require chemical derivatization to improve retention on commonly used reversed-phase columns and increase ionization. Benzoyl chloride (BzCl) derivatization is commonly used for derivatization of primary and secondary amines and phenolic alcohols, though evidence exists that with proper reaction conditions (i.e., specific bases), other hydroxyl groups may be derivatized too. Previous studies have examined BzCl concentration, reaction times, and reaction temperatures for derivatization of amines and phenols for LC-MS analysis; however, use of different bases, base concentration, and extending to conditions to hydroxyl groups for LC-MS analysis has not been well-studied. To address this understudied area and identify reaction conditions for both amino and hydroxyl groups, we performed a systematic study of reaction conditions on multiple classes of potential targets. For selected derivatization methods, detection limits and performance in a variety of biological matrices were assessed. Results highlight the importance of tailoring derivatization methods for a given application as they varied by molecule and/or molecule class. Compared to the standard BzCl method commonly used, alternative methods were identified to better derivatize challenging analytes (glucosamine, choline, cortisol, uridine, cytidine) with detection limits reaching 1100, 9, 38, 170, and 67 nM compared to undetectable, 170, 86, 1000, and 86 nM respectively. Sub-nanomolar detection limits were achieved for norepinephrine with alternative derivatization approaches. Improved derivatization methods for several classes and molecules including nucleosides, steroids, and molecules containing hydroxyl groups were also identified.
Keywords: Benzoyl chloride, Chemical derivatization, Liquid chromatography-mass spectrometry, Small molecules
1. Introduction
Small molecule determination is vital in many fields including biomedical sciences [1,2], food safety [3,4], environmental science [5], and neuroscience [6]. Liquid chromatography coupled to mass spectrometry (LC-MS) has become an indispensable tool for such measurements due to the broad applicability across chemical classes, suitability for complex mixtures, high selectivity, excellent sensitivity, and quantification accuracy. Despite the ubiquity of LC-MS for such assays, challenges still arise. Notably, many small molecules are polar and are poorly retained and separated by commonly used reversed-phase columns. In other cases, molecules may not ionize well leading to poor MS sensitivity. To address these concerns, chemical derivatization has been used. Certain derivatizations can increase hydrophobicity of small molecules, thus improving retention and enabling separation [7,8] and can introduce properties that improve ionization [8–11]. Among the agents available, benzoylation has proven popular for amines, phenols, and some aliphatic alcohols [12]. In this work we perform systematic evaluation of benzoylation for LC-MS analysis to explore new conditions that may improve utility of the method.
Derivatizing reagents that target amines and alcohols are useful for LC-MS of small molecules because amines can be poorly retained in reversed-phase LC and often co-elute with salts and other interfering components [11,13] while alcohols, which are also poorly retained, have poor ionization efficiency due to their neutrality [11,14]. Reagents such as dansyl and dabsyl chloride, 9-fluorenylmethoxycarbonyl, and benzoyl chloride (BzCl) have been used to improve analysis by LC-MS for such compounds, though alcohols in general are difficult to derivatize [4,7,8,10,15–17]. BzCl is advantageous due to fast reaction times and mild reaction conditions while still achieving similar limits of detection and ionization efficiencies as compared to other reagents, like dansyl chloride [4,15,18]. 13C-labeled BzCl is also readily available to facilitate creating internal standards. In contrast, dansyl chloride is light sensitive and both it and dabsyl chloride require harsher and longer reaction conditions than alternative derivatizing agents [4,17]. 9-Fluorenylmethoxycarbonyl requires a removal step as excess reagent interferes with separations of amines on reversed-phase columns [4].
Benzoylation has been applied to a variety of biological [1,2,7,16, 18–21], environmental [5,22], and food or drink [3,4,23–27] samples. These investigations vary in their derivatization protocols. In general, a sample is basified, BzCl is added, and the reaction is then quenched. Reaction time allotted ranges from 30 s to 60 min, BzCl percentage ranges from 1 to 5%, and bases used have included sodium tetraborate, sodium hydroxide, and sodium carbonate. Effort has been made in evaluating the effect of reaction time [16,23,24], BzCl concentration [19,23], and temperature [16,24]. While several different bases have been used and some buffers compared [18,22], there is a lack of information on the effect of different bases and their concentration on benzoylation of amino and hydroxyl groups in the context of biological samples and LC-MS. Largely, primary and secondary amines and phenolic alcohols are targeted in studies using BzCl for derivatization, though some investigations suggest it is capable of derivatizing aliphatic alcohol functional groups as well [5,16]. One study targeted hydroxyl groups with use of pyridine as the base [16].
In chemical synthesis, benzoylation of hydroxyl groups using several bases including N,N,N’,N’-tetramethylethylenediamine (TMEDA) [28, 29], 4-dimethylaminopyridine (DMAP) [30,31], triethylamine (TEA) [31,32], pyridine [33,34], and N,N-diisopropylethylamine (DIPEA) [32, 35–37] is known, but these approaches have not been implemented for LC-MS derivatization. The bases used for analytical approaches and synthesis purposes have not been well compared or investigated for amine and alcohol derivatization.
The goal of this work was to provide information on the effect of conditions on benzoylation labeling for LC-MS analysis by a systematic study of reaction conditions on multiple classes of potential targets. To address a lack of exploration into bases for LC-MS, we tested 6 bases at a variety of concentrations to observe trends and best overall coverage of analytes. For selected bases, order of addition, activation of BzCl, and BzCl concentration were investigated. BzCl becomes activated when bases like pyridine catalyze the reaction through the formation of a quaternary ammonium which is susceptible to nucleophilic attack. [38] We also identified the time necessary for benzoylation to occur, assessed sample degradation in basic solutions, and investigated reaction completion. The methods were applied to different classes of molecules that are potential or known targets for benzoylation including: selected sugars (glucose and glucosamine), steroids (estradiol and cortisol), nucleosides (adenosine, cytidine, and uridine), amino acids (GABA, lysine, serine, and tyrosine), a catecholamine (norepinephrine), and choline (Supplemental Figure 1). These molecules have the potential to be derivatized 1–6 times at different functional groups (amino, phenolic hydroxyl, aliphatic hydroxyl). These analytes were measured in a variety of biological matrices to assess performance of the benzoylation methods. Results from this study provide a guide to method development for benzoylation of amino and hydroxyl functional group-containing molecules for LC-MS analysis.
2. Materials and methods
2.1. Chemicals and reagents
Benzoyl chloride (259,950, 99%), acetonitrile (AX0156, ≥99.9%), adenosine (A9251, ≥99%), choline (26,978, ≥99%), cortisol (H0888, ≥98%), cytidine (C4654, ≥99%), GABA (A2129, ≥99%), glucose (G5767), lysine (L5626, ≥98%), norepinephrine (A7257, 98%+), serine (S4500, ≥99%), tyrosine (T-3750, ≥99%), uridine (U3750, ≥99%), dimethylformamide (DMF) (227,056, 99.8%), TMEDA (T22500, 99%), DMAP (107,700, ≥99%), TEA (471,283, ≥99.5%), DIPEA (D125806, ≥99%), pyridine (270,970, 99.8%), sodium dodecyl sulfate (SDS) (L4509, ≥98.5%), and ammonium bicarbonate (A6141, ≥99%) were purchased from Sigma-Aldrich (St. Louis, MO). Luria-Bertani medium (BP9723), MgOAc (BP215), glycoblue (AM9516), bacterial alkaline phosphate (150 U/μL) (18,011,015), Optima grade water (W7–4), HPLC grade methanol (A452–4, 99.9+), Optima LC-MS grade formic acid (A117, 99+), and sulfuric acid (A300, 95–98%) were purchased from Fisher Scientific (Waltham, MA). Ethanol (2701, 200 proof) was purchased from Decon Laboratories, Inc. (King of Prussia, PA). Estradiol (10,006,315, ≥98%) and N-acetyl-d-glucosamine (13,136, ≥98%) were purchased from Cayman Chemical (Ann Arbor, MI). From CDN Isotopes (Pointe-Claire, Quebec, Canada), d4-acetylcholine (D-2558) was purchased. Gender pooled human plasma NaHep was obtained from BioIVT (Westbury, NY). Nuclease P1 (100,000 U/mL) was obtained from New England BioLabs (Ipswich, MA) and isoflurane from MWI Animal Health (Boise, ID). Dental cement components (Teets cold cure powder coral and Teets cold cure liquid) were purchased from Pearson Dental (Sylmar, CA).
To prepare concentrated stock solutions, cortisol and estradiol were first dissolved in DMF to create stocks and then diluted into water on day-of-use. Final sample composition was ≤ 0.2% DMF. All other targets were dissolved in water to create a mixed stock solution. Concentrated stock solutions were aliquoted and stored at −80 °C for up to 4 months. Standards were prepared to 5000 nM in water for testing. For calibration curves, concentrations included 5000, 3000, 1000, 550, 100, 55, 10, 5 nM.
Details of sample preparation for plasma, dialysate, yeast, and E. coli are provided in the supplemental material.
2.2. Derivatization methods
A previously described derivatization method using carbonate for neurotransmitter analysis via LC-MS/MS [7,18] was used and adapted to derivatize our target compounds. Method A, most similar to previously described method, requires sample to be added to 100 mM carbonate in water, followed by addition of 2% BzCl (by volume) in ACN, then internal standard (IS) of d4-acetylcholine containing 1% sulfuric acid (by volume) in 80/20 ACN/water in a 2:1:1:1 by volume ratio with vortexing between each addition. We tested an alternative addition order, Method B, in which 100 mM carbonate in water was first added to 2% BzCl in ACN, followed by sample, followed by 100 mM carbonate in water and the IS containing 1% sulfuric acid in 80/20 ACN/water in a 1:1:2:1:1 by volume ratio with vortexing between each addition. This order of addition is possible (for bases excluding carbonate) without destroying the BzCl due to exposure to water as the bases (excluding carbonate) are prepared in ACN, as described later. Typically, final samples were 25 or 30 μL.
To prepare the IS/acid solution, ACN and water were first mixed in a ratio that would give a final ACN% of 36% as this final concentration gave the best peak shape and maintained analyte solubility (data not shown). Then, sulfuric acid was added to the ACN/water mixture to make up 1% of the volume. Finally, d4-acetylcholine as IS was spiked in to give a final concentration of 200 nM. Acetylcholine does not have any functional groups that will derivatize with BzCl, which is why it was selected as an IS.
Alternative bases were implemented in place of the first carbonate addition. The bases DIPEA, DMAP, TEA, TMEDA, and pyridine were prepared in acetonitrile (ACN). Sodium carbonate (henceforth called carbonate) was prepared in water. For experiments in which base concentration changed, bases were prepared at 890, 735, 590, 440, 295, 150, 75, 30, 15, 7 mM in ACN (DIPEA, DMAP, TEA, TMEDA, pyridine) or water (carbonate) via serial dilution while BzCl concentration was maintained at 2%. The concentrations were prepared to be roughly 600, 500, 400, etc.% of the 2% BzCl. Carbonate prepared for Method B studies was prepared at 100 mM in water and concentration was held constant. The IS/acid solution was prepared in an appropriate amount of ACN/water to produce a final sample containing 36% ACN.
For experiments in which BzCl concentration was altered, BzCl was prepared at 8, 4, 2, 1, and 0.5% (by volume) in ACN. Other experimental conditions including base and base concentration are described later in the text.
For time trials, vials were constantly agitated between each addition for either 1, 5, or 20 min. For 0 min, samples were briefly vortexed before addition of the next reagent. After addition of the acid in the IS solution, vials were briefly vortexed.
A visual of Method A and B and summary of the parameters investigated in this study are provided in Fig. 1.
Fig. 1.

Visual Representation of Method A and B and summary of reaction conditions. Components are added in order from left to right with delays shown by Tx before the next addition.
2.3. LC-MS/MS method
Each sample was analyzed in triplicate using a Phenomenex Kinetex C18 chromatography column (100 × 2.1 mm, 1.7 μm, 100 Å) on an Agilent 1290 ultrahigh-performance liquid chromatograph interfaced to an Agilent 6410 triple quadrupole mass spectrometer. Mobile phase A was 10 mM ammonium formate with 0.15% (v/v) formic acid in water. Mobile phase B was ACN. The gradient used was as follows: 0 min, 5% B; 0.10 min, 45% B; 0.50 min, 55% B; 1.70 min, 100% B; 2.05 min, 100% B; 2.10 min, 5% B; 3 min, 5% B. The autosampler was cooled to 4 °C and the column was held at 30 °C. Samples were injected at 5 μL volumes. Electrospray ionization was used in positive mode at 3000 V. The gas temperature was 325 °C, gas flow was 11 L/min, and the nebulizer was at 60 psi. Ions were detected in MS/MS mode and the details of the MRM conditions are provided in Supplemental Table 1. Automated peak integration was performed using Mass Hunter software.
2.4. Statistics
Statistical analysis was performed using Prism 10 (GraphPad, La Jolla, CA). To determine significance, a Student’s t-test was used, and significance was defined as p < 0.05.
3. Results and discussion
3.1. Exploring alternative bases and order of addition
For benzoylation of samples for LC-MS analysis, bases including sodium carbonate, sodium tetraborate, pyridine, and sodium hydroxide have been used [2,3,16,18,19,22,24]; however, other bases used for synthetic purposes [28–30,32,34–36] and the effect of base concentration have been understudied. We selected some bases that have been previously used for benzoylation in synthesis for comparison to carbonate. The bases include DIPEA, DMAP, pyridine, TEA, and TMEDA (structures provided in Supplemental Figure 2).
We also investigated two orders of additions (Fig. 1). In Method A, sample and base are mixed first, followed by BzCl and then IS/acid to quench. Method A is based on previously published work using 100 mM carbonate as a base, which we refer to here as the standard carbonate method [18]. In Method B, base and BzCl are combined first, then sample, then carbonate to neutralize and quench, and finally IS with acid to acidify for aiding electrospray ionization. Inclusion of Method B served multiple purposes: A) prevent degradation of analytes if degradation occurs, B) activate BzCl with bases, and C) understand impact of order of addition on the reaction. A summary of the results of this comparison with different base concentrations is given in Fig. 2 which shows the relative signal for all analytes for all conditions with Method A (Fig. 2A) and Method B (Fig. 2B). (Note that signals with Fig. 2A are comparable to each other, but not to Fig. 2B and vice versa. Fig. 2C shows ratios of signals from Method B/Method A).
Fig. 2.
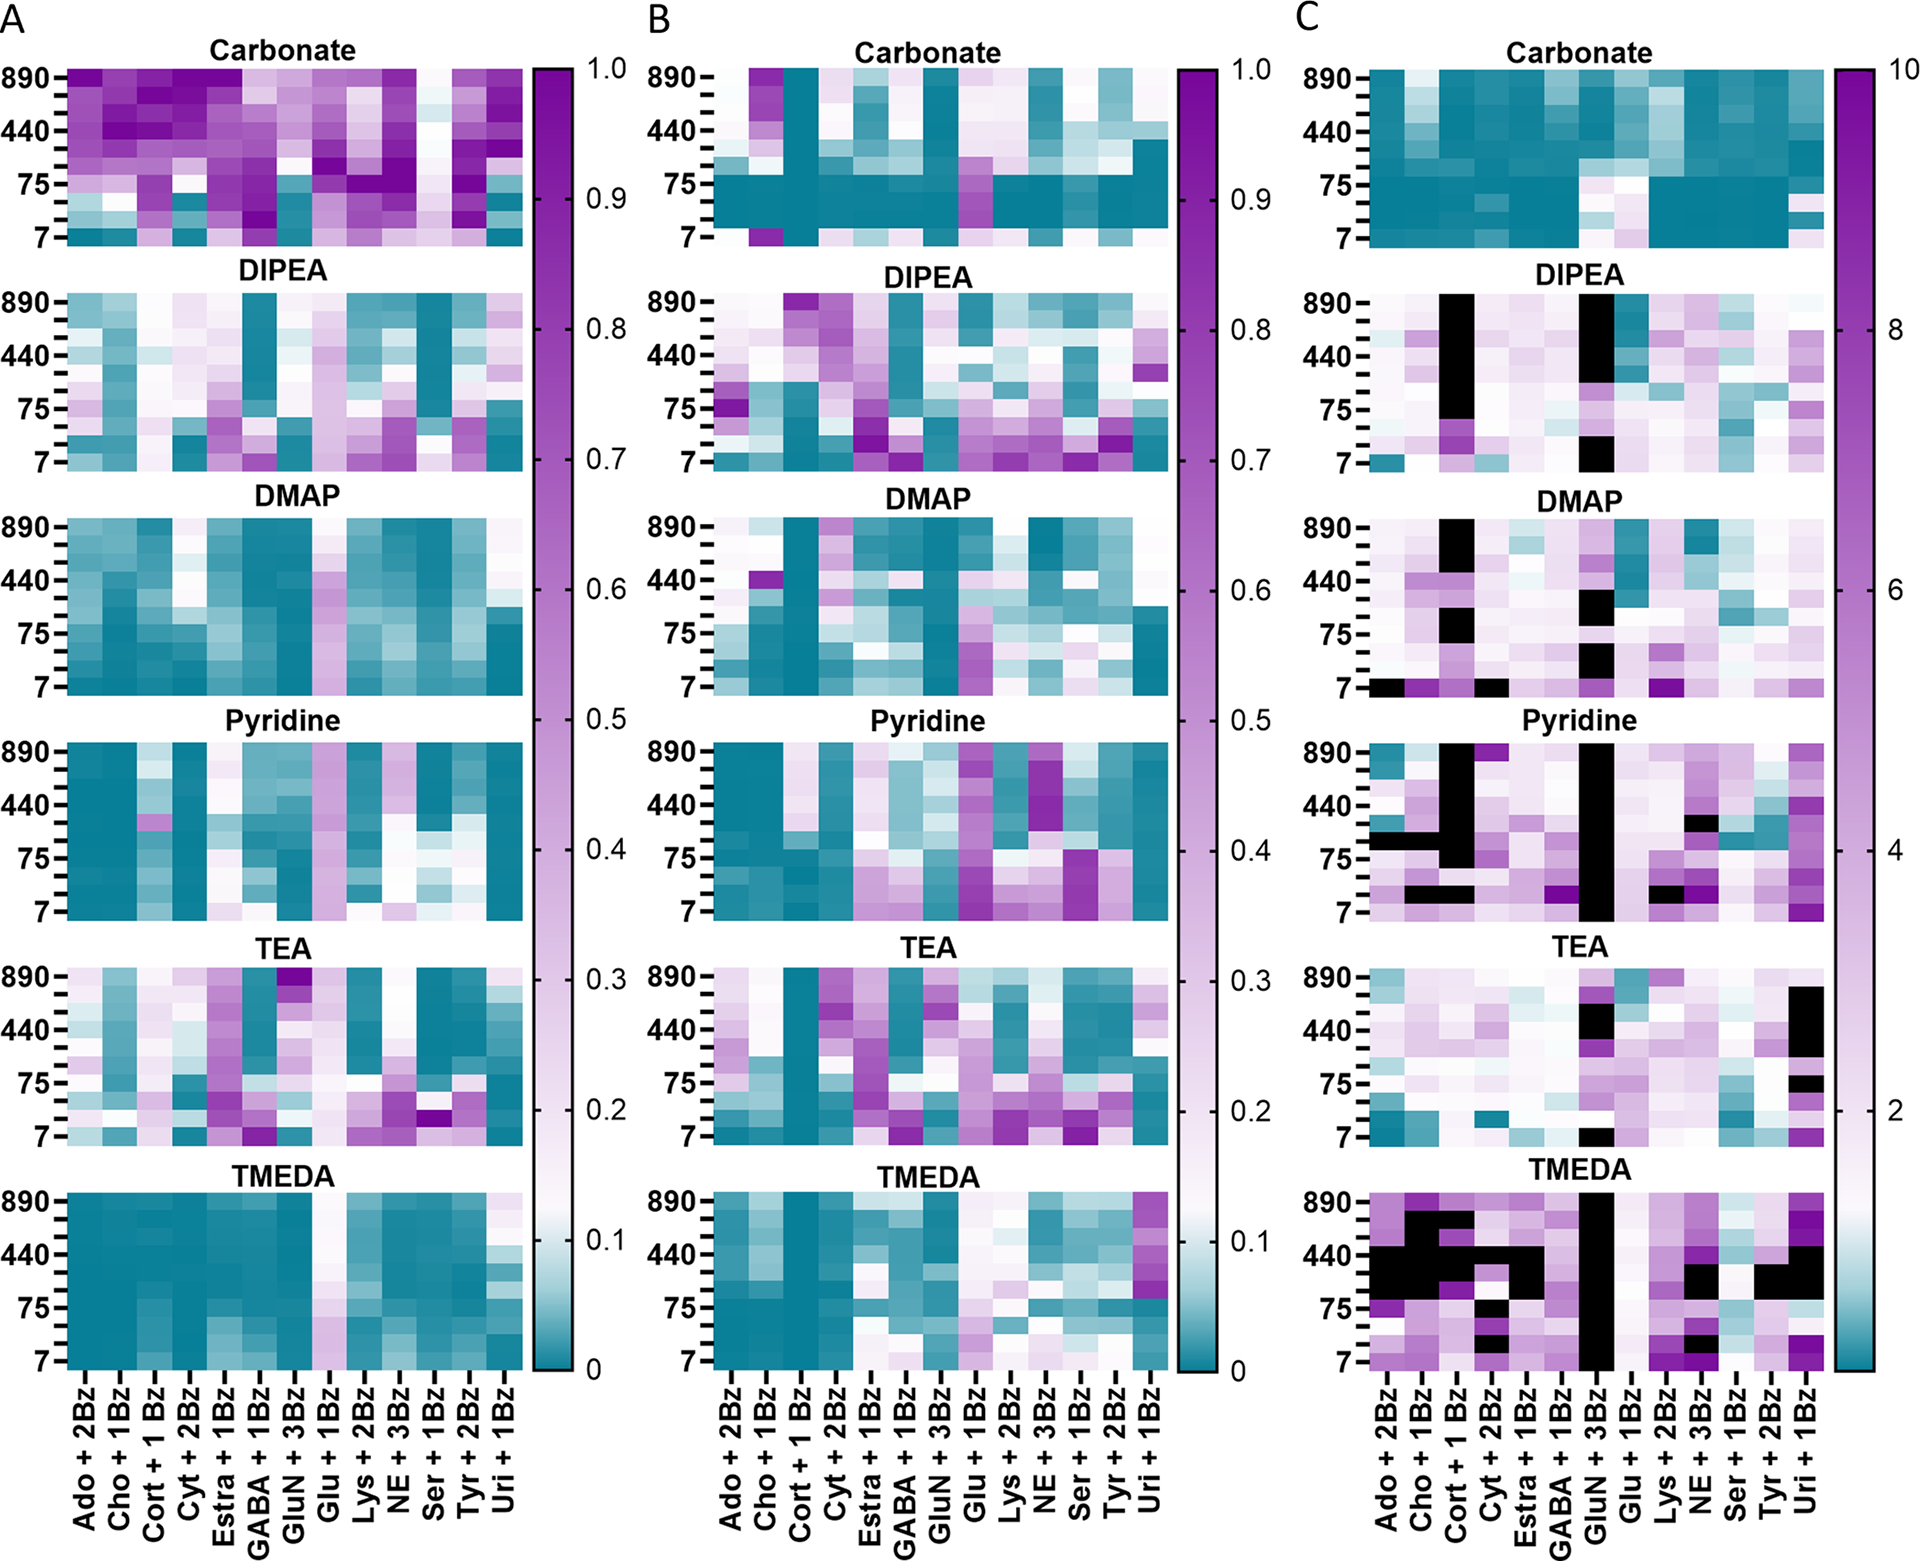
Effect of order of additions, bases, and base concentration on derivatization and LC-MS signal. Carbonate, DIPEA, DMAP, pyridine, TEA, and TMEDA were prepared at 890, 735, 590, 440, 295, 150, 75, 30, 15, and 7 mM. Values on the left represent the mM concentrations. Standards were prepared at 5000 nM and d4-acetylcholine was used as an IS. Analytes are described with the number of benzoyl additions they received (+ 1,2,3Bz) that gave dominant signal for that analyte. Signal for each analyte was normalized to the greatest obtained signal per analyte. N = 3 vials per condition with 3 replicate injections each. A) For Method A, bases were added first to the sample followed by BzCl addition. Carbonate excels at derivatizing, though other bases exceed for specific analytes. B) For Method B, bases were added to BzCl before sample was introduced. 1C) Signals for each order of addition were normalized only to the IS and then divided Method B/Method A. Black boxes indicate 10 < x ≤ 3000-fold increase in signal.
For Method A, using carbonate at ≥150 mM as the base created more derivatized product for most of the test compounds than the other bases (Fig. 2A). For Method B, carbonate did not perform as well relative to the other bases (Fig. 2B). We expect this is due to carbonate being dissolved in water, unlike the other bases which are dissolved in ACN. BzCl readily reacts with water to form benzoic acid or to form sodium benzoate if the pH with carbonate present is high enough. We anticipate this hindered the derivatization of most of the analytes.
Base concentration impacted the results as well (Fig. 2A and 2B). More catalytic concentrations of bases excelled at fuller coverage, though higher concentrations were beneficial for specific analytes such as choline, cortisol, and uridine. For all bases, the trends observed relating to base concentration remained regardless of order of addition e.g., with both Method A and B, low concentrations of TEA and DIPEA performed well in terms of coverage of analytes and compared to other conditions. A more in depth discussion of effect of base concentration on labeling hydroxyl groups is given in Supplemental along with Supplemental Figures 3 and 4.
Overall, Method B outperformed Method A in terms of signal and coverage for all bases except carbonate as shown in Fig. 2C. (In Fig. 2C, teal indicates Method A performs better than Method B and purple indicates Method B performs better than Method A, and black indicates Method B performs better than Method A outside of the range depicted). Pyridine and TMEDA are most improved through Method B over A. Likely, pyridine and TMEDA activated BzCl resulting in better derivatization. Method B enables substantially better derivatization of cortisol and glucosamine than Method A as many of the conditions produce a 10–3000-fold improvement in signal (denoted by black boxes in the figure) for them. Likewise, other analytes containing at least one hydroxyl group derivatized better with Method B than Method A. Activation of BzCl may have enabled benzoylation of hydroxyl groups to occur more readily.
Despite these benefits and better coverage by Method B with many of the bases, Method A with carbonate still gave the best overall signal for the majority of analytes, though it is challenging to derivatize choline and glucosamine with this method. Across all bases and both orders of addition, some analytes were robustly derivatized (estradiol, glucose, and norepinephrine) while others require specific conditions to derivatize (uridine, choline, and glucosamine).
3.2. BzCl concentration
A variety of BzCl concentrations have been implemented in other studies, including 1% [3,19], 2% [2,18,25], 5% [5], and concentrated BzCl [39,40]. One study testing BzCl percentages from 1 to 10 found maximum signal at 2% BzCl and a decrease in signal at higher amounts of BzCl for amines [23] while another study focused on 0.1–2% BzCl and found 1% to provide maximal signal for neurochemicals [19]. In this work, we tested BzCl at 0.5, 1, 2, 4, and 8% (Fig. 3). These BzCl concentrations were tested using Method A with carbonate and Method B with 15 mM DIPEA, pyridine, and TEA, and 590 mM TEA and DIPEA. These methods were chosen because in the initial study (Fig. 2), they had the best performance.
Fig. 3.

Comparison of BzCl percentages for selected bases and base concentrations. DIPEA and TEA at 15 and 590 mM and pyridine at 15 mM with Method B were selected to compare to the standard carbonate method (100 mM carbonate with Method A). Either 0.5, 1, 2, 4, or 8% BzCl was used. Analytes were prepared at 5000 nM and d4-acetylcholine was used as the IS. Signal for each analyte was normalized to the greatest obtained signal per analyte. N = 3 vials per condition with 3 replicate injections each. An increase in BzCl tended to decrease signal.
The results of these studies are summarized in Fig. 3. In most cases, less BzCl provided better signal, which is similar to other investigations showing that moderate to low amounts of BzCl gave better signal than high concentrations [19,23]. Even less BzCl being required with Method B is likely due to activation of BzCl which occurs. The other reports did not activate BzCl. Under some conditions, the trend of less BzCl being needed did not hold for uridine, cytidine, glucosamine, tyrosine, and norepinephrine (Fig. 3).
Some of these conditions improved derivatization compared to the original carbonate methods (Fig. 3). Cortisol was best derivatized with 500 mM DIPEA and low (< 2%) concentrations of BzCl. Glucosamine was best derivatized with 500 mM TEA with moderate (1 or 2%) concentrations of BzCl. Serine was best derivatized with pyridine and high (4 or 8%) concentrations of BzCl. Uridine was best derivatized with 500 mM TEA and 8% BzCl. Marginally improved were lysine with pyridine and 0.5% BzCl and norepinephrine with 15 mM TEA or DIPEA and moderate (1–4%) concentrations of BzCl. Additionally, all analytes were derivatized using 15 mM DIPEA with 0.5% BzCl though not all are improved from the original carbonate method, and all analytes except uridine were derivatized with 15 mM TEA and 0.5% BzCl.
To compare to previous work investigating BzCl concentration [19, 23], we also used Method A with carbonate to explore BzCl concentrations ranging from 1 to 16% when applied to serine, choline, GABA, lysine, tyrosine, and norepinephrine (Supplemental Figure 5). No difference was observed, except for choline. As BzCl increased, signal for choline decreased suggesting too much BzCl deters derivatization of some hydroxyl functional groups.
3.3. Reaction time trials
For Method A with 100 mM carbonate, mixing times between additions of reagents were investigated (see Fig. 1). T1 and T2 were defined as time after sample and carbonate mixture but before BzCl addition (T1) and time before IS/acid addition (T2).
To assess sample degradation in carbonate (T1), sample and carbonate were mixed for 0, 1, 5, or 20 min before addition of BzCl (Fig. 4, Supplemental Figure 6). When comparing immediate addition of BzCl and up to a 20 min wait, no degradation was observed (p > 0.05) for all but norepinephrine. Norepinephrine degraded over time, resulting in a 1.5-fold decrease in signal over 20 min (p < 0.0001).
Fig. 4.

Time trials for the standard carbonate method to assess sample degradation with carbonate and time necessary for reaction. T1 and T2 were defined as time after carbonate and sample mixture but before BzCl addition (T1) and time before quenching with IS/acid addition (T2). Both T1 and T2 were defined as 0, 1, 5, or 20 min. During the 1, 5, and 20 min periods, samples were continuously mixed. For the 0 min time points, samples were briefly vortexed before addition of the next component. Analytes were prepared at 5000 nM and d4-acetylcholine was used as IS. N = 3 vials per condition with 3 replicate injections each. Arbitrary unit (a.u.). Graphed as mean ± 1 SD.
We next assessed the time necessary for benzoylation, or T2 (Fig. 4, Supplemental Figure 6). While derivatization has been shown to occur quickly [7,18,21] some reports allow the reaction to carry out for up to 20 min [3,24,26,40]. Another report showed slightly increasing signal up to 20 min [23]. After BzCl addition, samples were mixed for 0, 1, 5, or 20 min before adding IS/acid and quenching the reaction. Mixed results were observed for reaction time with T1 = 0. For seven analytes (adenosine, choline, cortisol, GABA, glucose, lysine, and norepinephrine), signal significantly improved after 20 min; however, signal significantly decreased for estradiol and serine. The most significant improvement in signal was only 1.16-fold, signifying that: A) extended wait times and B) sacrificing signal for some components is not necessary. Further, extended times were detrimental in some cases. When T1 = 20 min, a statistically significant signal decrease was observed as time before quenching the reaction (T2) increased for 11 analytes (p < 0.05 for all), though cortisol was not affected. The amount of decrease was not always substantial but was consistent for these analytes.
We also assessed the time necessary for the reaction to occur with Method B using 15 mM DIPEA and 0.5% BzCl due to its wide coverage of analytes (Supplemental Figure 7). T1, T2, and T3 were defined as time after combining base and BzCl but before adding sample (T1), after adding sample (T2), and after adding carbonate buffer (T3). T1, T2, and T3 lasted either 0, 1, 5, or 20 min with constant agitation throughout. For 0 min, samples were briefly vortexed. For adenosine, choline, cortisol, cytidine, estradiol, GABA, glucosamine, serine, and uridine, time was very important. For all of these except uridine, the majority of time combinations performed worse than rapid additions of all components. Though some time combinations produced greater signal for some analytes, it was not consistent across compounds. Thus, maintaining short time of reaction was selected for further testing.
3.4. Achievable limits of detection and sensitivity
Based on performance in the previous experiments, we selected three conditions to identify limits of detection (LODs) and sensitivity and compared them against the standard carbonate method (Method A with 100 mM carbonate) as summarized in Table 1. The yield for these reaction conditions is given in Supplemental Table 2. The selected methods were: 1) Method B with 15 mM DIPEA and 0.5% BzCl because all test analyzed were derivatized with this method and signal was relatively strong. 2) Method B with 890 mM carbonate and 2% BzCl because it held promise for difficult to derivatize analytes (choline, glucosamine, and uridine) and performed better for these analytes than Method A with 100 mM carbonate. 3) Method A with 890 mM carbonate and 2% BzCl because a trend in signal as carbonate concentration increased was observed for some analytes and good coverage was enabled. Overall, the standard carbonate method is the most sensitive (Table 1), though it is not well suited for derivatizing some nucleosides (cytidine and uridine) and analytes with hydroxyl functional groups (choline, cortisol, glucosamine). Method B with 890 mM carbonate is favorable for detection of both nucleosides (adenosine, cytidine, uridine) and steroids (cortisol, estradiol). It is also suitable for detection of GABA, lysine, tyrosine, and norepinephrine. Chromatograms for these two conditions are given in the supplemental material (Supplemental Figure 8).
Table 1.
Detection limits, linearity, and sensitivity of selected methods. The standard carbonate method was compared to 15 mM DIPEA with Method B and 890 mM carbonate with both Method B and Method A. Values are the result of 3 calibration curves analyzed in triplicate.
| Ser +1Bz |
Cho +1Bz |
GABA +1Bz |
Lys +2Bz |
Cyt +2Bz |
Ado +2Bz |
Tyr +2Bz |
Uri +1Bz |
NE +3Bz |
Cort +1Bz |
Estra +1Bz |
GluN +3Bz |
||
|---|---|---|---|---|---|---|---|---|---|---|---|---|---|
| LOD (nM) | Carbonate, standard (Method A) | 230 | 170 | 24 | 19 | 180 | 3 | 40 | 1000 | 0.7 | 86 | 3 | > 5000 |
| 880 mM carbonate, Method A | 1200 | 10 | 33 | 10 | 67 | 4 | 48 | 700 | 0.4 | 290 | 7 | > 5000 | |
| 15 mM DIPEA, Method B | 560 | 9 | 26 | 6 | 400 | 5 | 90 | 1800 | 1 | 520 | 4 | 1100 | |
| 880 mM carbonate, Method B | 310 | 47 | 21 | 8 | 75 | 2 | 59 | 170 | 0.5 | 38 | 10 | > 5000 | |
| R2 | Carbonate, standard (Method A) | 0.986 | 0.979 | 0.989 | 0.992 | 0.881 | 0.981 | 0.994 | 0.913 | 0.993 | 0.936 | 0.993 | |
| 880 mM carbonate, Method A | 0.954 | 0.994 | 0.989 | 0.993 | 0.986 | 0.996 | 0.997 | 0.672 | 0.997 | 0.977 | 0.987 | ||
| 15 mM DIPEA, Method B | 0.970 | 0.998 | 0.988 | 0.993 | 0.941 | 0.984 | 0.992 | 0.702 | 0.997 | 0.767 | 0.994 | 0.746 | |
| 880 mM carbonate, Method B | 0.982 | 0.996 | 0.994 | 0.995 | 0.993 | 0.995 | 0.994 | 0.899 | 0.996 | 0.984 | 0.988 | ||
| Slope | Carbonate, standard (Method A) | 1.78 | 6.31 | 56.1 | 45 | 0.0804 | 45.9 | 106 | 0.289 | 217 | 0.228 | 58.5 | |
| 880 mM carbonate, Method A | 1.08 | 12.6 | 16.4 | 15.9 | 0.292 | 59.1 | 65.1 | 0.169 | 156 | 0.401 | 38 | ||
| 15 mM DIPEA, Method B | 0.225 | 2.57 | 12.2 | 18.5 | 0.0464 | 24.1 | 25.9 | 0.0644 | 149 | 0.316 | 34.3 | 0.161 | |
| 880 mM carbonate, Method B | 0.509 | 6.27 | 9.09 | 14.3 | 0.26 | 46.1 | 44.4 | 0.181 | 130 | 0.226 | 23.5 |
Specifically, Method B with 890 mM carbonate yielded better detection limits (compared to the standard carbonate method) for choline, lysine, cytidine, adenosine, uridine, norepinephrine, and cortisol with 3.6-, 2.4-, 2.4-, 1.5-, 6.0-, 1.4-, and 2.3-fold improvement respectively (detection limits of 47, 8, 75, 2, 170, 0.5, and 38 nM respectively). The method was also more sensitive (compared to the standard carbonate method) for cytidine (3.2-fold improved slope, achieving a slope of 0.26 signal intensity/nM), though the standard carbonate method overall excelled with sensitivity, achieving slopes 1.6–6.2-fold greater for seven analytes.
Method B with 15 mM DIPEA and 0.5% BzCl enabled the lowest detection limit for glucosamine (1100 nM, Supplemental Figure 9); but, the poor calibration curve obtained makes the method not suitable for quantification. This condition also led to improved detection of choline with an 18.8-fold improvement in LOD compared to the standard carbonate method, reaching 9 nM, but the method otherwise performed similarly or worse than the standard carbonate method.
Method A with 890 mM carbonate enabled some improved LODs (choline, lysine, cytidine) and was most sensitive for choline and cytidine, enabling LODs of 10 and 67 nM respectively. The method was also more sensitive for adenosine (slope of 59 signal intensity/nM) and provided similar LODs (4 nM) but did not perform as well for other analytes. The yields for the reactions (Supplemental Table 2) generally follow the LODs. That is, conditions that had high yield for a particular analyte with number of labels resulted in the best LOD for that analyte. Many analytes could be labeled so that there was nearly 100% yield for specific degree of benzoylation. Glucosamine, choline, serine, cortisol, and cytidine, had no condition that produced over 90% of a given label. For such analytes it may be useful to track multiple labeled products for quantification.
3.5. Application to biological samples
To assess applicability and performance of the benzoylation methods with biological samples, methods used in the previous section were applied to human plasma, rat brain dialysate, S. cerevisiae (yeast), and E. coli samples. Chromatograms are provided in the supplemental material (Supplemental Figures 10 and 11).
Pooled human plasma was benzoylated with either the standard carbonate method, Method B with 15 mM DIPEA, Method A with 890 mM carbonate, or Method B with 890 mM carbonate (Fig. 5A). Most notably, the two 890 mM carbonate methods enabled detection of cytidine in plasma that was not detectable with the standard carbonate method. Additionally, one or both of the 890 mM carbonate methods yielded more derivatized GABA, adenosine, uridine, and norepinephrine than the standard carbonate method. However, the standard carbonate method derivatized more serine, lysine, tyrosine, cortisol, and estradiol than the other tested methods. Method B wtih 15 mM DIPEA method did not perform as well as the other methods for any of these analytes. Overall, the standard carbonate method is well-suited for derivatization of most of the tested analytes in plasma; however, using Method B with 890 mM carbonate is preferable for nucleosides. These results are in line with our observations using standards.
Fig. 5.
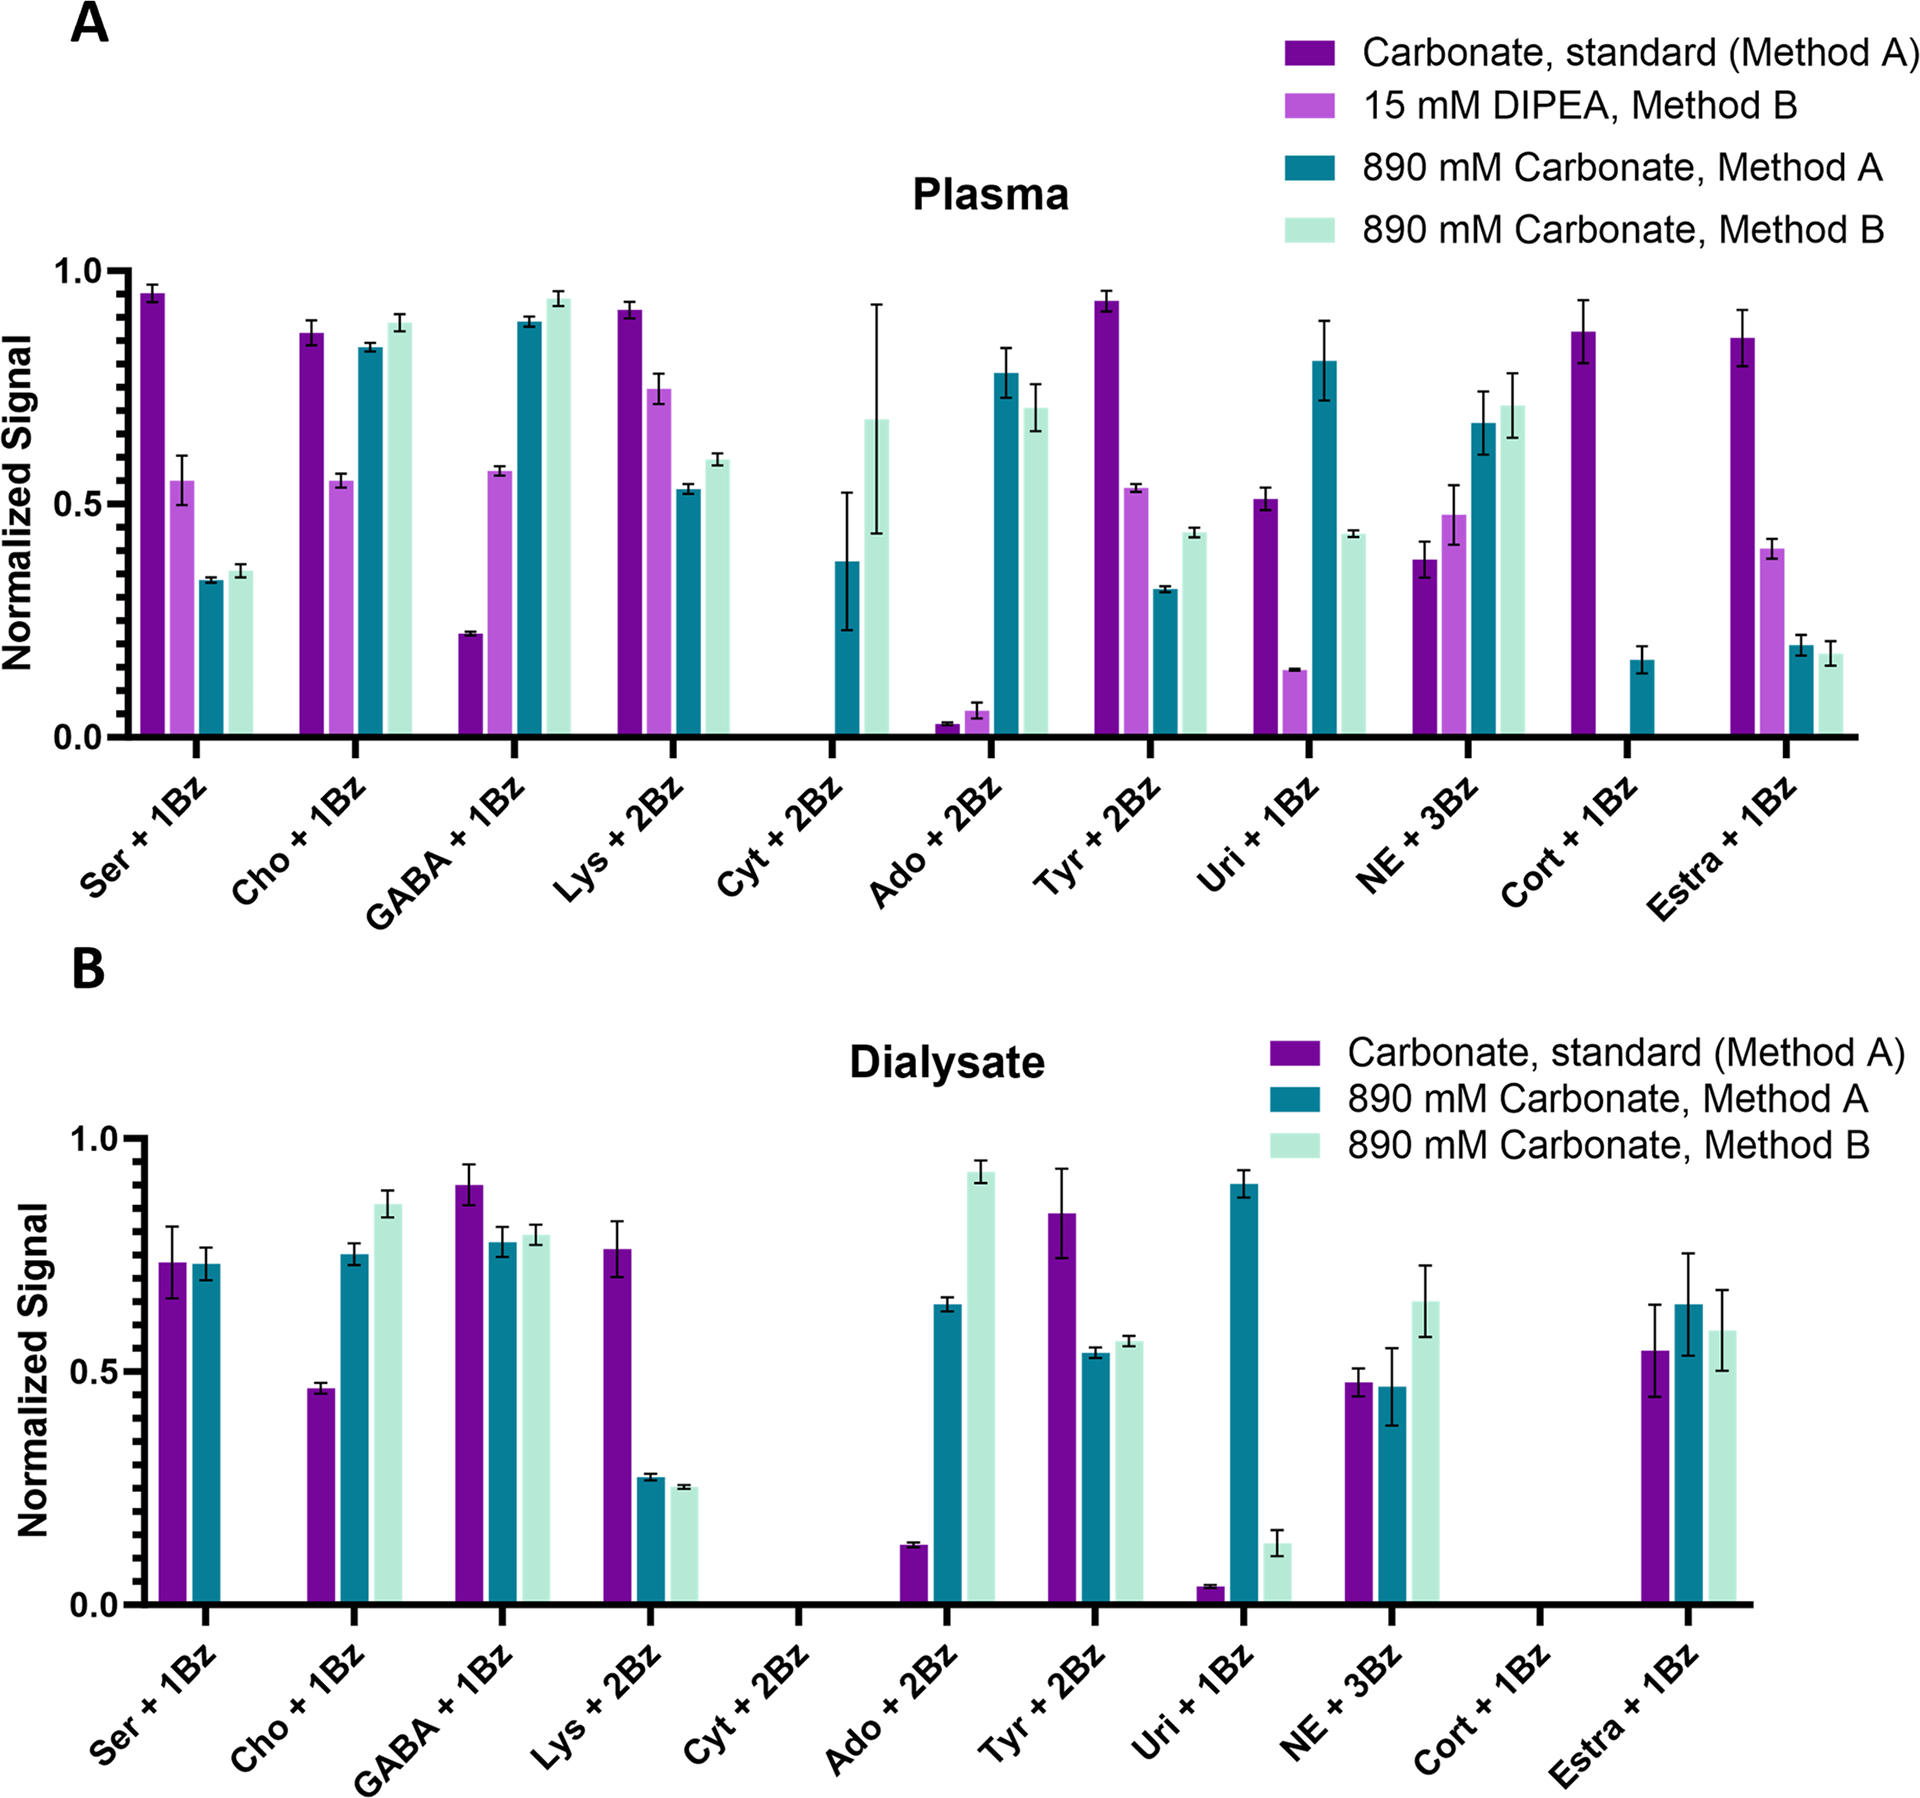
Application of methods to plasma and dialysate. Samples were prepared and analyzed in triplicate. Graphed as mean ± 1SEM. A) For plasma, the standard carbonate method was compared to 15 mM DIPEA in Method B and 890 mM carbonate with both Method A and Method B. B) For dialysate, the standard carbonate method was compared to 890 mM carbonate with both Method A and Method B.
Since Method B with 15 mM DIPEA did not perform well in plasma compared to the other methods, we only applied the standard carbonate method, Method A with 890 mM carbonate, and Method B with 890 mM carbonate to dialysate samples (Fig. 5B). Cytidine and cortisol were not detected with any method. Our detection limits were near basal cortisol levels [41], which is likely why we could not detect cortisol. Other previously measured analytes were detected near expected levels [18]. For choline, lysine, adenosine, tyrosine, uridine, and norepinephrine, the trends between methods are similar to those observed with plasma (e.g., for uridine, the standard carbonate method is not as well suited as Method B using 890 mM carbonate which is not as well suited as Method A using 890 mM carbonate.). Also similarly to plasma, the 890 mM carbonate methods perform better than the standard carbonate method for nucleosides. Unless targeting nucleosides, any of these three derivatization methods perform relatively well for dialysate samples.
The derivatization method expected to perform best for nucleosides, Method B with 890 mM carbonate, was applied to digested tRNA samples obtained from both yeast and E. coli. Samples were derivatized and analyzed in triplicate. Cytidine and adenosine were easily detected in samples from both yeast and E. coli; however, uridine was below the detection limit for the yeast samples. From the yeast samples, 3.0 ng adenosine and 3.3 ng cytidine were observed. From the E. coli samples, 4.1 ng adenosine, 6.5 ng cytidine, and 0.3 ng uridine were detected. Overall, this derivatization method is suitable for measurements in these matrices as well, though uridine is still challenging to detect.
4. Conclusions
Use of BzCl is widespread, largely for derivatization of primary and secondary amines and phenolic alcohols [2,7,18,19,23,26]. It is less used for hydroxyl groups for LC-MS. While reaction time and temperature and derivatizing agent have been studied [4,8,19,23,24], few investigations focus on alternative bases or explore base concentrations [5, 18]. Through our systematic approach, we identified class-specific recommendations, summarized in Table 2. Compared to the standard BzCl method commonly used, alternative methods were identified to better enable derivatization of challenging analytes (glucosamine, choline, cortisol, uridine, cytidine), achieving up to 20-fold detection limit improvements (Table 1). GABA, adenosine, norepinephrine, and estradiol had the most similar limits of detection with methods selected for further analysis while the limits of detection for choline and glucosamine varied widely between methods. In complex biological samples such as dialysate and plasma, these observations hold, e.g., nucleosides were better detected using 890 mM carbonate with Method B than the standard carbonate method in both plasma and dialysate and were detected with that method in yeast and E. coli samples. However, the standard carbonate method is a better option in plasma and dialysate for most non-nucleoside samples. This highlights the importance of screening derivatization methods for a given application. While this work focuses on LC-MS due to the ubiquity of the technique for small molecule determination, [12] it could also be extended to gas chromatography (GC) coupled to MS as functional group derivatization can also aid in GC–MS analysis. [42–44]
Table 2.
Summary of evaluated methods and recommendations for class derivatization. The order of addition for the standard carbonate method (100 mM carbonate) is: Base → Sample → BzCl → IS. Method A: Base → Sample → BzCl → Carbonate → IS. Method B: Base → BzCl → Sample → Carbonate → IS.
| Base | [Base] (mM) |
[BzCl] (%) |
Addition order | Achieved lowest LOD for these analytes | Produced highest LOD for these analytes | Recommended classes |
|---|---|---|---|---|---|---|
| Carbonate | 100 | 2 | Method A | Serine, Tyrosine, Estradiol | Choline, Lysine, Glucosamine | Steroids, Amino acids, Catecholamines |
| DIPEA | 15 | 0.5 | Method B | Choline, Lysine, Glucosamine | Cytidine, Tyrosine, Uridine, Norepinephrine, Cortisol | Sugar amines, Choline, Amino acids, Catecholamines |
| Carbonate | 890 | 2 | Method B | GABA, Adenosine, Uridine, Cortisol | Estradiol, Glucosamine | Nucleosides, Steroids, Amino acids, Catecholamines |
| Carbonate | 890 | 2 | Method A | Cytidine, Norepinephrine | Serine, GABA, Glucosamine | Nucleosides, Choline, Catecholamines |
Supplementary Material
Supplementary material associated with this article can be found, in the online version, at doi:10.1016/j.chroma.2024.464872.
Acknowledgements
We thank Rachel Green for providing E. coli cells and Jonathan Perkins for useful conversation.
Funding
This material is based upon work supported by the National Science Foundation Graduate Research Fellowship program under Grant No. DGE 1841052 (A.E.L.). This work was supported by NIH RF1-NS128522 (R.T.K.).
Declaration of competing interest
The authors declare the following financial interests/personal relationships which may be considered as potential competing interests Robert kennedy reports financial support was provided by National Institutes of Health. If there are other authors, they declare that they have no known competing financial interests or personal relationships that could have appeared to influence the work reported in this paper. Ashley Lenhart reports financial support was provided by the National Science Foundation
Footnotes
Ethics approval
Animal procedures were approved by the University of Michigan Institutional Animal Care and Use Committee and conducted in accordance with the NIH Guide for the Care and Use of Laboratory Animals.
CRediT authorship contribution statement
Ashley E. Lenhart: Conceptualization, Formal analysis, Funding acquisition, Investigation, Methodology, Validation, Visualization, Writing – original draft, Writing – review & editing. Peter-Philip M. Booth: Conceptualization, Formal analysis, Investigation, Methodology, Visualization, Writing – review & editing. Kaley M. Simcox: Resources, Writing – review & editing. Brianna A. Ramos: Resources, Writing – review & editing. Robert T. Kennedy: Conceptualization, Supervision, Funding acquisition, Writing – review & editing.
References
- [1].Bornø A, Foged L, van Hall G, Glucose and glycerol concentrations and their tracer enrichment measurements using liquid chromatography tandem mass spectrometry, J. Mass Spectrom 49 (2014) 980–988, 10.1002/jms.3407. [DOI] [PubMed] [Google Scholar]
- [2].Lenhart AE, Kennedy RT, Monitoring hormone and small molecule secretion dynamics from islets-on-chip, Anal. Bioanal. Chem 415 (2023) 533–544, 10.1007/s00216-022-04460-2. [DOI] [PMC free article] [PubMed] [Google Scholar]
- [3].Fu Y, Zhou Z, Li Y, Lu X, Zhao C, Xu G, High-sensitivity detection of biogenic amines with multiple reaction monitoring in fish based on benzoyl chloride derivatization, J. Chromatogr. A 1465 (2016) 30–37, 10.1016/j.chroma.2016.08.067. [DOI] [PubMed] [Google Scholar]
- [4].Liu S-J, Xu J-J, Ma C-L, Guo C-F, A comparative analysis of derivatization strategies for the determination of biogenic amines in sausage and cheese by HPLC, Food Chem. 266 (2018) 275–283, 10.1016/j.foodchem.2018.06.001. [DOI] [PubMed] [Google Scholar]
- [5].Widner B, Kido Soule MC, Ferrer-González FX, Moran MA, Kujawinski EB, Quantification of amine- and alcohol-containing metabolites in saline samples using pre-extraction benzoyl chloride derivatization and ultrahigh performance liquid chromatography tandem mass spectrometry (UHPLC MS/MS), Anal. Chem 93 (2021) 4809–4817, 10.1021/acs.analchem.0c03769. [DOI] [PubMed] [Google Scholar]
- [6].Hamid AA, Pettibone JR, Mabrouk OS, Hetrick VL, Schmidt R, Vander Weele CM, et al. , Mesolimbic dopamine signals the value of work, Nat. Neurosci 19 (2016) 117–126, 10.1038/nn.4173. [DOI] [PMC free article] [PubMed] [Google Scholar]
- [7].Song P, Mabrouk OS, Hershey ND, Kennedy RT, In Vivo neurochemical monitoring using benzoyl chloride derivatization and liquid chromatography – mass spectrometry, Anal. Chem 84 (2012) 412–419, 10.1021/ac202794q. [DOI] [PMC free article] [PubMed] [Google Scholar]
- [8].Lkhagva A, Shen C-C, Leung Y-S, Tai H-C, Comparative study of five different amine-derivatization methods for metabolite analyses by liquid chromatography-tandem mass spectrometry, J. Chromatogr. A 1610 (2020) 460536, 10.1016/j.chroma.2019.460536. [DOI] [PubMed] [Google Scholar]
- [9].Xu F, Zou L, Liu Y, Zhang Z, Ong CN, Enhancement of the capabilities of liquid chromatography–mass spectrometry with derivatization: general principles and applications, Mass Spectrom. Rev 30 (2011) 1143–1172, 10.1002/mas.20316. [DOI] [PubMed] [Google Scholar]
- [10].Santa T, Derivatization reagents in liquid chromatography/electrospray ionization tandem mass spectrometry, Biomed. Chromatogr 25 (2011) 1–10, 10.1002/bmc.1548. [DOI] [PubMed] [Google Scholar]
- [11].Qi B-L, Liu P, Wang Q-Y, Cai W-J, Yuan B-F, Feng Y-Q, Derivatization for liquid chromatography-mass spectrometry, TrAC Trend. Anal. Chem 59 (2014) 121–132, 10.1016/j.trac.2014.03.013. [DOI] [Google Scholar]
- [12].James P Grinias J.-M.T.W. Using benzoyl chloride derivatization to improve small-molecule analysis in biological samples by LC–MS/MS 2017;35:760–8. [Google Scholar]
- [13].Kuehnbaum NL, Britz-McKibbin P, New advances in separation science for metabolomics: resolving chemical diversity in a post-genomic era, Chem. Rev 113 (2013) 2437–2468, 10.1021/cr300484s. [DOI] [PubMed] [Google Scholar]
- [14].Zhu Y, Deng P, Zhong D, Derivatization methods for LC-MS analysis of endogenous compounds, Bioanalysis. 7 (2015) 2557–2581, 10.4155/bio.15.183. [DOI] [PubMed] [Google Scholar]
- [15].Zestos AG, Kennedy RT, Microdialysis coupled with LC-MS/MS for in vivo neurochemical monitoring, AAPS. J 19 (2017) 1284–1293, 10.1208/s12248-017-0114-4. [DOI] [PMC free article] [PubMed] [Google Scholar]
- [16].Peterka O, Jirásko R, Vaňková Z, Chocholoušková M, Wolrab D, Kulhánek J, et al. , Simple and reproducible derivatization with benzoyl chloride: improvement of sensitivity for multiple lipid classes in RP-UHPLC/MS, Anal. Chem 93 (2021) 13835–13843, 10.1021/acs.analchem.1c02463. [DOI] [PubMed] [Google Scholar]
- [17].Tang Z, Guengerich FP, Dansylation of unactivated alcohols for improved mass spectral sensitivity and application to analysis of cytochrome P450 oxidation products in tissue extracts, Anal. Chem 82 (2010) 7706–7712, 10.1021/ac1015497. [DOI] [PMC free article] [PubMed] [Google Scholar]
- [18].Wong J-MT, Malec PA, Mabrouk OS, Ro J, Dus M, Kennedy RT, Benzoyl chloride derivatization with liquid chromatography-mass spectrometry for targeted metabolomics of neurochemicals in biological samples, J. Chromatogr. A 1446 (2016) 78–90, 10.1016/j.chroma.2016.04.006. [DOI] [PMC free article] [PubMed] [Google Scholar]
- [19].Cox JM, Butler JP, Lutzke BS, Jones BA, Buckholz JE, Biondolillo R, et al. , A validated LC–MS/MS method for neurotransmitter metabolite analysis in human cerebrospinal fluid using benzoyl chloride derivatization, Bioanalysis. 7 (2015) 2461–2475, 10.4155/bio.15.170. [DOI] [PubMed] [Google Scholar]
- [20].Lenhart AE, Kennedy RT, Evaluation of surface treatments of PDMS microfluidic devices for improving small-molecule recovery with application to monitoring metabolites secreted from islets of Langerhans, ACS. Meas. Sci. Au 3 (2023) 380–389, 10.1021/acsmeasuresciau.3c00025. [DOI] [PMC free article] [PubMed] [Google Scholar]
- [21].Ogunkunle EO, Donohue MJ, Steyer DJ, Adeoye DI, Eaton WJ, Roper MG, Small molecules released from islets of Langerhans determined by liquid chromatography – mass spectrometry, Anal. Methods (2022), 10.1039/D2AY00402J. [DOI] [PMC free article] [PubMed] [Google Scholar]
- [22].Widner B, Soule MCK, Ferrer-Gonzalez FX, Moran MA, Kujawinski EB Superior and novel detection of small, polar metabolites in saline samples using pre-extraction Benzoyl chloride derivatization and ultra-high performance liquid chromatography tandem mass spectrometry (UHPLC MS/MS). 2020. 10.26434/chemrxiv.12915488.v1. [DOI] [PubMed] [Google Scholar]
- [23].Li T, Wang R, Wang P, The Development of an ultra-performance liquid chromatography–tandem mass spectrometry method for biogenic amines in fish samples, Molecules. 28 (2023) 184, 10.3390/molecules28010184. [DOI] [PMC free article] [PubMed] [Google Scholar]
- [24].Hwang D-F, Chang S-H, Shiua C-Y, Chai Tuu-jyi, High-performance liquid chromatographic determination of biogenic amines in fish implicated in food poisoning, J. Chromatogr. B: Biomed. Sci. Appl 693 (1997) 23–30, 10.1016/S0378-4347(97)00067-4. [DOI] [PubMed] [Google Scholar]
- [25].Özogul F, Taylor KDA, Quantick P, Özogul Y, Biogenic amines formation in Atlantic herring (Clupea harengus) stored under modified atmosphere packaging using a rapid HPLC method, Int J of Food Sci Tech 37 (2002) 515–522, 10.1046/j.1365-2621.2002.00608.x. [DOI] [Google Scholar]
- [26].Ozdestan O, Uren A, A method for benzoyl chloride derivatization of biogenic amines for high performance liquid chromatography, Talanta 78 (2009) 1321–1326, 10.1016/j.talanta.2009.02.001. [DOI] [PubMed] [Google Scholar]
- [27].Malec PA, Oteri M, Inferrera V, Cacciola F, Mondello L, Kennedy RT, Determination of amines and phenolic acids in wine with benzoyl chloride derivatization and liquid chromatography–mass spectrometry, J. Chromatogr. A 1523 (2017) 248–256, 10.1016/j.chroma.2017.07.061. [DOI] [PubMed] [Google Scholar]
- [28].Sano T, Remarkably fast acylation of alcohols with benzoyl chloride promoted by TMEDA, Synthesis. (Mass) 1999 (1999) 1141–1144, 10.1055/s-1999-3521. [DOI] [Google Scholar]
- [29].Lee Han-Bin, Kim Sung Soo, TMEDA: efficient and mild catalyst for the acylation of alcohols, phenols and thiols under solvent-free condition, Bull Korean Chem. Soc 30 (2009) 1071–1076, 10.5012/BKCS.2009.30.5.1071. [DOI] [Google Scholar]
- [30].Tepper AD, Van Blitterswijk WJ, Ceramide mass analysis by normal-phase high-performance liquid chromatography, Meth. Enzymol 312 (2000) 16–22, 10.1016/S0076-6879(00)12896-4. [DOI] [PubMed] [Google Scholar]
- [31].Hisamatsu S, Suzuki S, Kohmoto S, Kishikawa K, Yamamoto Y, Motokawa R, et al. , A chemiluminescence sensor with signal amplification based on a self-immolative reaction for the detection of fluoride ion at low concentrations, Tetrahedron. 73 (2017) 3993–3998, 10.1016/j.tet.2017.05.084. [DOI] [Google Scholar]
- [32].Shi M, Ye N, Chen W, Wang H, Cheung C, Parmentier M, et al. , Simple synthesis of amides via their acid chlorides in aqueous TPGS-750-M, Org. Process. Res. Dev 24 (2020) 1543–1548, 10.1021/acs.oprd.0c00303. [DOI] [Google Scholar]
- [33].Asundaria ST, Patel NS, Patel KC, Synthesis, characterization, and antimicrobial studies of novel 1,3,4-thiadiazolium-5-thiolates, Med. Chem. Res 21 (2012) 1199–1206, 10.1007/s00044-011-9632-2. [DOI] [Google Scholar]
- [34].Kaiya T, Fujiwara T, Kohda K, Syntheses and Properties of 1-Methyl-3-phenyla-minobenzimidazolium Salts, Models of DNA Adducts of N7-Arylaminodeoxyguanosinium Salt, Chem. Res. Toxicol 13 (2000) 993–1001, 10.1021/tx0000724. [DOI] [PubMed] [Google Scholar]
- [35].Carosso S, Miller MJ, Syntheses and studies of new forms of N-sulfonyloxy β-lactams as potential antibacterial agents and β-lactamase inhibitors, Bioorg. Med. Chem 23 (2015) 6138–6147, 10.1016/j.bmc.2015.08.005. [DOI] [PMC free article] [PubMed] [Google Scholar]
- [36].Keivanloo A, Bakherad M, Samangooei S, Synthesis of 3,5-disubstituted-1H-pyrazoles from acid chlorides, alkynes, and hydrazine in the presence of silica-supported-zinc bromide, J. Chem. Res 39 (2015) 484–486, 10.3184/174751915X14382642961716. [DOI] [Google Scholar]
- [37].Hieu Tran V, Giang Luu T, Thu Nguyen A, K Kim H, Direct transformation of benzyl esters into esters, amides, and anhydrides using catalytic ferric(III) chloride under mild conditions, Org. Biomol. Chem 21 (2023) 8494–8499, 10.1039/D3OB01443F. [DOI] [PubMed] [Google Scholar]
- [38].Hubbard P, Brittain WJ, Mechanism of amine-catalyzed ester formation from an acid chloride and alcohol, J. Org. Chem 63 (1998) 677–683, 10.1021/jo9716643. [DOI] [PubMed] [Google Scholar]
- [39].Oehlke J, Brudel M, Blasig IE, Benzoylation of sugars, polyols and amino acids in biological fluids for high-performance liquid chromatographic analysis, J. Chromatogr. B: Biomed. Sci. Appl 655 (1994) 105–111, 10.1016/0378-4347(94)00067-0. [DOI] [PubMed] [Google Scholar]
- [40].Redmond JW, Tseng A, High-pressure liquid chromatographic determination of putrescine, cadaverine, spermidine and spermine, J. Chromatogr. A 170 (1979) 479–481, 10.1016/S0021-9673(00)95481-5. [DOI] [Google Scholar]
- [41].Gong S, Miao Y-L, Jiao G-Z, Sun M-J, Li H, Lin J, et al. , Dynamics and correlation of serum cortisol and corticosterone under different physiological or stressful conditions in mice, PLoS ONE 10 (2015) e0117503, 10.1371/journal.pone.0117503. [DOI] [PMC free article] [PubMed] [Google Scholar]
- [42].Ligon WV, Grade Hans, Techniques for postcolumn derivatization in gas chromatography/mass spectrometry, Anal. Chem 63 (1991) 255–261, 10.1021/ac00003a013. [DOI] [Google Scholar]
- [43].Sogin EM, Puskás E, Dubilier N, Liebeke M, Marine metabolomics: a method for nontargeted measurement of metabolites in seawater by gas chromatography-mass spectrometry, mSystems. 4 (19) (2019) e00638, 10.1128/mSystems.00638-19. [DOI] [PMC free article] [PubMed] [Google Scholar]
- [44].Peña J, Laespada MEF, Pinto CG, Pavón JLP, Development of a method for the determination of polyamines including N-acetylated forms in human saliva via benzoylation and gas chromatography-mass spectrometry, J. Chromatogr. A 1651 (2021) 462278, 10.1016/j.chroma.2021.462278. [DOI] [PubMed] [Google Scholar]
Associated Data
This section collects any data citations, data availability statements, or supplementary materials included in this article.