



Abstract
Background
This study aimed to investigate whether A1AT (α‐1 antitrypsin) bloodstream levels, measured acutely after ischemic stroke, can predict the outcome of patients with stroke.
Methods and Results
Two cohorts of patients with stroke were studied independently and retrospectively: a pilot cohort of 59 patients and a larger replicative study with 527 patients. Blood samples were drawn at hospital admission (<6 hours after stroke onset) before any treatment was given. A1AT levels were analyzed. Patients were followed after the event, and functional outcomes were evaluated at in‐hospital (discharge) and midterm (third month) follow‐up according to the modified Rankin Scale (considering modified Rankin Scale score >2 a poor outcome). Association studies between A1AT levels and functional outcomes were conducted. We also evaluated the added value of A1AT as a prognostic biomarker over the clinical model (sex, age, premorbid modified Rankin Scale and National Institutes of Health Stroke Scale scores) with the likelihood ratio test. In both studies, the levels of A1AT were higher in patients who had worse outcomes, were older, and had higher National Institutes of Health Stroke Scale scores at admission. In the pilot study, higher levels of A1AT were also associated with death at discharge and at 3 months after stroke (P=0.035 and P=0.023, respectively). The addition of A1AT to the clinical model did not show enough evidence of increasing the fit of the model to the data in either cohort.
Conclusions
Based on our data, we cannot claim that A1AT is an independent biomarker of ischemic stroke. Nevertheless, A1AT is potentially involved in stroke outcomes and might be explored as a potential therapeutic target.
Keywords: A1AT, biomarker, outcome, stroke
Subject Categories: Cerebrovascular Disease/Stroke, Ischemic Stroke
Nonstandard Abbreviations and Acronyms
- A1AT
α‐1 antitrypsin
- mRS
modified Rankin Scale
- NIHSS
National Institutes of Health Stroke Scale
- tPA
tissue plasminogen activator
Research Perspective.
What Is New?
Our study reveals that A1AT (α‐1 antitrypsin) has a role in stroke prognosis. Specifically, higher levels of A1AT in the acute phase seem to be associated with poor outcomes after ischemic stroke.
What Are the Clinical Implications?
The present study reinforces the importance of further investigating the role of A1AT in the acute phase of stroke for guiding decision‐making processes on the management and treatment of patients with ischemic stroke.
Stroke is considered the second leading cause of both disability and death worldwide. Almost 50% of stroke survivors present disability following the event. 1 Preventing death and disability caused by stroke is a major research aim, and rapid diagnosis and treatment can ameliorate the consequences provoked by ischemia. Identifying patients who are more likely to have poor outcomes might be important for guiding proper therapy management. 2
From the neurologist's perspective, predicting clinical and functional outcomes after acute ischemic stroke is challenging. Stroke outcome is known to be strongly influenced by the baseline demographic and clinical characteristics of patients and the cause and location of the stroke, among many other factors. 3 However, clinical complications that occur later during the course of the disease, including hemorrhagic transformations, cerebral edema, infections, or recurrent events, might also be key factors that affect stroke morbidity. 4 , 5 , 6 In this scenario, the identification of blood biomarkers that aid in predicting patients with stroke outcomes might help clinicians select those patients who should be admitted to specific stroke care units or ongoing clinical trials to ensure ideal patient treatment and improve patient outcomes. 7 To date, there has been an increase in the literature assessing the association of blood biomarkers with patient outcomes after stroke, but the clinical value of these biomarkers in guiding decision‐making strategies remains uncertain. 8
A1AT (α‐1 antitrypsin) is the most abundant serine proteinase inhibitor in human blood. The standard plasma concentration of A1AT typically ranges from 80 to 220 mg/dL. 9 Its main function is to inhibit neutrophil elastase, but it also has anti‐inflammatory and antiapoptotic properties and is involved in proteostasis. 10 , 11 Additionally, several studies have suggested that A1AT might play a role in the stability of arterial walls, because there is an association between A1AT levels and the formation and rupture of intracranial and aortic aneurysms. 12 , 13 , 14 Severe A1AT deficiency has been linked to the development of emphysema, bronchiectasis, and liver disease. 15 In contrast, A1AT has been shown to increase rapidly in the circulation during acute systemic inflammatory responses, including stroke. In this regard, higher levels of A1AT in the bloodstream are also associated with an elevated risk of developing stroke. 16 However, the association between A1AT and stroke outcome and its possible role as a biomarker for stroke prognosis remain unknown. 2
This study aimed to determine whether circulating A1AT levels measured acutely after ischemic stroke (hereafter referred to a stroke) could predict patients with stroke outcomes in the subacute phase (at discharge) and in the midterm (3 months).
METHODS
Data Availability
The data that support the findings of this study are available from the corresponding author upon reasonable request.
Study Design and Population
In this study, 2 analyses were performed: a first pilot study and a subsequent replication study. In both cohorts, samples from the Blood Biomarkers for the Early Diagnosis of Stroke: The Stroke‐CHIP Study cohort were analyzed. The Stroke‐CHIP study was an observational, retrospective, and multicenter study performed at the emergency departments of 6 hospitals in Catalonia from August 2012 to November 2013. 17 The inclusion criteria for this study included the following parameters: suspected stroke at the first medical assessment with persistent symptoms when arriving at the emergency room, age >18 years, <6 hours from symptom onset to blood sample collection, blood collection preceding thrombolytic treatment with tPA (tissue‐type plasminogen activator) (if eligible), and signed informed consent. The present study has adhered to the Strengthening the Reporting of Observational Studies in Epidemiology (STROBE) guidelines. 18
For the pilot study, patients with acute ischemic stroke admitted to the emergency department at Hospital Universitari Vall d'Hebron (Barcelona, Spain) within the first 6 hours after symptom onset were prospectively studied. A total of 81 patients with ischemic stroke were recruited. Three of these patients with ischemic stroke received tPA at a standard 0.9 mg/kg dose (10% bolus, 90% continuous infusion for 1 hour), 21 patients were subjected to mechanical thrombectomy, and 2 patients underwent both reperfusion strategies. In the replication study, patients' samples were from different centers. Samples from 863 patients with ischemic stroke were studied; 312 patients with stroke received tPA at a standard 0.9 mg/kg dose (10% bolus, 90% continuous infusion for 1 hour), 52 patients were subjected to mechanical thrombectomy, and 30 patients underwent both reperfusion strategies. Excluding treated patients, the number of patients in the pilot and replication study were 59 and 527, respectively.
Clinical Protocol
The study was approved by the Hospital Universitari Vall d'Hebron Clinical Research Ethics Committee as the coordinating center (PR[AG]80/2012) and by all participating centers and was conducted in accordance with the Declaration of Helsinki. All patients or their relatives provided informed consent. A detailed history of vascular risk factors was obtained for each patient. Stroke severity at hospital admission and 24 and 48 hours after admission was assessed using the National Institutes of Health Stroke Scale (NIHSS). The clinical follow‐up of each patient with stroke was performed until the third month after stroke. Functional outcome was evaluated according to the modified Rankin Scale (mRS) 19 ; patients with an mRS score ≤2 were classified as having a good outcome, and patients with an mRS score ranging from 3 to 6 were classified as having a poor outcome.
Blood Sample Collection and A1AT Measurement
Peripheral blood samples were drawn from all patients at hospital admission (<6 hours after stroke onset) before any treatment was given. Blood was collected with ethylenediaminetetraacetic acid tubes and centrifuged at 1500g for 15 minutes at 4 °C, and plasma aliquots were frozen at −80 °C until biomarker analysis.
For the pilot study, ELISA kits were used, and the manufacturer's instructions were followed to quantify the circulating levels of A1AT (catalog number 108799; Abcam, United Kingdom). Optical density was measured using a Synergy Mx microplate reader (BioTek Instruments, United States). Each sample was tested in duplicate, and the mean value of both measurements was used. Samples with a coefficient of variation between duplicates >20% were excluded from the analysis. All samples were within the detectable range of the assay.
In the replication study, A1AT levels were measured by a quantitative immunonephelometry‐based assay (Atellica NEPH 630; Siemens Healthcare Diagnostics), a standard procedure in routine hospital testing, following the manufacturer's guidelines.
Statistical Analysis
R version 4.4.1 was used for the statistical analyses and graph generation. Descriptive tables present medians and interquartile ranges for continuous variables and counts and percentages for categorical variables. For bivariate tables, differences among groups were assessed with the Wilcoxon‐Mann‐Whitney rank sum test for continuous variables and the χ2 test for categorical variables. Analyses of both cohorts were conducted independently with no shared data. In all analyses, we treated NIHSS and mRS scores as continuous variables. For all tests, P values <0.05 were considered statistically significant.
Due to the treatment imbalance present between cohorts, analysis was focused on the subset of untreated patients (patients with ischemia not treated with either thrombolysis or mechanical thrombectomy). Nevertheless, sensitivity analyses on results including the 2 treatment groups were also performed.
To quantify A1AT raw discriminant capability, measured levels of the protein were plotted for relevant outcome groups and compared with the Wilcoxon‐Mann‐Whitney test. An estimate of the C statistic (area under the receiver operating characteristic curve) and its 95% CI were calculated through 2000 stratified bootstrap resampling.
Binary logistic regression models were fitted in the pilot and replication studies independently for prognosis (poor outcome: mRS >2 versus good outcome: mRS ≤2) at hospital discharge and 3 months after the episode. All models included sex, age, premorbid mRS score, and NIHSS score. The likelihood ratio test was used to determine A1AT's added value over the clinical model.
Pilot study models are fitted using a complete case analysis paradigm. In the replication study, missing values were multiple imputed using predictive mean matching‐based methods (aregImpute from the rms R package) with 40 iterations. Regression coefficients were averaged across all imputations, and variance–covariance matrices were corrected according to the Rubin rule. All modeled variables were used for imputation. The adequacy of the imputation model was evaluated by comparing distributions of imputed values with complete data.
For each model, we obtained the C statistic (area under the receiver operating characteristic curve), R 2 (Nagelkerke), Brier score, and calibration intercept and slope. These metrics were internally validated using bootstrap optimism estimation (2000 resamples).
To examine alternative clinical outcomes, logistic regression models for the NIHSS score at 48 hours (proportional odds, ordinal) and exitus at 3 months (dichotomic) were also fitted for replication cohort.
The agreement of nephelometry measurements with ELISA values was assessed using Bland‐Altman agreement plot on a set of samples.
RESULTS
This study was conducted in 2 phases. Initially, a pilot study involved 59 patients with ischemic stroke. To validate the findings of the pilot study, a replication study was conducted, increasing the sample size to 527. The demographic characteristics and risk factor profiles of the patients included in the pilot study and replication study are shown in Table 1. Both studies were comparable in terms of most of their demographic characteristics. However, in the pilot study, patients exhibited higher NIHSS scores at admission (pilot: 10 [6–16] versus replication 4 [2–9]). Additionally, in the replication study, the percentage of patients with mRS=0 was double that of the pilot study (60% versus 29%, respectively). Samples of the pilot study were analyzed by ELISA, whereas samples of the replication study were analyzed by nephelometry. Measurement comparison on an independent set of samples demonstrated a correlation between results obtained by both techniques (R 2=0.928, r=0.96, P<0.001) but also a bias along the concentration range (Figure S1).
Table 1.
Demographic and Clinical Information From Patients Included in Both the Pilot and Replication Studies
| Characteristic | Pilot | Replication |
|---|---|---|
| N=59 | N=527 | |
| A1AT (mg/dL) | 124 (101–162) | 156 (139–178) |
| Age, y | 76 (66–82) | 76 (65–83) |
| Sex (women) | 29 (49%) | 248 (47%) |
| NIHSS score admission | 10.0 (6.0–16.0) | 4 (2–9) |
| Smoker | 6 (11%) | 79 (15%) |
| Arterial hypertension | 44 (75%) | 395 (75%) |
| Diabetes | 18 (31%) | 146 (28%) |
| Dyslipidemia | 31 (53%) | 246 (47%) |
| Atrial fibrillation | 17 (29%) | 175 (33%) |
| Previous stroke | 11 (19%) | 114 (22%) |
| Previous mRS score | ||
| 0 | 17 (29%) | 305 (60%) |
| 1 | 26 (45%) | 55 (11%) |
| 2 | 7 (12%) | 41 (8.1%) |
| 3 | 3 (5.2%) | 71 (14%) |
| 4 | 5 (8.6%) | 33 (6.5%) |
| 5 | 3 (0.6%) | |
| OCSP | ||
| TACI | 22 (37%) | 100 (24%) |
| PACI | 25 (42%) | 183 (43%) |
| LACI | 7 (12%) | 102 (24%) |
| POCI | 5 (8.5%) | 39 (9.2%) |
| Infarct TOAST | ||
| Atherothrombotic or great vase atherosclerosis | 10 (17%) | 63 (12%) |
| Cardioembolic | 21 (36%) | 196 (38%) |
| Lacunar or small vase disease | 6 (10%) | 98 (19%) |
| Other infrequent cases | 0 (0%) | 9 (1.7%) |
| Undetermined | 22 (37%) | 155 (30%) |
| Edema | 3 (5.1%) | 11 (2.1%) |
Data are expressed as the n (%) or median (interquartile range). A1AT indicates α‐1 antitrypsin; LACI, lacunar infarct; mRS, modified Rankin Scale; NIHSS, National Institutes of Health Stroke Scale; OCSP, Oxfordshire Community Stroke Project; PACI, partial anterior circulation infarct; POCI, posterior circulation infarct; TACI, total anterior circulation infarct; and TOAST, Trial of Org 10172 in Acute Stroke Treatment.
To evaluate the relationship between A1AT levels and the prognosis of patients with stroke, we first performed bivariate analyses of the outcomes of the patients both at discharge (in‐hospital outcome) and after 3 months (midterm outcome). In both studies, patients with worse outcomes both in‐hospital and midterm had higher baseline levels of A1AT and presented higher NIHSS scores at admission. In the pilot study, the number of patients with diabetes who had poor outcomes was higher than those with good outcomes (both at discharge and midterm). There were also differences between the causes of stroke, with cardioembolic stroke being the most reported (in percentage) in the replication study. Similarly, in the replication study, the percentages of women with poor outcomes were higher at discharge and at the midterm follow‐up compared with men. Moreover, there also were differences in previous mRS scores and outcome in the replication study, presenting higher previous mRS scores in those patients with poor outcomes than those with good outcomes, both at discharge and midterm (Table 2).
Table 2.
Bivariate Analysis of Clinical Characteristics Associated With In‐Hospital and Midterm Functional Outcomes
| Characteristic | Pilot, discharge | Pilot, mo | Replication, discharge | Replication, 3 mo | ||||||||
|---|---|---|---|---|---|---|---|---|---|---|---|---|
| Good outcome, mRS ≤2, N=28 | Poor outcome, mRS >2, N=30 | P value* | Good outcome, mRS ≤2, N=30 | Poor outcome, mRS >2, N=27 | P value* | Good outcome, mRS ≤2, N=301 | Poor outcome, mRS >2, N=215 | P value† | Good outcome, mRS ≤2, N=261 | Poor outcome, mRS >2, N=114 | P value† | |
| A1AT (mg/dL) | 114 (94–144) | 146 (106–183) | 0.025 | 116 (97–152) | 148 (109–189) | 0.025 | 153 (134–173) | 162 (143–186) | <0.001 | 151 (135–172) | 167 (146–188) | <0.001 |
| Age, y | 74 (64–81) | 79 (66–82) | 0.3 | 73 (64–80) | 79 (67–83) | 0.14 | 71 (60–80) | 82 (74–87) | <0.001 | 71 (60–79) | 82 (75–87) | <0.001 |
| Sex (women) | 16 (57%) | 13 (43%) | 0.3 | 16 (53%) | 11 (41%) | 0.3 | 118 (39%) | 125 (58%) | <0.001 | 104 (40%) | 65 (57%) | 0.002 |
| NIHSS score admission | 7.5 (3.0–10.0) | 15.0 (9.0–20.0) | <0.001 | 8.0 (3.0–10.0) | 13.5 (9.0–20.0) | 0.002 | 2 (1–4) | 11 (4–19) | <0.001 | 2 (1–4) | 11 (5–19) | <0.001 |
| Smoker | 4 (16%) | 2 (7.1%) | 0.4 | 3 (11%) | 2 (8.0%) | >0.9 | 58 (19%) | 18 (8.4%) | <0.001 | 47 (18%) | 11 (9.6%) | 0.039 |
| Arterial hypertension | 20 (71%) | 23 (77%) | 0.6 | 23 (77%) | 20 (74%) | 0.8 | 227 (75%) | 163 (76%) | >0.9 | 192 (74%) | 88 (77%) | 0.5 |
| Diabetes | 5 (18%) | 13 (43%) | 0.036 | 5 (17%) | 13 (48%) | 0.011 | 76 (25%) | 67 (31%) | 0.14 | 62 (24%) | 33 (29%) | 0.3 |
| Dyslipidemia | 14 (50%) | 16 (53%) | 0.8 | 15 (50%) | 15 (56%) | 0.7 | 148 (49%) | 91 (42%) | 0.12 | 123 (47%) | 51 (45%) | 0.7 |
| Atrial fibrillation | 5 (18%) | 12 (40%) | 0.064 | 4 (13%) | 13 (48%) | 0.004 | 72 (24%) | 101 (47%) | <0.001 | 67 (26%) | 59 (52%) | <0.001 |
| Previous stroke | 5 (18%) | 6 (20%) | 0.8 | 4 (13%) | 6 (22%) | 0.5 | 50 (17%) | 63 (29%) | <0.001 | 45 (17%) | 32 (28%) | 0.017 |
| Previous mRS score | ||||||||||||
| 0 | 9 (32%) | 8 (28%) | 0.5 | 11 (38%) | 6 (22%) | 0.10 | 228 (78%) | 73 (35%) | <0.001 | 200 (80%) | 28 (25%) | <0.001 |
| 1 | 12 (43%) | 13 (45%) | 12 (41%) | 12 (44%) | 34 (12%) | 19 (9.1%) | 27 (11%) | 16 (15%) | ||||
| 2 | 6 (21%) | 1 (3.4%) | 5 (17%) | 2 (7.4%) | 21 (7.2%) | 20 (9.6%) | 17 (6.8%) | 12 (11%) | ||||
| 3 | 0 (0%) | 3 (10%) | 0 (0%) | 3 (11%) | 7 (2.4%) | 62 (30%) | 6 (2.4%) | 30 (27%) | ||||
| 4 | 1 (3.6%) | 4 (14%) | 1 (3.4%) | 4 (15%) | 1 (0.3%) | 31 (15%) | 0 (0%) | 22 (20%) | ||||
| 5 | 0 (0%) | 3 (1.4%) | 0 (0%) | 2 (1.8%) | ||||||||
| OCSP | ||||||||||||
| TACI | 4 (14%) | 18 (60%) | <0.001 | 4 (13%) | 17 (63%) | <0.001 | 8 (3.8%) | 91 (46%) | <0.001 | 9 (4.6%) | 52 (51%) | <0.001 |
| PACI | 16 (57%) | 8 (27%) | 18 (60%) | 6 (22%) | 112 (53%) | 65 (33%) | 100 (51%) | 32 (31%) | ||||
| LACI | 6 (21%) | 1 (3.3%) | 5 (17%) | 2 (7.4%) | 71 (33%) | 27 (14%) | 64 (33%) | 12 (12%) | ||||
| POCI | 2 (7.1%) | 3 (10%) | 3 (10%) | 2 (7.4%) | 22 (10%) | 17 (8.5%) | 22 (11%) | 6 (5.9%) | ||||
| Infarct TOAST | ||||||||||||
| Atherothrombotic or great vase atherosclerosis | 6 (21%) | 3 (10%) | 0.12 | 6 (20%) | 4 (15%) | 0.3 | 39 (13%) | 23 (11%) | <0.001 | 35 (14%) | 10 (8.9%) | <0.001 |
| Cardioembolic | 7 (25%) | 14 (47%) | 7 (23%) | 13 (48%) | 89 (30%) | 104 (49%) | 80 (31%) | 58 (52%) | ||||
| Lacunar or small vase disease | 5 (18%) | 1 (3.3%) | 4 (13%) | 2 (7.4%) | 73 (24%) | 21 (10.0%) | 60 (23%) | 11 (9.8%) | ||||
| Other infrequent cases | 0 (0%) | 0 (0%) | 0 (0%) | 0 (0%) | 4 (1.3%) | 5 (2.4%) | 4 (1.6%) | 2 (1.8%) | ||||
| Undetermined | 10 (36%) | 12 (40%) | 13 (43%) | 8 (30%) | 94 (31%) | 58 (27%) | 79 (31%) | 31 (28%) | ||||
| Edema | 0 (0%) | 3 (10%) | 0.2 | 0 (0%) | 3 (11%) | 0.10 | 0 (0%) | 11 (5.2%) | <0.001 | 0 (0%) | 11 (9.6%) | <0.001 |
The data are expressed as n (%) or median (interquartile range). In regard to the patient counts shown in Table 1, in the pilot study, 1 patient (1.69%) with mRS scores was not registered at discharge, and 2 patients (3.39%) were registered at 3 mo. In the replication study, 11 (2.09%) had missing mRS scores at discharge, and 152 (28.84%) had missing mRS scores at 3 mo. A1AT indicates α‐1 antitrypsin; LACI, lacunar infarct; mRS, modified Rankin Scale; NIHSS, National Institutes of Health Stroke Scale; OCSP, Oxfordshire Community Stroke Project; PACI, partial anterior circulation infarct; POCI, posterior circulation infarct; TACI, total anterior circulation infarct; and TOAST, Trial of Org 10172 in Acute Stroke Treatment.
Wilcoxon rank sum exact test, Wilcoxon rank sum test, Pearson χ2 test, Fisher exact test.
Wilcoxon rank sum test, Pearson χ2 test, Fisher exact test.
In investigating the association between A1AT levels and functional outcomes in the hospital and 3 months later, as we have commented previously, we observed that patients with poor outcomes exhibited higher levels of A1AT at hospital admission (Figure 1), as observed in both the pilot (Figure 1A and 1B) and replication studies (Figure 1C and 1D). In this sense, we also found that in the pilot study, 15% of the patients with poor outcomes presented above normal levels of A1AT (>220 mg/dL) at midterm (P=0.044) (Figure 1B and Table S1). In the sensitivity analysis, we compared A1AT values by outcome among groups that included treated patients. A comprehensive description of the full cohort is available in Table S2. The concentration levels showed consistent statistical significance across all subsets at both discharge and 3 months, except for the group consisting only of treated patients (see Table S3 for detailed results).
Figure 1. A1AT levels at admission and their association with functional outcome.
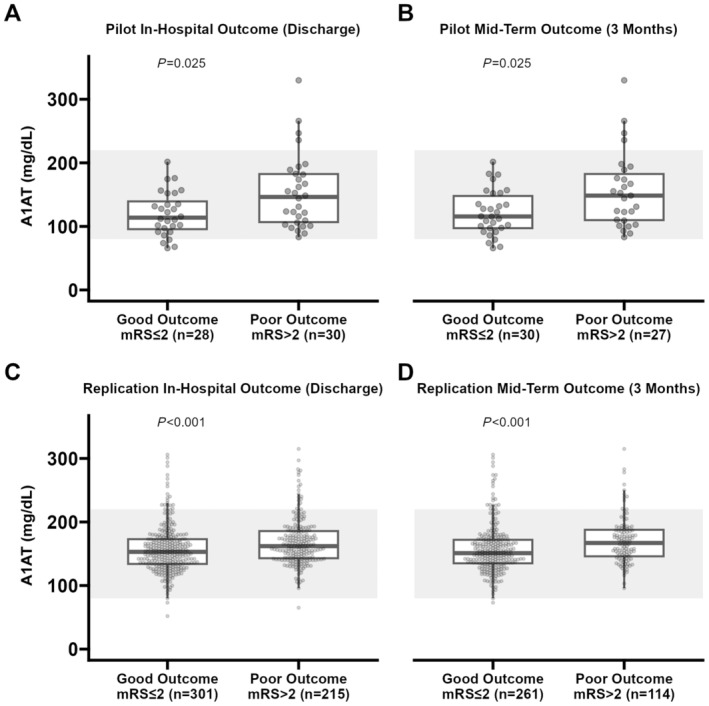
Associations between A1AT levels at admission and in‐hospital (P<0.001) and midterm (P<0.001) functional outcomes in the pilot study (A and B) and in the replication study (C and D). Shaded ribbon represents the normal range of A1AT in the health population, which ranges from 80 to 220 mg/dL. Box plots represent the median and IQR. A1AT indicates α‐1 antitrypsin; and mRS, modified Rankin Scale.
Because we observed that A1AT levels are associated with poorer outcomes in 2 independent cohorts of patients with stroke (Figure 1), we sought to investigate whether A1AT levels were associated with mortality, either during hospitalization or within 3 months (Figure 2). We saw differences in the pilot study, where higher levels of A1AT upon admission were associated with death at discharge (P=0.035) (Figure 2A) and 3 months after the event (P=0.023) (Figure 2B). No statistical differences were found in the replication study either at discharge (Figure 2C) or 3 months later (Figure 2D).
Figure 2. A1AT levels at admission and their association with mortality.
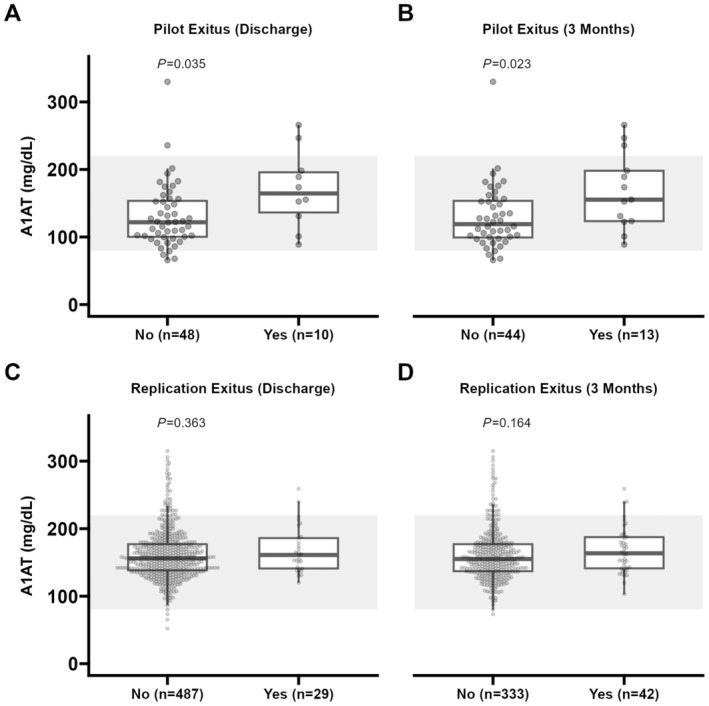
Associations between A1AT levels at admission and in‐hospital and midterm mortality in the pilot study (A and B) and in the replication study (C and D). Shaded ribbon represents the normal range of A1AT in the health population, which ranges from 80 to 220 mg/dL. Box plots represent the median and interquartile range. A1AT indicates α‐1 antitrypsin.
We next sought to determine the crude discriminative ability of A1AT for predicting functional outcomes by constructing receiver operating characteristic curves. In the pilot study, the area under the curve of A1AT for poor outcomes (mRs >2) was 0.675 at discharge (95% CI, 0.531–0.801) and 0.678 (95% CI, 0.531–0.806) in the midterm. In the replication study, the area under the curve estimates of A1AT were lower in both time points, at 0.601 (95% CI, 0.552–0.650) at discharge, and 0.623 (95% CI, 0.561–0.680) at 3 months after discharge.
Next, we evaluated whether A1AT could improve the prediction of worse functional outcomes in combination with conventional clinical risk factors. For this, we created a predictive model for both discharge and midterm stroke outcomes in the pilot study, including sex, age, premorbid mRS score, and NIHSS score (Table 3). According to the likelihood ratio test, the addition of A1AT to the clinical model did not increase the fit of the data to the models in either cohort.
Table 3.
Predictive Models for Poor Outcomes at Hospital Discharge and at Midterm After Stroke
| In‐hospital poor functional outcome | Midterm poor functional outcome | |||
|---|---|---|---|---|
| Pilot | Replication | Pilot | Replication | |
| OR (95% CI) | OR (95% CI) | OR (95% CI) | OR (95% CI) | |
| A1AT (mg/dL) (135.5:176) | 1.536 (0.861–2.737) | 1.055 (0.804–1.384) | 1.403 (0.806–2.441) | 1.115 (0.835–1.489) |
| Age, y (65:83) | 1.632 (0.483–5.513) | 1.401 (0.950–2.067) | 2.846 (0.707–11.458) | 2.077 (1.332–3.239) |
| NIHSS admission (3:14) | 10.093 (2.403–42.385) | 16.614 (8.710–31.688) | 6.444 (1.707–24.332) | 3.747 (2.185–6.426) |
| Previous mRS (0:1) | 1.235 (0.681–2.240) | 1.890 (1.504–2.375) | 1.605 (0.881–2.924) | 1.588 (1.249–2.020) |
| Sex (women) | 0.572 (0.151–2.171) | 1.390 (0.837–2.311) | 0.417 (0.109–1.601) | 0.901 (0.506–1.604) |
| Likelihood ratio test A1AT | =2.44 | =0.15 | =1.56 | =0.51 |
| P value | P=0.118 | P=0.702 | P=0.212 | P=0.474 |
| C statistic (AUC) | 0.849 (0.802) | 0.890 (0.884) | 0.842 (0.785) | 0.846 (0.838) |
| Nagelkerke R 2 | 0.458 (0.337) | 0.582 (0.568) | 0.439 (0.286) | 0.443 (0.421) |
| Intercept | 0.000 (0.010) | 0.000 (−0.019) | 0.000 (0.015) | 0.000 (−0.030) |
| Slope | 1.000 (0.764) | 1.000 (0.964) | 1.000 (0.705) | 1.000 (0.953) |
| Brier Score | 0.159 (0.197) | 0.125 (0.129) | 0.163 (0.208) | 0.142 (0.148) |
OR estimates for continuous variables for interquartile range shift (between parentheses, first column). Greater ORs represent greater associations with poorer outcomes, and ORs <1 represent stronger associations with a good prognosis. χ2 represents the value of the likelihood ratio test statistic. The C statistic (AUC) shows the probability of concordance of the risk score predicted by the model with the outcome, with 1 indicating complete concordance and 0.5 indicating total uncertainty. Nagelkerke R 2 shows model improvement from a null model, and a value of 1 indicates a perfect fit to the data. Intercept and slope are calibration measures describing the relation of model‐predicted risks with those observed; a slope of 1 and an intercept of 0 indicate a perfect risk description, and the values under these figures reveal the overestimation of risk growth or average risk, respectively. The Brier score is the average quadratic error score of the predicted risk. Values in parentheses are optimism corrected bootstrap estimates, B=2000. A1AT indicates α‐1 antitrypsin; AUC, area under the curve; mRS, modified Rankin Scale; NIHSS, National Institutes of Health Stroke Scale; and OR, odds ratio.
On alternative outcome multivariable models, no evidence of statistically significant association was found on models with death or NIHSS score after 48 hours. Complete estimates are in Table S4.
We also observed that A1AT levels presented correlation evidence with the NIHSS score at admission and age (Figures S2 and S3).
DISCUSSION
Predicting the outcome of patients with ischemic stroke is crucial for guiding decision‐making and ensuring the best possible management of patients after the event. Currently, outcome prediction relies on clinical data from patients, including factors such as age, comorbidities, and stroke severity. 20 Several studies have suggested that incorporating blood biomarkers into these clinical models for outcome prediction may enhance their predictive accuracy. 8 , 21 , 22 Observational studies claim that outcome modification can be reached by (1) the discovery of new candidates in regard to omic techniques and (2) the assessment of the candidate's potential and further analysis in larger studies. 23 In this regard, we assessed the possible associations of A1AT at the hyperacute phase of ischemic stroke with subacute and midterm prognoses in a preliminary pilot study and then in a large replication study.
Increased bloodstream levels of A1AT have previously been associated with worse outcomes in patients with other diseases. 24 , 25 However, the exact role of A1AT in stroke pathophysiology remains uncertain. Authors such as Mahta et al suggested the vasculo‐protective role of A1AT. 21 In their studies, they showed that a mutation in SERPINA1, the A1AT‐encoding gene, is associated with acute ischemic stroke provoked by large‐artery atherosclerosis. 22 In this regard, a pilot study measuring A1AT levels within the first 24 hours after ischemic stroke in 18 patients suggested the potential protective role of A1AT against atherosclerosis. 26 However, they also reported that higher circulating A1AT levels were associated with larger infarct volumes but not with functional outcomes at hospital discharge. Similarly, preclinical studies have highlighted the possible neuroprotective role of A1AT, reporting that therapy with human A1AT in animal models ameliorates ischemic damage and improves animal outcomes after ischemic stroke. 27 Nevertheless, increased levels of A1AT have been found in the ischemic core of the brain compared with those in the healthy contralateral area 28 and are associated with a greater risk of developing stroke in children. 16 In regard to neurological outcomes, another study reported that circulating levels of A1AT measured within the first 24 hours after atherothrombotic ischemic stroke were greater in patients with poor neurological outcomes 1 month after the event. 29
In our pilot study, we found that patients with higher levels of A1AT had worse outcomes (mRs >2) at discharge and 3 months after the event. Subsequently, upon analyzing A1AT levels in a larger replication cohort, we confirmed these results. Similarly, a previous study reported that circulating levels of A1AT measured within the first 24 hours after atherothrombotic ischemic stroke were greater in patients with poor neurological outcomes 1 month after the event. 29 Taken together, these findings would indicate that the serum A1AT concentration measured early after stroke could inform clinicians about patient outcomes.
We also found that patients who died in the hospital or between discharge and 3 months after the event had higher levels of A1AT in the acute phase (<6 hours from symptom onset). Our results are supported by what was previously described, which is that high levels of A1AT are related to a major risk of mortality. 30 Nevertheless, these results are not replicated in our larger cohort, which is why we cannot confirm whether high serum levels of A1AT are related to future morbidity or mortality.
Both studies presented here have shown that patients who present with worse outcomes have increased baseline A1AT plasma levels. However, the pathophysiological reasons for this relationship are complex and challenging to explain. To date, limited literature indicates that A1AT could act by modulating the activity of immune cells. A1AT reduces the release of proinflammatory cytokines and increases the secretion of anti‐inflammatory factors after oxygen and glucose deprivation, hence protecting neurons from necrotic and apoptotic cell death. 31 These results indicate that high levels of A1AT can also protect glial cells from oxygen and glucose deprivation‐induced cell death, reinforcing its important role in neuroprotection. Other preclinical studies have shown that the administration of A1AT after cerebral ischemia exerts neuroprotective effects by reducing infarct size 27 and modulating the activity of immune cells. 32 Similarly, A1AT has been shown to exert a protective effect against vascular injury in other inflammatory diseases by inhibiting Tumor Necrosis Factor (TNF)‐α‐induced apoptosis. 32 , 33
Based on previous literature and our findings, we hypothesize that elevated A1AT levels detected in patients with stroke with poor outcomes may represent a protective mechanism aimed at balancing the harmful processes initiated by cerebral ischemia. Nevertheless, we cannot rule out that this upregulation in A1AT might contribute to the expansion of the ischemic area, thereby exacerbating poor stroke outcomes. Further research is necessary to elucidate the function of A1AT in stroke pathophysiology.
Although the relationship between increased levels of A1AT, age, and neurological score are not explicitly discussed in the current published literature, our results suggest correlation.
In regard to predictive models for poor outcomes at hospital discharge and midterm after stroke, A1AT did not improve the prediction currently done only with clinical information. We found neither a prognostic value of A1AT in predictive models for NIHSS score at 48 hours after stroke nor exitus. For that, based on our results, we cannot claim that A1AT complements clinical criteria for diagnosing outcomes following ischemic stroke.
The main strengths of the present study are the large sample size and analysis of 2 distinct cohorts of patients with stroke, enhancing the robustness and generalizability of the findings. However, some limitations need to be noted. First, we analyzed the whole cohort without considering differences in stroke cause. As mentioned above, atherothrombotic strokes have been the most studied type of stroke in the A1AT research field. Therefore, our results should be validated in an independent, stratified analysis before solid conclusions can be drawn. Second, we analyzed plasma samples from different cohorts using different techniques. Before doing statistical analysis, we evaluated the correlation between both techniques. The results demonstrated a strong correlation between ELISA and nephelometry. However, to minimize potential technical bias, the use of the same technique would be advised. In this sense, nephelometry appears to be the most used method for quantifying protein levels in hospital facilities. 34
In brief, we aimed to establish A1AT as an objective and reliable biomarker for predicting patient outcomes after a stroke event. Although our findings do not allow us to confirm A1AT as an independent and informative biomarker for stroke prognosis, our data show that A1AT has a role in stroke pathophysiology and subsequently in patient outcomes. This insight highlights the need for further research into A1AT in the context of stroke prognosis and suggests it could be explored as a potential therapeutic target.
Sources of Funding
The Neurovascular Research Laboratory takes part in the Redes de Investigación Cooperativa Orientadas a Resultados en Salud‐ICTUS Enfermedades Vasculares Cerebrales Network, Instituto de Salud Carlos III), Spain (RD21/0006/0007), and acknowledges funding for this project by a PI21/01158 grant from Fondos Semilla Dr Miguel Blanco of the Instituto de Salud Carlos III. A.B. received funding from Instituto de Salud Carlos III (INT22/00068), cofinanced by the Fondo Europeo de Desarrollo Regional.
Disclosures
None.
Supporting information
Tables S1–S4
Figures S1–S4
Acknowledgments
The authors acknowledge all of the patients, patients' families, and professionals from the recruiting centers for their kind support in the study.
This article was sent to Michelle H. Leppert, MD, MBA, Associate Editor, for review by expert referees, editorial decision, and final disposition.
Supplemental Material is available at https://www.ahajournals.org/doi/suppl/10.1161/JAHA.124.036727
For Sources of Funding and Disclosures, see page 9.
REFERENCES
- 1. Donkor ES. Stroke in the 21st century: a snapshot of the burden, epidemiology, and quality of life. Stroke Res Treat. 2018;2018:1–10. doi: 10.1155/2018/3238165 [DOI] [PMC free article] [PubMed] [Google Scholar]
- 2. Ramiro L. Deciphering Ischemic Stroke: Multi‐Omic Techniques to Discover New Biomarkers and Therapeutic Targets. Thesis. Bellaterra: Universitat Autònoma de Barcelona; 2021. [Google Scholar]
- 3. Kim H, Kim JT, Lee JS, Kim BJ, Kang J, Lee KJ, Park JM, Kang K, Lee SJ, Kim JG, et al. Stroke of other determined etiology: results from the nationwide multicenter stroke registry. Stroke. 2022;53:2597–2606. doi: 10.1161/STROKEAHA.121.037582 [DOI] [PubMed] [Google Scholar]
- 4. Hong JM, Kim DS, Kim M. Hemorrhagic transformation after ischemic stroke: mechanisms and management. Front Neurol. 2021;12:1–12. doi: 10.3389/fneur.2021.703258 [DOI] [PMC free article] [PubMed] [Google Scholar]
- 5. Westendorp WF, Nederkoorn PJ, Vermeij JD, Dijkgraaf MG, van de Beek D. Post‐stroke infection: a systematic review and meta‐analysis. BMC Neurol. 2011;11:110. doi: 10.1186/1471-2377-11-110 [DOI] [PMC free article] [PubMed] [Google Scholar]
- 6. Gu Y, Zhou C, Piao Z, Yuan H, Jiang H, Wei H, Zhou Y, Nan G, Ji X. Cerebral edema after ischemic stroke: pathophysiology and underlying mechanisms. Front Neurosci. 2022;16:1–13. doi: 10.3389/fnins.2022.988283 [DOI] [PMC free article] [PubMed] [Google Scholar]
- 7. Roquer J, Rodríguez‐Campello A, Gomis M, Jiménez‐Conde J, Cuadrado‐Godia E, Vivanco R, Giralt E, Sepúlveda M, Pont‐Sunyer C, Cucurella G, et al. Acute stroke unit care and early neurological deterioration in ischemic stroke. J Neurol. 2008;255:1012–1017. doi: 10.1007/s00415-008-0820-z [DOI] [PubMed] [Google Scholar]
- 8. Montellano FA, Ungethüm K, Ramiro L, Nacu A, Hellwig S, Fluri F, Whiteley WN, Bustamante A, Montaner J, Heuschmann PU. Role of blood‐based biomarkers in ischemic stroke prognosis: a systematic review. Stroke. 2021;52:543–551. doi: 10.1161/STROKEAHA.120.029232 [DOI] [PubMed] [Google Scholar]
- 9. Meseeha M, Sankari A, Attia M. Alpha‐1 antitrypsin deficiency. Treasure Island (FL): StatPearls Publishing; 2024. https://www.ncbi.nlm.nih.gov/books/NBK442030 [PubMed] [Google Scholar]
- 10. Curjuric I, Imboden M, Bettschart R, Caviezel S, Dratva J, Pons M, Rothe T, Schmidt‐Trucksäss A, Stolz D, Thun GA, et al. Alpha‐1 antitrypsin deficiency: from the lung to the heart? Atherosclerosis. 2018;270:166–172. doi: 10.1016/j.atherosclerosis.2018.01.042 [DOI] [PubMed] [Google Scholar]
- 11. Janciauskiene SM, Bals R, Koczulla R, Vogelmeier C, Köhnlein T, Welte T. The discovery of α1‐antitrypsin and its role in health and disease. Respir Med. 2011;105:1129–1139. doi: 10.1016/j.rmed.2011.02.002 [DOI] [PubMed] [Google Scholar]
- 12. Dako F, Zhao H, Mulvenna A, Gupta YS, Simpson S, Kueppers F. Relationship between α1‐antitrypsin deficiency and ascending aortic distention. Mayo Clin Proc Innov Qual Outcomes. 2021;5:590–595. doi: 10.1016/j.mayocpiqo.2021.03.004 [DOI] [PMC free article] [PubMed] [Google Scholar]
- 13. Schievink WI, Katzmann JA, Piepgras DG. Alpha‐1‐antitrypsin deficiency in spontaneous intracranial arterial dissections. Cerebrovasc Dis. 1998;8:42–44. doi: 10.1159/000015814 [DOI] [PubMed] [Google Scholar]
- 14. Schievink WI, Katzmann JA, Piepgras DG, Schaid DJ. Alpha‐1‐antitrypsin phenotypes among patients with intracranial aneurysms. J Neurosurg. 1996;84:781–784. doi: 10.3171/jns.1996.84.5.0781 [DOI] [PubMed] [Google Scholar]
- 15. Sandhaus RA, Turino G, Brantly ML, Campos M, Cross CE, Goodman K, Hogarth DK, Knight SL, Stocks JM, Stoller JK, et al. The diagnosis and management of alpha‐1 antitrypsin deficiency in the adult. Chronic Obstr Pulm Dis. 2016;3:668–682. doi: 10.15326/jcopdf.3.3.2015.0182 [DOI] [PMC free article] [PubMed] [Google Scholar]
- 16. Burghaus B, Langer C, Thedieck S, Nowak‐Göttl U. Elevated α1‐antitrypsin is a risk factor for arterial ischemic stroke in childhood. Acta Haematol. 2006;115:186–191. doi: 10.1159/000090933 [DOI] [PubMed] [Google Scholar]
- 17. Bustamante A, López‐Cancio E, Pich S, Penalba A, Giralt D, García‐Berrocoso T, Ferrer‐Costa C, Gasull T, Hernández‐Pérez M, Millan M, et al. Blood biomarkers for the early diagnosis of stroke: the stroke‐chip study. Stroke. 2017;48:2419–2425. doi: 10.1161/STROKEAHA.117.017076 [DOI] [PubMed] [Google Scholar]
- 18. Cuschieri S. The STROBE guidelines. Saudi J Anaesth. 2019;13:S31–S34. doi: 10.4103/sja.SJA_543_18 [DOI] [PMC free article] [PubMed] [Google Scholar]
- 19. van Swieten JC, Koudstaal PJ, Visser MC, Schouten H, van Gijn J. Interobserver agreement for the assessment of handicap in stroke patients. Stroke. 1988;19:604–607. doi: 10.1161/01.STR.19.5.604 [DOI] [PubMed] [Google Scholar]
- 20. Bustamante A, García‐Berrocoso T, Rodriguez N, Llombart V, Ribó M, Molina C, Montaner J. Ischemic stroke outcome: a review of the influence of post‐stroke complications within the different scenarios of stroke care. Eur J Intern Med. 2016;29:9–21. doi: 10.1016/j.ejim.2015.11.030 [DOI] [PubMed] [Google Scholar]
- 21. Whiteley W, Chong WL, Sengupta A, Sandercock P. Blood markers for the prognosis of ischemic stroke: a systematic review. Stroke. 2009;40:380–389. doi: 10.1161/STROKEAHA.108.528752 [DOI] [PubMed] [Google Scholar]
- 22. Katan M, Elkind MS. Inflammatory and neuroendocrine biomarkers of prognosis after ischemic stroke. Expert Rev Neurother. 2011;11:225–239. doi: 10.1586/ern.10.200 [DOI] [PubMed] [Google Scholar]
- 23. Counsell C, Dennis M. Systematic review of prognostic models in patients with acute stroke. Cerebrovasc Dis. 2001;12:159–170. doi: 10.1159/000047699 [DOI] [PubMed] [Google Scholar]
- 24. Pirisi M, Fabris C, Soardo G, Toniutto P, Vitulli D, Bartoli E. Prognostic value of serum alpha‐1‐antitrypsin in hepatocellular carcinoma. Eur J Cancer. 1996;32:221–225. doi: 10.1016/0959-8049(95)00542-0 [DOI] [PubMed] [Google Scholar]
- 25. Trichopoulos D, Tzonou A, Kalapothaki V. Alpha 1‐antitrypsin and survival in pancreatic cancer. Int J Cancer. 1990;45:685–686. doi: 10.1002/ijc.2910450419 [DOI] [PubMed] [Google Scholar]
- 26. Mahta A, Yaghi S, Reznik ME, Thompson BB, Wendell LC, Rao S, Potter NS, Dakay KB, Cutting S, Mac Grory B, et al. Serum alpha‐1 antitrypsin in acute ischemic stroke: a prospective pilot study. J Clin Neurosci. 2020;76:20–24. doi: 10.1016/j.jocn.2020.04.074 [DOI] [PubMed] [Google Scholar]
- 27. Moldthan HL, Hirko AC, Thinschmidt JS, Grant MB, Li Z, Peris J, Lu Y, Elshikha AS, King MA, Hughes JA, et al. Alpha 1‐antitrypsin therapy mitigated ischemic stroke damage in rats. J Stroke Cerebrovasc Dis. 2014;23:e355–e363. doi: 10.1016/j.jstrokecerebrovasdis.2013.12.029 [DOI] [PMC free article] [PubMed] [Google Scholar]
- 28. Cuadrado E, Rosell A, Colomé N, Hernández‐Guillamon M, García‐Berrocoso T, Ribo M, Alcazar A, Ortega‐Aznar A, Salinas M, Canals F, et al. The proteome of human brain after ischemic stroke. J Neuropathol Exp Neurol. 2010;69:1105–1115. doi: 10.1097/NEN.0b013e3181f8c539 [DOI] [PubMed] [Google Scholar]
- 29. Cojocaru IM, Cojocaru M, Musuroi C, Druta A, Bacanu M. Study of some markers of inflammation in atherothrombotic pathogenesis of acute ischemic stroke. Rom J Intern Med. 2002;40:103–116. [PubMed] [Google Scholar]
- 30. Ritchie SC, Kettunen J, Brozynska M, Nath AP, Havulinna AS, Männistö S, Perola M, Salomaa V, Ala‐Korpela M, Abraham G, et al. Elevated serum alpha‐1 antitrypsin is a major component of GlycA‐associated risk for future morbidity and mortality. PLoS One. 2019;14:1–23. doi: 10.1371/journal.pone.0223692 [DOI] [PMC free article] [PubMed] [Google Scholar]
- 31. Cabezas‐Llobet N, Camprubí S, García B, Alberch J, Xifró X. Human alpha 1‐antitrypsin protects neurons and glial cells against oxygen and glucose deprivation through inhibition of interleukins expression. Biochim Biophys Acta Gen Subj. 2018;1862:1852–1861. doi: 10.1016/j.bbagen.2018.05.017 [DOI] [PubMed] [Google Scholar]
- 32. Subramaniyam D, Virtala R, Pawłowski K, Clausen IG, Warkentin S, Stevens T, Janciauskiene S. TNF‐α‐induced self expression in human lung endothelial cells is inhibited by native and oxidized α1‐antitrypsin. Int J Biochem Cell Biol. 2008;40:258–271. doi: 10.1016/j.biocel.2007.07.016 [DOI] [PubMed] [Google Scholar]
- 33. Kalis M, Kumar R, Janciauskiene S, Salehi A, Cilio CM. Α 1‐antitrypsin enhances insulin secretion and prevents cytokine‐mediated apoptosis in pancreatic Β‐cells. Islets. 2010;2:185–189. doi: 10.4161/isl.2.3.11654 [DOI] [PubMed] [Google Scholar]
- 34. Ruiz‐Duque B, Bañuls L, Reinoso‐Arija R, Carrasco‐Hernandez L, Caballero‐Eraso C, Dasí F, Lopez‐Campos JL. Methodologies for the determination of blood alpha1 antitrypsin levels: a systematic review. J Clin Med. 2021;10:5132. doi: 10.3390/jcm10215132 [DOI] [PMC free article] [PubMed] [Google Scholar]
Associated Data
This section collects any data citations, data availability statements, or supplementary materials included in this article.
Supplementary Materials
Tables S1–S4
Figures S1–S4
Data Availability Statement
The data that support the findings of this study are available from the corresponding author upon reasonable request.