



Abstract
As the complexity of health decision science applications increases, high-level programming languages are increasingly adopted for statistical analyses and numerical computations. These programming languages facilitate sophisticated modeling, model documentation, and analysis reproducibility. Among the high-level programming languages, the statistical programming framework R is gaining increased recognition. R is freely available, cross-platform compatible, and open source. A large community of users who have generated an extensive collection of well-documented packages and functions supports it. These functions facilitate applications of health decision science methodology as well as the visualization and communication of results. Although R’s popularity is increasing among health decision scientists, methodological extensions of R in the field of decision analysis remain isolated. The purpose of this article is to provide an overview of existing R functionality that is applicable to the various stages of decision analysis, including model design, input parameter estimation, and analysis of model outputs.
Keywords: R project, economic evaluation, cost-effectiveness analysis, literature review
Decision analyses often involve building mathematical simulation models to simplify real-life complexity. Applications of decision analysis in health have predominantly been conducted with software that mostly use a “point-and-click” approach (e.g., TreeAge, TreeAge Software, Inc., Williamstown, MA) or “hybrid” software that have interfaces and to some extent support programming languages such as Microsoft Excel (Microsoft Corporation, Redmond, WA), which allows programming using Visual Basic for Application code. To a lesser extent, high-level computer-programming languages (e.g., C++) have been used for computationally expensive models.1 However, as the field of health decision sciences evolves, highly sophisticated models are increasingly used to better represent real-life complexity. In addition, new methodological techniques are being developed rapidly that rely heavily on computationally intensive statistical and mathematical methods (e.g., expected value of information [VOI] analysis). Thus, health decision scientists are beginning to adopt high-level computer programming languages for model development and analysis that also support statistical and mathematical functionalities, such as R (R Core Development Team).
Developing models and conducting statistical analyses in a programming language offers several advantages over the currently available special-purpose software. First, programming languages offer more extensive integration with complex statistical approaches and are more flexible compared with special purpose software. In addition, well-conducted analyses that rely on a programming language can be more easily reproduced compared with software that does not reveal the underlying programming code. Furthermore, programming languages allow for clear documentation and model transparency using inline text that explains the purpose of each line, custom function, or section of the code. Thus, modelers generally have more control for model debugging in programming languages.
Several different high-level programming languages, such as C++, Java (Oracle Corporation, Redwood Shores, CA), Python, MATLAB (The MathWorks, Inc., Natick, MA), and R (R Core Development Team) are currently used in health decision sciences. Among these languages, R is uniquely positioned because it is freely available, supported by a large community of professionals and academicians, and capable of integrating many features needed in the process of decision analysis. In addition, there are numerous resources on tutorials, guidelines, and good coding practices and programming styles that help make the code easier to read and share.
R is a programming language and an environment for conducting statistical analyses. R is freely available as part of the GNU project and is largely based on the S language. Version 4 of S program (S4) provides advanced object-oriented programming, which is particularly useful for building microsimulation models. In addition, advanced users can integrate their programs in C++ for increased computational efficiency. These features make R particularly suitable for designing and conducting simulation analysis.
R has a basic set of packages (R core packages) that provide a substantial collection of useful functions for health decision sciences. This core functionality has been readily extended by its active community of users who have generated many well-documented, user-written packages that implement commonly used statistical and computational tasks. R is maintained by the R Core Development Team, and currently there are more than 2000 packages that have been contributed to the Comprehensive R Archive Network (CRAN), which is a network of file transfer protocol and Web servers around the world that store identical and up-to-date versions of code and documentation for R to avoid conflicting versions.
Despite the many advantages of R and its increasing popularity among health decision analysts,2,3 applications of R remain isolated, and a general familiarity with the capabilities of R in the health decision sciences is lacking. The purpose of this article is to provide an overview of R for various applications in health decision analysis, including 1) model design and implementation, 2) input parameter estimation and calibration, and 3) summarization of results and sensitivity analyses.
In this article, we first search the literature for applications in health decision sciences that relied on R compared with a sample of other commonly used software. Next, we discuss specific R packages and functions that are of relevance to health decision sciences, grouped by stages of model development and analysis (Appendix A). This article is the first in a series of tutorial papers on the use of R in health decision sciences.
SOFTWARE USED IN HEALTH DECISION SCIENCES
We conducted a literature search to measure how frequently R is used in health decision sciences compared with other commonly used software and to identify potential trends in its use over time. We considered the use of this software at any stage of modeling development (e.g., parameter estimation, data analysis, mathematical model building, VOI, etc.). We searched full-text articles published in Medical Decision Making, Pharmacoeconomics, Health Economics, Journal of Health Economics, European Journal of Health Economics, Value in Health, Health Economics Review, and Statistics in Medicine. We used Google Scholar, which allows for full-text search within specific journals. Because Google Scholar limits the number of characters in the search string, we limited our search query to ([software name]) AND (“cost-effectiveness” OR “cost-utility” OR “QALY” OR “Decision model” OR “microsimulation” OR “value of information”). We modified the “software name” keyword to capture applications in health decision sciences that used a list of relevant software, including R, Microsoft Excel (Microsoft Corporation), TreeAge (TreeAge Software, Inc.), SAS (SAS Software, Cary, NC), and STATA (Stata Statistical Software, College Station, TX). Since R is a single letter, we used these keywords to search for R-relevant mentioning in Google Scholar: (“Used R” OR “R Core” OR “R software” OR “R development” OR “R statistical” OR “R package” OR “R Project”) AND (“cost-effectiveness” OR “cost-utility” OR “QALY” OR “Decision model” OR “microsimulation” OR “value of information”).
We manually reviewed the entries and excluded all conference abstracts and posters and limited the search to the period between 1 January 1994 and 31 December 2015. We decided to start our trend analysis in 1994 as R was created in 1993. We extracted the PubMed identifiers from the relevant abstracts. All analyses, including the literature search, were conducted in R, and we used the R package RISmed to analyze the findings of the literature search (Figure 1).
Figure 1.
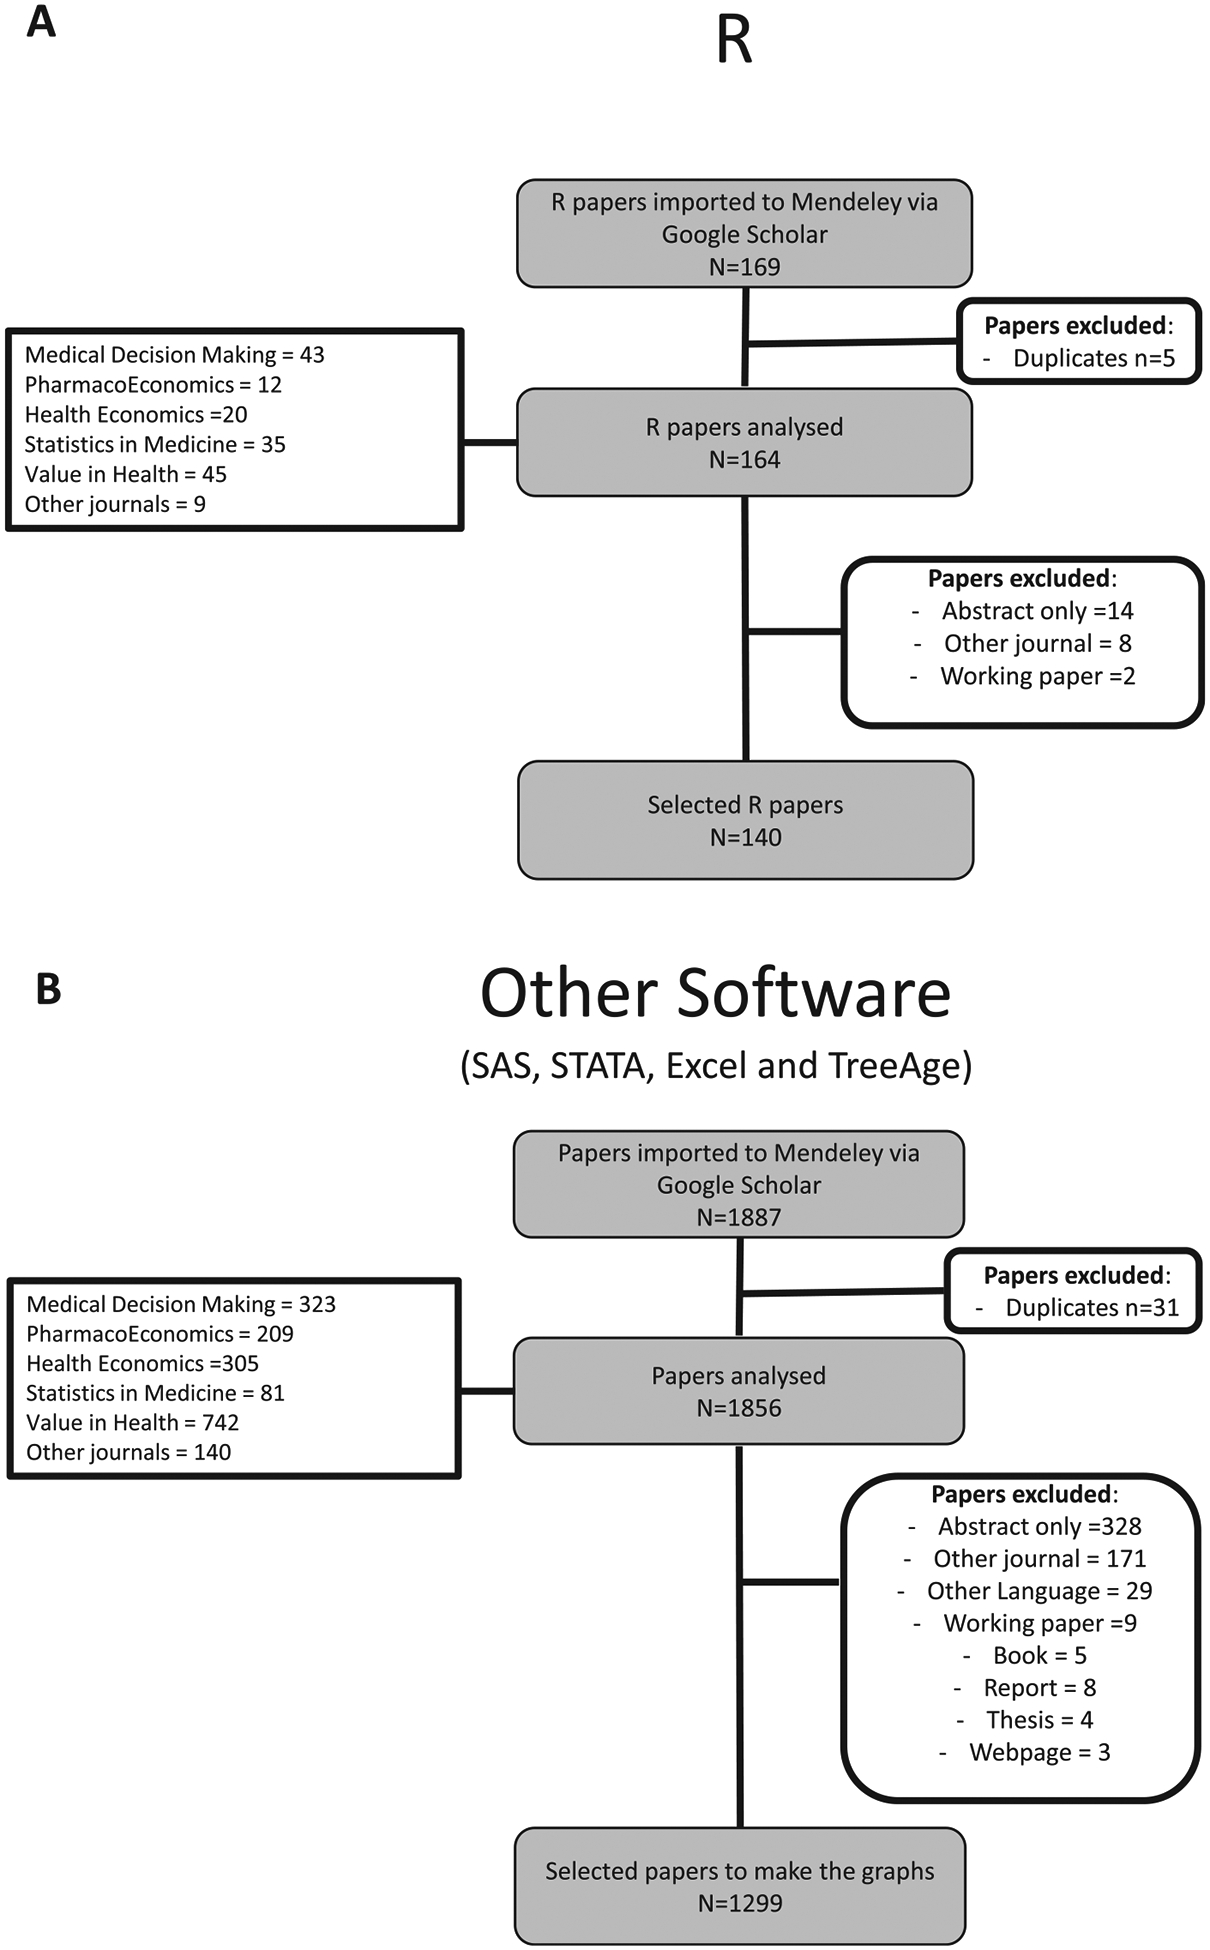
Flow diagram for the literature search. (a) Flow chart of the literature search for articles that used R. (b) Chart of the literature search for articles that used other software, such as SAS, STATA, Microsoft Office Excel, or TreeAge.
Figure 2 illustrates the trends of various software use in health decision sciences over time. R’s diffusion into the health decision sciences literature was measured through the proportion of studies per year that were conducted using R versus any other software. In the journals searched, R appears to increase in popularity, with the proportion of studies using R increasing by nearly 50% over the past 5 years. In fact, in these journals, R is the fastest growing software compared with the other software. These results seem consistent with other disciplines. (http://r4stats.com/articles/popularity/).
Figure 2.

Proportion of articles in health decision sciences using the identified software. For comparing R to the other software, we chose to start the x-axis from 1998 because there were only 4 articles that used R in the period between 1994 and 1998.
EXISTING R PACKAGES AND FUNCTIONS USEFUL IN HEALTH DECISION SCIENCES
In this section, we provide a list of R packages and user-defined functions that we found relevant to health decision science. We divided these packages into 3 categories based on 3 core stages of decision analysis: 1) model design, 2) input parameter estimation and calibration, and 3) analysis of model outputs, presentation of results, and sensitivity analysis. The packages and their sources are summarized in Appendix A.
In addition, CRAN has created the R Task Views (https://cran.r-project.org/web/views/) that group sets of R packages and functions by type of analysis, fields, or methodologies. For example, some task views included in this repository are the optimization and mathematical programming and Bayesian inference that are especially useful for calibration and model parameter estimation (see below).
Model Design
Models in health decision sciences range from simple decision trees to complex agent-based microsimulation and infectious disease models. Below, we provide examples of specialized functions that facilitate the implementation of the commonly used models in health decision sciences as described by the SMDM-ISPOR Joint Task Forces4–10:
Decision trees are the simplest form of decision models in which all possible alternatives and the pathways associated with each alternative are represented in a treelike graph structure. The analytical computations underlying a decision tree are mostly simple enough to be conducted in R using the R core packages functionality. R is capable of performing element-wise and matrix operations that drastically reduce the computational time needed for decision trees, even for decision trees with multiple nested branches.
State-Transition Models
Markov model cohort simulations.
Markov models are used to describe the transitions of a simulated cohort of patients among several mutually exclusive and exhaustive health states during a series of short intervals or cycles. Markov models are useful for simulating disease progression and the effects of interventions over time and have been a fundamental tool in health decision sciences for more than 30 years.3,11 The typical way of simulating a Markov model is through matrix operations. The R core packages efficiently handle matrix operations as single objects, which allow calculating discrete-time Markov models without the need for additional packages. However, user-contributed packages such as matrixStats provide added matrix- and vector-based methods to compute a wide range of summary statistics on one or more dimensions of multidimensional matrices, which are optimized for speed and memory usage. R also has packages with already built-in functions to both simulate and determine properties of discrete-time Markov models, such as the first passage time into each state and the steady-state probabilities. For example, the packages DTMCPack and markovchain provide methods to develop and run discrete-time Markov models. In addition, markovchain and heemod packages provide functions to perform statistical and probabilistic analysis, estimate transition probabilities from data, and plot state-transition diagrams. Furthermore, continuous-time Markov models can be stochastically simulated using GillespieSSA, as illustrated in reference 12.
Markov decision processes (MDPs) are specialized Markov models that allow decisions to be made during each Markov cycle and produce a sequence of decisions that optimize the overall expected utility. These tools are useful when the decision problem involves estimating the optimal timing of an intervention.13 MDPs generally use a backward induction algorithm that computes the expected value of each decision starting from the last cycle backward until it reaches the first cycle. The decisions that produce the highest utility in each cycle are then recorded as defining the optimal policy. Standard decision analysis software generally does not support this algorithm because this software generally uses a forward algorithm that would typically be computationally very expensive in determining the optimal timing. The package MDPtoolbox is specifically written to allow R users to solve MDPs.
Individual-level microsimulation.
Microsimulation models generally involve sampling many hypothetical individuals and tracking their progress over time. One important advantage of this approach over standard Markov models is that it allows for history of the simulated individuals to be incorporated more efficiently. R’s core packages contain many of the necessary functionalities for the development and simulation of standard microsimulation models. The MILC package is a microsimulation model of the natural history of lung cancer progression and is developed entirely in R. In addition, the S4 language, which can be used in R, natively supports object-oriented programming in which individuals can be assigned attributes and inherit attributes from parent classes. Additional packages such as RNetLogo allow the integration of R with NetLogo,14 a software dedicated to agent-based simulation modeling. Furthermore, the package spaDES is specifically designed for building discrete-event simulations.
Dynamic transmission models (compartmental models).
Dynamic transmission models are most often used to model the spread of infectious diseases. Like Markov models, compartmental models describe transitions of a population through a set of states; however, unlike most Markov models, certain transition probabilities may depend on the current composition of the population. For example, the probability of new infections depends on the number of infectious individuals in the population. One of the simplest infectious disease compartmental models is the 3-compartment susceptible-infected-recovered (SIR) model. In an SIR model, the probability of transitioning from the susceptible to infected compartment is proportional to the number of currently infected individuals in the population. Because of the state dependence of the transition probabilities, these models are often represented as either ordinary differential equations (ODEs) or partial differential equations, which can be solved numerically in R. Standard ODE solvers are implemented in R through the deSolve package. R also supports the stochastic simulation of system dynamics represented by ODEs through the GillespieSSA and adaptivetau packages. These packages also include functions that implement basic infectious disease model structures, such as SIR, that can be customized and extended to more complex models.
The EpiModel package was developed explicitly to facilitate the development and simulation of infectious disease models in R. EpiModel is a framework that includes built-in functionality for the most commonly used infectious disease model types, such as SIR, as well as a module-based structure that is designed to facilitate user customization for more complex disease models. While EpiModel supports deterministic compartmental models, it can also simulate stochastic infectious disease spread through either a random contact process or a dynamic contact network, which is implemented using the network analysis and simulation package statnet.
Parameter Estimation
R provides various powerful statistical and numerical tools for parameter estimation through statistical analyses of patient-level or aggregated data as well as tools for estimating unobservable or unknown parameter values through model calibration. In the following sections, we summarize some of these functionalities in R.
Analysis of Patient-Level or Aggregate Preexisting Data
Decision analysts often rely on the analysis of existing data to populate their model parameters. R has numerous packages for conducting various forms of basic and advanced statistical analyses. In addition, special packages can be used to directly access commonly used data sources (e.g., the Surveillance, Epidemiology, and End Results [SEER] data set).
Statistical Analysis of Primary Data
Input parameter estimates in decision models are often obtained from statistical analysis of primary data. For example, partitioned survival models are frequently used in cancer models and rely on estimates from parametric survival regression models.15 Several R packages (e.g., the core package survival and the contributed package flexsurv) allow the analysis of survival data in order to be integrated in a decision model. Multistate models (MSM) are the generalization of survival analysis including more than two competing states. R has various packages that estimate MSM. For example, msm, mstate, and SemiMarkov are used to fit MSM to panel data in survival analysis applications, TPmsm for estimating transition probabilities for 3-state progressive disease models, and HMM and depmixS4 for fitting hidden Markov models from individual-level data.
In addition, R provides tools for performing numerous types of regression-based analyses, including linear and generalized linear regression models (functions lm and glm), generalized linear mixed models (e.g., packages nlme and lme4 being the most popular), generalized estimating equations (e.g., package gee), instrumental variables (e.g., package AER), and marginal structural models (e.g., package ipw). These are only a few examples of the wide variety of packages that are offered by R for regression-based analyses. For a more comprehensive list of packages that can be useful in parameter estimations, the reader is advised to use the CRAN Task View: Econometrics (https://cran.r-project.org/web/views/Econometrics.html) and the extensive online support available for R.
Meta-analysis and Evidence Synthesis
It is suggested that economic evaluations should ideally compare all treatment strategies and should rely on best available evidence.16 For this reason, the process of systematic review and meta-analysis precedes most economic evaluations, either as part of that analysis or as input for the economic model.
R serves as a rich environment for conducting evidence synthesis. R includes a convenient set of functions that can facilitate conducting systematic reviews, manipulating the study-extracted data, and performing meta-analyses, including network meta-analyses. One of the most widely used packages for conducting systematic reviews through R is the RISmed package. Many examples rely on RISmed to automate study identification such as extracting information for respiratory health studies from PubMED.17 This package allows searching within any of the Entrez databases, including PubMed and the National Library of Medicine collection, and extraction of extensive information from the identified studies (e.g., abstract title, authors, year of publication, journal published, and more). The structured approach in this metadata extraction in combination with the graphic tools of R allows for intuitive summaries of this metadata information.
There are several packages that allow the R user to conduct meta-analysis (e.g., meta, metafor, rmeta). These packages provide specific meta-analytic functionality, such as forest and funnel plots, as well as standard statistical analyses. For example, fixed- and random-effects meta-analyses can be conducted using either the rmeta or metafor packages but can also be executed using the generalized linear mixed model functions from the nlme of lme4 packages. Extensions of the standard univariate, inverse variance methods can also be conducted using R. The package mvmeta allows for multivariate fixed- or random-effects models, which can incorporate correlation structures between outcomes within the same sample of studies.
R has been used widely for network meta-analysis. A series of recently published articles on evidence synthesis for decision making describes a set of tutorials for a framework of evidence synthesis using fixed- or random-effect, indirect comparisons and network meta-analysis.18–24 Using R is advantageous because it provides a wide array of tools to conduct these analyses. For example, the packages netmeta and gemtc allow for conducting network meta-analyses within a frequentist or a Bayesian framework, respectively. R has a highly evolved integration with Bayesian inference using a set of probabilistic programming languages, referred to as Bayesian inference Using Gibbs Sampling (BUGS) languages (e.g., WinBUGS, OpenBUGS, and JAGS). These applications can be programmatically accessed through R using the packages R2WinBUGS, R2OpenBUGS, and R2jags. These packages allow Bayesian methods to be seamlessly integrated with decision-analytic models. In addition, these packages are often used in network meta-analyses for evidence syntheses. The results of the meta-analyses and network meta-analyses can be readily incorporated in the economic evaluation, allowing for uncertainty to be appropriately propagated in the economic model.16
Direct analyses of public data sets.
R also facilitates access to publicly available databases of primary and aggregated data, such as life tables or cancer surveillance data. This input can be used by decision modelers for the direct estimation of input parameters (e.g., all-cause mortality) but also for the calibration and validation of the simulation models. Commonly accessed databases include the Human Fertility Database25 through the HMDHFDplus package, the Human Mortality Database26 through the demography package, and the SEER Database27 through the SEER2R package. Some of these packages also include useful functions for the analysis of such epidemiological data. For example, the demography package allows for the estimation of Lee-Carter type of models, which use age-specific mortality rates to forecast future mortality rates, accounting for changes in life expectancy over time.28
Calibration.
Calibration involves identifying appropriate parameter values based on the model fit to some observed target data. Often, there is a subset of model parameters that cannot be directly observed or estimated using traditional statistical models, such as the probability of a preclinical cancer becoming symptomatic. Modelers often adopt calibration as a tool to infer the value for these unobservable parameters. R provides a wide selection of packages for optimization that could potentially be used for model calibration. The optim function included in the stats package is a general purpose optimization tool that includes different algorithms, such as directed search optimization (i.e., Nelder–Mead), quasi-Newton methods, and the conjugate-gradient algorithm. It can also conduct box-constrained optimization and simulated annealing. The optimx package provides more features including additional optimization algorithms and constraint handlings. Nelder–Mead is a commonly used algorithm in model calibration in health decision sciences and has its own standalone implementation in R through the package neldermead, which has been used in decision models in the past (examples include references 29–34). R also includes packages that implement global optimization algorithms. For example, the package genalg can perform a genetic algorithm search of the parameter space for appropriate estimates, and the package DEoptim implements the differential evolution algorithm for global optimization of a function of a real-valued parameter vector. A generalized version of the simulated annealing algorithm has its own standalone package named GenSA. A comprehensive list of R packages that provides tools for solving optimization problems is maintained by the CRAN Task View: Optimization and Mathematical Programming (https://cran.r-project.org/web/views/Optimization.html). Furthermore, Latin hypercube sampling (LHS), an efficient sampling method, can be used for model calibration where the parameter space is split recursively until the parameter subspace that contains the best-fitting parameter space is found. LHS in R can be implemented using the lhs package.
Bayesian calibration can be implemented with either Markov chain Monte Carlo (MCMC) or integrated nested Laplace approximation algorithms. For example, MHadaptive implements an adaptive Metropolis-Hastings (MH) sampling algorithm of a user-defined function. The package also provides some functions for Bayesian inference including Bayesian credible intervals and deviance information criterion calculation. The package mcmc simulates continuous distributions of random vectors using MCMC. This package provides an implementation of the MH sampling algorithm that uses a multivariate normal proposal distribution with variance proportional to the identity matrix. In addition to mcmc, several other packages can perform Bayesian inference, such as MCMCpack. As an alternative to MCMC, the package INLA could be used to approximate Bayesian inference for latent Gaussian Markov random field models. The CRAN Task View also maintains a comprehensive list of R packages that provides tools for Bayesian inference (https://cran.r-project.org/web/views/Bayesian.html).
Model Analysis and Output
After the model is built and input parameters are estimated, modelers can use R to conduct various analyses including PSA and VOI analysis. In addition, many analyses in R can be run more efficiently by taking advantage of the available computing resources and R’s native capability of handling matrix and vector operations efficiently. Furthermore, R provides superior graphing capabilities through a set of packages that produce publication-quality figures, which allows a high degree of customization of these figures.
Probabilistic Analyses
As decision models usually rely on input parameters that are estimated and hence not known with certainty, the results of these models are also associated with uncertainty. To incorporate this uncertainty, decision modelers rely on probabilistic sensitivity analysis (PSA) in which each input parameter is associated with a distribution rather than a single value. Monte Carlo methods are applied to propagate parameter uncertainty to the model outputs. PSA is computationally demanding in many models and requires random number-generating or resampling capabilities. The core R packages include basic functionalities necessary for probabilistic sampling, including random-number generation functionality for several univariate distributions (e.g., normal, beta, and gamma) and calculating the density, cumulative density, and quantiles for many standard probability distributions that are frequently used in decision analyses. Sampling from more complex distributions, such as multivariate normal and the Dirichlet distributions, can also be achieved using the MASS, LCA, and mvtnorm packages. In addition, users can sample from several independent parameters and later induce correlations using published user-written R functions.35
Much of R’s functionality used for primary data analysis can also be used to summarize the results from decision models. In addition, there is an increasing number of efforts to streamline and simplify the production of figures and tables specific to cost-effectiveness analyses. For example, the package BCEA performs several analyses on probabilistic decision models that are relevant to health economic evaluations, including VOI analysis (see below). This package uses a probabilistic data set as an input and generates various plots, such as cost-effectiveness planes, a cost-effectiveness acceptability curve (CEAC), the contours and scatterplots for the distribution of incremental costs and effectiveness, and expected value of perfect information figure.
VOI Analysis
VOI measures the value of reducing uncertainty in a cost-effectiveness or decision analysis. VOI analysis is gaining increasing recognition. The packages BCEA and SAVI (available on GitHub) can calculate expected value of perfect information from a PSA data set. In addition, many authors have published R code to conduct VOI. Examples of such efforts include using generalized additive regression models and Bayesian updating,36 using the unit-normal loss integral and regression meta-modeling,37 and Bayesian Laplace approximation.38
Increased Computational Efficiency
By default, R uses only one computational thread of the computer’s central processing unit. However, most modern computers can run multiple threads in parallel. R can use all the cores on a machine for matrix operations if the basic linear algebra subprograms libraries are optimized for parallel processing. In addition, R has a set of packages that enable parallel computing (e.g., foreach, parallel), which allow the simultaneous execution of operations on multiple threads in parallel and thereby reducing computation time. The foreach package supports parallel execution of the for command, which can execute repeated operations on multiple processors (cores) on a single computer or on multiple nodes of a network-connected computer cluster. The parallel package also supports this type of parallel computation through an implementation of the apply functions provided in the core package in R.
Graphical Outputs
In addition to specialized analyses, decision analysts often use graphics to communicate the results of their analyses. One of the main advantages of using R is the ability to produce publication-quality figures and the wealth of information and support available on how to customize these figures to achieve the desired results. For example, the package ggplot2 provides a high degree of flexibility to create polished and complex plots. An example of a CEAC plotted with ggplot2 is shown in Figure 3. In addition, the package lattice improves on base R graphics by providing better defaults and by simplifying the visualization of multivariate relationships. Users can find many resources online (e.g., http://www.cookbook-r.com/Graphs/) that assist in learning the plotting capabilities of R.
Figure 3.

Cost-effectiveness acceptability curves of a generic cost-effectiveness analysis plotted with ggplot2.
DISCUSSION
In this article, we illustrated the increasing use of R in health decision sciences and provided an overview of R packages and user-written functions that can be useful in decision analysis. Although many of these packages are not specific to decision analysis, they are nonetheless highly relevant and, in most circumstances, can be applied without modification. We grouped relevant R packages into 3 broad stages of decision analysis: model development, input parameter estimation, and output analyses. In addition, we highlighted the integration of R with other software, including BUGS and NetLogo.
Decision analysts increasingly adopt a programming approach. Although learning a new programming language can impose an initial barrier, the expected payoffs could outweigh the entry costs. For example, using a programming language allows for modeling complex situations, integration with primary data analysis, documentation, transparency, automation of repeated analyses, trouble-shooting, reproducibility, and visualization of the results with advanced graphical tools.
In addition to R, there are other high-level languages that are commonly used in decision analyses, such as C++, MATLAB, and Python, which are sometimes superior to R, particularly in computational efficiency. However, R is unique because it is supported by a large network of users and a culture of sharing open-source code that is already proven useful among statisticians. In fact, most of R functionality is provided by user-written packages and online support, allowing R to be highly customizable so that users can develop their own functions that fit their needs. R packages are often of high quality and written by specialized professionals and academicians. These packages tend to be well scrutinized by the community, which helps improve the code and remove the bugs. This is facilitated by the open-source nature of the R code, which allows anyone to view the underlying code and potentially contribute to improving it.
There are some drawbacks in using R or any other high-level programming languages in health decision sciences. One major limitation is the lack of a graphical user interface that helps decision analysts to visualize their mathematical models. Such visualization is often desired because it facilitates the development and communication of the model structure. For example, decision trees often involve conditional probabilities that have an intuitive representation with a tree diagram. Although these trees can be represented with mathematical formulae, these formulae tend to become nested and very complicated to visualize, interpret, or debug without a graphical user interface. The package ArvoRe is an effort to design cost-effectiveness analyses with decision trees and simple Markov models in R. Furthermore, to address this limitation, we are currently developing an open-source tool (OpenTree) that provides an interface for building and editing decision models. OpenTree can translate graphical trees to R code. Users can then use this generated R code independently from the graphical representation of the model to conduct their analyses.
Another limitation of open-source software, in general, relates to package dependencies and version control. For example, it is important to maintain backward compatibility when new packages are released. Although R has a mechanism to decrease the risk of package incompatibility, this task becomes particularly challenging as the number of user-written packages increases. The package packrat is an effort to overcome this challenge. This package allows each R project to have its own library of packages, thus preventing version conflict and broken package dependencies among various projects.
The purpose of this article is to provide an overview of the use of R in health decision sciences compared with several other software packages and to provide a sample of R packages that we believe are useful in various stages of model design and development. There are other repositories of R packages in addition to CRAN, including GitHub, Bioconductor, and R-Forge, that host additional R packages that may be of use in health decision sciences. In addition, the list of articles, journals, software, R packages, and repositories included in this overview is to provide only an overview and is not meant to be comprehensive. For example, there are other software that were not included in this overview, such as simul8 (simul8, Boston, MA) and @risk (Palisade, Ithaca, NY). In addition, we recognize that our sample was limited in Google Scholar, and there are other important journals (e.g., Health Technology Assessment) that were not included. However, exhaustively listing every R package, function, and repository available, especially when new packages are continuously added, is challenging. To address this challenge, we created a Wiki page (R in Health Decision Sciences) available at https://en.wikiversity.org/wiki/R_in_Health_Decision_Sciences. This resource allows the medical decision sciences community to freely add new information, share their experiences, and update the existing resources. We prefer this approach over a published list as it is less likely to be outdated.
R is becoming increasingly popular as a teaching tool for health decision sciences at universities and in various short courses and workshops in professional society meetings in recent years. Furthermore, we decided to create the Decision Analysis in R for Technologies in Health (DARTH) workgroup. The group is an international endeavor composed of members with shared interests modeling in R with the goal of providing tutorials and courses to familiarize scientists, especially new investigators with using R in health decision sciences.
In summary, R has rapidly become one of the most widely used tools in statistical analyses. Many of the R packages can be applied to decision analysis with minimal or no modifications. Thus, the purpose of this overview is to provide a baseline reference point for users interested in navigating the large number of R packages relevant to decision analyses. In subsequent tutorials, and as part of the DARTH’s group efforts, we will detail how to use OpenTree and conduct specific tasks that are commonly used in decision analysis and simulation modeling, for example, model building, calibration, and VOI analysis among others.
Supplementary Material
Supplementary material for this article is available on the Medical Decision Making Web site at http://journals.sagepub.com/home/mdm.
ACKNOWLEDGMENTS
The authors would like to thank Professor Jon Baron and an anonymous reviewer of Medical Decision Making for their valuable suggestions.
There was no funding for this project, and the authors have nothing to disclose.
Contributor Information
Hawre Jalal, University of Pittsburgh Graduate School of Public Health, Pittsburgh, PA, USA;.
Petros Pechlivanoglou, The Hospital for Sick Children, Toronto and University of Toronto, Toronto, Ontario, Canada;.
Eline Krijkamp, Erasmus MC, Rotterdam, the Netherlands;.
Fernando Alarid-Escudero, University of Minnesota School of Public Health, Minneapolis, MN, USA;.
Eva Enns, University of Minnesota School of Public Health, Minneapolis, MN, USA;.
M. G. Myriam Hunink, Erasmus MC, Rotterdam, The Netherlands and Harvard T.H. Chan School of Public Health, Boston, MA, USA..
REFERENCES
- 1.Tosh J, Wailoo A. Review of Software for Decision Modelling. Sheffield, UK: Decision Support Unit, University of Sheffield; 2008. [PubMed] [Google Scholar]
- 2.Williams C, Lewsey JD, Briggs AH, Mackay DF. Cost-effectiveness analysis in R using a multi-state modelling survival analysis framework: a tutorial. Med Decis Making. In press. [DOI] [PMC free article] [PubMed] [Google Scholar]
- 3.Hawkins N, Sculpher M, Epstein D. Cost-effectiveness analysis of treatments for chronic disease: using R to incorporate time dependency of treatment response. Med Decis Making. 2005;25(5):511–9. [DOI] [PubMed] [Google Scholar]
- 4.Eddy DM, Hollingworth W, Caro JJ, et al. Model transparency and validation: a report of the ISPOR-SMDM Modeling Good Research Practices Task Force-7. Med Decis Making. 2012;32(5):733–43. [DOI] [PubMed] [Google Scholar]
- 5.Briggs AH, Weinstein MC, Fenwick EA, et al. Model parameter estimation and uncertainty analysis: a report of the ISPOR-SMDM Modeling Good Research Practices Task Force Working Group-6. Med Decis Making. 2012;32(5):722–32. [DOI] [PubMed] [Google Scholar]
- 6.Pitman R, Fisman D, Zaric GS, et al. Dynamic transmission modeling: a report of the ISPOR-SMDM Modeling Good Research Practices Task Force Working Group-5. Med Decis Making. 2012;32(5):712–21. [DOI] [PubMed] [Google Scholar]
- 7.Karnon J, Stahl J, Brennan A, Caro JJ, Mar J, Moller J. Modeling using discrete event simulation: a report of the ISPOR-SMDM Modeling Good Research Practices Task Force-4. Med Decis Making. 2012;32(5):701–11. [DOI] [PubMed] [Google Scholar]
- 8.Siebert U, Alagoz O, Bayoumi AM, et al. State-transition modeling: a report of the ISPOR-SMDM Modeling Good Research Practices Task Force-3. Med Decis Making. 2012;32(5):690–700. [DOI] [PubMed] [Google Scholar]
- 9.Roberts M, Russell LB, Paltiel AD, et al. Conceptualizing a model: a report of the ISPOR-SMDM Modeling Good Research Practices Task Force-2. Med Decis Making. 2012;32(5):678–89. [DOI] [PubMed] [Google Scholar]
- 10.Caro JJ, Briggs AH, Siebert U, Kuntz KM, Force I-SMGRPT. Modeling good research practices—overview: a report of the ISPOR-SMDM Modeling Good Research Practices Task Force-1. Med Decis Making. 2012;32(5):667–77. [DOI] [PubMed] [Google Scholar]
- 11.Beck JR, Pauker SG. The Markov process in medical prognosis. Med Decis Making. 1983;3(4):419–58. [DOI] [PubMed] [Google Scholar]
- 12.Iskandar R, Alarid-Escudero F, Kuntz KM. Does Size Matter? A Method for Adaptively Determining Cycle Length in a State-Transition Model. Paper presented at the 37th Annual Meeting of the Society for Medical Decision Making; St. Louis, MO; 18–21 October 2015. [Google Scholar]
- 13.Shechter SM, Bailey MD, Schaefer AJ, Roberts MS. The optimal time to initiate HIV therapy under ordered health states. Oper Res. 2008;56(1):20–33. [Google Scholar]
- 14.Wilensky U. NetLogo: Center for Connected Learning and Computer-Based Modeling, Evanston, IL: Northwestern University; 1999. Available from: URL: http://ccl.northwestern.edu/netlogo/. [Google Scholar]
- 15.Latimer NR. Survival analysis for economic evaluations alongside clinical trials—extrapolation with patient-level data: inconsistencies, limitations, and a practical guide. Med Decis Making. 2013;33(6):743–54. [DOI] [PubMed] [Google Scholar]
- 16.Welton NJ, Sutton AJ, Cooper N, Abrams KR, Ades AE. Evidence Synthesis for Decision Making in Healthcare. New York: John Wiley & Sons; 2012. [Google Scholar]
- 17.Burchard EG, Oh SS, Foreman MG, Celedon JC. Moving toward true inclusion of racial/ethnic minorities in federally funded studies: a key step for achieving respiratory health equality in the United States. Am J Respir Crit Care Med. 2015;191(5):514–21. [DOI] [PMC free article] [PubMed] [Google Scholar]
- 18.Ades AE, Caldwell DM, Reken S, Welton NJ, Sutton AJ, Dias S. Evidence synthesis for decision making 7: a reviewer’s checklist. Med Decis Making. 2013;33(5):679–91. [DOI] [PMC free article] [PubMed] [Google Scholar]
- 19.Dias S, Sutton AJ, Ades AE, Welton NJ. Evidence synthesis for decision making 2: a generalized linear modeling framework for pairwise and network meta-analysis of randomized controlled trials. Med Decis Making. 2013;33(5):607–17. [DOI] [PMC free article] [PubMed] [Google Scholar]
- 20.Dias S, Sutton AJ, Welton NJ, Ades AE. Evidence synthesis for decision making 6: embedding evidence synthesis in probabilistic cost-effectiveness analysis. Med Decis Making. 2013;33(5):671–8. [DOI] [PMC free article] [PubMed] [Google Scholar]
- 21.Dias S, Sutton AJ, Welton NJ, Ades AE. Evidence synthesis for decision making 3: heterogeneity-subgroups, meta-regression, bias, and bias-adjustment. Med Decis Making. 2013;33(5):618–40. [DOI] [PMC free article] [PubMed] [Google Scholar]
- 22.Dias S, Welton NJ, Sutton AJ, Ades AE. Evidence synthesis for decision making 5: the baseline natural history model. Med Decis Making. 2013;33(5):657–70. [DOI] [PMC free article] [PubMed] [Google Scholar]
- 23.Dias S, Welton NJ, Sutton AJ, Ades AE. Evidence synthesis for decision making 1: introduction. Med Decis Making. 2013;33(5):597–606. [DOI] [PMC free article] [PubMed] [Google Scholar]
- 24.Dias S, Welton NJ, Sutton AJ, Caldwell DM, Lu G, Ades AE. Evidence synthesis for decision making 4: inconsistency in networks of evidence based on randomized controlled trials. Med Decis Making. 2013;33(5):641–56. [DOI] [PMC free article] [PubMed] [Google Scholar]
- 25.Shkolnikov VM, Sobotka T. Human Fertility Database: Max Planck Institute for Demographic Research (Germany) and Vienna Institute of Demography (Austria). Available from: URL: www.humanfertility.org.
- 26.Shkolnikov V, Barbieri M, Wilmoth J. The Human Mortaliy Database: University of California, Berkeley (USA), and Max Planck Institute for Demographic Research (Germany). Available from: URL: http://www.mortality.org/.
- 27.National Institutes of Health. Surveillance, Epidemiology, and End Results (SEER) program populations 1969–2014. Rockville, MD: National Cancer Institute, DCCPS, Surveillance Research Program, Surveillance Systems Branch. [Google Scholar]
- 28.Booth H, Hyndman R, Tickle L, de Jong P. Lee-Carter mortality forecasting: a multi-country comparison of variants and extensions. Demographic Research. 2006;15(9):289–310. [Google Scholar]
- 29.Goldhaber-Fiebert JD, Brandeau ML. Modeling and calibration for exposure to time-varying, modifiable risk factors: the example of smoking behavior in India. Med Decis Making. 2015;35(2):196–210. [DOI] [PMC free article] [PubMed] [Google Scholar]
- 30.Taylor DC, Pawar V, Kruzikas DT, Gilmore KE, Sanon M, Weinstein MC. Incorporating calibrated model parameters into sensitivity analyses: deterministic and probabilistic approaches. Pharmacoeconomics. 2012;30(2):119–26. [DOI] [PubMed] [Google Scholar]
- 31.Chia YL, Salzman P, Plevritis SK, Glynn PW. Simulation-based parameter estimation for complex models: a breast cancer natural history modelling illustration. Stat Methods Med Res. 2004;13(6):507–24. [DOI] [PubMed] [Google Scholar]
- 32.Kim JJ, Kuntz KM, Stout NK, et al. Multiparameter calibration of a natural history model of cervical cancer. Am J Epidemiol. 2007;166(2):137–50. [DOI] [PubMed] [Google Scholar]
- 33.Taylor DC, Pawar V, Kruzikas D, et al. Methods of model calibration: observations from a mathematical model of cervical cancer. Pharmacoeconomics. 2010;28(11):995–1000. [DOI] [PubMed] [Google Scholar]
- 34.Stout NK, Knudsen AB, Kong CY, McMahon PM, Gazelle GS. Calibration methods used in cancer simulation models and suggested reporting guidelines. Pharmacoeconomics. 2009;27(7):533–45. [DOI] [PMC free article] [PubMed] [Google Scholar]
- 35.Goldhaber-Fiebert JD, Jalal HJ. Some health states are better than others: using health state rank order to improve probabilistic analyses. Med Decis Making. 2016;36(8):927–40. [DOI] [PMC free article] [PubMed] [Google Scholar]
- 36.Strong M, Oakley JE, Brennan A, Breeze P. Estimating the expected value of sample information using the probabilistic sensitivity analysis sample: a fast, nonparametric regression-based method. Med Decis Making. 2015;35(5):570–83. [DOI] [PMC free article] [PubMed] [Google Scholar]
- 37.Jalal H, Goldhaber-Fiebert JD, Kuntz KM. Computing expected value of partial sample information from probabilistic sensitivity analysis using linear regression metamodeling. Med Decis Making. 2015;35(5):584–95. [DOI] [PMC free article] [PubMed] [Google Scholar]
- 38.Brennan A, Kharroubi SA. Efficient computation of partial expected value of sample information using Bayesian approximation. J Health Econ. 2007;26(1):122–48. [DOI] [PubMed] [Google Scholar]
Associated Data
This section collects any data citations, data availability statements, or supplementary materials included in this article.