

Abstract
Background
Enalapril orodispersible minitablets (ODMT) have been authorised by the European Medicines Agency for the treatment of heart failure in children from birth to 17 years of age in 2023. Consequently, the use of enalapril in very young and angiotensin-converting enzyme inhibitor (ACEi) naïve patients is expected to increase.
Objectives
Simultaneous characterisation of the pharmacokinetics (PK) of enalapril and the active metabolite enalaprilat in ACEi naïve children with heart failure using a combined population pharmacokinetic (PopPK) model and identification of clinically relevant covariates for the dosing of enalapril in this population.
Methods
Data of ACEi naïve subjects from the European project ‘Labeling of Enalapril from Neonates up to Adolescents’ (LENA) were analysed using nonlinear mixed effects modelling. In the prospective, open-label, multicentre phase II/III PK bridging studies, children with heart failure due to dilated cardiomyopathy (DCM) and congenital heart disease (CHD) received enalapril ODMT according to an age- and weight-dependent dosing regimen. Allometric scaling was implemented for the disposition parameters of enalapril and enalaprilat. Stepwise covariate modelling was used to test the covariates age, sex, serum creatinine and Ross score. The final model was validated using nonparametric bootstrap analysis. Simulations were performed to assess the impact of the covariates after the first dose and at steady state.
Results
The analysed dataset comprised 173 enalapril and 268 enalaprilat serum concentrations from 34 subjects aged 25 days to 2.1 years (median age = 0.3 years). A combined model consisting of a one-compartment model for enalapril coupled with a one-compartment model for enalaprilat with absorption lag was selected as the structural model. Covariate analysis revealed that the weight-adjusted apparent clearance of enalaprilat increases with increasing age and decreases with increasing serum creatinine. In addition, the weight-adjusted apparent volume of distribution of enalaprilat decreases with increasing Ross score. The simulations indicated that serum creatinine levels above the normal reference range, age and weight were clinically relevant covariates for both the first dose and the steady state dose of enalapril. Furthermore, the simulations indicated that the Ross score is a clinically relevant covariate for the first dose of enalapril.
Conclusions
The results of the PopPK analysis and simulations indicated that, in addition to the currently considered parameters of weight and renal function, the parameters of age and severity of heart failure should also be considered when dosing enalapril in children with heart failure.
Trial Registration
Trial registration number (date of registration): EudraCT 2015-002335-17 (30 November 2015), EudraCT 2015-002396-18 (30 November 2015). The trials were registered on the EU Clinical Trials Register (https://www.clinicaltrialsregister.eu).
Supplementary Information
The online version contains supplementary material available at 10.1007/s40262-025-01520-5.
Key Points
| The pharmacokinetics of enalapril and enalaprilat in angiotensin-converting enzyme inhibitor naïve children with heart failure were adequately described by a combined model with absorption lag. |
| The results suggest that age, weight and renal function are clinically relevant covariates that should be considered when dosing enalapril in children with heart failure. |
| The newly identified covariate Ross score provides the scientific background to consider the severity of heart failure for the first dose of enalapril. |
Introduction
In 2023, the European Medicines Agency authorised enalapril orodispersible minitablets (ODMT) for the treatment of heart failure in children from birth to 17 years of age [1]. The most recent international guideline for paediatric heart failure from 2014 recommends an angiotensin-converting enzyme inhibitor (ACEi) for patients with asymptomatic and symptomatic left ventricular dysfunction (heart failure stage B/C) [2]. Previously, captopril was the only ACEi approved in Europe for children with heart failure, and enalapril was approved in Europe for arterial hypertension in children aged 6 years or older. According to a survey in 2015 of European physicians providing paediatric cardiology care, enalapril was the most frequent ACEi of first choice for children and adolescents with heart failure, while captopril was the most frequent ACEi of first choice for newborns as well as infants and toddlers with heart failure [3]. Compared with captopril, enalapril ODMT now provide an age-appropriate solid dosage form that needs to be administered less frequently owing to the longer half-life of enalapril. Therefore, an increase in the use of enalapril in children with heart failure, especially in very young and ACEi naïve patients, is to be expected.
Physiological differences between adults and children might affect the pharmacokinetics (PK) of enalapril and enalaprilat. Firstly, enalapril is a prodrug that is hydrolysed by carboxylesterase 1 (CES1) to the active metabolite enalaprilat, and it is known that the expression of CES1 increases with age [4]. Secondly, the unmetabolised portion of enalapril, as well as enalaprilat, are predominantly excreted renally. The glomerular filtration rate (GFR) per 1.73 m2 increases with age after birth and reaches adult values around the end of the first year of life [5].
In addition, pathophysiological changes in children with heart failure might affect the PK of enalapril and enalaprilat. Despite different aetiologies, the heart is unable to supply the body with sufficient blood and oxygen in both children and adults with heart failure [6]. Schwartz et al. [7] found a reduced apparent oral clearance of enalapril and a slightly longer elimination half-life of enalaprilat in adults with congestive heart failure compared with adults with hypertension. Brunner-La Rocca et al. [8] showed that the severity of chronic heart failure in adults significantly influenced enalaprilat trough levels.
Non-compartmental analyses revealed indications of potential covariates that may influence the PK of enalapril and enalaprilat in children. Wells et al. [9] found a significantly higher area under the concentration–time curve (AUC) of enalaprilat in adolescents with hypertension compared with infants with hypertension when they normalised the AUC to a dose of 0.15 mg/kg, but not when they normalised the AUC to a dose of 1 mg/m2. In contrast, Nakamura et al. [10] found an inverse correlation between age and the AUC of enalapril and enalaprilat, normalised to a dose of 1 mg/m2, in paediatric patients with congenital heart disease (CHD) aged between 10 days and 6.5 years. A previous non-compartmental analysis of the ‘Labeling of Enalapril from Neonates up to Adolescents’ (LENA) studies firstly indicated a potential impact of the aetiology of heart failure on the PK of enalapril, as patients with dilated cardiomyopathy (DCM) had a 50% lower enalapril exposure than patients with CHD. Secondly, differences in the PK parameters of enalapril and enalaprilat were found in the different age groups, indicating a potential impact of age on the PK of enalapril and enalaprilat [11].
A population pharmacokinetic (PopPK) analysis of enalapril and enalaprilat in healthy adults receiving enalapril once as a tablet and once as ODMT identified a covariate effect of normalised body weight on the volume of distribution of enalapril and a covariate effect of formulation on the mean transit time of enalapril absorption [12]. In an early PopPK analysis of enalaprilat in healthy men from 1985, no covariates were investigated [13]. A PopPK analysis of enalaprilat based on literature data from children with hypertension identified a covariate effect of weight on the volume of distribution and clearance of enalaprilat [14].
To the knowledge of the authors, no PopPK analysis of enalapril and enalaprilat focussing on very young and ACEi naïve children with heart failure has been performed so far. Therefore, reliable information on covariates that may influence the PK of enalapril and enalaprilat in this vulnerable population is lacking. However, safe dosing requires consideration of clinically relevant covariates, especially in ACEi naïve subjects, as in these subjects no previous experience with the dosage of ACEi is available.
The aim of this PopPK analysis of the subpopulation of ACEi naïve subjects is therefore to identify covariates that are clinically relevant for the dosing of enalapril in very young and ACEi naïve children with heart failure. To this purpose, a simultaneous PopPK analysis of enalapril and enalaprilat in ACEi naïve children with heart failure was conducted on the basis of data from the LENA studies. In addition, the PopPK analysis of the subpopulation of ACEi naïve subjects was conducted in order to use the final model in subsequent pharmacokinetic/pharmacodynamic (PK/PD) analyses.
Methods
Data
Study Design and Investigated Population
The data used originate from two multicentre, prospective, open-label, phase II/III PK bridging studies of the LENA project [15]. In the LENA project, children pretreated with ACEi and ACEi naïve children with heart failure due to DCM (EudraCT 2015-002335-17) or CHD (EudraCT 2015-002396-18) were administered enalapril in the form of ODMT for 8 weeks. The studies were conducted in hospitals in Austria, Germany, Hungary, the Netherlands (two sites) and Serbia (two sites).
The ethics committees of the participating institutions had given their approval and informed parental consent was obtained before each subject was enrolled in the study. Assent of participating children was obtained in accordance with national requirements.
Male and female patients with a weight greater than 2.5 kg and heart failure due to CHD or DCM were included in the studies. Both ACEi naïve patients and patients with ACEi pretreatment were included in the studies. Patients who were already receiving an ACEi had to be willing to switch to enalapril ODMT. Subjects with CHD were eligible if they required after load reduction by drug therapy and were between birth to under 6 years of age. Subjects with DCM and without ACEi treatment were eligible if they had left ventricular end-diastolic dimension ˃ P95 and/or left ventricular shortening fraction < 25%. Subjects with DCM and ACEi pretreatment must have documented evidence of having fulfilled these criteria before the start of the ACEi therapy. In addition, the subjects with DCM had to be between 1 month and 12 years old.
The exclusion criteria were:
Severe heart failure and/or end stage heart failure precluding introduction or continuation of ACEi.
Too low blood pressure, e.g. less than P5 for age.
Restrictive and hypertrophic cardiomyopathies.
Obstructive valvular disease (peak echocardiographic gradient more than 30 mmHg).
Uncorrected severe peripheral stenosis of large arteries including severe coarctation of the aorta.
Severe renal impairment with serum creatinine above two times the upper limit of normal according to the hospital’s test methodology.
History of angioedema.
Hypersensitivity to ACEi.
Concomitant medication: dual ACEi therapy, renin inhibitors, angiotensin II antagonists or non-steroidal anti-inflammatory drugs except acetylsalicylic acid only for antiplatelet therapy.
Already enrolled in an interventional trial with an investigational drug, unless no interference with the current study can be shown.
Both studies together involved 35 ACEi naïve subjects and 67 subjects with ACEi pretreatment. This analysis used the serum concentrations of enalapril and enalaprilat of the ACEi naïve subjects collected from January 2016 to April 2018.
Dosing
The dosing regimen used was previously developed using a physiologically based pharmacokinetic simulation with the aim of achieving similar enalapril and enalaprilat exposures as in adults for a starting dose of 2.5 mg and a maintenance dose of 20 mg [11]. The dosing regimen contains age- and weight-dependent recommended titration doses, target doses and maximum doses (Supplementary Table 1). The dosage for the subjects was selected according to the investigator’s judgement.
For dosing, the appropriate number of ODMT with 0.25 mg enalapril maleate (now approved as Aqumeldi®, Proveca Pharma Limited, Dublin) or 1 mg enalapril maleate were administered orally. The ODMT were placed in the patient's cheek pouch, where they rapidly disintegrate into small particles that could be easily swallowed. A drink of the patient’s/parent’s choice (e.g. breast milk, formula milk, cow milk, and water) could be taken to facilitate swallowing. By dissolving the 0.25 mg ODMT in tap water directly in a syringe, it was also possible to administer 0.025 mg and 0.125 mg enalapril maleate if the investigator considered a starting dose of 0.25 mg too high for the patient. In this case, the appropriate volume of the resulting dispersion was administered. According to the dosing regimen, daily doses ≤ 0.25 mg were administered once daily in the morning and daily doses > 0.25 mg were divided into two equal doses, each administered in the morning and evening.
The dosing times at the study visits and 7 days before were recorded by the investigator or study nurse in electronic case report forms. The dosing times 7 days before were taken from the patient diary in which the parents noted the dosing times.
Sampling
The sampling regimen consists of a PK full profile day with blood sampling at five or six predefined time points and single PK samples on the remaining study visits. For the investigated ACEi naïve subjects, it was recommended to obtain the PK full profile at the initial dose visit. The predefined time points for PK sampling were before as well as 1, 2, 4, 6 and 12 h after administration of enalapril ODMT. Alternatively, the PK full profile could also be obtained after reaching steady state at the optimal dose, that is, after at least 7 days at this dose. In this case, the predefined time points for PK sampling were before as well as 1, 2, 4 and 6 h after administration of enalapril ODMT. A deviation of ± 15 min from the predefined time point was permitted. The exact time point of each PK sampling was noted.
Single PK samples were collected during titration, dose confirmation, study control visits and at the end of the study. The predefined time points of the study visits are listed in Supplementary Table 2. During titration and at the end of the study, the PK sample was collected predose and the sampling time was noted. The time point of the single PK sample at the dose confirmation visit or at the study control visits could be determined by the investigator if the exact time of sampling and the time of the last dose intake were specified in the electronic case report form.
A total of 200 µL of whole blood was taken per PK sample. If possible, an additional back-up sample was taken for reanalysis, which also comprised up to 200 µL of whole blood. The sampling regimen was designed using modelling and simulation techniques. The total collected blood volume during the study did not exceed the recommended limits for blood loss in paediatrics in clinical studies according to the European Medicines Agency guideline [16].
Analytical Methods
Serum samples were analysed after solid phase extraction using liquid chromatography–triple quadrupole tandem mass spectrometry (Shimadzu HPLC 10 [Shimadzu, Duisburg, Germany] coupled with AB Sciex API 2000 mass spectrometer [Sciex, Darmstadt, Germany]). The lower limit of quantification was 0.195 µg/L for enalapril and 0.180 µg/L for enalaprilat. Further information can be found elsewhere [11].
Population Pharmacokinetic Modelling
PopPK analysis was performed by nonlinear mixed effects modelling using NONMEM® version 7.2.0 (ICON plc, Dublin, Ireland) and Perl-speaks-NONMEM version 4.9.0 [17, 18] via the graphical user interface Pirana® version 2.9.6 (Certara, Radnor, PA, USA). The first-order conditional estimation method with interaction was used to estimate PK parameters and their variability. The dataset for the PopPK analysis was created with Excel® version 2406 (Microsoft, Redmond, WA, USA) and R version 4.2.2 (The R Foundation for Statistical Computing, Vienna, Austria). Statistical analyses and graphics were realized with R version 4.2.2 (The R Foundation for Statistical Computing, Vienna, Austria). The R packages used included nonmem2R for the goodness-of-fit plots, mrgsolve [19] for the simulations and coveffectsplot [20] for the creation of the forest plot.
Base Model Development
The starting point for the model development was a combined model in which a one-compartment model of enalapril is coupled with a one-compartment model of enalaprilat with first-order absorption and elimination. This starting point was chosen because a combined model with one-compartment models for enalapril and enalaprilat had previously been used for an initial analysis of all LENA subjects [21]. As no urine data are available for enalapril and enalaprilat, a fixed value of 0.7 was used for the metabolised fraction of enalapril in this model based on literature data [9]. Due to the small number of samples in the absorption phase, the absorption rate constant (ka) was fixed to the estimated value of the aforementioned final model (0.6 1/h) [21]. It was assumed that the interindividual variability of the parameters was lognormally distributed. The interindividual variability of the apparent clearance and apparent volume of distribution of enalapril and enalaprilat was therefore built in exponentially. For enalapril, a proportional error model and a combined error model with an additive and a proportional error were tested as a residual error model. For enalaprilat, the residual error was described by a proportional error model. Allometric scaling was applied to the apparent clearance and apparent volume of distribution of enalapril and enalaprilat as follows:
where TV represents the typical value of the PK parameter at given weight, θ represents the population mean of the PK parameter at median body weight of the analysed population (BWmedian) and BWind represents the individual body weight. The exponent, n, was fixed to 0.75 for apparent clearances and fixed to 1 for apparent volumes of distribution. For missing weight values, the last observation carried forward approach was used, in which the missing value is replaced by the last observed value of the subject. For enalapril, both the addition of an absorption lag time and the use of a two-compartment model were tested. For the apparent clearance of enalapril and enalaprilat, the addition of an exponential function and a (sigmoid) maximum effect (Emax) function with postmenstrual or postnatal age was tested as a maturation function.
Model selection was based on the change in the objective function, the change in the residual and interindividual variability, the change in the relative standard errors of the parameter estimates and the visual inspection of the goodness-of-fit plots. Since bioavailability could not be determined on the basis of the available data, the apparent clearance and apparent volume of distribution for enalapril and enalaprilat are given. Samples collected prior to the first administration of enalapril were excluded from the analysis, as no concentration was to be expected at that time in the ACEi naïve subjects. Furthermore, samples with insufficient information on dosing were excluded from the analysis. Samples with concentrations below the limit of quantification were either excluded (M1 method) or treated as censored (M3 method), and the respective estimates of the PK parameters were compared [22].
Covariate Model Development
The stepwise covariate modelling approach was used to test potential covariates. Physiologically plausible covariate relationships were previously defined. Thus, age, sex, serum creatinine and Ross score were tested as covariates for the apparent clearance of enalapril and enalaprilat. In addition, age, sex and Ross score were tested as covariates for the apparent volume of distribution of enalapril and enalaprilat. The covariate Ross score represents the modified Ross score determined by the investigator [23]. In the forward step, a reduction in the objective function value of at least 3.84 (p < 0.05, one degree of freedom) led to the inclusion of the covariate in the model. To retain the covariate in the model, the increase in the objective function value after removal of the covariate had to be at least 6.63 (p < 0.01, one degree of freedom) in the backward step. A linear function model was tested for continuous and categorical covariates. For age and serum creatinine, a power function model was initially tested. If this led to the inclusion of the covariate, in the next step it was tested whether an exponential function model was superior to the power function model. For the Ross score, the exponential function model was tested directly, as the Ross score can also be zero and therefore the power function model cannot be used. As the continuous covariates age, serum creatinine and Ross score were time-varying covariates, this was considered in the stepwise covariate modelling. The only categorical covariate, sex, was included in the model as follows for the covariate search:
where TV represents the typical value of the PK parameter for the respective sex (female = 0, male = 1), θ1 represents the population mean of the PK parameter for female subjects and θ2 represents the proportional change in the population mean of the PK parameter in male subjects compared with female subjects.
Model Evaluation
The final model was evaluated by visual inspection of the goodness-of-fit plots and the prediction- and variability-corrected visual predictive checks (pvcVPCs) [24]. The pvcVPCs were generated based on 2000 simulated replicates of the original dataset design. In addition, a nonparametric bootstrap was performed. Therefore, a total of 1000 bootstrap datasets were generated by resampling with replacement from the original dataset. The calculation of the median and the 95% confidence interval (CI) of the model parameters was carried out once with and once without the runs with rounding errors. Furthermore, the condition number was calculated for the final model to check for overparameterisation, where a value above 1000 may indicate overparameterisation [24].
Simulations
Simulations were performed with the final model to assess the impact of weight and the included covariates. A subject with the weighted median weight of the population and the weighted medians of the included covariates (calculated by Perl-speaks-NONMEM) served as the reference subject. For the variation of the covariates, the 5th, 25th, 75th and 95th percentiles of the weight and the included covariates of the analysed population were calculated. One covariate was varied at a time and serum concentrations of enalaprilat were simulated for the different scenarios. As the subjects were children, it was not sensible to vary the age and weight completely independently. Therefore, a suitable weight was selected for the above-mentioned percentiles of age using the World Health Organization (WHO) weight percentiles [25]. Similarly, a suitable age for the above-mentioned percentiles of weight was selected using the WHO weight percentiles. The population analysed included both underweight and normal weight subjects. Therefore, when selecting the appropriate weights and ages, the first WHO weight percentile was used to represent underweight children and the 50th WHO weight percentile was used to represent normal weight children. As there are separate WHO weight percentiles for girls and boys, the mean of the values determined for girls and boys was used.
The parameter uncertainty was considered by using the estimates of the fixed-effect parameters of the bootstrap runs, while the interindividual variability was omitted. For each bootstrap dataset, AUC and the maximum serum drug concentration (Cmax) after the first dose and at steady state were determined for each covariate scenario. The AUC and Cmax were dose normalised by dividing by the simulated dose and standardised by dividing by the respective AUC and Cmax of the reference person. Finally, the 5th, 50th and 95th percentiles for the dose normalised and standardised AUC and Cmax were calculated for each covariate scenario investigated and presented graphically in a forest plot.
Simulated serum concentrations of enalaprilat over 240 h after a single dose of 0.25 mg enalapril maleate were used to obtain an approximation of the area under the concentration–time curve from time zero to infinity (AUC∞) after the first dose. The dose of 0.25 mg enalapril maleate was chosen according to the dosing regimen. For the steady state simulation, it was assumed that the age-appropriate target dose according to the dosing regimen was administered every 12 h. The serum concentration of enalaprilat was simulated for 252 h and then the AUC from 240 to 252 h was calculated to obtain the area under the concentration–time curve during a dosage interval (AUCτ) at steady state. To obtain the maximum serum drug concentration after the first dose (Cmax,1) and the maximum steady state serum drug concentration during a dosage interval (Cmax,ss), the highest concentration reached after the first dose and at steady state was determined.
In addition, analogue simulations after the first dose were performed solely with the variation of the Ross score. Every possible expression of the Ross score between the minimum and maximum Ross score of the population was tested. As only the single dose of 0.25 mg enalapril maleate was used in the simulations, no dose normalisation was performed. The Cmax,1 at different Ross scores was illustrated with boxplots.
Results
Data
Of the 35 ACEi naïve subjects, 34 subjects could be included in the PopPK analysis. One subject was excluded because, for unknown reasons, no enalapril or enalaprilat concentration was measurable during the full profile. A total of 173 quantifiable serum concentrations of enalapril and 268 quantifiable serum concentrations of enalaprilat were included in the analysis. Per subject, a median of 4.5 quantifiable observations (range 3–9) were available for enalapril and a median of 8 quantifiable observations (range 3–10) were available for enalaprilat. For the M3 method, the samples below the quantification limit (46.3% of the enalapril samples and 17.0% of the enalaprilat samples) were included and treated as censored. For enalapril and enalaprilat, eight measured concentrations had to be excluded due to insufficient information about the dosage or insufficient information about the time of treatment discontinuation. As a result, for one subject only the full profile measurements were included in the analysis. In this subject, however, enalapril therapy was prematurely discontinued anyway after 9 days due to hypotension. In two subjects, enalapril therapy was terminated prematurely at the third study control visit, as the subjects’ condition had improved to such an extent that the therapy was no longer required. A total of 34 enalapril and 34 enalaprilat measurements prior to administration of the first dose were excluded, as no concentration was expected in the ACEi naïve subjects at this time. In addition, an enalapril measurement more than 1 month after the last enalapril administration was excluded, as no concentration was expected at this time either. The observed enalapril and enalaprilat serum concentrations over time are shown in Fig. 1. The majority of enalapril values below the limit of quantification (90 %) were more than 10 h since the last dose. The majority of enalaprilat values below the limit of quantification (82 %) were less than 2.5 h since the last dose.
Fig. 1.

Observed concentration of enalapril (a) and enalaprilat (b) plotted against time since last dose on a linear scale. The inset plots show the data on a logarithmic–linear scale. The dashed line indicates the lower limit of quantification. Observations above the lower limit of quantification are shown as black circles and observations below the lower limit of quantification are shown as red circles. Darker circles indicate overlapping observations
The patient characteristics on the day of the first administration of enalapril are shown in Table 1. The subjects received a median first dose of 0.06 mg/kg (range 0.03–0.08 mg/kg) enalapril maleate. In one subject, 0.125 mg enalapril maleate was administered as a dispersion in the first week of treatment. One subject received 0.75 mg enalapril maleate twice daily during the dose increase. This intermediate step in the dose increase was not normally provided for in the dosing regimen. Of the 34 subjects, 27 received a higher starting dose than recommended in the dosing regimen, based on the investigator's judgement. In three subjects, titration was carried out up to the recommended target dose of the dosing regimen. The highest daily dose administered to the subjects was a median of 0.12 mg/kg (range 0.07–0.29 mg/kg, n = 33) enalapril maleate, determined at the time of the first administration of this daily dose.
Table 1.
Patient characteristics on the day of the first administration of enalapril
| Characteristic | Number (%) | Mean (SD) | Median (range) |
|---|---|---|---|
| Age (years) | 34 (100) | 0.38 (0.39) | 0.3 (0.07–2.09) |
| Weight (kg) | 34 (100) | 5.08 (1.89) | 4.47 (2.52–11.3) |
| Ross score | 34 (100) | 4.91 (2.6) | 5 (0–9) |
| Serum creatinine (µmol/L) | 34 (100) | 28.03 (11.77) | 27 (12–68) |
| Sex | 34 (100) | – | – |
| Male | 16 (47.1) | – | – |
| Female | 18 (52.9) | – | – |
| Aetiology of heart failure | 34 (100) | – | – |
| Dilated cardiomyopathy | 3 (8.8) | – | – |
| Congenital heart disease | 31 (91.2) | – | – |
SD standard deviation
A total of eight missing weights were replaced by the last observed weight of the subject according to the last observation carried forward approach. In three cases, the time deviation from the predefined time points of the full profile was greater than 15 min. In five cases, the PK sample was taken during titration or at the end of the study in deviation from the specifications after dosing. In all cases, the exact dosing and sampling times were used. In two cases, the planned 12 h PK sample of the full profile could not be collected. For one subject, the 4 h value of the full profile was not available.
Population Pharmacokinetic Modelling
Base Model
A combined model with a one-compartment model of enalapril coupled with a one-compartment model of enalaprilat with first-order absorption and absorption lag was selected as structural model on the basis of the predefined model selection criteria (Fig. 2). In the base model, a combined error model with an additive and a proportional error for enalapril and a proportional error model for enalaprilat were used. For enalapril and enalaprilat, an allometric scaling with an exponent of 0.75 for the apparent clearance and an exponent of 1 for the apparent volume of distribution was applied. The inclusion of a maturation function for the apparent clearance of enalapril or enalaprilat resulted in high relative standard errors for the parameters of the maturation function and was therefore not considered further. The described base model was run once without the data below the limit of quantification (M1 method) and once with the data below the limit of quantification, treated as censored (M3 method). When data below the limit of quantification were included and treated as censored, the estimates of the PK parameters were only slightly lower (between 4.8 and 14.0% lower) compared with the estimates of the PK parameters obtained when data below the limit of quantification were excluded. Therefore, data below the limit of quantification were excluded in the further steps of model development.
Fig. 2.
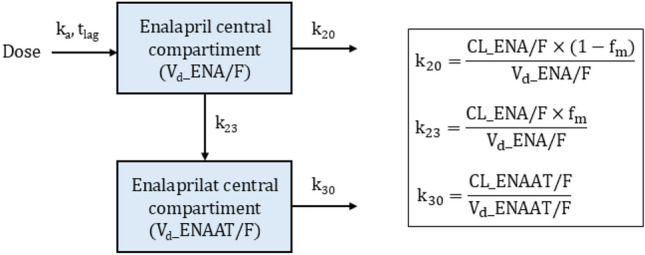
Schematic illustration of the final structural model. The box on the right contains the underlying equations for the transfer rate constants. CL_ENA/F apparent clearance of enalapril, CL_ENAAT/F apparent clearance of enalaprilat, fm fraction of enalapril metabolised (fixed to 0.7), k20 transfer rate constant (first-order) from the central compartment of enalapril to the urine, k23 transfer rate constant (first-order) from the central compartment of enalapril to the central compartment of enalaprilat, k30 transfer rate constant (first-order) from the central compartment of enalaprilat to the urine, ka absorption rate constant (fixed to 0.6 1/h), tlag lag time, Vd_ENA/F apparent volume of distribution of enalapril, Vd_ENAAT/F apparent volume of distribution of enalaprilat
Covariate Analysis
The base model with allometric scaling was used for the covariate analysis. Age and serum creatinine were identified as covariates for the apparent clearance of enalaprilat and the Ross score as a covariate for the apparent volume of distribution of enalaprilat in the forward step of the stepwise covariate modelling. The backward deletion of the covariates mentioned led to a significant increase in the objective function. Therefore, the above covariates were included in the final model. In the final model, the disposition parameters of enalapril and enalaprilat of the individual patient are expressed as follows:
where CL_ENA/F represents the apparent clearance of enalapril, CL_ENAAT/F represents the apparent clearance of enalaprilat, Vd_ENA/F represents the apparent volume of distribution of enalapril, Vd_ENAAT/F represents the apparent volume of distribution of enalaprilat and ηi represents the deviation of the individual patient from the population value. In the population studied, the weighted median calculated by Perl-speaks-NONMEM is for weight 5 kg, for age 0.34 years, for serum creatinine 23.37 µmol/L and for Ross score 4.
The weight-adjusted apparent clearance of enalaprilat increases with increasing age and decreases with increasing serum creatinine. The weight-adjusted apparent volume of distribution of enalaprilat decreases with increasing Ross score. For a subject weighing 5 kg, the apparent volume of distribution of enalaprilat is 62.1 L for a Ross score of 0, and 11.9 L for a Ross score of 11.
Model Evaluation
The goodness-of-fit plots (Fig. 3) and the pvcVPCs (Fig. 4) indicate a good model performance of the final model for enalapril and enalaprilat. The plots of the observed versus the individual predicted concentration show an even distribution around the unity line. Although the scatter around the unity line is greater for enalapril than for enalaprilat. For enalapril and enalaprilat, the conditional weighted residuals versus the population predicted concentration and versus the time since last dose were evenly distributed around zero, and the majority of the conditional weighted residuals ranged between − 2 and 2.
Fig. 3.

Goodness-of-fit plots for the final model of enalapril (a) and enalaprilat (b). For (a) and (b), the red dashed line is the line of unity (top left and top right), the median of the conditional weighted residuals (bottom left) or the reference line of zero (bottom right). Darker circles indicate overlapping observations
Fig. 4.

Prediction- and variability-corrected visual predictive checks of enalapril and enalaprilat for the final model. Observations are shown as circles. Darker circles indicate overlapping observations. The solid line represents the median of the observations. The dashed lines are the 2.5th and 97.5th percentiles of the observations. The shaded areas represent the 95% confidence intervals of the median (grey) and the 2.5th and 97.5th percentiles (blue) predicted by the model
Since 43% of the 1000 performed bootstrap runs resulted in rounding errors, the medians and CI of the model parameters were calculated once with and once without the runs with rounding errors. The results of the two calculations were similar (maximum 7.5% percentage deviation), so the bootstrap results were unaffected by the minimisation status, as already shown by others [26]. Of the runs with rounding errors, 75% had significant digits greater than 2 and 72% had significant digits greater than 3. A total of 1.3% of the runs were not included in the calculation because the estimates were near a boundary, or the hessian of posterior density was non-positive-definite during the search. The condition number of the final model was 2.9 and therefore does not indicate overparameterisation. The results of the final model and the bootstrap results, including the runs with rounding errors, are shown in Table 2. The parameter estimates of the final model were similar to the medians of the bootstrap results and were within the 95% CI of the bootstrap results, indicating that the parameters were well estimated.
Table 2.
Parameter estimates and bootstrap results of the final model
| Parameter | Unit | Final model | Bootstrap | |||
|---|---|---|---|---|---|---|
| Estimate | RSE (%) | Shrinkage (%) | Median | 95% CI | ||
| ka | 1/h | 0.6 | Fixed | – | 0.6 | Fixed |
| CL_ENA/F | L/h | 4.61 | 12.6 | – | 4.53 | 3.43–5.67 |
| CL_ENAAT/F | L/h | 1.55 | 7.1 | – | 1.54 | 1.36–1.75 |
| Vd_ENA/F | L | 4.98 | 18.1 | – | 4.68 | 2.83–8.32 |
| Vd_ENAAT/F | L | 34.1 | 15.7 | – | 33.66 | 24.45–47.14 |
| tlag | h | 0.515 | 2.8 | – | 0.515 | 0.195–0.731 |
| Weight on CL_ENA/F (referenced to 5 kg) | – | 0.75 | Fixed | – | 0.75 | Fixed |
| Weight on CL_ENAAT/F (referenced to 5 kg) | – | 0.75 | Fixed | – | 0.75 | Fixed |
| Weight on Vd_ENA/F (referenced to 5 kg) | – | 1 | Fixed | – | 1 | Fixed |
| Weight on Vd_ENAAT/F (referenced to 5 kg) | – | 1 | Fixed | – | 1 | Fixed |
| Age on CL_ENAAT/F | – | 0.311 | 29.3 | – | 0.316 | 0.092–0.553 |
| Serum creatinine on CL_ENAAT/F | – | − 0.0141 | 33.3 | – | − 0.0141 | − 0.0288 to − 0.004 |
| Ross score on Vd_ENAAT/F | – | − 0.15 | 26.3 | – | − 0.149 | − 0.248 to − 0.004 |
| Interindividual variabilitya | ||||||
| IIV CL_ENA/F | % | 65.3 | 30 | 9.7 | 62.6 | 37.7–82.7 |
| IIV CL_ENAAT/F | % | 37.7 | 30.1 | 6.5 | 35.6 | 25.4–48.7 |
| IIV Vd_ENA/F | % | 80.2 | 41.5 | 17.8 | 79.8 | 41.0–114.3 |
| IIV Vd_ENAAT/F | % | 90.4 | 27.9 | 4.9 | 87.5 | 56.1–114.9 |
| Residual variability enalapril | ||||||
| Proportional errorb | % | 53.5 | 19.9 | 10 | 52.7 | 39.6–64.1 |
| Additive errorc | µg/L | 1.34 | 23.1 | 10 | 1.27 | 0.56–2.09 |
| Residual variability enalaprilat | ||||||
| Proportional errorb | % | 39.5 | 11.3 | 9.9 | 39.2 | 33.9–44.2 |
CL_ENA/F, CL_ENAAT/F, Vd_ENA/F and Vd_ENAAT/F estimates are given for a patient with a body weight of 5 kg. RSE derived from the covariance matrix (R matrix). CI confidence interval, CL_ENA/F apparent clearance of enalapril, CL_ENAAT/F apparent clearance of enalaprilat, IIV interindividual variability, ka absorption rate constant, RSE relative standard error, tlag lag time, Vd_ENA/F apparent volume of distribution of enalapril, Vd_ENAAT/F apparent volume of distribution of enalaprilat
aThe interindividual variability is expressed as a coefficient of variation calculated according to the equation , where ω2 is the NONMEM® output for the interindividual variability of the parameter estimate
bThe proportional error is expressed as a coefficient of variation calculated according to the equation , where σ2 is the NONMEM® output for the proportional error term
cThe additive error is expressed as standard deviation calculated according to the equation , where σ2 is the NONMEM® output for the additive error term
Simulations
The impact of weight and the included covariates on the predicted PK parameters of enalaprilat after the first dose (AUC∞, Cmax,1) and at steady state (AUCτ, Cmax,ss) compared with the reference subject is shown in Fig. 5. A subject with a weight of 5 kg, an age of 0.34 years, a Ross score of 4 and a serum creatinine of 23.37 µmol/L served as the reference subject. The ratio to the reference subject for the aforementioned PK parameters is presented for the 5th, 25th, 75th and 95th percentile of weight (underweight), age (underweight and normal weight), Ross score and serum creatinine of the analysed population. For weight (normal weight), the ratio to the reference subject for the 5th percentile of weight (3.32 kg) is not presented. To represent a normal weight, an age of 0.02 years was assigned based on the 50th WHO weight percentile. As this was an extrapolation, because the youngest child in the analysed population was 0.07 years old, this covariate scenario was excluded. The simulations were each carried out with 988 parameter datasets (dataset of the final model + 987 bootstrap data sets).
Fig. 5.

Impact of weight and statistically significant covariates included in the final model on the predicted pharmacokinetic parameters of enalaprilat after the first dose (AUC∞, Cmax,1) and at steady state (AUCτ, Cmax,ss). The predicted AUC∞, AUCτ, Cmax,1 and Cmax,ss at the given weight and covariate values (5th, 25th, 75th and 95th percentiles of the analysed population) were compared with those predicted for a reference subject with a weight of 5 kg, an age of 0.34 years, a Ross score of 4 and a serum creatinine of 23.37 µmol/L. The black dots and error bars show the median of the ratio to reference with a 90% confidence interval (n = 988). The grey area shows the 80–125% range in relation to the reference, whereby the selected range is based on the standard bioequivalence limits. AUC∞ area under the concentration–time curve from time zero to infinity, AUCτ area under the concentration–time curve during a dosage interval, Cmax,1 maximum serum drug concentration after the first dose, Cmax,ss maximum steady state serum drug concentration during a dosage interval
As expected, the simulations provided the same results for the AUC∞ after the first dose and the AUCτ at steady state. Compared with the reference subject with a weight of 5 kg, an underweight subject weighing 3.32 kg was estimated to have a median AUC that was 100% [90% CI: 61 to 153%] higher and an underweight subject weighing 9.61 kg was estimated to have a median AUC that was 67% [90% CI: − 77 to − 53%] lower. In comparison with the reference subject aged 0.34 years, the median AUC was estimated to be 89% [90% CI: 54 to 134%] higher in an underweight subject aged 0.11 years and estimated to be 52% [90% CI: − 63 to − 40%] lower in an underweight subject aged 1.28 years. Considering the impact of weight and age on subjects with normal weight, a similar picture emerged. The variation of the Ross score did not affect the AUC. At a serum creatinine of 42 µmol/L, the median AUC was estimated to be 30% [90% CI: 11 to 58%] higher than in the reference subject, with a serum creatinine of 23.37 µmol/L.
The results for the Cmax,ss are almost the same as for the AUC. For Cmax,1, there were two main differences from the previously reported results. Firstly, the variation in serum creatinine did not lead to a considerable change in Cmax,1. Secondly, the Ross score showed an impact on the Cmax,1. In comparison with the reference subject with a Ross score of 4, the median Cmax,1 was estimated to be 40% [90% CI: − 55 to − 12%] lower in a subject with a Ross score of 0 and estimated to be 60% [90% CI: 13 to 106%] higher in a subject with a Ross score of 8.
The higher the Ross score at the time of the first dose, the higher was the predicted median Cmax,1 of enalaprilat after administration of 0.25 mg enalapril maleate (Fig. 6). With a Ross score of 0, the predicted median Cmax,1 was 1.85 µg/L (interquartile range 0.63), whereas with a Ross score of 11, the predicted median Cmax,1 was 6.79 µg/L (interquartile range 2.81). Due to the exponential relationship, the stepwise increase in Cmax,1 per Ross score point is greater with higher Ross scores. Normalised to dose and weight, the simulated Cmax,1 was between 14.6 µg/L/mg·kg and 280.2 µg/L/mg·kg. In the previous non-compartmental analysis, Cmax,1 ranged between 0 µg/L/mg·kg and 479.6 µg/L/mg·kg for the 32 included ACEi naïve subjects [11]. The smaller range of simulated values is not surprising, as only the covariate Ross score was varied for the simulation.
Fig. 6.

Impact of the Ross score on the maximum serum drug concentration after the first dose (Cmax,1) of enalaprilat after administration of 0.25 mg enalapril maleate. The boxplot shows the predicted Cmax,1 for subjects with a weight of 5 kg, an age of 0.34 years, a serum creatinine of 23.37 µmol/L and a Ross score between 0 and 11 (minimum to maximum Ross score of the analysed population). For each Ross score, 988 Cmax,1 values were estimated. The upper whisker extends from the 75th percentile to the largest value no further than 1.5 times the interquartile range from the 75th percentile. The lower whisker extends from the 25th percentile to the smallest value no further than 1.5 times the interquartile range from the 25th percentile. Data beyond the end of the whiskers are outliers and are shown as black dots. Cmax,1 maximum serum drug concentration after the first dose
Discussion
The PK of enalapril and enalaprilat in ACEi naïve children with heart failure were adequately described by the final combined PopPK model, consisting of a one-compartment model for enalapril coupled with a one-compartment model for enalaprilat with absorption lag. In addition to weight, which was included using allometric scaling, three covariate relationships were identified and included. First, the weight-adjusted apparent clearance of enalaprilat increases with increasing age. Secondly, the weight-adjusted apparent clearance of enalaprilat decreases with increasing serum creatinine. Thirdly, the weight-adjusted apparent volume of distribution of enalaprilat decreases with increasing Ross score. The simulations suggested that age and weight are clinically relevant covariates for both the first dose and the steady state dose of enalapril. Similarly, the simulations suggested that serum creatinine above the normal reference range is a clinically relevant covariate with respect to the first dose and the steady state dose of enalapril. In addition, the simulations indicated that the Ross score is a clinically relevant covariate for the first dose of enalapril.
For the final combined PopPK model, a one-compartment model was selected for both enalapril and enalaprilat. This is partly in line with a PopPK model developed earlier in healthy adults [12]. The adult model also used a one-compartment model for enalapril. For healthy adults a two-compartment model was used for enalaprilat to describe the long lasting biphasic exponential decay of enalaprilat concentrations for about 48 hours after enalapril application. To comply with the recommended limits for blood loss in paediatrics, the total number of samples was less and the duration of sample collection for the full profiles in children with heart failure was only 12 h, which limited the modelling in the elimination phase. Nevertheless, the individual predictions correlated well with the observed concentrations. By extrapolation of the estimated apparent clearances of the children with heart failure to an adult weight of 70 kg, the apparent clearance of enalapril would be 64.5 L/h and the apparent clearance of enalaprilat 21.7 L/h. The adults studied by Najib et al. [27] had an apparent clearance of enalapril of 77.0 L/h and an apparent clearance of enalaprilat of 30.2 L/h, calculated over the mean AUC∞ and the dose given. The extrapolated apparent clearances of the children are in a similar range to those for adults but are lower for both enalapril and enalaprilat. The lower apparent clearances might be explained by the fact that the children investigated had a lower CES1 hydrolytic activity and a lower GFR than adults owing to their age [5, 28]. The extrapolation of the estimated apparent volume of distribution of the children with heart failure to an adult weight of 70 kg would result in an apparent volume of distribution of enalapril of 69.7 L. The apparent volume of distribution of enalapril according to the PopPK model for adults, which also used a one-compartment model for enalapril, was 84.3 L [12]. The moderate difference between the extrapolated value and the value for adults might be explained by the fact that more sampling time points were available for the adults.
The first parameter that should be considered when dosing enalapril is the child’s weight. In the PopPK analysis of enalaprilat based on literature data from children with hypertension, weight was also incorporated into the final model, but the allometric exponents were estimated [14]. The presented PopPK analysis implemented allometric scaling with fixed allometric exponents prior to covariate analysis so that other potential covariate effects could be distinguished from the effect of size [29]. The consideration of weight when dosing enalapril is also reflected in the product information of the authorised enalapril ODMT (Aqumeldi®), where a weight-based recommended range for the initial and target dose is given [30].
The second parameter to consider when choosing the dosage of enalapril is the age of the child. A covariate effect of age on the apparent clearance of the active metabolite enalaprilat was found, but unexpectedly not on the apparent clearance of enalapril. Since enalapril is eliminated by metabolism to a large extent, and enalaprilat is excreted largely renally, it is suspected that the effect of age on renal excretion is greater than on metabolism in the studied population. In the age range from 35 to 198 days, which includes about 70% of the subjects studied, it was shown that CES1 expression and hydrolytic activity are similar [28]. One reason for the lack of effect of age on enalapril apparent clearance could therefore be that in the relatively narrow age range of the subjects, no major change in the metabolising enzyme CES1 takes place. Another reason could be that the number of subjects was too small to observe an effect of age on enalapril apparent clearance. The observed effect of age on enalaprilat apparent clearance might be explained by the large increase in GFR during the first year of life [5, 31]. Except for the recommendation to set the initial dose at the lower end of the recommended dose range for infants < 30 days of age, age is not currently considered in the dosage recommendations of enalapril ODMT [30]. In contrast, the dosing regimen developed for the LENA studies already took the covariate age into account.
The third parameter to be considered when dosing enalapril is the presence of elevated serum creatinine. At a serum creatinine value of 42 µmol/L, corresponding to a GFR of 55 mL/min/1.73 m2 when using the Schwartz formula and an appropriate height for the simulated subject [32], the simulations showed a 30% higher enalaprilat AUC after the first dose and at steady state compared with the reference subject with a normal serum creatinine value. Oguchi et al. [33] showed that adults with moderate renal impairment had a four-fold higher enalaprilat AUC than adults with normal renal function. The larger difference in AUC observed by Oguchi et al. may be explained by the fact that their study group also comprised subjects with a GFR below 55 mL/min/1.73 m2. In line with the simulation results, the product information recommends a reduction in the initial dose of enalapril ODMT in the case of reduced GFR [30]. In the product information, a 50% reduced single dose is recommended as the initial dose if the GFR is between 30 and 50 mL/min/1.73 m2. The simulations performed do not cover this range because only one subject had a GFR in this range at the start of the study, but they suggest that a dose reduction could be considered even at GFRs above this threshold.
The fourth parameter that should be considered when dosing enalapril, or more precisely for the first dose, is the Ross score. The Ross score is used in children to classify the severity of heart failure, like the New York Heart Association (NYHA) classification for adults. The hypothesis is that greater severity of heart failure and a higher degree of heart failure symptoms are associated with a lower volume of distribution for enalaprilat. We also tested the covariate relationship between the Ross score and the apparent clearances. However, in our work we could not determine any impact of the Ross score on the apparent clearances. The majority of our subjects suffered from CHD. In contrast to adults with heart failure and reduced systolic function, children with CHD do not have reduced cardiac contractility but instead pulmonary overcirculation and systemic hypoperfusion due to intracardiac shunts or a patent ductus arteriosus [6]. Also, children with CHD show different symptoms of heart failure, for example, no peripheral oedema. Our suggestion is that, owing to the different pathophysiology, an increase in heart failure symptoms, represented by the Ross Score, in children only affects the volume of distribution and not the clearance, whereas the detailed haemodynamic explanation needs further investigation. The dosage recommendations for enalapril ODMT only include a note that the initial dose should be set at the lower end of the recommended dose range for less stable patients [30]. Thus, the severity of heart failure is not yet taken into account in the dosage recommendations for enalapril ODMT.
An evaluation of the clinical and haemodynamic outcomes of subjects with CHD in the LENA studies showed that at the given doses, the Ross score and left ventricular diastolic dimension z-score decreased significantly after 8 weeks [34]. PK/PD analyses with respect to measured renin–angiotensin–aldosterone system parameters are planned.
Limitations
The PopPK analysis is faced with limitations. Firstly, the GFR could not be used for the covariate analysis because the height of the subjects required for the calculation of the GFR was only available at the first and last visit of the study. Therefore, serum creatinine was used as a parameter for renal function in the covariate analysis. Secondly, the results primarily allow conclusions to be drawn for children with CHD, as these made up the majority of the subjects. Thirdly, the extent of the interindividual variability of the PK parameters is comparable to that of other PopPK analyses, if the boundary conditions of our study are kept in mind. Nevertheless, other covariates for which no information was available could play a role. For example, polymorphisms of the metabolising enzyme CES1 or the hepatic uptake transporter organic anion-transporting polypeptide 1B1 (OATP1B1) could be partly responsible for the observed interindividual variability of the PK parameters. Several CES1 polymorphisms are known to affect CES1 activity and can lead to lower enalaprilat concentrations [35]. In subjects with an OATP1B1 polymorphism, a significantly higher systemic exposure of enalapril at steady state and a significantly lower systemic exposure of enalaprilat after a single dose were observed [36]. Fourthly, a fixed value for the metabolised fraction was used because no urine data were available. The metabolised fraction influences the oral bioavailability of enalapril and the apparent volume of distribution of enalaprilat. Therefore, we selected the metabolised fraction based on data from the literature, obtained from children of a similar age. Despite these limitations, the PK of enalapril and enalaprilat in ACEi naïve children with heart failure were well predicted by the final model.
Conclusions
The results of the PopPK analysis and simulations confirm the consideration of the currently used parameters weight and renal function in the dosage of enalapril in children with heart failure and provide further insights into these. The identified covariate age indicates that the age- and weight-dependent dosing regimen is preferable to sole weight-dependent dosing. In addition, the newly identified covariate Ross score indicates that the severity of heart failure should be considered for the choice of the initial dose of enalapril. To avoid high peak concentrations and a possible drop in blood pressure, the initial dose should be reduced depending on the Ross score. The subjects analysed were children with heart failure aged between 25 days and 2.1 years without previous ACEi treatment and without severe renal impairment, with the majority of children being under 1 year old and suffering from CHD. It should be noted that the results primarily allow conclusions to be drawn about patients within these criteria.
Supplementary Information
Below is the link to the electronic supplementary material.
Acknowledgements
We thank Anke Bartel and Jutta Tins for their assistance in the preparation of the datasets and for double-checking the data. We thank Dr Muhammed Faisal for the insights and discussions about his previous work on the LENA project. We thank the LENA Consortium for having discussed the results of the primary objective throughout the LENA project from 2013 to 2019 at meetings. The complete LENA Consortium is listed below. LENA beneficiaries and principal investigators other than the authors: Jörg Breitkreutz, Germany. Ingrid Klingmann, Belgium. Florian Lagler, Austria. Jan de Hoon, Belgium. Michiel Dalinghaus, the Netherlands. Milica Bajcetic, Serbia. Saskia de Wildt, the Netherlands. Anne Keatley Clarke, United Kingdom. Johannes Breur, the Netherlands. Christoph Male, Austria. Laszlo Ablonczy, Hungary. Thomas Mir, Germany. Vladislav Vukomanovic, Serbia. Milan Dukic, Serbia. Ida Jovanovic, Serbia. Advanced Scientists: Björn B. Burckhardt, Karl Kleine, Angelika Moder, Emina Obarcanin, Peter Wagner, Jennifer Walsh, Anne van Hecken and Lucie Spatenkova. Scientists and young scientists: Mohsin Ali, Bojana Božić, Maja Bijelić, Ilja Burdman, Agnes Ciplea, Muhammed Faisal, Samieh Farahani, Martin Feickert, Tanja Gangnus, Milica Lazic, Nina Makowski, Fabian Süssenbach, Marijke van der Meulen, Saša Popović, Miro Parezanović, Nori Smeets and Vanessa Swoboda. Clinical investigators: Dragana Bojanin, Stefan Đorđević, Jasminka Dragić, Ann-Kathrin Holle, Bosiljka Jovičić, Jovan Košutić, Gordana Kozomara, Haidara Majid, Jadranka Mitrović, Sanja Ninić, Miro Parezanovic, Vojislav Parezanovic, Andrija Pavlović, Sergej Prijić, Branislava Rebić, Igor Stefanović, Daniel Tordas and Irena Vulićević. Study nurses, technicians, social workers: Anke Bartel, Andjelka Čeko, Marissa Herborts, Annelies Hennink, Bosiljka Kosanović, Sanja Kostic, Ljiljana Isailović, Jasmina Maksimovic, Badies Manai, Nada Martinović, Gyöngyi Máté, Miloš Perišić, Jelena Reljić, Regina Pirker, Marta Salamomovic, Claudia Schlesner, Jutta Tins and Eva Wissmann.
Declarations
Funding
Open Access funding enabled and organized by Projekt DEAL. The research work is based on the data of the project Labeling of Enalapril from Neonates up to Adolescents (LENA), which was funded by a European Union Seventh Framework Program (FP7/2007-2013) under the grant agreement no. 602295. The open access fee was funded by the Heinrich Heine University Düsseldorf.
Conflicts of Interest
The authors declare no conflicts of interest.
Availability of Data and Material:
The analysed datasets from the LENA project are not publicly available due to the data protection contract of the product owner.
Ethics Approval
The study protocols responding to specific national requirements were submitted to the responsible Independent Ethics Committees (IECs) in the participating countries for review and received approval. The address from the Ethics Committee of the coordinating principal investigator’s IEC of Study EudraCT 2015-002335-17 (DCM patients) was: Secretariaat Medisch Ethische Toetsings Commissie Erasmus MC, Postbus 2040, 3000 CA Rotterdam, the Netherlands, NL, dossiers: 4 December 2015, nos. NL54914.078.15, NL54738.078.15, MEC-2015-634 and MEC-2015-635; Ethics Committee UMC Utrecht, NL: 17 February 2016 nos. Mvd/vb/16/004864, Mvd/vb/16/004964; Medical Research Council, Ethics Committee for Clinical Pharmacology, National Institute of Pharmacy and Nutrition, Budapest, 30 November 2015, nos. OGYI/36681-7/2015 and OGYI/36999-9/2015; Ethikkommission Medizinische Universität Wien: 21 December 2015 no.1803/2015. The address of the coordinating principal investigator’s IEC of study EudraCT 2015-002396-18 (CHD patients) was: Ethics Committee of the University Children’s Hospital in Belgrade and the Institute of Mother and Child Health ‘Dr Vukan Čupić’ Univerzitetska Dečja Klinika, Tirsova 10, 11129 Belgrade, Serbia. 29 February 2016 and 5 April 2017, nos. 26/307 and 8/9; Ethikkommisison der Ärztekammer Hamburg, Germany, 22 May 2017, PVN9495 and PVN5496. The studies were conducted in accordance with the Declaration of Helsinki.
Consent to Participate
Informed parental consent was obtained for each subject included in the studies. Assent of participating children was obtained in accordance with national requirements.
Consent for Publication
Not applicable.
Code Availability
Not applicable.
Author Contributions
Conception and design of the work were developed by M.S., C.W. and S.L. Data preparation was performed by M.S. M.S. performed the population pharmacokinetic analysis and simulations. W.C. and S.L. critically reviewed and discussed the analysis and simulations. M.S. drafted the manuscript. W.C. and S.L. critically reviewed and revised the manuscript. All authors read and approved the final manuscript.
Footnotes
The members of the LENA Consortium are mentioned in Acknowledgements section.
Contributor Information
Melina Steichert, Email: melina.steichert@hhu.de.
the LENA Consortium:
Jörg Breitkreutz, Ingrid Klingmann, Florian Lagler, Jan de Hoon, Michiel Dalinghaus, Milica Bajcetic, Saskia N. de Wildt, Anne Keatley-Clarke, Johannes M. P. J. Breur, Christoph Male, Laszlo Ablonczy, Thomas Mir, Vladislav Vukomanovic, Milan Dukic, Ida Jovanovic, Bjoern B. Burckhardt, Karl Kleine, Angelika Moder, Emina Obarcanin, Peter Wagner, Jennifer Walsh, Anne van Hecken, Lucie Spatenkova, Mohsin Ali, Bojana Božić, Maja Bijelić, Ilja Burdman, Agnes Ciplea, Muhammed Faisal, Samieh Farahani, Martin Feickert, Tanja Gangnus, Milica Lazic, Nina Makowski, Fabian Süssenbach, Marijke van der Meulen, Saša Popović, Miro Parezanović, Nori Smeets, Vanessa Swoboda, Dragana Bojanin, Stefan Đorđević, Jasminka Dragić, Ann-Kathrin Holle, Bosiljka Jovičić, Jovan Košutić, Gordana Kozomara, Haidara Majid, Jadranka Mitrović, Sanja Ninić, Miro Parezanovic, Vojislav Parezanovic, Andrija Pavlović, Sergej Prijić, Branislava Rebić, Igor Stefanović, Daniel Tordas, Irena Vulićević, Anke Bartel, Andjelka Čeko, Marissa Herborts, Annelies Hennink, Bosiljka Kosanović, Sanja Kostic, Ljiljana Isailović, Jasmina Maksimovic, Badies Manai, Nada Martinović, Gyöngyi Máté, Miloš Perišić, Jelena Reljić, Regina Pirker, Marta Salamomovic, Claudia Schlesner, Jutta Tins, and Eva Wissmann
References
- 1.EMA. Aqumeldi (enalapril): European public assessment report [online]. Available from URL: https://www.ema.europa.eu/en/documents/overview/aqumeldi-epar-medicine-overview_en.pdf. Accessed 9 Aug 2024.
- 2.Kirk R, Dipchand AI, Rosenthal DN, et al. The International Society for Heart and Lung Transplantation Guidelines for the management of pediatric heart failure: executive summary. Corrected. J Heart Lung Transplant. 2014;33(9):888–909. [DOI] [PubMed] [Google Scholar]
- 3.Castro Díez C, Khalil F, Schwender H, et al. Pharmacotherapeutic management of paediatric heart failure and ACE-I use patterns: a European survey. BMJ Paediatr Open. 2019;3(1): e000365. [DOI] [PMC free article] [PubMed] [Google Scholar]
- 4.Boberg M, Vrana M, Mehrotra A, et al. Age-dependent absolute abundance of hepatic carboxylesterases (CES1 and CES2) by LC-MS/MS proteomics: application to PBPK modeling of oseltamivir in vivo pharmacokinetics in infants. Drug Metab Dispos. 2017;45(2):216–23. [DOI] [PMC free article] [PubMed] [Google Scholar]
- 5.Kearns GL, Abdel-Rahman SM, Alander SW, Blowey DL, Leeder JS, Kauffman RE. Developmental pharmacology—drug disposition, action, and therapy in infants and children. N Engl J Med. 2003;349(12):1157–67. [DOI] [PubMed] [Google Scholar]
- 6.Kantor PF, Lougheed J, Dancea A, et al. Presentation, diagnosis, and medical management of heart failure in children: Canadian Cardiovascular Society guidelines. Can J Cardiol. 2013;29(12):1535–52. [DOI] [PubMed] [Google Scholar]
- 7.Schwartz JB, Taylor A, Abernethy D, et al. Pharmacokinetics and pharmacodynamics of enalapril in patients with congestive heart failure and patients with hypertension. J Cardiovasc Pharmacol. 1985;7(4):767–76. [DOI] [PubMed] [Google Scholar]
- 8.Brunner-La Rocca HP, Weilenmann D, Kiowski W, Maly FE, Follath F. Plasma levels of enalaprilat in chronic therapy of heart failure: relationship to adverse events. J Pharmacol Exp Ther. 1999;289(1):565–71. [PubMed] [Google Scholar]
- 9.Wells T, Rippley R, Hogg R, et al. The pharmacokinetics of enalapril in children and infants with hypertension. J Clin Pharmacol. 2001;41(10):1064–74. [DOI] [PubMed] [Google Scholar]
- 10.Nakamura H, Ishii M, Sugimura T, Chiba K, Kato H, Ishizaki T. The kinetic profiles of enalapril and enalaprilat and their possible developmental changes in pediatric patients with congestive heart failure. Clin Pharmacol Ther. 1994;56(2):160–8. [DOI] [PubMed] [Google Scholar]
- 11.Laeer S, Cawello W, Burckhardt BB, et al. Enalapril and enalaprilat pharmacokinetics in children with heart failure due to dilated cardiomyopathy and congestive heart failure after administration of an orodispersible enalapril minitablet (LENA-studies). Pharmaceutics. 2022;14(6):1163. [DOI] [PMC free article] [PubMed] [Google Scholar]
- 12.Faisal M, Cawello W, Burckhardt BB, de Hoon J, Laer S. Simultaneous Semi-mechanistic population pharmacokinetic modeling analysis of enalapril and enalaprilat serum and urine concentrations from child appropriate orodispersible minitablets. Front Pediatr. 2019;7:281. [DOI] [PMC free article] [PubMed] [Google Scholar]
- 13.Ajayi AA, Campbell BC, Kelman AW, Howie C, Meredith PA, Reid JL. Pharmacodynamics and population pharmacokinetics of enalapril and lisinopril. Int J Clin Pharmacol Res. 1985;5(6):419–27. [PubMed] [Google Scholar]
- 14.Kechagia I-A, Kalantzi L, Dokoumetzidis A. Extrapolation of enalapril efficacy from adults to children using pharmacokinetic/pharmacodynamic modelling. J Pharm Pharmacol. 2015;67(11):1537–45. [DOI] [PubMed] [Google Scholar]
- 15.Bajcetic M, de Wildt SN, Dalinghaus M, et al. Orodispersible minitablets of enalapril for use in children with heart failure (LENA): rationale and protocol for a multicentre pharmacokinetic bridging study and follow-up safety study. Contemp Clin Trials Commun. 2019;15: 100393. [DOI] [PMC free article] [PubMed] [Google Scholar]
- 16.EMA. Ethical considerations for clinical trials on medicinal products conducted with the paediatric population [online]. Available from URL: https://health.ec.europa.eu/system/files/2016-11/ethical_considerations_en_0.pdf. Accessed 5 July 2024. [DOI] [PubMed]
- 17.Lindbom L, Pihlgren P, Jonsson EN. PsN-Toolkit–a collection of computer intensive statistical methods for non-linear mixed effect modeling using NONMEM. Comput Methods Programs Biomed. 2005;79(3):241–57. [DOI] [PubMed] [Google Scholar]
- 18.Lindbom L, Ribbing J, Jonsson EN. Perl-speaks-NONMEM (PsN)–a Perl module for NONMEM related programming. Comput Methods Programs Biomed. 2004;75(2):85–94. [DOI] [PubMed] [Google Scholar]
- 19.Elmokadem A, Riggs MM, Baron KT. Quantitative systems pharmacology and physiologically-based pharmacokinetic modeling with mrgsolve: a hands-on tutorial. CPT Pharmacomet Syst Pharmacol. 2019;8(12):883–93. [DOI] [PMC free article] [PubMed] [Google Scholar]
- 20.Marier J-F, Teuscher N, Mouksassi M-S. Evaluation of covariate effects using forest plots and introduction to the coveffectsplot R package. CPT Pharmacomet Syst Pharmacol. 2022;11(10):1283–93. [DOI] [PMC free article] [PubMed] [Google Scholar]
- 21.Faisal M, Steichert M, Cawello W, Laeer S, and the LENA consortium. Enalapril orodispersible minitablets for pediatric heart failure—a population pharmacokinetic analysis from multicenter Phase II/III LENA clinical trials [online]. Available from URL: www.page-meeting.org/?abstract=10341. Accessed 5 July 2024.
- 22.Ahn JE, Karlsson MO, Dunne A, Ludden TM. Likelihood based approaches to handling data below the quantification limit using NONMEM VI. J Pharmacokinet Pharmacodyn. 2008;35(4):401–21. [DOI] [PubMed] [Google Scholar]
- 23.Läer S, Mir TS, Behn F, et al. Carvedilol therapy in pediatric patients with congestive heart failure: a study investigating clinical and pharmacokinetic parameters. Am Heart J. 2002;143(5):916–22. [DOI] [PubMed] [Google Scholar]
- 24.Byon W, Smith MK, Chan P, et al. Establishing best practices and guidance in population modeling: an experience with an internal population pharmacokinetic analysis guidance. CPT Pharmacomet Syst Pharmacol. 2013;2(7): e51. [DOI] [PMC free article] [PubMed] [Google Scholar]
- 25.World Health Organization. Length/height-for-age, weight-for-age, weight-for-length, weight-for-height and body mass index-for-age; methods and development. WHO child growth standards. Geneva: WHO Press; 2006. [Google Scholar]
- 26.Gastonguay M, Eltahtawy A. Effect of NONMEM minimization status and number of replicates on bootstrap parameter distributions for population pharmacokinetic models: a case study. Clin Pharmacol Ther. 2005;77(2):P2–P2. [Google Scholar]
- 27.Najib NM, Idkaidek N, Adel A, et al. Bioequivalence evaluation of two brands of enalapril 20 mg tablets (Narapril and Renitec) in healthy human volunteers. Biopharm Drug Dispos. 2003;24(7):315–20. [DOI] [PubMed] [Google Scholar]
- 28.Shi D, Yang D, Prinssen EP, Davies BE, Yan B. Surge in expression of carboxylesterase 1 during the post-neonatal stage enables a rapid gain of the capacity to activate the anti-influenza prodrug oseltamivir. J Infect Dis. 2011;203(7):937–42. [DOI] [PMC free article] [PubMed] [Google Scholar]
- 29.Meibohm B, Läer S, Panetta JC, Barrett JS. Population pharmacokinetic studies in pediatrics: issues in design and analysis. AAPS J. 2005;7(2):E475–87. [DOI] [PMC free article] [PubMed] [Google Scholar]
- 30.Proveca Pharma Limited. AQUMELDI: Summary of product characteristics [online]. Available from URL: https://www.ema.europa.eu/en/documents/product-information/aqumeldi-epar-product-information_en.pdf. Accessed 6 Sep 2024.
- 31.Chen N, Aleksa K, Woodland C, Rieder M, Koren G. Ontogeny of drug elimination by the human kidney. Pediatr Nephrol. 2006;21(2):160–8. [DOI] [PubMed] [Google Scholar]
- 32.Schwartz GJ, Feld LG, Langford DJ. A simple estimate of glomerular filtration rate in full-term infants during the first year of life. J Pediatr. 1984;104(6):849–54. [DOI] [PubMed] [Google Scholar]
- 33.Oguchi H, Miyasaka M, Koiwai T, et al. Pharmacokinetics of temocapril and enalapril in patients with various degrees of renal insufficiency. Clin Pharmacokinet. 1993;24(5):421–7. [DOI] [PubMed] [Google Scholar]
- 34.Bijelic M, Djukic M, Vukomanovic V, et al. Clinical and hemodynamic outcomes with enalapril orodispersible minitablets in young children with heart failure due to congenital heart disease. J Clin Med 2024;13(17):4976. [DOI] [PMC free article] [PubMed]
- 35.Hussain M, Basheer S, Khalil A, Haider QUA, Saeed H, Faizan M. Pharmacogenetic study of CES1 gene and enalapril efficacy. J Appl Genet 2024;65(3):463-471. [DOI] [PubMed]
- 36.Tian L, Liu H, Xie S, et al. Effect of organic anion-transporting polypeptide 1B1 (OATP1B1) polymorphism on the single- and multiple-dose pharmacokinetics of enalapril in healthy Chinese adult men. Clin Ther. 2011;33(5):655–63. [DOI] [PubMed] [Google Scholar]
Associated Data
This section collects any data citations, data availability statements, or supplementary materials included in this article.