
Figure 4.
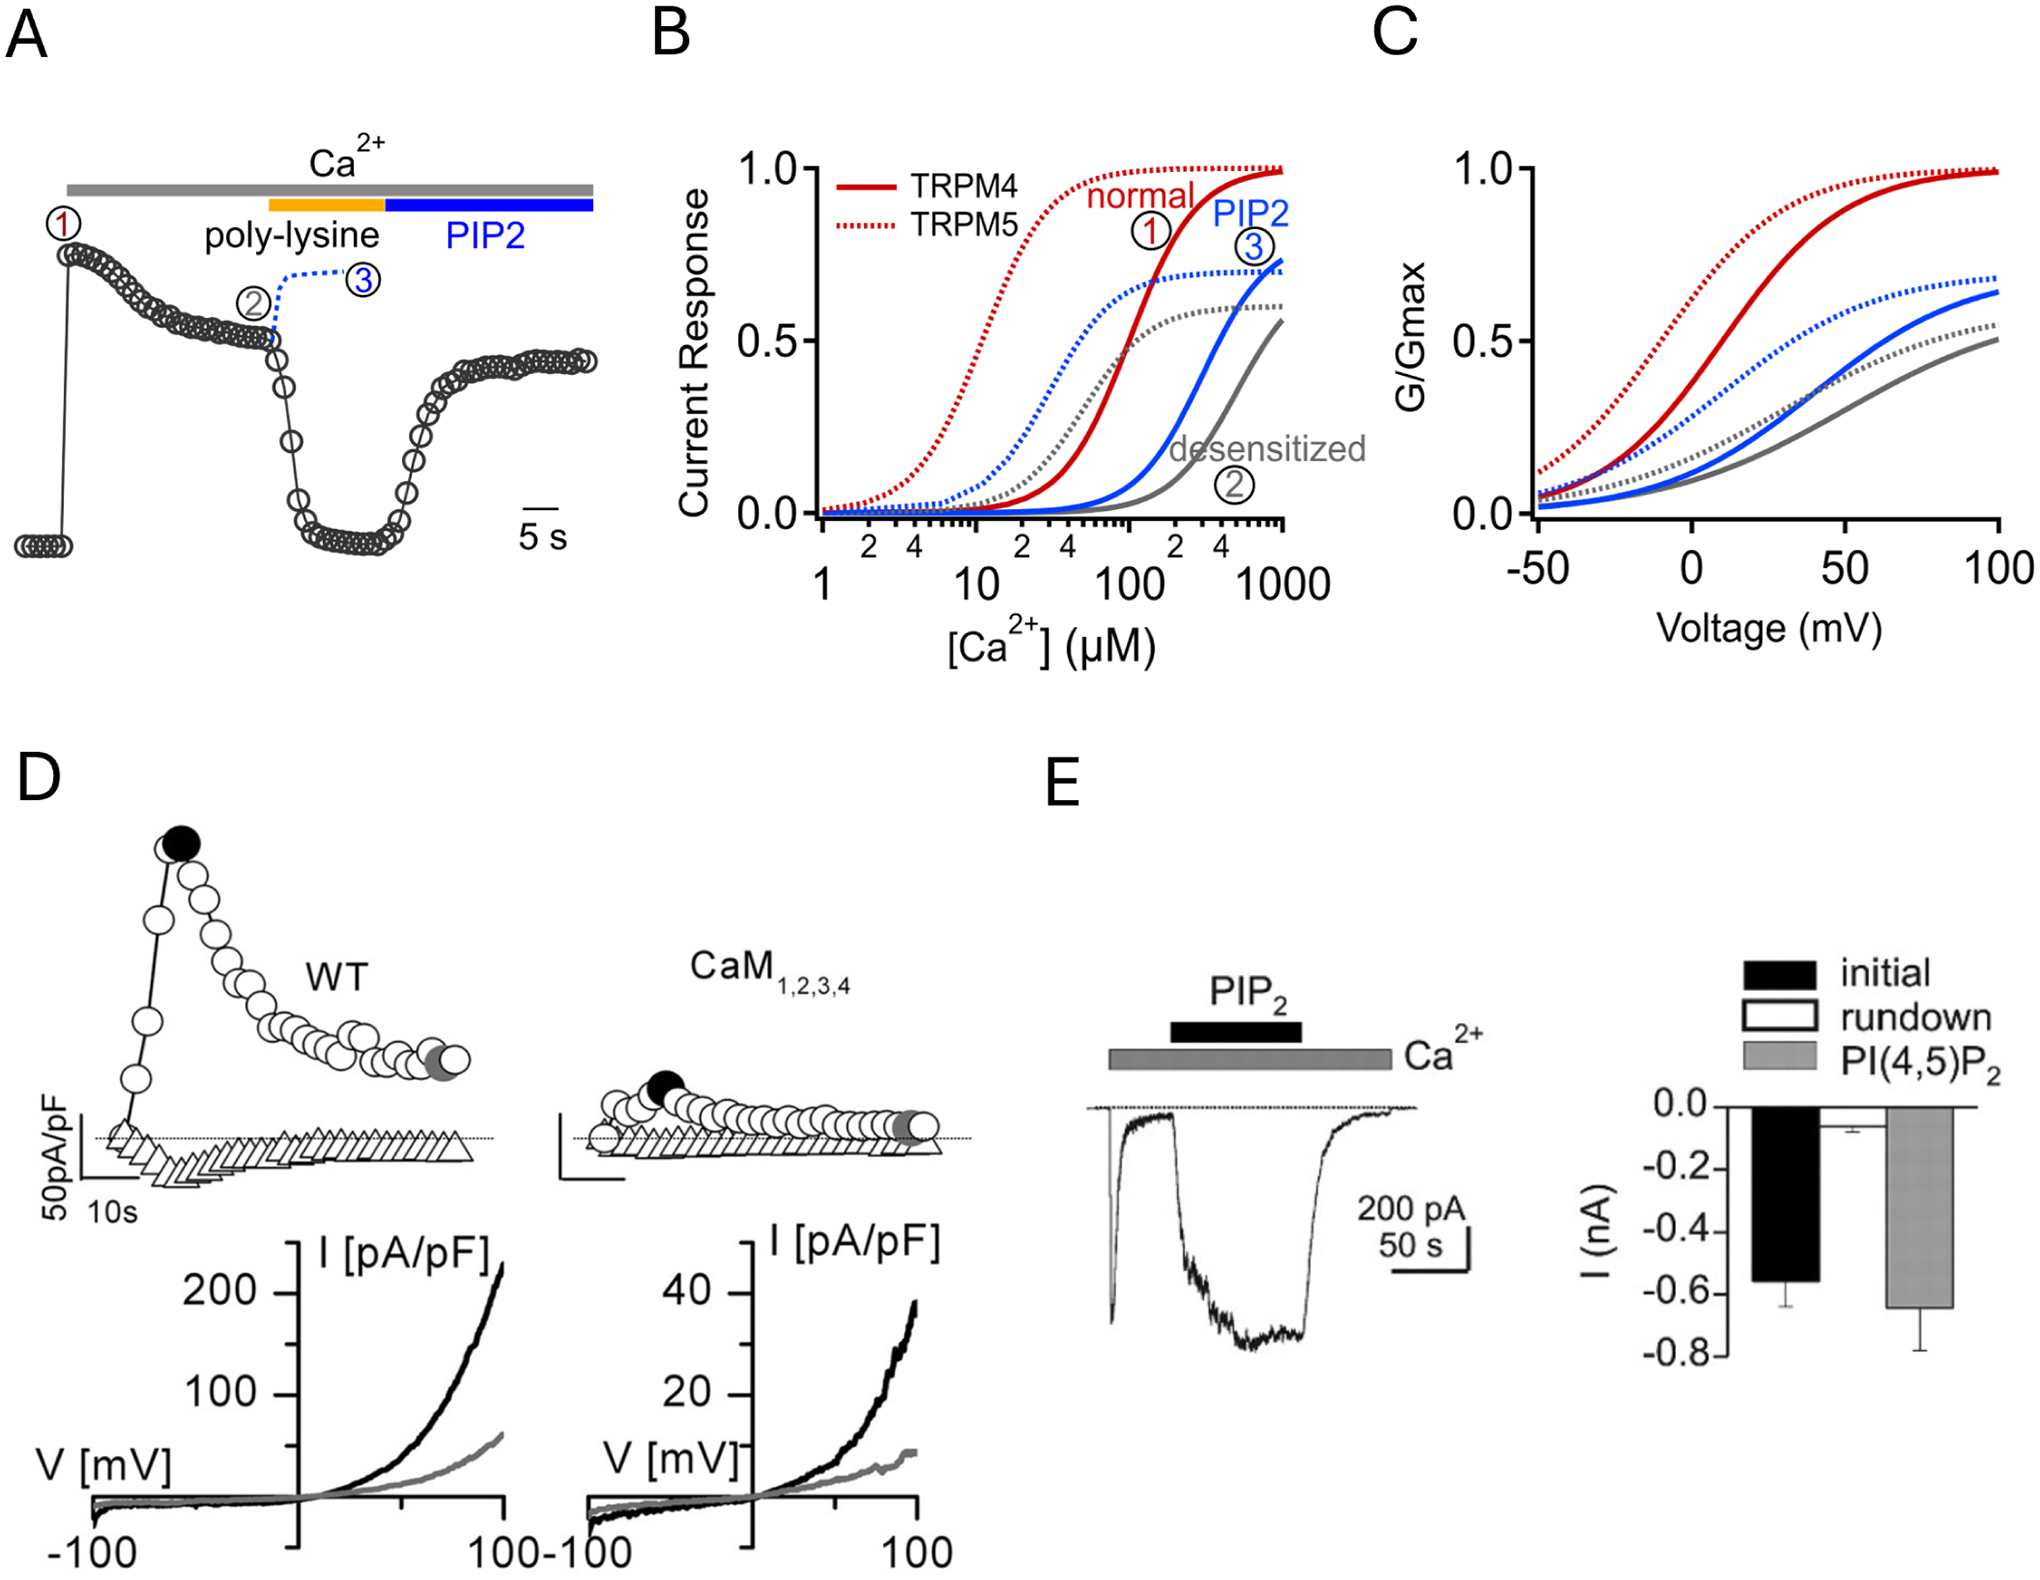
Activation and regulation of TRPM4 and TRPM5. A. A representative current trace of human TRPM4 recorded at 80 mV from an inside-out patch in response to 3 mM Ca2+, 10 μg/mL poly-lysine, and 50 μM diC8-PIP2. Dotted blue trace is from another recording when diC8-PIP2 was applied before complete desensitization due to application of poly-lysine. Labels 1, 2, and 3 represent initial peak current, spontaneously desensitized current, and current recovered by PIP2, respectively. B. Simulated calcium-dependent activation of TRPM4 (solid curves) and TRPM5 (dash curves) at time point 1 (red), 2 (gray), and 3 (blue) in panel A. Naïve TRPM4 and TRPM5 channels have an apparent EC50 value in 100 μM and 10 μM, respectively, in inside-out patch recordings. C. Voltage-dependent activation of TRPM4 and TRPM5, using the same color scheme as B. D. Example mouse TRPM4 current traces in response to 100 μM Ca2+ over time at −100 mV and 100 mV (top left); co-expressing a calcium-insensitive calmodulin mutant CAM1,2,3,4 reduces the current amplitude (top right). The bottom panels show the corresponding I-V relationships. Reproduced with permission from Nilius et al. (2005) JBC. E. An example trace at −80 mV (left) and summary (right) of mouse TRPM4 current activated by 100 μM Ca2+ and recovery by 10 μM diC8-PIP2. Reproduced from Zhang et al. (44) with permission under CC-BY license.