

Abstract
Intracellular adhesion molecule 1 (ICAM-1) is a cell surface glycoprotein that regulates cell-cell interactions, signaling, and immune processes. ICAM-1 expression has been shown to be elevated in many types of infections and inflammatory diseases. Strategies to block ICAM-1 function, including monoclonal anti-ICAM-1 antibodies, have been successful in treating the effects of chronic respiratory, autoimmune, and cardiovascular diseases. Naturally occurring autoantibodies targeting cytokines, endothelial cells, and other host receptors have been identified, and have been found to play a role in immunoregulation in health and disease. In this study, we determined the presence and levels of ICAM-1 autoantibodies across different age groups and disease states. We found that ICAM-1 autoantibody levels increased with age and were lower in individuals with various inflammatory states, suggesting a dynamic role in immune regulation. Using peptide microarrays, we identified high-resolution epitopes targeted by ICAM-1 autoantibodies that overlap with critical functional ICAM-1 binding sites. Finally, we determined that ICAM-1 autoantibodies were enriched for the IgG2 subclass that is critical for the response to bacterial antigens and chronic inflammation. This could indicate that molecular mimicry of bacterial antigens or underlying immune dysregulation could trigger the generation of anti-ICAM-1 antibodies. Understanding the functional implications of ICAM-1 autoantibodies could provide new insights into their contribution to immune homeostasis and their potential impact on inflammatory and autoimmune conditions.
Keywords: autoantibodies, antibody response, autoimmunity, cell adhesion, inflammation
Introduction
Autoantibodies that target host antigens are commonly associated with the development and diagnosis of autoimmune conditions such as systemic lupus erythematosus (SLE) and rheumatoid arthritis (RA).1–3 In individuals without autoimmune disease, self-reactive B cell populations, which are the source of autoantibodies, are normally eliminated during B cell development and maturation through central and peripheral immune tolerance mechanisms.4,5 However, recent studies of the autoantibody repertoire revealed that autoantibodies not only are prevalent in individuals with autoimmune disease, but also occur frequently in a large a proportion of healthy individuals without known disease and in relation to viral infection.6–9 An example of autoantibodies being associated with disease is during untreated HIV-1 infection in which high levels of autoantibodies were detected and associated with neutralizing antibody development and immune dysregulation.10 Moreover, these autoantibodies were shown to persist after antiretroviral treatment.11 Recent research has identified widespread autoantibody formation and loss of tolerance in individuals after other pathogenic infections, as well as pre-existing levels of autoantibodies in healthy individuals. For example, it was found that in 5% to 20% of severe COVID-19 cases, there were higher levels of preexisting anti-type I interferon autoantibodies compared with more mild illness cases.12,13 Further studies have extensively identified that after SARS-CoV-2 infection there were increased levels of autoantibodies to ACE2, cytokines, and chemokines, and other immune factors, that were associated with overall disease severity.14–25 While much of the research has examined autoantibodies after SARS-CoV-2 infection, another study identified the increased prevalence of autoantibodies to cytokines, and autoantibodies associated with connective tissue disease, in cohorts of individuals with non–SARS-CoV-2 viral infection, bacterial infection, and even noninfectious critical illnesses.16 Even though some autoantibodies have been associated with disease severity and long-term clinical outcomes, the clinical significance of many autoantibodies remain unclear.17,20–22 These prior studies suggest that increased prevalence of autoantibodies can occur after infection and inflammation, that could lead to regulation of the immune system.
Intracellular adhesion molecule 1 (ICAM-1) is a cell surface receptor that is used by immune cells, such as T cells, neutrophils, and macrophages, for adhesion and migration.26–29 ICAM-1 is also present on endothelial cells, and the expression of ICAM-1 is often upregulated during viral infection and other inflammatory states.30 In addition to expression on the cell surface, ICAM-1 can exist as a soluble form (soluble ICAM-1 [sICAM-1]).30–32 The levels of sICAM-1 have been shown to be elevated in a variety of inflammatory diseases including atherosclerosis, autoimmune disease, cancer, and asthma.33–37 ICAM-1 protein structure consists of 5 immunoglobulin-like domains.38,39 The first 2 domains are important for interaction with lymphocyte function associated antigen lymphocyte function associated antigen-1 (LFA-1) and fibrinogen,38,39 and the third domain interacts with macrophage associated antigen, macrophage antigen-1 (MAC-1).38 Additionally, the first domain contains binding sights for multiple viruses and Plasmodium falciparum (Pf), the parasite responsible for malaria.40,41
Autoantibodies directed against ICAM-1 have been identified in patients with the autoimmune disease scleroderma.42 Specifically, patients with scleroderma had elevated anti-ICAM-1 autoantibodies, and crosslinking of ICAM-1 autoantibodies could induce signaling pathways resulting in increased expression of adhesion molecules such as VCAM-1 (vascular cell adhesion molecule-1) and reactive oxygen species production.42 Further, in search of transplant antigens, ICAM-1 autoantibodies were also identified in cardiac transplant patients.43 Beyond these findings, little is known about ICAM-1 directed autoantibodies.
Given the critical role of ICAM-1 expression during inflammation, and the prior observation of naturally occurring ICAM-1 autoantibodies during disease, we sought to identify and characterize the features and functions of ICAM-1 autoantibodies. In this study, we determined ICAM-1 autoantibody prevalence in individuals with autoimmune disease, severe COVID-19 and healthy cohorts. We determined the functional impact of these antibodies and used peptide microarray to map the immunodominant epitopes targeted by ICAM-1 autoantibodies at high resolution. Finally, we determined key features, such as antibody subclass, of ICAM-1 autoantibodies to further identify potential origins and features of this autoantibody type. These findings suggest that ICAM-1 autoantibodies may serve previously unknown roles in immunoregulation, and mounting evidence points to ICAM-1 autoantibodies serving a protective role against inflammatory processes.
Material and methods
Human participants
Severe COVID-19 samples were obtained 30 to 60 d after infection, and were purchased through Boca Biolistics. These convalescent individuals had polymerase chain reaction laboratory-confirmed SARS-CoV-2 infection and were hospitalized. Informed written consent was obtained from individuals with acute or convalescent SARS-CoV-2 infection to obtain biospecimens for prospectively collected COVID-19 research study. The biospecimens were deidentified, and key de-linked demographic (e.g. age, sex) and clinical (e.g. COVID-19 status) were provided with each biospecimen to Children’s Mercy Investigators. SLE and RA samples were obtained from Astarte Biologics, now Charles River. SLE and RA samples were de identified and demographic information along with self-reported medications and disease status were included along with each sample. High body mass index (BMI) samples were obtained from Precision for Medicine. Samples had a median BMI of 39.8 kg/m2 with a range from 35.4 to 61.6 kg/m2. All of the samples were collected under a clinical study that has been reviewed by an Institutional/Independent Review Board (IRB) and/or Independent Ethics Committee in accordance with requirements of local governing regulatory agencies, including the Department of Health and Human Services and Food and Drug Administration Codes of Federal Regulations, on the Protection of Human Subjects (45 CFR Part 46 and 2 l CFR Part 56, respectively). Pediatric samples were collected under a research study at Children’s Mercy Kansas City and reviewed and approved by the Children’s Mercy IRB. Additionally, healthy adult samples were collected from healthcare workers at Children’s Mercy Hospital under a Children’s Mercy IRB approved study. All biospecimens, serum or plasma, that were utilized to perform the immunoassays was isolated from venous whole blood collection and frozen in ultra low-temperature freezers until use. Demographic information for all groups is provided in Table S1.
Anti-ICAM-1 enzyme-linked immunosorbent assays
Qualitative enzyme-linked immunosorbent assays (ELISAs) were performed using recombinant human ICAM-1 (ADP4, Lot# WV2323051; R&D Systems) diluted to 2 µg/mL in 0.1 M sodium bicarbonate and incubated on high-binding plates (3369; Corning) overnight at 4°. Nonspecific binding was blocked with superblock buffer with sodium azide for 1 h at room temperature. Serum or plasma was diluted to 1:30 in superblock buffer with sodium azide followed by subsequent 1:3 dilutions until a final dilution of 1:2,430. Secondary antibodies were purchased from the following: Goat anti-human IgG (109-036-098, Lot# 149163; Jackson ImmunoResearch), Goat Anti-Human IgA alpha chain (ab97215, Lot# GR3373878-8; Abcam), Goat Anti-Human IgM mu chain (ab97205, Lot# GR3396429-1; Abcam), Mouse Anti-Human IgG1 (9054-05, Lot#B2023-NM34C; Southern Biotech), Mouse Anti-Human IgG2 (9060-05, Lot#K3220-YF80; Southern Biotech), Mouse Anti-Human IgG3 (9210-05, Lot#DO720-QB4017; Southern Biotech), and Mouse Anti-Human IgG4 (9200-05, Lot#E1723-RB54B; Southern Biotech). Secondary antibody dilutions were done in sodium azide–free superblock buffer within the range of manufacturer’s recommendations at IgG 1:50,000, IgA 1:2,000, IgM 1:4,000 dilution, IgG1 1:6,000, IgG2 1:5,000, IgG3 1:7,000, and IgG4 1:6000. SureBlue Reserve Microwell Substrate (95059-294; VWR) was added and incubated in the dark for 15 min for IgG, IgG1, IgG2, IgG3, and IgG4 and 6 min for IgA and IgM. Absorbance was measured at 450 nm immediately after 0.33 M HCl Acid Stop solution (A142212; Fisher Scientific) was added to the plate.
Quantitative ELISA methods were adapted from qualitative ELISA and previously described methods,44,45 and differ as follows. In addition to recombinant human ICAM-1, isotype and subclass standards were left to incubate on high-binding plates (3369; Corning) overnight at 4 °C. Standards were prepared as followed prepared in duplicate: IgG (1-001-A, Lot#WAB0822071; Novus Biologicals) was diluted to 500 ng/mL followed by subsequent 1:2 dilutions until 7.813 ng/mL, IgA (NBP1-97039-1 Lot# 35592; Novus Biologicals) was diluted to 312.5 ng/mL followed by subsequent 1:2 dilutions until 4.88 ng/mL, IgM (DDXCH05P Lot# DDxCH04-010; Novus Biologicals) was diluted to 1,250 ng/mL followed by subsequent 1:2 dilutions until 19.531 µg/mL, IgG1 (DDXCH01P lot# DDXCH01-048; Novus Biologicals) was diluted to 500 ng/mL followed by subsequent 1:2 dilutions until 7.813 ng/mL, IgG2 (DDXCH02P Lot#DDxCH02P-100; Novus Biologicals) was diluted to 2500 ng/mL followed by subsequent 1:1.25 dilutions until 524.3 ng/mL, IgG3 (DDXCH03P Lot#DDXCH03-014; Novus Biologicals) was diluted to 2,500 ng/mL followed by subsequent 1:2 dilutions until 39.063 ng/mL, IgG4 (DDXCH04P Lot#DDXCH04-036; Novus Biologicals) was diluted to 2,500 ng/mL followed by subsequent 1:2 dilutions until 39.063 ng/mL, and standards were diluted in 0.1 M sodium bicarbonate. Additionally, serum or plasma was diluted in duplicate to 1:30 and 1:90, or 1:30 and 1:270 for IgG2, in superblock buffer with sodium azide. A sigmoidal 4pL curve was generated with the standards, after background optical density was subtracted from all wells.
ICAM-1 peptide microarray
We have used a peptide library to map immune dominant epitopes in previous studies.19 Briefly, a peptide library of 15 amino acids that overlapped by 12 amino acids (147 total peptides) that spanned amino acids 28 through 480 of ICAM-1 were synthesized by JPT Peptide Technologies using PepStar technology that covalently links the peptides onto glass microarray surfaces using an optimized hydrophilic linker moiety. Full-length human and mouse IgG were immobilized on microarray slides as assay controls. 20 serum or plasma samples were selected for their high levels of anti-ICAM1 autoantibodies, were diluted 1:200, and incubated for 1 h at 30 °C on multiwell microarray slides. After incubation and washing, fluorescently labeled anti-human-IgG antibody at 0.1 µg/mL was added to the wells and incubated for 1 h. Additional control incubations with secondary antibody only (with no serum samples) were also performed in parallel on each slide to assess false positives. After washing and drying, the slide was scanned with a high-resolution laser scanner (GenePix; Molecular Devices) at 635 nm to obtain fluorescence intensity profiles. The resulting images were quantified to yield a mean pixel value for each peptide. The blocking buffer was Superblock TBS T20 (Pierce International), and the wash buffer was 50 mM TBS buffer, including 0.1% Tween 20, pH 7.2.
To visualize epitopes on the structure of ICAM-1, we analyzed the location of the immunodominant linear antibody epitopes on the previously published crystal structure ICAM-1 in complex with multiple: LFA-1 (RCSB PDB:1MQ8),39 Coxsackievirus A24v (RCSB PDB:6EIT),46 Malaria (RCSB PDB:6S8U),47 and for ICAM-1 only (RCSB PDB:1IAM).38 For structure visualization and annotation, we used the Swiss model48–52 on the downloaded structure coordinates from the PDB,53,54 and annotations are available in Table S2. Note that annotations are based on ICAM-1 sequence from UniProt accession code P05362. If inputting PDB codes directly into the modeling software subtract 27 from all numbers to account for removal of signal sequence.
ICAM-1 deglycosylation
ICAM-1 was deglycosylated with PNGase F (P0704L, Lot# 10189740; New England Biolabs), according to manufacturer’s nondenaturing conditions. 20 µg of ICAM-1 suspended in 50 µL of phosphate-buffered saline (PBS) was mixed with 5 µL 10× Glycobuffer and 10 µL PNGase F, or 10 µL DI water for control. The mixture was then incubated overnight at 37 °C followed by enzyme inactivation by heating to 75 °C for 10 min. Deglycosylated ICAM-1 was let to cool to room temperature before use and stored at 4 °C for short term or −80°C long term. To confirm glycan removal 1 µg of ICAM-1 was separated in SDS-PAGE under nonreducing conditions with a 4% to 12% Bis-Tris gel (NP0335; Thermo Fisher Scientific) following the manufacturer’s instructions. The gel was then stained with SimplyBlue SafeStain (46-5044; Thermo Fisher Scientific) for 3 h with gentle shaking and left to destain overnight in DI water with gentle shaking.
sICAM-1 ELISA
Detection and quantification of sICAM-1 in serum or plasma was performed using a Human ICAM-1 ELISA kit (ab174445, Lot # 2101050757; Abcam) following standard protocol with serum or plasma dilution of 1:400.
Cell culture
Jurkat, clone E6-1 (TIB-152) was purchased from ATCC and maintained in RPMI 1640 medium (11875119; Gibco) supplemented with 10% fetal bovine serum (A5670402; Thermo Fisher Scientific). Cells were cultured at 37 °C under 5% CO2. Media was refreshed every 48 h.
Blocking assay of cell adhesion to immobilized ICAM-1
Recombinant Human ICAM-1 FC Chimera (720-IC-200, Lot# DLA1223031; R&D Systems) was diluted to 2.5 µg/mL in 0.1 M sodium bicarbonate and incubated on high-binding plates (3369; Corning) overnight at 4°. Nonspecific binding was blocked with superblock buffer for 1 h at room temperature. After blocking, serum or plasma was diluted to 1:10 in superblock buffer with sodium azide. A negative control, superblock buffer with sodium azide without serum or plasma was added to wells. A positive control anti-human ICAM-1 antibody (AF270, Lot# DGT0722041; R&D Systems) was diluted to its specified concentration (in figure legends) in superblock buffer with sodium azide. Samples and controls were left to incubate for 1 h at room temperature, followed by 2 washes in Superwash with 0.1% Tween 20, 1 wash with PBS, and 1 wash with serum-free RPMI 1640. A total of 6 × 10⁶ Jurkat cells were collected and washed twice in PBS, followed by resuspension in serum-free RPMI 1640 at 5 × 10⁶ cells/mL. Calcein AM dye (V13181; Thermo Fisher Scientific) was added to achieve a final concentration of 5 µM, and the cells were left to incubate for 30 min at 37 °C. After, incubation cells were washed twice in serum-free RPMI 1640 followed by resuspension at 5 × 10⁵ cells/mL. PMA (P8139, Lot#2546802; Sigma-Aldrich) was added to stimulate the Jurkat cells and loaded to 50 ng/mL. A total of 100 µL of the cell suspension was then added to each well. The plate was then centrifuged at 40 g for 1 min, to allow cells to settle, and the plate was incubated for 1 h. Following incubation, wells were washed 4 times with 100 µL of serum-free, prewarmed RPMI 1640 by gentle swirling then inverting the plate and blotting on a paper towel. A total of 200 µL of PBS was then added to each well. The plate was read using a fluorescein filter (EM: 517 nm).
To calculate 100% adhesion, 100 µL of dyed cell suspension (50,000) cells and 100 µL of PBS was added to a well after the final wash step, in triplicate. The mean fluorescence intensity (MFI) of these wells was averaged and % adhesion was calculated as follows:
Statistics and reproducibility
The statistical analysis was performed using GraphPad Prism 9.1 (GraphPad Software). For multiple comparisons, the statistical significance was determined with a Wilcoxon–Mann–Whitney test with 2-tailed P values or Wilcoxon matched pairs signed rank test. Correlational significance was determined by Pearson correlation coefficient with 2 tailed P values. Heatmaps were generated using Morpheus (Broad Institute), and visualization of ICAM-1 and receptor crystal structure and residue annotation was performed using Swiss Model.
Results
ICAM-1 IgG autoantibody levels were lower in disease states
Although ICAM-1 autoantibodies have been previously described in the autoimmune condition scleroderma,42 it remains unclear how prevalent ICAM-1 antibodies are in healthy populations and populations of individuals with immune-related diseases. Here, we sought to determine ICAM-1 autoantibody levels in individuals who were healthy, had a high BMI, or were experiencing severe COVID-19 infection or autoimmune conditions. Individuals with a high BMI were included separate from the healthy group due to the link between obesity and chronic inflammation.55–57 Peripheral blood was collected from healthy individuals with no reported autoimmune conditions or acute infection (n = 40); healthy individuals with a BMI over 30 kg/m2 (n = 50); individuals with autoimmune conditions, either SLE or RA, defined as SLE/RA (n = 37); and individuals infected with SARS-CoV-2 that required hospitalization, defined here as severe COVID-19 (n = 40) (Table S1). We determined the levels of anti-ICAM-1 IgG antibodies in the blood using an ELISA. Anti-ICAM-1 autoantibody levels in the peripheral blood were heterogenous between healthy individuals, with a median area under the curve (AUC) of 359.2 (Fig. 1A; Fig. S1A). Anti-ICAM-1 autoantibody levels also varied greatly for severe COVID-19, high BMI, and SLE/RA cases, with median AUC values of 217.3, 302.6, and 210.5, respectively (Fig. 1A; Fig. S1B–D). Overall, severe COVID-19 and SLE/RA individuals had statistically significantly lower levels of anti-ICAM-1 autoantibodies compared with healthy individuals (Fig. 1A; Figs. S1A–D and 2A). There was no significant difference in the levels of anti-ICAM-1 antibodies when comparing individuals with high BMI and healthy control subjects (Fig. 1A; Figs. S1A–D and 2A).
Figure 1.

ICAM-1 IgG autoantibody and sICAM-1 levels across healthy individuals and those with severe COVID-19, high BMI, and autoimmune conditions. (A) Dot plot graph of AUC on the log axis of the optical density at 450 nm measurement by ELISA for determining the levels of IgG antibodies targeting ICAM-1 within plasma from healthy individuals (n = 40), individuals with severe COVID-19 (n = 40), individuals with a high BMI over 30 kg/m2 (n = 50), and individuals with select autoimmune conditions, SLE or RA (n = 39). (B) Dot plot graph of concentration (pg/mL) on the log axis measured by ELISA for determining the levels of sICAM-1 within plasma from healthy individuals (n = 40), individuals with severe COVID-19 (n = 40), individuals with a high BMI over 30, (n = 50), and individuals with autoimmune conditions SLE or RA (n = 39). Statistical significance was determined using the Mann-Whitney test. P value results are shown.
Next, we measured levels of sICAM-1 within the blood samples to determine if there was an association between ICAM-1 autoantibodies and sICAM-1 levels. We found that individuals with severe COVID-19 (median 778.2 pg/mL) and high BMI (median 946.5 pg/mL) had significantly elevated sICAM-1 levels within serum compared with healthy individuals (median 682.7 pg/mL) (P = 0.0181 and P = 0.0001, respectively, Mann-Whitney test), while the SLE/RA group (median 779.7 pg/mL) did not show statistically significant change (Fig. 1B; Figs. S2B and 3). These data demonstrated that not only could anti-ICAM-1 antibodies be detected in healthy individuals, but also their levels were elevated in healthy individuals compared with individuals with SLE/RA or severe COVID-19. Additionally, ICAM-1 autoantibody levels demonstrated heterogenous distribution within each group, indicating individual diversity in anti-ICAM-1 levels. Finally, levels of sICAM-1 protein were significantly increased in groups of individuals with lower levels of anti-ICAM-1 antibodies.
Anti-ICAM-1 IgG autoantibody levels increased over the lifespan
We sought to determine if age was associated with the levels of anti-ICAM-1 autoantibodies detected in the blood. Using blood samples collected from healthy children ranging from infants 6 months of age to 15 years old (n = 33) (Table S1), we found a significant correlation (R = 0.3329, P = 0.0005, Pearson correlation) between age and anti-ICAM-1 antibody levels in the blood (Fig. 2A; Fig. S4). However, when healthy adults were stratified by age (25–75 years) (Table S1), there was no statistically significant correlation between age and anti-ICAM-1 autoantibody levels (Fig. 2B). This data showed that anti-ICAM-1 antibody levels increased in magnitude during childhood but then plateau in adulthood, with no further association with age in healthy individuals.
Figure 2.

Correlation of anti-ICAM-1 IgG autoantibody levels with age. (A) Dot plot graph of the AUC of the optical density at 450 nm on the log y-axis of IgG antibodies targeting ICAM-1 within plasma compared with age (x-axis) from healthy pediatric individuals ranging in age from 6 mo to 15 yr old (n = 37). (B) Dot plot graph of the AUC of the optical density at 450 nm on the log y-axis of IgG antibodies targeting ICAM-1 within plasma compared with age (x-axis) from healthy adult individuals ranging in age from 22 to 75 yr old (n = 40). Statistical significance was determined using the Pearson correlation test. P value results are shown.
Plasma containing high levels of ICAM-1 autoantibodies reduced cell adhesion to ICAM-1
ICAM-1 is essential for promoting cellular adhesion.58,59 To determine whether anti-ICAM-1 antibodies could interfere with T cell adhesion, we utilized an adhesion assay in which recombinant ICAM-1 protein was tethered to a plate and fluorescently labeled Jurkat T cells were used to measure cellular adhesion (Fig. S5). We used the measurements of anti-ICAM-1 antibody levels in the blood to select individuals with the highest levels of anti-ICAM-1 antibodies (ELISA AUC, n = 10, high-plasma individuals) and individuals with the lowest detected anti-ICAM-1 antibodies (ELISA AUC, n = 10, low-plasma individuals), regardless of disease group status (Fig. S6). Plasma from these individuals was incubated with the tethered ICAM-1 protein to allow for blocking anti-ICAM-1 antibodies opportunity to bind with ICAM-1 prior to the addition of fluorescent Jurkat T cells. We found that serum from high-plasma individuals had significantly decreased adhesion of T cells to the ICAM-1–coated plate, when compared with serum from low-plasma individuals (Fig. 3A). Additionally, we utilized a polyclonal anti-ICAM-1 antibody and incubated with the ICAM-1–coated plates prior to adding the T cells. The polyclonal anti-ICAM-1 antibody also demonstrated a significant decrease in T cell adhesion in a concentration-dependent fashion, with 5 µg/mL and 10 µg/mL concentrations of polyclonal anti-ICAM-1 antibody significantly reducing T cell adhesion compared with the control without antibody (Fig. 3B). This blocking was concentration dependent, as 10 µg/mL concentrations of polyclonal anti-ICAM-1 antibody blocked 36.7% more than 5 µg/mL (P = 0.0286, Mann-Whitney test). These results indicated that high levels of ICAM-1 autoantibodies in the blood, or monoclonal antibodies that target ICAM-1, could significantly inhibit T cell adhesion to ICAM-1.
Figure 3.

Plasma containing high measured levels of ICAM-1 autoantibodies could block T cell adhesion to tethered ICAM-1. (A) Dot plot graph of percent of T cell added that adhered to an ICAM-1–coated plate. Percent adhesion (y-axis) was determined by the net MFI of the adherent cells over net MFI of total cells added. ICAM-1–coated plates were blocked prior to T cell adhesion with individual patient plasma samples containing high levels of ICAM-1 autoantibodies (n = 10) or low levels of ICAM-1 autoantibodies (n = 10). (B) Dot plot graph of percent of T cell adhesion to plates coated with different concentrations of ICAM-1 blocking antibody (n = 4 technical replicates). Percent adhesion (y-axis) was determined by the net MFI of the adherent cells over net MFI of total cells added. Statistical significance was determined using the Mann-Whitney test. P value results are shown.
Identification of antibody epitopes targeted by ICAM-1 IgG autoantibodies
ICAM-1 consists of 5 extracellular immunoglobulin domains (D1–D5) that have been shown to interact with cellular adhesion molecules and viral receptors.38,59 The overwhelming majority of these interactions occur within the first 2 domains (D1 and D2), which are the furthest away from the cell membrane.38 The notable exception to this is MAC-1 which binds to ICAM-1’s third domain (D3).29 To identify and map the high-resolution antibody epitopes targeted by the ICAM-1 IgG autoantibodies, we utilized a peptide microarray that spanned the protein coding region of ICAM-1 (amino acids 28–480). The peptide library consisted of 147 peptides 15 aminos acid long, with overlapping 12-amino-acid segments. We selected the plasma samples with the highest levels of ICAM-1 IgG autoantibodies from the healthy, severe COVID-19, and high-BMI cohorts as detected by ELISA (8 healthy, 6 severe COVID-19, and 6 high-BMI individuals) (Fig. S7). We used the fluorescent intensities for each peptide across the 20 individuals to calculate z scores for each peptide (Fig. 4A, B). We found that some peptides were targeted by anti-ICAM-1 antibodies by unique individuals or by a few samples, while certain regions were more broadly targeted by anti-ICAM-1 antibodies from the plasma of multiple individuals. This indicated that anti-ICAM-1 antibodies could target both unique and common epitope patterns from each individual. To identify commonly targeted epitopes by ICAM-1 autoantibodies that are preserved across individuals, we defined a median z score of ≥0.95 (representing 1 SD above the median, ±0.05) as high binding across the samples as immunodominant. Six peptides were identified as immunodominant that spanned the first 3 immunoglobulin domains of ICAM-1 (Fig. 4B, C). Of the 6 peptides, there were 5 that had neighboring peptides with increased anti-ICAM-1 antibody binding that had overlapping sequence epitopes. The strong reactivity with neighboring overlapping peptides could indicate higher probability specific immunogenic regions within the antigen, which is encompassed by these peptide sequences. We defined these 5 regions as immunodominant clusters (clusters 1–5). We aligned the sequences of the peptides in each cluster and found overlapping common amino acid epitopes (Fig. 4D). Some clusters showed more defined regions of overlap, such as cluster 1 having 4 peptides that share the common amino acid sequence (FLTVYW), while other clusters, such as cluster 2, shared longer overlapping sequences. Among 4 clusters (1, 2, 3, and 5) a common epitope emerged of a leucine followed by a threonine (LT) (Fig. 5D). This could implicate the LT motif as a critical piece of anti-ICAM-1 antibody paratope important antibody binding. Finally, we sought to determine if any of the cluster peptide sequences had homology with any known bacterial or viral pathogen. Using blast, we did not identify any significant homology against human viruses and bacteria. These data demonstrates ICAM-1 autoantibodies across individuals recognize common linear epitopes, largely in the first 3 protein immunoglobulin domains of ICAM-1.
Figure 4.

High-resolution IgG epitope mapping of ICAM-1 autoantibodies using ICAM-1 peptide microarrays. (A) Heatmap of z scores for ICAM-1 epitope binding for individual samples (n = 20). ICAM-1 domains 1 through 5 are annotated above the heatmap. (B) Line graphs of median group z scores of ICAM-1 autoantibody binding to individual ICAM-1 peptides in the peptide array. Epitopes of recurrent high binding were qualified as median z scores of ≥0.95 to represent 1 SD ±0.05 above the median, points in red. (C) Table of recurrent high binding peptides, with associated z score and sequence. (D) Table of high binding clusters with associated peptide IDs, z score range, and sequence. Overlapping sequence motifs are bolded, and the common leucine threonine epitope is underlined.
Figure 5.
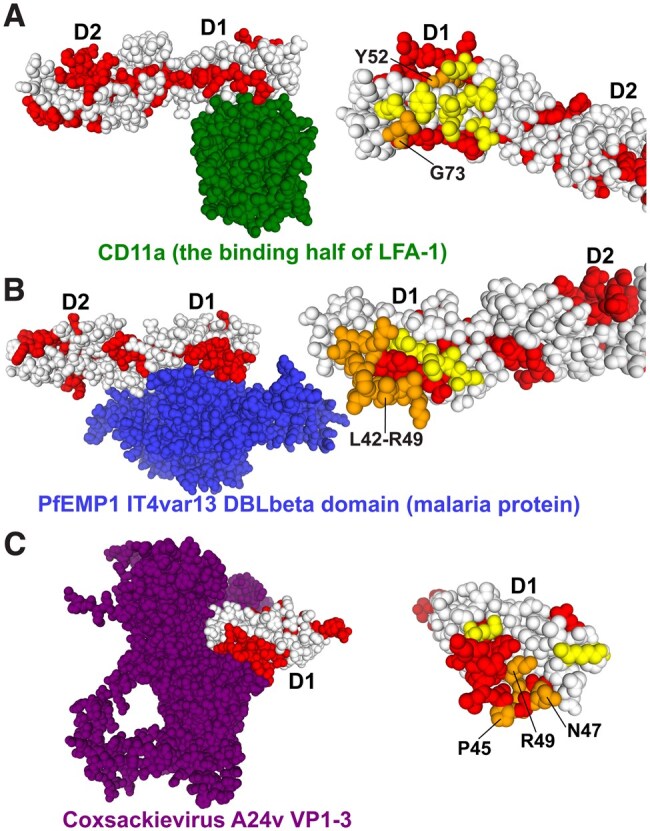
Structural molecular modeling of ICAM-1 autoantibody linear epitopes within ICAM-1 in complex with 3 interacting host and pathogen proteins. (Left) ICAM-1 bound to receptor. (Right) ICAM-1 without bound receptor bound with highlighted peptide regions. Red indicates the immunodominant peptide region. Yellow indicates the amino acid residues critical for receptor binding. Orange indicates the overlap between immunodominant peptide regions and critical receptor binding amino acid residues on ICAM-1. Specific domains referred to the in results are labeled. (A) The crystal structure of the first domain of CD11a, the binding region of LFA-1 (green), bound with the first 2 domains of ICAM-1 (PDB: 6S8U), glysine 73 and tyrosine 52 (orange). (B) The crystal structure of Pf (malaria) protein PfEMP1 IT4var13 DBLbeta domain (blue), bound with the first 2 domains of ICAM-1 (PDB: 1MQ8), leucine 42 to arginine 49 (orange). (C) The crystal structure of all 3 coxsackievirus A24v envelope proteins VP1, VP2, and VP3 (purple) in complex with the first 3 domains of ICAM-1 (PDB: 6EIT), arginine 49, asparagine 47, and proline 45 (orange).
ICAM-1 autoantibodies recognize epitopes associated with ICAM-1 functional using structural molecular analysis
ICAM-1 has been shown to interact with host cell adhesion molecules to promote cellular adhesion but has also been shown to be a crucial host factor for viral and other pathogen proteins to promote infection.60,61 Prior structural studies have defined the amino acid regions on ICAM-1 that are critical for the interaction of the adhesion molecule LFA-1, as well as for interacting with pathogen receptors for Pf, the leading causative agent for malaria, and coxsackievirus A24.39,46,47,62–64 We used these structures to visualize overlaps between the anti-ICAM-1 antibody binding clusters identified from the epitope peptide microarray. Multiple of these immunodominant regions overlapped with amino acid residues important for ICAM-1 function, as well as for pathogen adhesion to ICAM-1.
First, we used a molecular structure of ICAM-1 in complex with LFA-1 (PDB:1MQ8). We found that peptides 24 and 25 (cluster 1) targeted by anti-ICAM-1 antibodies contained glycine 73 within the epitope, an important residue for LFA-1 binding to ICAM-1 (Fig. 5A). Glycine 73 participates in the creation of a protective hydrophobic ring around the metal ion binding sight between ICAM-1 and LFA-1.38 Peptide 14, located within the first domain (D1) of ICAM-1, which was frequently targeted by anti-ICAM-1 antibodies, also overlapped with tyrosine 52 (Fig. 5A). Mutation of this residue has been shown to disrupt LFA-1 binding to ICAM-1,38 highlighting its importance in LFA-1/ICAM-1 binding interactions.
Immunodominant peptides also contained important intramolecular structures. On structural models of ICAM-1’s first (D1) and second (D2) domain (PDB:1IAM), glutamate 87, in D2, which participates in a salt bridge with arginine 13 in D1. This interaction holds the hinge region domain 1 and 2 in a bent “elbow” shape.38 Peptide 25 (cluster 1) overlaps with glutamate 87 (Fig. S8). This demonstrates that ICAM-1 autoantibody epitopes overlap with key structural features on ICAM-1, between D1 and D2. Further, overlaps between autoantibody epitopes and structure may also be present, in cluster 5, as cluster 5 spans D3 and D4; however, we could not find any previous structural modeling of this region. ICAM-1 has also been shown to interact with Pf, the causative parasite of malaria,65,66 Pf proteins and this interaction has been previously modeled (PDB: 6S8U). The monoclonal antibody (7f7) has been engineered that can block Pf from invading erythrocytes.40 Linear peptide arrays of ICAM-1 have identified the binding region of 7f7 to be leucine 42 to arginine 49 (Fig. 5B). Notably, these residues fall within the sequence encompassed by peptide 14. The importance of this region is explained by Pf exploiting Arg49 of ICAM-1 through hydrogen bonding.47 ICAM-1 is a promiscuous receptor for many viruses, including rhinoviruses and coxsackievirus.67,68 Coxsackievirus A24 VP1 forms salt bridges with lysine 50 of ICAM-1, and VP1 and VP2 participate in hydrogen bonding with ICAM-1 residues arginine 49, asparagine 47, and proline 45 (Fig. 5C).46 All these residues fall within the epitope of Peptide 14. Human rhinoviruses (HRVs) exploit a plethora of residues to bind to ICAM-1.38 Mutational studies have identified residues lysine 40, glutamate 41, leucine 43, and proline 45 through valine 51 on ICAM-1 as important for viral adhesion.38 These residues fall within the domain of immunodominant peptide 14. Further ICAM-1 residues identified by mutation for HRVs adhesion include threonine 75 and lysine 77 through leucine 80.38 These residues also fall within the domain of cluster 1, indicating that ICAM-1 autoantibodies also bind to them, and there is an overlap between auto antibody and HRV epitopes.
ICAM-1 autoantibodies of multiple immunoglobulin isotype and IgG subclasses are detected in peripheral blood
Next, we sought to determine the contribution of other immunoglobulin isotypes to the anti-ICAM-1 antibody response in addition to IgG (Fig. 1). We utilized the plasma samples from the 16 individuals with the highest levels of detected anti-ICAM-1 IgG autoantibodies used for the peptide microarray epitope mapping. We used a qualitative ELISA with secondary antibodies specific to IgG, IgA and IgM isotypes to determine the presence of ICAM-1 autoantibodies of different isotypes. Then we used quantitative ELISA with secondary antibodies specific to IgG, IgA, and IgM to compare levels between isotypes. We found that anti-ICAM-1 autoantibodies were detected for all 3 isotypes of immunoglobulin (IgG, IgA, IgM) (Fig. S9). IgG had the highest concentration of anti-ICAM-1 antibodies in the blood, followed by IgM and IgA with the lowest concentration (Fig. 6A; Fig. S10). Seeing as IgG represented the highest immunoglobulin isotype of anti-ICAM-1 antibodies, we further determined the contribution of each IgG subclass (IgG1, IgG2, IgG3, IgG4) to the anti-ICAM-1 antibody response. We detected anti-ICAM-1 antibodies of subclasses IgG1, IgG2, and IgG3. We did not detect ICAM-1 autoantibodies of the IgG4 subclass. Surprisingly, the highest concentration of IgG anti-ICAM-1 antibodies were of the IgG2 subclass (median: 33.2 µg/mL). The IgG2 subclass has been associated with anti-polysaccharide antibody response. Lower levels of IgG3 (median: 7.14 µg/mL) and IgG1 (median: 2.9 µg/mL) anti-ICAM-1 antibodies were also detected (Fig. 6B; Fig. S10). The analysis of immunoglobulin isotype and IgG subclass levels provides critical insight into the immunological origin and functional characteristics of the anti-ICAM-1 antibody response. Moreover, we detected high levels of IgG2 subclass anti-ICAM-1 antibodies. This observation deviated from expected distribution of total IgG subclasses, with IgG1 being the highest followed by IgG2 then IgG3 then IgG4.69
Figure 6.

Immunoglobulin isotype and subclass determination of anti-ICAM-1 antibodies. (A) Dot plot graph of concentration (µg/mL) on the log y-axis obtained by ELISA for determining the levels of immunoglobulin isotype class within high-autoantibody-presenting plasma, defined as the top 16 positive samples by qualitative ELISA regardless of disease group (n = 16). (B) Dot plot graph of concentration (µg/mL) obtained by ELISA for determining the levels of IgG subclass within high-autoantibody-presenting plasma, defined as the top 16 positive samples by qualitative ELISA regardless of disease group (n = 16). Statistical significance was determined using the Mann-Whitney test. P value results are shown.
ICAM-1 IgG targeting antibody binding reduced when host glycans removed from ICAM-1
Because IgG2 is associated with a polysaccharide response and ICAM-1 protein has been shown to contain up to 8 N-glycosylation sites,31,70 we sought to determine the contribution of ICAM-1 glycans to the ICAM-1 autoantibody response. We incubated recombinant sICAM-1 protein with PNGase F to reduce protein glycosylation, as PNGase F cleaves between the inner most GalNAc residue and asparagine on N-link glycans.71,72 Using SDS-PAGE, we found that deglycosylation of sICAM-1 by PNGase F reduced the size of the protein from ∼100 kDa to ∼37 kDa (Fig. 7A). These glycan-depleted proteins were then used for ICAM-1 qualitative ELISA. With plasma from the top 8 samples with the highest anti-ICAM-1 IgG autoantibodies, determined by anti-ICAM-1 antibody isotype and subclass ELISAs (4 healthy and 4 severe COVID-19 individuals), we found a statistically significant decrease in the AUC of optical density at 450 nm of anti-ICAM-1 antibody binding after glycan removal for total IgG Wilcoxon matched pairs rank test) (Fig. 7B) and IgG2 in specific (Wilcoxon matched pairs rank test) (Fig. S11). This data demonstrates that some, but not all, ICAM-1 IgG autoantibodies can recognize glycans or glycan dependent structures within ICAM-1. This glycan interaction could impact the origin and development of IgG subclasses of anti-ICAM-1 antibodies.
Figure 7.

Anti-ICAM-1 IgG autoantibodies interact with protein glycans. (A) SDS-PAGE separation of ICAM-1 under nonreducing conditions. Lane 1 shows ICAM-1 protein, lane 2 shows ICAM-1 in reaction buffer without PNGase F, and lane 3 shows ICAM-1 with PNGase F. Molecular masses are displayed on the left margin in kDa. (B) Dot plot graph of the AUC of the optical density at 450 nm on the log y-axis obtained by ELISA for determining the levels of ICAM-1 IgG autoantibodies targeting ICAM-1 with glycans (control) compared with enzymatically deglycosylated ICAM-1 (PNGASE) within plasma with high levels of detected ICAM-1 autoantibodies, defined as the top 8 positive samples by qualitative ELISA regardless of disease group (n = 8). Statistical significance was determined using the Wilcoxon matched pairs signed rank test. P value results are shown.
Discussion
In this study, we showed that autoantibodies targeting the host cell receptor ICAM-1 were present in the blood of individuals with severe COVID-19, autoimmune conditions (SLE/RA), individuals with high BMI, and healthy individuals. Surprisingly, we found that healthy individuals had significantly higher anti-ICAM-1 IgG levels compared with individuals with autoimmune conditions and severe COVID-19. This observation is in contrast to prior studies of viral infection and inflammation that demonstrated that disease caused new onset autoantibodies that could be associated with disease severity.16,18,19 For example, elevated levels of autoantibodies targeting type I interferons or proinflammatory cytokines were associated with more severe disease outcomes in COVID-19.16,.22,73,74 The potential mechanisms are that the autoantibodies are blocking critical antiviral inflammatory signaling, leading to worse disease outcomes. However, our observation of lower ICAM-1 autoantibodies during inflammation is in line with the observation of ICAM-1 autoantibodies in scleroderma made by Wolf et al.42 who identified that elevated levels of anti-ICAM-1 autoantibodies were associated with the less severe disease group, suggesting that ICAM-1 autoantibodies may play an immunoregulatory role in driving inflammation. Thus, lower levels of ICAM-1 autoantibodies could lead to increased immune cell activation and migration during inflammatory response through ICAM-1 signaling. Indeed, we found that plasma with high levels of ICAM-1 autoantibodies or polyclonal antibodies targeting ICAM-1 could inhibit T cell adhesion in a T cell adhesion assay. While we also demonstrated that ICAM-1–specific polyclonal antibodies could also block T cell adhesion, it is possible that other factors in the plasma besides anti-ICAM-1 antibodies could impact T cell adhesion between the high- and low-plasma groups. Future studies of immunoglobulin depletion or purification of plasma, followed by T cell adhesion assays, are necessary to confirm that ICAM-1 autoantibodies are indeed responsible for the demonstrated decreased in adhesion. Moreover, we found that lower levels of ICAM-1 autoantibodies were associated with increased levels of sICAM-1, a biomarker of inflammation. This association may suggest another functional role of ICAM-1 autoantibodies. In addition to binding ICAM-1 and blocking function, the ICAM-1 autoantibodies could form immune complexes with soluble or cell-bound ICAM-1. These immune complexes could activate other components of the immune system, promoting inflammation and tissue damage. Moreover, the immune complexes could bind dendritic cells to promote B and T cell activation leading to increased development of ICAM-1 antibodies. The possibility of immune complexes is also a limitation of measuring sICAM-1 by ELISA. The antibodies in complex with the sICAM-1 could mask a fraction of the measurable protein. Determination of the presence of ICAM-1 antibody:sICAM-1 immune complexes by immunoprecipitation and proteomic analysis or disruption of immune complexes prior to ELISA assays will serve to better understand the significance of ICAM-1 immune complexes. Moreover, determining other antibody features such as specific epitopes, affinity, avidity and other features of the ICAM-1 autoantibodies potentially in complex with sICAM-1 will be important. Nonetheless, ICAM-1 autoantibodies could impact the function of soluble and cellular ICAM-1 through blocking functional epitopes and/or developing immune complexes. Future studies to precisely determine systemic and tissue inflammatory status in healthy individuals with variable levels of ICAM-1 autoantibodies will be required to further identify the clinical significance.
Further, using peptide microarray to map the high-resolution peptide binding of ICAM-1 autoantibodies to ICAM-1, we show that immunodominant autoantibody epitopes overlapped with multiple key residues required for LFA-1, the receptor used by neutrophils and T cells to adhere to ICAM-1.26–28,39 We also demonstrated ICAM-1 autoantibodies can recognize the glycans present on ICAM-1. These glycans are necessary for macrophage adhesion to ICAM-1 through MAC-1 and may also play a role in neutrophil adhesion.26,29 By sharing common binding sites on ICAM-1, ICAM-1 autoantibodies may be able to, sterically and or competitively, reduce both adaptive and innate immune cell adhesion to ICAM-1.
Elevated sICAM-1 has been implicated and used as a biomarker for multiple states of immune diseases including cancer, cardiovascular disease, and autoimmune conditions.33–37 Our data demonstrated that individuals with autoimmune conditions had elevated sICAM-1 levels, consistent with previous literature.33,75 Further, sICAM-1 has been shown to increase macrophage activity in lung epithelia in vivo. This increase in activity was associated with increased lung injury.76 ICAM-1 autoantibodies may also be able to bind to sICAM-1 within the blood. Through binding sICAM-1, ICAM-1 autoantibodies may be able to further modulate macrophage activation and regulate chronic inflammation, relative to sICAM-1 levels.
We demonstrated the immune dominant binding epitopes of ICAM-1 autoantibodies overlapped with the binding epitopes of coxsackievirus, HRV, and PFEMP1 (a malarial protein). In the case of PFEMP1, the ICAM-1 autoantibody epitope almost perfectly overlapped with monoclonal antibody 7f7, which demonstrates an ability to stop infection of erythrocytes in vitro. While overlapping epitopes does not confirm an ability to block or reduce pathogen binding, it is a promising finding, as seen in the case with malaria. It should be noted, one limitation of this approach is that it does not identify 3-dimensional structural/nonlinear conformational epitopes or epitopes that require post-translational protein modification, such as glycosylation, and therefore may not provide all the information relevant to ICAM-1 epitopes targeted by autoantibodies. Future studies comparing the patterns of peptide epitopes targeted by ICAM-1 autoantibodies by healthy individuals compared with different disease states may also identify disease-specific epitopes. These patterns of autoantibodies could be determinants of inflammatory or other disease states. These studies would play a crucial role in determining whether ICAM-1 autoantibodies targeting healthy or disease specific epitopes lead to different functional roles of ICAM-1 autoantibodies. One potential difference could be in the aforementioned ICAM-1 autoantibodies’ ability to block T cell adhesion. These future experiments would serve as a guide for the development of epitope-specific ICAM-1 targeted therapeutics.
The antibody subclass and IgG isotype can give critical information about the origin and antibody effector functions. We found ICAM-1 autoantibodies of IgG, IgM, and IgA subclasses, but the IgG subclass presented the highest levels of anti-ICAM-1 antibodies in the peripheral blood. This suggested that B cells producing ICAM-1 autoantibodies avoid anergy and peripheral tolerance mechanisms long enough to undergo class switching. Also suggesting ICAM-1 autoantibodies may be a part of longer-term immune development or response. Additionally, IgG2 was the most common subtype of ICAM-1 autoantibodies. Interestingly, IgG2 subclass antibodies interact more weakly with Fc receptors on immune effector cells compared with the IgG1 subclass, and are relatively poor activators of the complement system.77,78 Thus, the high levels of IgG2 subclass anti-ICAM-1 antibodies could bind to ICAM-1 without eliciting high levels of immune cell activation and cytotoxicity, further supporting their role as a regulatory rather than proinflammatory component of the immune system. ICAM-1 antibodies have previously been tested for use in immune regulation in the enlimomab trials. Enlimomab was a monoclonal mouse IgG antibody targeting ICAM-1, which showed promise in treating inflammation, but led to adverse outcomes in clinical trials due to excessive activation of neutrophils.78,79 Given that ICAM-1 autoantibodies are naturally present in the blood and are predominantly IgG2, a humanized IgG2 monoclonal antibody may provide a new path forward on ICAM-1 monoclonal antibody therapy. IgG2 is commonly associated with responses to bacterial polysaccharide antigens, while IgG1 and IgG3 are more commonly directed against protein antigens.69,78 While we have not elucidated any link between ICAM-1 autoantibodies and bacterial or viral polysaccharide antigens, our data do demonstrate IgG, in specific, IgG2 ICAM-1 autoantibodies can target the glycans present on ICAM-1. These glycans may play a part in the development of ICAM-1 autoantibodies. Additionally, it has been shown that IgG2 antibodies may develop through class switching, even in the absence of helper T cells.80 This may provide an explanation for why IgG2 became the most prevalent subclass, as it would not need significant helper T cell activation for B cell maturation to occur. Future studies comparing the immunoglobulin class and subclass frequencies between healthy and diseased individuals may also be of interest to determine if there are differences in ICAM-1 autoantibody function related to the functional abilities of each immunoglobulin in different disease states. Moreover, isolation and characterization of B cells producing ICAM-1 autoantibodies could provide insights into their developmental trajectory.
The origin of the development of ICAM-1 autoantibodies has yet to be elucidated. Sequence alignment using a blast of immunodominant peptides with viral and bacterial proteins yielded no viruses and clinically insignificant bacteria making direct molecular mimicry an unlikely cause of ICAM-1 autoantibodies. One known cause for ICAM-1 autoantibody development is through cardiac transplantation. Lawson et al.43 described a near 5-fold increase in the number of patients with ICAM-1 autoantibodies after cardiac transplantation. However, given the wide portion of the population with ICAM-1 autoantibodies, other antigens and B cell processes must contribute to ICAM-1 autoantibody development. Wolf et al.42 suspected that the increased presence of ICAM-1 and sICAM-1 could be due to the loss of immune tolerance due to autoimmune disease. Similarly, we speculate, shorter term increases in ICAM-1 due to acute disease such as infection may also provide sufficiently high levels of ICAM-1 to break immune tolerance. Another possible common trigger of ICAM-1 autoantibody development may be through exposure to viruses that exploit ICAM-1, such as respiratory syncytial virus, HRV, and coxsackievirus. Just as ACE2 autoantibodies are associated with SARS-CoV-2, these viruses may be associated with ICAM-1 autoantibodies.81–83
The cause of differences in ICAM-1 autoantibody levels between groups is also unknown. A potential explanation for the SLE group could be through loss of immunoglobulins through the urine due to nephrotic complications of the disease. Further, the autoimmune cohorts may also be in various states of immunosuppression, and therefore have decreased antibody production and/or characteristics. Future studies with larger targeted cohorts that control for age, sex, and other demographic and clinical parameters could pinpoint more specific drivers of ICAM-1 antibody levels. Importantly, longitudinal studies of anti-ICAM-1 antibody levels will be required to further delineate the impact of genetics and environmental factors on the set points of ICAM-1 autoantibodies.
Our data demonstrated that ICAM-1 autoantibodies are detected in individuals in both health and disease and show a potential functional role within in vitro cellular adhesion assays. However, there are limitations to our study, including study size, demographic makeup, and standardization across timelines from diagnosis until sample collection. We do not have longitudinal follow-up on our samples to track the development of ICAM-1 autoantibodies and instead relied on grouping samples by age. The demographic makeup of our groups was also heterogenous, favoring White individuals in the healthy and high-BMI cohorts, while the autoimmune cohort overwhelmingly favored women.84 While autoimmune conditions occur in significantly higher rates among women, it has been shown that the development of autoantibodies can vary between sex,84–86 a factor that we did not study. The severity of autoimmune conditions and whether patients were on medication to control their conditions was also self-reported. Moreover, determining if the autoantibodies truly contribute to immune regulation in vivo will be critical for determining the functional impact of this observation. Larger, longitudinal studies of diverse individuals will be required to fully characterize the fate and function of these autoantibodies.
In conclusion, our study highlights the prevalence and potential significance of ICAM-1 autoantibodies in individuals with autoimmune diseases, individuals with severe COVID-19, and healthy cohorts. By mapping the immunodominant epitopes and determining the functional impacts of these autoantibodies, we have uncovered key features, such as antibody subclass, that may indicate the autoantibodies’ origins and roles. Our findings suggest that ICAM-1 autoantibodies could play a previously unrecognized role in immunoregulation, potentially offering protective effects against inflammatory processes. These insights pave the way for further research into the therapeutic potential of targeting ICAM-1 autoantibodies in managing autoimmune and inflammatory diseases.
Supplementary Material
Acknowledgments
The authors thank all the healthcare workers and donors who participated in this study. They give special thanks to Occupational Health and Children’s Mercy Research Institute for their support of this study.
Contributor Information
Marc L Herman, Genomic Medicine Center, Children’s Mercy Research Institute, Kansas City, MO, United States; University of Missouri–Kansas City School of Medicine, Kansas City, MO, United States.
Eric S Geanes, Genomic Medicine Center, Children’s Mercy Research Institute, Kansas City, MO, United States.
Rebecca McLennan, Genomic Medicine Center, Children’s Mercy Research Institute, Kansas City, MO, United States.
Gage J Greening, Genomic Medicine Center, Children’s Mercy Research Institute, Kansas City, MO, United States.
Heather Mwitanti, Genomic Medicine Center, Children’s Mercy Research Institute, Kansas City, MO, United States; College of Osteopathic Medicine, Kansas City University, Kansas City, MO, United States.
Todd Bradley, Genomic Medicine Center, Children’s Mercy Research Institute, Kansas City, MO, United States; University of Missouri–Kansas City School of Medicine, Kansas City, MO, United States; Department of Pediatrics, University of Missouri–Kansas City, Kansas City, MO, United States; Department of Pediatrics, University of Kansas Medical Center, Kansas City, KS, United States; Department of Pathology and Laboratory Medicine, University of Kansas Medical Center, Kansas City, KS, United States.
Author contributions
T.B. and E.S.G. conceived and designed the study. M.L.H., E.S.G., G.J.G., and H.M. performed experiments. M.L.H., E.S.G., and T.B. analyzed data. M.L.H., T.B., E.S.G., and R.M. wrote the paper. All authors edited the paper. Funding was managed by T.B.
Marc L. Herman (Data curation [Lead], Formal analysis [Lead], Investigation [Lead], Methodology [Equal], Writing—original draft [Lead], Writing—review & editing [Supporting]), Eric S. Geanes (Conceptualization [Equal], Data curation [Supporting], Formal analysis [Supporting], Investigation [Supporting], Methodology [Equal], Supervision [Lead], Writing—review & editing [Supporting]), Rebecca McLennan (Project administration [Supporting], Visualization [Equal], Writing—original draft [Supporting], Writing—review & editing [Supporting]), Gage J. Greening (Data curation [Supporting], Formal analysis [Supporting], Investigation [Supporting], Validation [Supporting]), Heather Mwitanti (Data curation [Supporting]), and Todd Bradley (Conceptualization [Lead], Formal analysis [Supporting], Funding acquisition [Lead], Methodology [Supporting], Project administration [Lead], Resources [Lead], Supervision [Supporting], Validation [Equal], Visualization [Equal], Writing—review & editing [Lead])
Supplementary material
Supplementary material is available at ImmunoHorizons online.
Funding
This work was funded through internal institutional funds from Children’s Mercy Research Institute and Children’s Mercy Kansas City.
Conflicts of interest
None declared.
Data availability
The data that support the findings of this study are available from the corresponding author, T.B., upon reasonable request.
References
- 1. Suurmond J, Diamond B. Autoantibodies in systemic autoimmune diseases: specificity and pathogenicity. J Clin Invest. 2015;125:2194–2202. 10.1172/JCI78084 [DOI] [PMC free article] [PubMed] [Google Scholar]
- 2. Han S, Zhuang H, Shumyak S, Yang L, Reeves WH. Mechanisms of autoantibody production in systemic lupus erythematosus. Front Immunol. 2015;6:228. 10.3389/fimmu.2015.00228 [DOI] [PMC free article] [PubMed] [Google Scholar]
- 3. van Delft MAM, Huizinga TWJ. An overview of autoantibodies in rheumatoid arthritis. J Autoimmun. 2020;110:102392. 10.1016/j.jaut.2019.102392 [DOI] [PubMed] [Google Scholar]
- 4. Nemazee D. Mechanisms of central tolerance for B cells. Nat Rev Immunol. 2017;17:281–294. 10.1038/nri.2017.19 [DOI] [PMC free article] [PubMed] [Google Scholar]
- 5. Tsubata T. B-cell tolerance and autoimmunity. F1000Res. 2017;6:391. 10.12688/f1000research.10583.1 [DOI] [PMC free article] [PubMed] [Google Scholar]
- 6. Shome M et al. Serum autoantibodyome reveals that healthy individuals share common autoantibodies. Cell Rep. 2022;39:110873. 10.1016/j.celrep.2022.110873 [DOI] [PMC free article] [PubMed] [Google Scholar]
- 7. Nagele EP et al. Natural IgG autoantibodies are abundant and ubiquitous in human sera, and their number is influenced by age, gender, and disease. PLoS One. 2013;8:e60726. 10.1371/journal.pone.0060726 [DOI] [PMC free article] [PubMed] [Google Scholar]
- 8. Ludwig RJ et al. Mechanisms of autoantibody-induced pathology. Front Immunol. 2017;8:603. 10.3389/fimmu.2017.00603 [DOI] [PMC free article] [PubMed] [Google Scholar]
- 9. Coutinho A, Kazatchkine MD, Avrameas S. Natural autoantibodies. Curr Opin Immunol. 1995;7:812–818. 10.1016/0952-7915(95)80053-0 [DOI] [PubMed] [Google Scholar]
- 10. Moody MA et al. Immune perturbations in HIV-1-infected individuals who make broadly neutralizing antibodies. Sci Immunol. 2016;1:aag0851. 10.1126/sciimmunol.aag0851 [DOI] [PMC free article] [PubMed] [Google Scholar]
- 11. Bundell C et al. The high frequency of autoantibodies in HIV patients declines on antiretroviral therapy. Pathology. 2018;50:313–316. 10.1016/j.pathol.2017.10.017 [DOI] [PubMed] [Google Scholar]
- 12. Knight JS et al. The intersection of COVID-19 and autoimmunity. J Clin Invest. 2021;131:e154886. 10.1172/JCI154886 [DOI] [PMC free article] [PubMed] [Google Scholar]
- 13. Puel A, Bastard P, Bustamante J, Casanova JL. Human autoantibodies underlying infectious diseases. J Exp Med. 2022;219:e20211387. 10.1084/jem.20211387 [DOI] [PMC free article] [PubMed] [Google Scholar]
- 14. Baiocchi GC et al. Cross-sectional analysis reveals autoantibody signatures associated with COVID-19 severity. J Med Virol. 2023;95:e28538. 10.1002/jmv.28538 [DOI] [PubMed] [Google Scholar]
- 15. Liu Y et al. Paradoxical sex-specific patterns of autoantibody response to SARS-CoV-2 infection. J Transl Med. 2021;19:524. 10.1186/s12967-021-03184-8 [DOI] [PMC free article] [PubMed] [Google Scholar]
- 16. Feng A et al. Autoantibodies are highly prevalent in non-SARS-CoV-2 respiratory infections and critical illness. JCI Insight. 2023;8:e163150. 10.1172/jci.insight.163150 [DOI] [PMC free article] [PubMed] [Google Scholar]
- 17. Jernbom AF et al. Prevalent and persistent new-onset autoantibodies in mild to severe COVID-19. Nat Commun. 2024;15:8941. 10.1038/s41467-024-53356-5 [DOI] [PMC free article] [PubMed] [Google Scholar]
- 18. Muri J et al. Autoantibodies against chemokines post-SARS-CoV-2 infection correlate with disease course. Nat Immunol. 2023;24:604–611. 10.1038/s41590-023-01445-w [DOI] [PMC free article] [PubMed] [Google Scholar]
- 19. Geanes ES, McLennan R, LeMaster C, Bradley T. Autoantibodies to ACE2 and immune molecules are associated with COVID-19 disease severity. Commun Med (Lond). 2024;4:47. 10.1038/s43856-024-00477-z [DOI] [PMC free article] [PubMed] [Google Scholar]
- 20. Su Y et al. ISB-Swedish COVID19 Biobanking Unit. Multi-omics resolves a sharp disease-state shift between mild and moderate COVID-19. Cell. 2020;183:1479–1495.e20. 10.1016/j.cell.2020.10.037 [DOI] [PMC free article] [PubMed] [Google Scholar]
- 21. Bastard P et al. ; Etablissement du Sang study group. Autoantibodies neutralizing type I IFNs are present in ∼4% of uninfected individuals over 70 years old and account for ∼20% of COVID-19 deaths. Sci Immunol. 2021;6:eabl4340. 10.1126/sciimmunol.abl4340 [DOI] [PMC free article] [PubMed] [Google Scholar]
- 22. Bastard P et al. COVID human genetic effort autoantibodies against type I IFNs in patients with life-threatening COVID-19. Science. 2020;370:eabd4585. 10.1126/science.abd4585 [DOI] [PMC free article] [PubMed] [Google Scholar]
- 23. Zuo Y et al. Prothrombotic autoantibodies in serum from patients hospitalized with COVID-19. Sci Transl Med. 2020;12:eabd3876. 10.1126/scitranslmed.abd3876 [DOI] [PMC free article] [PubMed] [Google Scholar]
- 24. Wang EY et al. ; Yale IMPACT Team. Diverse functional autoantibodies in patients with COVID-19. Nature. 2021;595:283–288. 10.1038/s41586-021-03631-y [DOI] [PubMed] [Google Scholar]
- 25. Browne SK, Holland SM. Anticytokine autoantibodies in infectious diseases: pathogenesis and mechanisms. Lancet Infect Dis. 2010;10:875–885. 10.1016/S1473-3099(10)70196-1 [DOI] [PubMed] [Google Scholar]
- 26. Hyun YM, Choe YH, Park SA, Kim M. LFA-1 (CD11a/CD18) and Mac-1 (CD11b/CD18) distinctly regulate neutrophil extravasation through hotspots I and II. Exp Mol Med. 2019;51:1–13. 10.1038/s12276-019-0227-1 [DOI] [PMC free article] [PubMed] [Google Scholar]
- 27. Lefort CT, Ley K. Neutrophil arrest by LFA-1 activation. Front Immunol. 2012;3:157. 10.3389/fimmu.2012.00157 [DOI] [PMC free article] [PubMed] [Google Scholar]
- 28. Walling BL, Kim M. LFA-1 in T cell migration and differentiation. Front Immunol. 2018;9:952. 10.3389/fimmu.2018.00952 [DOI] [PMC free article] [PubMed] [Google Scholar]
- 29. Diamond MS, Staunton DE, Marlin SD, Springer TA. Binding of the integrin Mac-1 (CD11b/CD18) to the third immunoglobulin-like domain of ICAM-1 (CD54) and its regulation by glycosylation. Cell. 1991;65:961–971. 10.1016/0092-8674(91)90548-d [DOI] [PubMed] [Google Scholar]
- 30. Bui TM, Wiesolek HL, Sumagin R. ICAM-1: A master regulator of cellular responses in inflammation, injury resolution, and tumorigenesis. J Leukoc Biol. 2020;108:787–799. 10.1002/JLB.2MR0220-549R [DOI] [PMC free article] [PubMed] [Google Scholar]
- 31. Ramos TN, Bullard DC, Barnum SR. ICAM-1: isoforms and phenotypes. J Immunol. 2014;192:4469–4474. 10.4049/jimmunol.1400135 [DOI] [PMC free article] [PubMed] [Google Scholar]
- 32. Singh V, Kaur R, Kumari P, Pasricha C, Singh R. ICAM-1 and VCAM-1: Gatekeepers in various inflammatory and cardiovascular disorders. Clin Chim Acta. 2023;548:117487. 10.1016/j.cca.2023.117487 [DOI] [PubMed] [Google Scholar]
- 33. Spronk PE, Bootsma H, Huitema MG, Limburg PC, Kallenberg CG. Levels of soluble VCAM-1, soluble ICAM-1, and soluble E-selectin during disease exacerbations in patients with systemic lupus erythematosus (SLE); a long term prospective study. Clin Exp Immunol. 1994;97:439–444. 10.1111/j.1365-2249.1994.tb06107.x [DOI] [PMC free article] [PubMed] [Google Scholar]
- 34. Witkowska AM. Soluble ICAM-1: a marker of vascular inflammation and lifestyle. Cytokine. 2005;31:127–134. 10.1016/j.cyto.2005.04.007 [DOI] [PubMed] [Google Scholar]
- 35. Roland CL, Harken AH, Sarr MG, Barnett CC. Jr., ICAM-1 expression determines malignant potential of cancer. Surgery. 2007;141:705–707. 10.1016/j.surg.2007.01.016 [DOI] [PubMed] [Google Scholar]
- 36. Maruo Y et al. ICAM-1 expression and the soluble ICAM-1 level for evaluating the metastatic potential of gastric cancer. Int J Cancer. 2002;100:486–490. 10.1002/ijc.10514 [DOI] [PubMed] [Google Scholar]
- 37. Watanabe T, Fan J. Atherosclerosis and inflammation mononuclear cell recruitment and adhesion molecules with reference to the implication of ICAM-1/LFA-1 pathway in atherogenesis. Int J Cardiol. 1998;66 Suppl 1:S45–53; discussion S55. 10.1016/s0167-5273(98)00147-8 [DOI] [PubMed] [Google Scholar]
- 38. Bella J, Kolatkar PR, Marlor CW, Greve JM, Rossmann MG. The structure of the two amino-terminal domains of human ICAM-1 suggests how it functions as a rhinovirus receptor and as an LFA-1 integrin ligand. Proc Natl Acad Sci U S A. 1998;95:4140–4145. 10.1073/pnas.95.8.4140 [DOI] [PMC free article] [PubMed] [Google Scholar]
- 39. Shimaoka M et al. Structures of the alpha L I domain and its complex with ICAM-1 reveal a shape-shifting pathway for integrin regulation. Cell. 2003;112:99–111. 10.1016/s0092-8674(02)01257-6 [DOI] [PMC free article] [PubMed] [Google Scholar]
- 40. Berendt AR et al. The binding site on ICAM-1 for Plasmodium falciparum-infected erythrocytes overlaps, but is distinct from, the LFA-1-binding site. Cell. 1992;68:71–81. 10.1016/0092-8674(92)90207-s [DOI] [PubMed] [Google Scholar]
- 41. Ockenhouse CF, Betageri R, Springer TA, Staunton DE. Plasmodium falciparum-infected erythrocytes bind ICAM-1 at a site distinct from LFA-1, Mac-1, and human rhinovirus. Cell. 1992;68:63–69. 10.1016/0092-8674(92)90206-r [DOI] [PubMed] [Google Scholar]
- 42. Wolf SI, Howat S, Abraham DJ, Pearson JD, Lawson C. Agonistic anti-ICAM-1 antibodies in scleroderma: activation of endothelial pro-inflammatory cascades. Vascul Pharmacol. 2013;59:19–26. 10.1016/j.vph.2013.05.002 [DOI] [PMC free article] [PubMed] [Google Scholar]
- 43. Lawson C, Holder AL, Stanford RE, Smith J, Rose ML. Anti-intercellular adhesion molecule-1 antibodies in sera of heart transplant recipients: a role in endothelial cell activation. Transplantation. 2005;80:264–271. 10.1097/01.tp.0000165433.88295.4c [DOI] [PubMed] [Google Scholar]
- 44. Kiszel P et al. Class switch towards spike protein-specific IgG4 antibodies after SARS-CoV-2 mRNA vaccination depends on prior infection history. Sci Rep. 2023;13:13166. 10.1038/s41598-023-40103-x [DOI] [PMC free article] [PubMed] [Google Scholar]
- 45. Sinkovits G et al. Concentration and subclass distribution of anti-ADAMTS13 IgG autoantibodies in different stages of acquired idiopathic thrombotic thrombocytopenic purpura. Front Immunol. 2018;9:1646. 10.3389/fimmu.2018.01646 [DOI] [PMC free article] [PubMed] [Google Scholar]
- 46. Baggen J et al. Role of enhanced receptor engagement in the evolution of a pandemic acute hemorrhagic conjunctivitis virus. Proc Natl Acad Sci U S A. 2018;115:397–402. 10.1073/pnas.1713284115 [DOI] [PMC free article] [PubMed] [Google Scholar]
- 47. Lennartz F, Smith C, Craig AG, Higgins MK. Structural insights into diverse modes of ICAM-1 binding by Plasmodium falciparum-infected erythrocytes. Proc Natl Acad Sci U S A. 2019;116:20124–20134. 10.1073/pnas.1911900116 [DOI] [PMC free article] [PubMed] [Google Scholar]
- 48. Waterhouse A et al. SWISS-MODEL: homology modelling of protein structures and complexes. Nucleic Acids Res. 2018;46:W296–W303. 10.1093/nar/gky427 [DOI] [PMC free article] [PubMed] [Google Scholar]
- 49. Bienert S et al. The SWISS-MODEL repository-new features and functionality. Nucleic Acids Res. 2017;45:D313–D319. 10.1093/nar/gkw1132 [DOI] [PMC free article] [PubMed] [Google Scholar]
- 50. Guex N, Peitsch MC, Schwede T. Automated comparative protein structure modeling with SWISS-MODEL and Swiss-PdbViewer: a historical perspective. Electrophoresis. 2009;30 Suppl 1:S162–S173. 10.1002/elps.200900140 [DOI] [PubMed] [Google Scholar]
- 51. Studer G et al. QMEANDisCo-distance constraints applied on model quality estimation. Bioinformatics. 2020;36:1765–1771. 10.1093/bioinformatics/btz828 [DOI] [PMC free article] [PubMed] [Google Scholar]
- 52. Bertoni M, Kiefer F, Biasini M, Bordoli L, Schwede T. Modeling protein quaternary structure of homo- and hetero-oligomers beyond binary interactions by homology. Sci Rep. 2017;7:10480. 10.1038/s41598-017-09654-8 [DOI] [PMC free article] [PubMed] [Google Scholar]
- 53. Berman HM et al. The Protein Data Bank. Nucleic Acids Res. 2000;28:235–242. 10.1093/nar/28.1.235 [DOI] [PMC free article] [PubMed] [Google Scholar]
- 54. Burley SK et al. RCSB Protein Data Bank (RCSB.org): delivery of experimentally-determined PDB structures alongside one million computed structure models of proteins from artificial intelligence/machine learning. Nucleic Acids Res. 2023;51:D488–D508. 10.1093/nar/gkac1077 [DOI] [PMC free article] [PubMed] [Google Scholar]
- 55. Ellulu MS, Patimah I, Khaza'ai H, Rahmat A, Abed Y. Obesity and inflammation: the linking mechanism and the complications. Arch Med Sci. 2017;13:851–863. 10.5114/aoms.2016.58928 [DOI] [PMC free article] [PubMed] [Google Scholar]
- 56. Khanna D, Khanna S, Khanna P, Kahar P, Patel BM. Obesity: a chronic low-grade inflammation and its markers. Cureus. 2022;14:e22711. 10.7759/cureus.22711 [DOI] [PMC free article] [PubMed] [Google Scholar]
- 57. Koda T, Sasaki A, Matsushima S, Kakinuma M. A transforming gene, hst, found in NIH 3T3 cells transformed with DNA from three stomach cancers and a colon cancer. Jpn J Cancer Res. 1987;78:325–328. [PubMed] [Google Scholar]
- 58. Long EO. ICAM-1: getting a grip on leukocyte adhesion. J Immunol. 2011;186:5021–5023. 10.4049/jimmunol.1100646 [DOI] [PMC free article] [PubMed] [Google Scholar]
- 59. Lawson C, Wolf S. ICAM-1 signaling in endothelial cells. Pharmacol Rep. 2009;61:22–32. 10.1016/s1734-1140(09)70004-0 [DOI] [PubMed] [Google Scholar]
- 60. Staunton DE et al. A cell adhesion molecule, ICAM-1, is the major surface receptor for rhinoviruses. Cell. 1989;56:849–853. 10.1016/0092-8674(89)90689-2 [DOI] [PubMed] [Google Scholar]
- 61. Shukla SD et al. Targeting intercellular adhesion molecule-1 (ICAM-1) to reduce rhinovirus-induced acute exacerbations in chronic respiratory diseases. Inflammopharmacology. 2022;30:725–735. 10.1007/s10787-022-00968-2 [DOI] [PMC free article] [PubMed] [Google Scholar]
- 62. Popkin-Hall ZR et al. Prevalence of non-falciparum malaria infections among asymptomatic individuals in four regions of Mainland Tanzania. Parasit Vectors. 2024;17:153. 10.1186/s13071-024-06242-4 [DOI] [PMC free article] [PubMed] [Google Scholar]
- 63. Fikadu M, Ashenafi E. Malaria: an overview. Infect Drug Resist. 2023;16:3339–3347. 10.2147/IDR.S405668 [DOI] [PMC free article] [PubMed] [Google Scholar]
- 64. Severe malaria. Trop Med Int Health. 2014;19 Suppl 1:7–131. 10.1111/tmi.12313_2 [DOI] [PubMed] [Google Scholar]
- 65. Smith JD. The role of PfEMP1 adhesion domain classification in Plasmodium falciparum pathogenesis research. Mol Biochem Parasitol. 2014;195:82–87. 10.1016/j.molbiopara.2014.07.006 [DOI] [PMC free article] [PubMed] [Google Scholar]
- 66. Beeson JG, Brown GV. Pathogenesis of Plasmodium falciparum malaria: the roles of parasite adhesion and antigenic variation. Cell Mol Life Sci. 2002;59:258–271. 10.1007/s00018-002-8421-y [DOI] [PMC free article] [PubMed] [Google Scholar]
- 67. Xing L, Casasnovas JM, Cheng RH. Structural analysis of human rhinovirus complexed with ICAM-1 reveals the dynamics of receptor-mediated virus uncoating. J Virol. 2003;77:6101–6107. 10.1128/jvi.77.11.6101-6107.2003 [DOI] [PMC free article] [PubMed] [Google Scholar]
- 68. Ledford RM et al. VP1 sequencing of all human rhinovirus serotypes: insights into genus phylogeny and susceptibility to antiviral capsid-binding compounds. J Virol. 2004;78:3663–3674. 10.1128/jvi.78.7.3663-3674.2004 [DOI] [PMC free article] [PubMed] [Google Scholar]
- 69. Siber GR, Schur PH, Aisenberg AC, Weitzman SA, Schiffman G. Correlation between serum IgG-2 concentrations and the antibody response to bacterial polysaccharide antigens. N Engl J Med. 1980;303:178–182. 10.1056/NEJM198007243030402 [DOI] [PubMed] [Google Scholar]
- 70. Scott DW, Patel RP. Endothelial heterogeneity and adhesion molecules N-glycosylation: implications in leukocyte trafficking in inflammation. Glycobiology. 2013;23:622–633. 10.1093/glycob/cwt014 [DOI] [PubMed] [Google Scholar]
- 71. Maley F, Trimble RB, Tarentino AL, Plummer TH Jr. Characterization of glycoproteins and their associated oligosaccharides through the use of endoglycosidases. Anal Biochem. 1989;180:195–204. 10.1016/0003-2697(89)90115-2 [DOI] [PubMed] [Google Scholar]
- 72. Tretter V, Altmann F, Marz L. Peptide-N4-(N-acetyl-beta-glucosaminyl)asparagine amidase F cannot release glycans with fucose attached alpha 1----3 to the asparagine-linked N-acetylglucosamine residue. Eur J Biochem. 1991;199:647–652. 10.1111/j.1432-1033.1991.tb16166.x [DOI] [PubMed] [Google Scholar]
- 73. Akbari A et al. Role of autoantibodies targeting interferon type 1 in COVID-19 severity: a systematic review and meta-analysis. J Transl Autoimmun. 2023;7:100219. 10.1016/j.jtauto.2023.100219 [DOI] [PMC free article] [PubMed] [Google Scholar]
- 74. Wang X et al. Autoantibodies against type I interferons in COVID-19 infection: a systematic review and meta-analysis. Int J Infect Dis. 2023;130:147–152. 10.1016/j.ijid.2023.03.011 [DOI] [PMC free article] [PubMed] [Google Scholar]
- 75. Nowak K, Gumkowska-Sroka O, Kotyla P. Adhesion molecules: a way to understand lupus. Reumatologia. 2022;60:133–141. 10.5114/reum.2022.115664 [DOI] [PMC free article] [PubMed] [Google Scholar]
- 76. Schmal H et al. Soluble ICAM-1 activates lung macrophages and enhances lung injury. J Immunol. 1998;161:3685–3693. [PubMed] [Google Scholar]
- 77. Damelang T et al. The influence of human IgG subclass and allotype on complement activation. J Immunol. 2023;211:1725–1735. 10.4049/jimmunol.2300307 [DOI] [PMC free article] [PubMed] [Google Scholar]
- 78. Vidarsson G, Dekkers G, Rispens T. IgG subclasses and allotypes: from structure to effector functions. Front Immunol. 2014;5:520. 10.3389/fimmu.2014.00520 [DOI] [PMC free article] [PubMed] [Google Scholar]
- 79. Vuorte J et al. Anti-ICAM-1 monoclonal antibody R6.5 (Enlimomab) promotes activation of neutrophils in whole blood. J Immunol. 1999;162:2353–2357. [PubMed] [Google Scholar]
- 80. Berkowska MA et al. Human memory B cells originate from three distinct germinal center-dependent and -independent maturation pathways. Blood. 2011;118:2150–2158. 10.1182/blood-2011-04-345579 [DOI] [PMC free article] [PubMed] [Google Scholar]
- 81. Arthur JM et al. Development of ACE2 autoantibodies after SARS-CoV-2 infection. PLoS One. 2021;16:e0257016. 10.1371/journal.pone.0257016 [DOI] [PMC free article] [PubMed] [Google Scholar]
- 82. Chang SE et al. New-onset IgG autoantibodies in hospitalized patients with COVID-19. Nat Commun. 2021;12:5417. 10.1038/s41467-021-25509-3 [DOI] [PMC free article] [PubMed] [Google Scholar]
- 83. Casciola-Rosen L et al. IgM anti-ACE2 autoantibodies in severe COVID-19 activate complement and perturb vascular endothelial function. JCI Insight. 2022;7:e158362. 10.1172/jci.insight.158362 [DOI] [PMC free article] [PubMed] [Google Scholar]
- 84. Angum F, Khan T, Kaler J, Siddiqui L, Hussain A. The prevalence of autoimmune disorders in women: a narrative review. Cureus. 2020;12:e8094. 10.7759/cureus.8094 [DOI] [PMC free article] [PubMed] [Google Scholar]
- 85. Ngo ST, Steyn FJ, McCombe PA. Gender differences in autoimmune disease. Front Neuroendocrinol. 2014;35:347–369. 10.1016/j.yfrne.2014.04.004 [DOI] [PubMed] [Google Scholar]
- 86. Edwards M, Dai R, Ahmed SA. Our environment shapes us: the importance of environment and sex differences in regulation of autoantibody production. Front Immunol. 2018;9:478. 10.3389/fimmu.2018.00478 [DOI] [PMC free article] [PubMed] [Google Scholar]
Associated Data
This section collects any data citations, data availability statements, or supplementary materials included in this article.
Supplementary Materials
Data Availability Statement
The data that support the findings of this study are available from the corresponding author, T.B., upon reasonable request.